
In Silico Prediction of Cytochrome P450-Drug Interaction: QSARs for CYP3A4 and CYP2C9


Abstract
:
1. Introduction
2. Results and Discussion
2.1. Modelling Approach
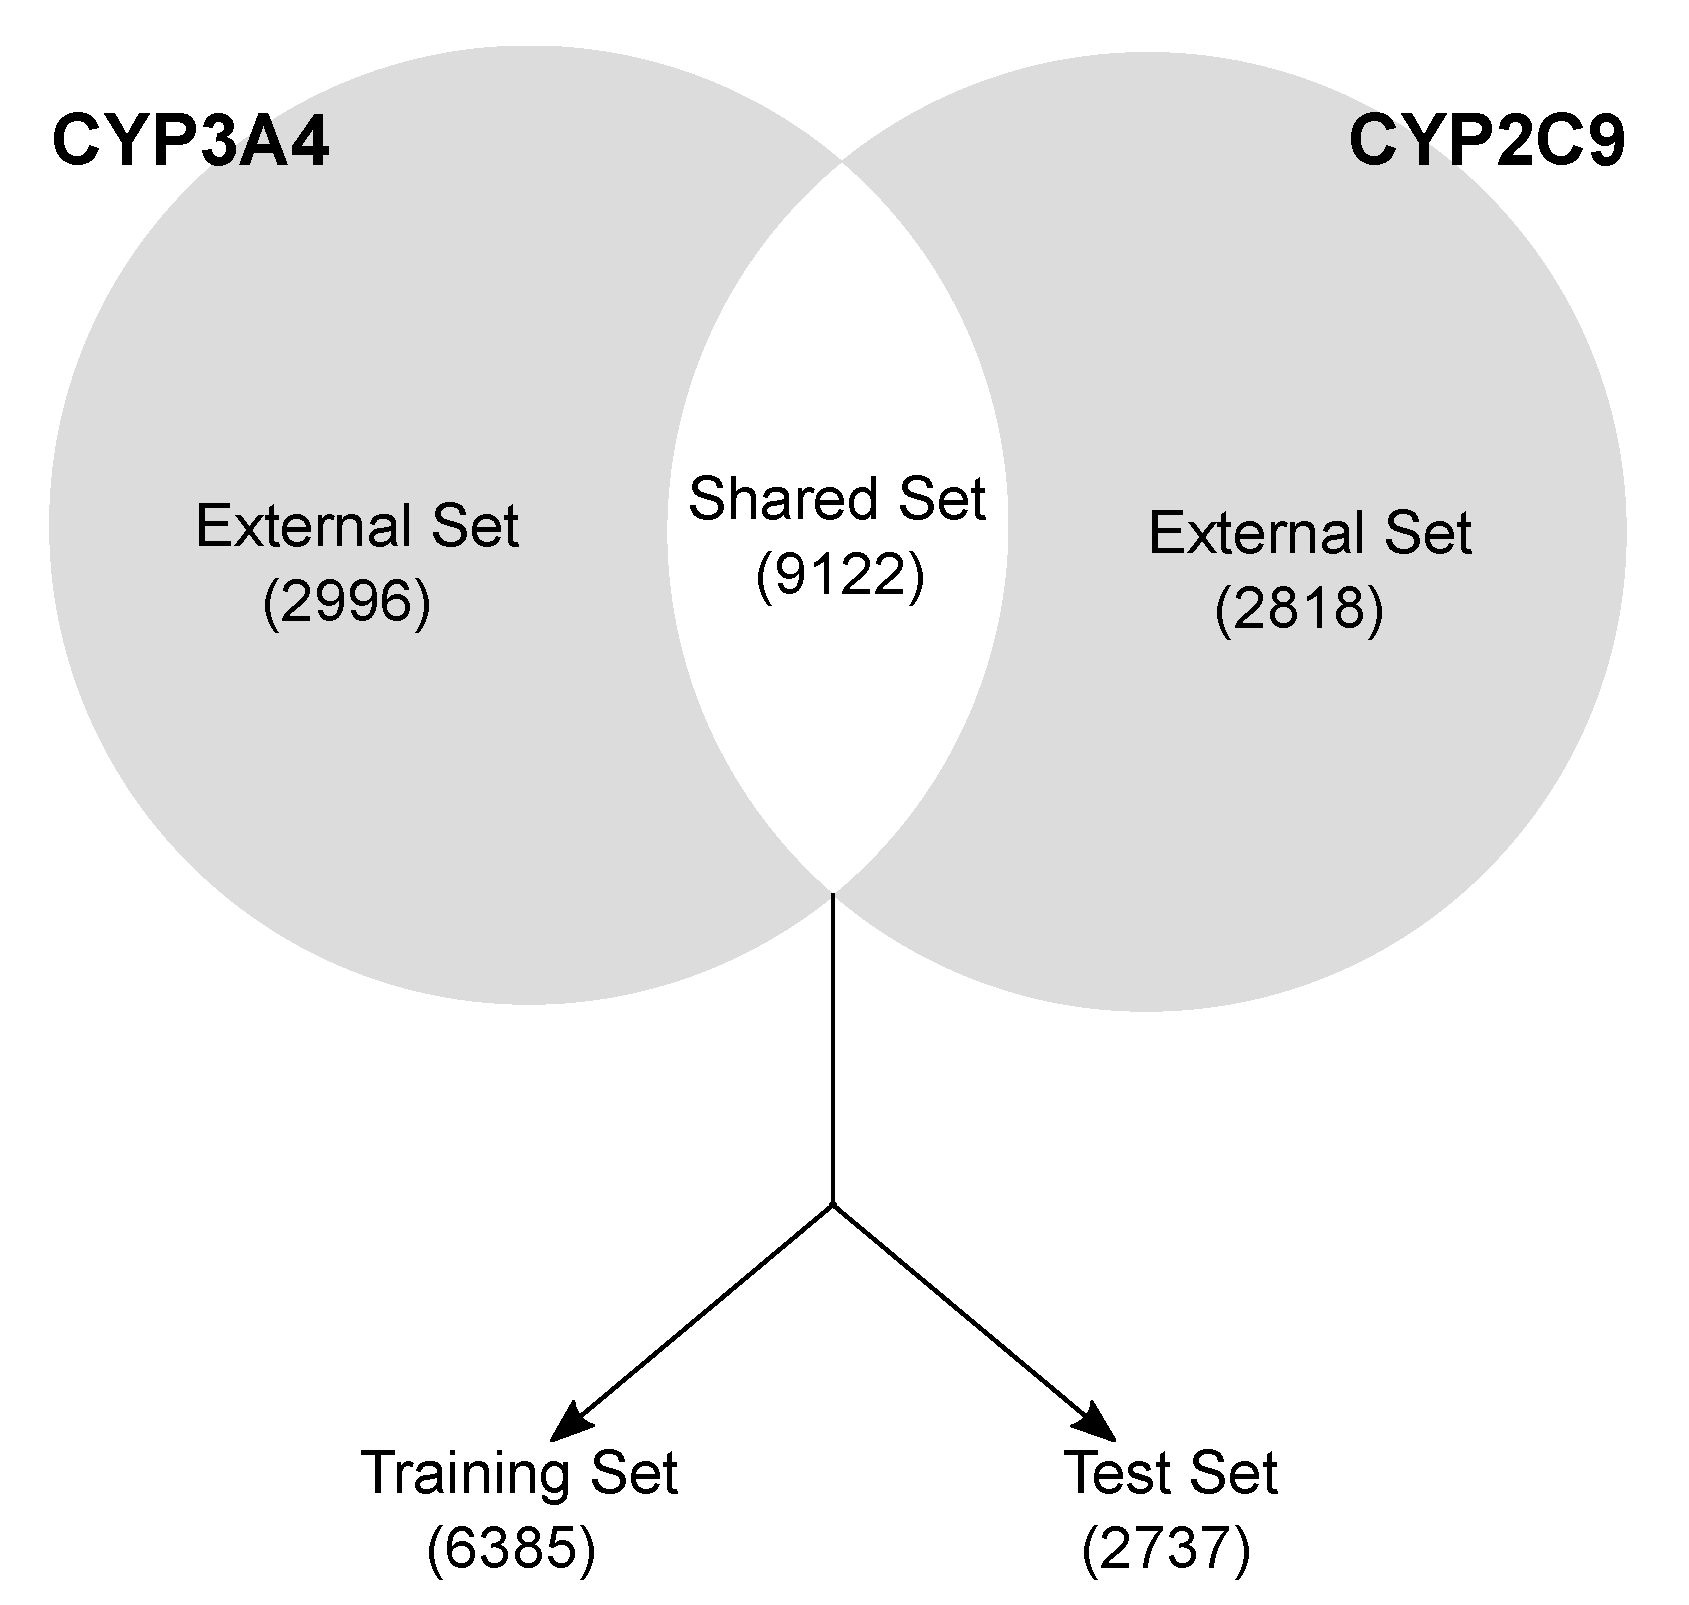
- Data curation and splitting. CYP3A4 and CYP2C9 isoforms were curated separately by removing mismatching duplicates, inconsistent records and disconnected structures. The molecules were divided in (a) a Shared set, comprising the 9122 compounds with annotated activity for both the isoforms (Figure 1) and (b) an External set, having activity data for one isoform molecules (2996 and 2818 for CYP3A4 and CYP2C9, respectively). The Shared set molecules were randomly split into a training (70%, 6385 compounds) and a test set (30%, 2737 compounds), keeping the active/inactive proportion of both the isoforms (49:100 and 66:100 for 2C9 and 3A4, respectively). The training set served to select the variables, calibrate the models and perform the cross-validation (five-fold). The test set was used only in a later stage to validate the final pool of selected models. The external sets were used in the final stage to further validate the best models.
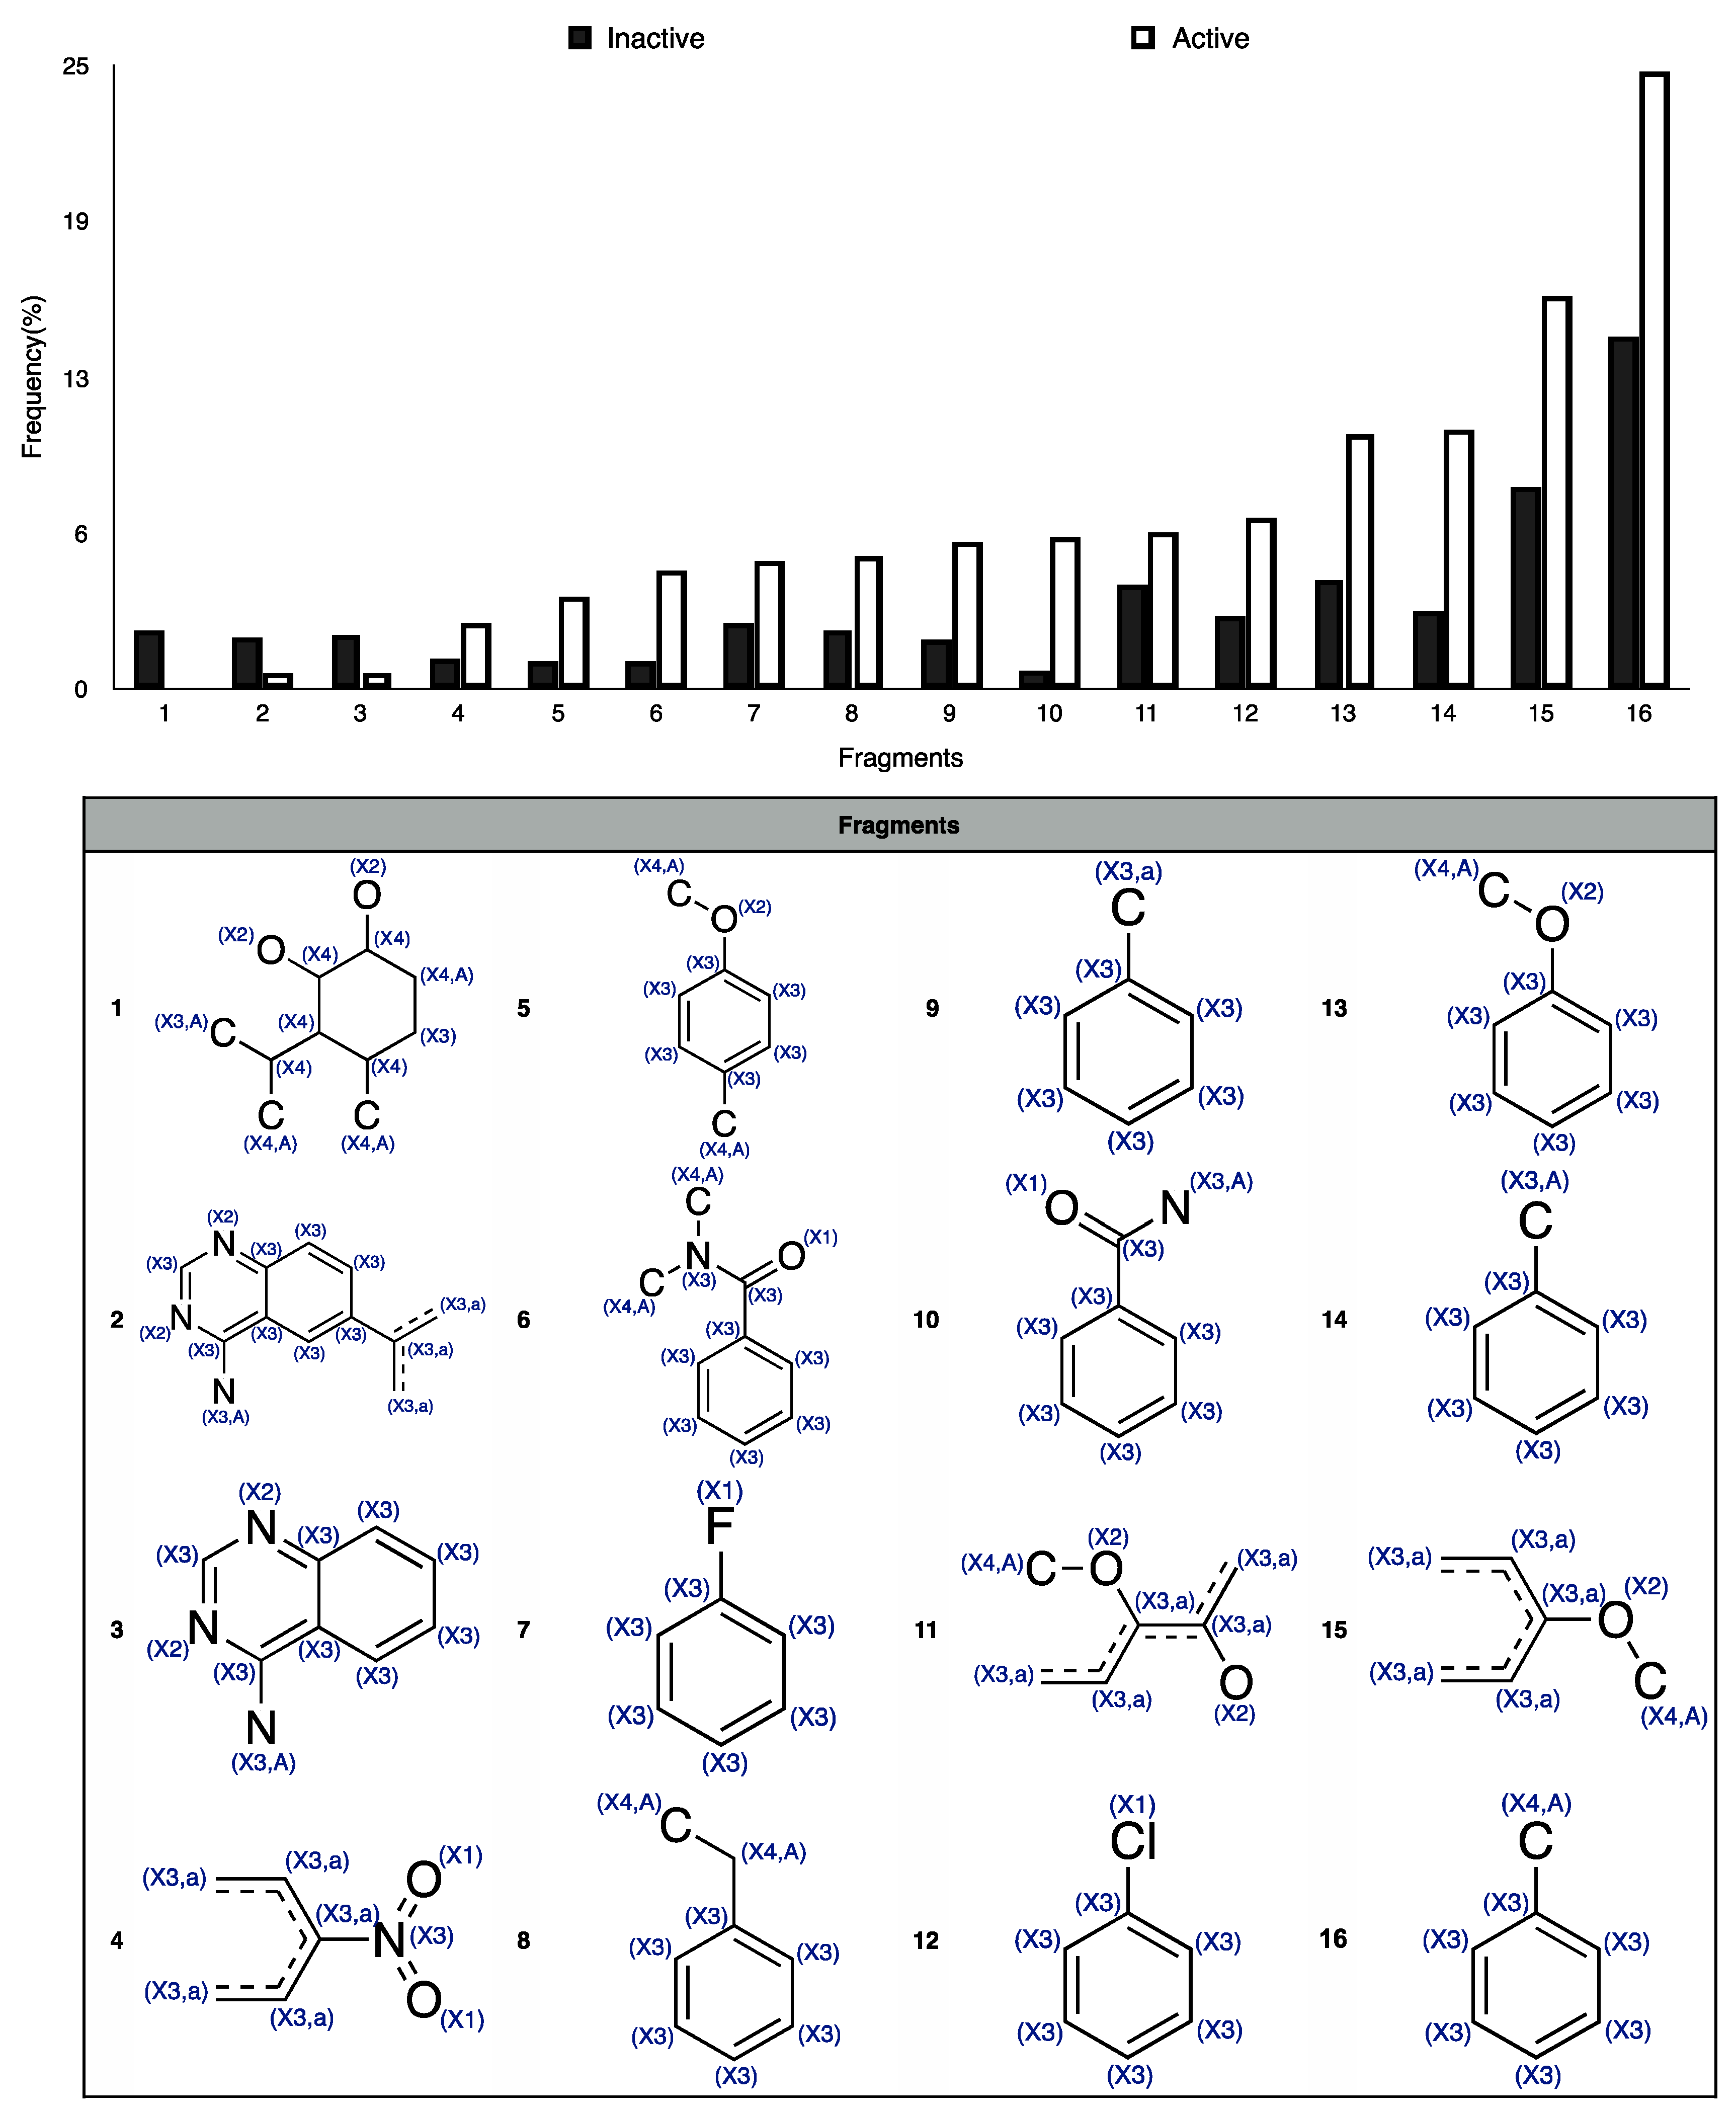
- Molecular description. To allow for the mathematical treatment of molecules, they were described using the so-called molecular descriptors [10], that is, numbers encoding for the presence of particular structural features, fragments or chemical properties. Two types of descriptors were calculated: (a) 3763 classical Dragon 6 [20] molecular descriptors (MDs) from 0-dimensional to 2-dimensional molecular representation, from which only a set of 1472 non redundant MDs was finally retained (see Materials and Methods); and (b) two types of binary fingerprints (FPs), that is, the extended connectivity (ECFP) [21] and the path fingerprints (PFP) [22], which are 1024 bit strings encoding the presence of particular fragments/substructures of molecules. Three-dimensional descriptors were not considered, as in a preliminary phase they did not lead to an improvement in the predictions.
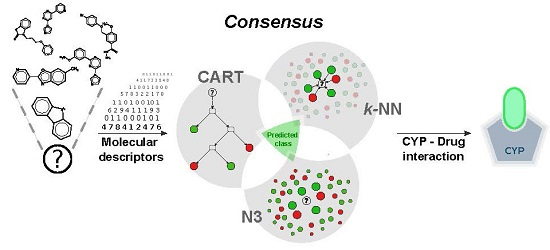
- Variable selection and modelling. The Genetic Algorithms (GA) [23], a benchmark variable selection method characterized by an optimal trade-off between computational time and exploration/exploitation ability [24], were used to retain the most relevant subsets of variables. A refined two-step GA procedure (see Materials and Methods) was applied on the training set descriptors in combination with six classification techniques: (a) Classification and Regression Trees (CART) [25]; (b) k-Nearest Neighbor (k-NN) [26]; (c) N-Nearest Neighbors (N3) [27]; (d) Binned Nearest Neighbors (BNN) [27]; (e) Linear Discriminant Analysis (LDA) [28]; and (f) Partial Least Squares Analysis (PLSDA) [29]. Note that for FPs, no variable selection was performed, as they, unlike MDs, give a description of the molecule when used as a whole. To model FPs, only similarity-based classifiers (k-NN, N3 and BNN) were used. On both the isoforms, the best results were obtained using: (1) CART [25], based on binary splits of the data using one variable at time according to its optimized threshold values; (2) k-NN [26], in which every molecule is classified according to the majority vote of its k more similar objects [14]; and (3) N3 [27], which uses all the available molecules as neighbors and, through an optimized α exponent, tunes their contribution as decreasing with decreasing their similarity to the new object. The model parameters (number of objects per leaf, k and α) were optimized in cross-validation as those giving the best classification performance.
- Model selection and validation. From the pool of calculated models, the final models were chosen as the best compromise between classification performance in five-fold cross-validation (the higher the better) and number of variables (the smaller the better). Models with interpretable descriptors, if relevant, were preferred.
- Applicability Domain Assessment. The selected models were evaluated for their chemical space of prediction reliability (Applicability Domain, AD). The AD assessment strongly depends on the nature of the modelling approach and the characteristics of the dataset [30], thus, it was calibrated it on a case-by-case basis, and rationalized according to the modeling approach (see Materials and Methods).
- External validation. Models were selected according to the cross-validation results and the best models were screened on their performance on the test set. Finally, for each isoform, the external set molecules were used in order to test their robustness and predictivity towards real unknown data.
2.2. Quantitative Structure-Activity Relationship (QSAR) Models
2.2.1. Isoform 3A4
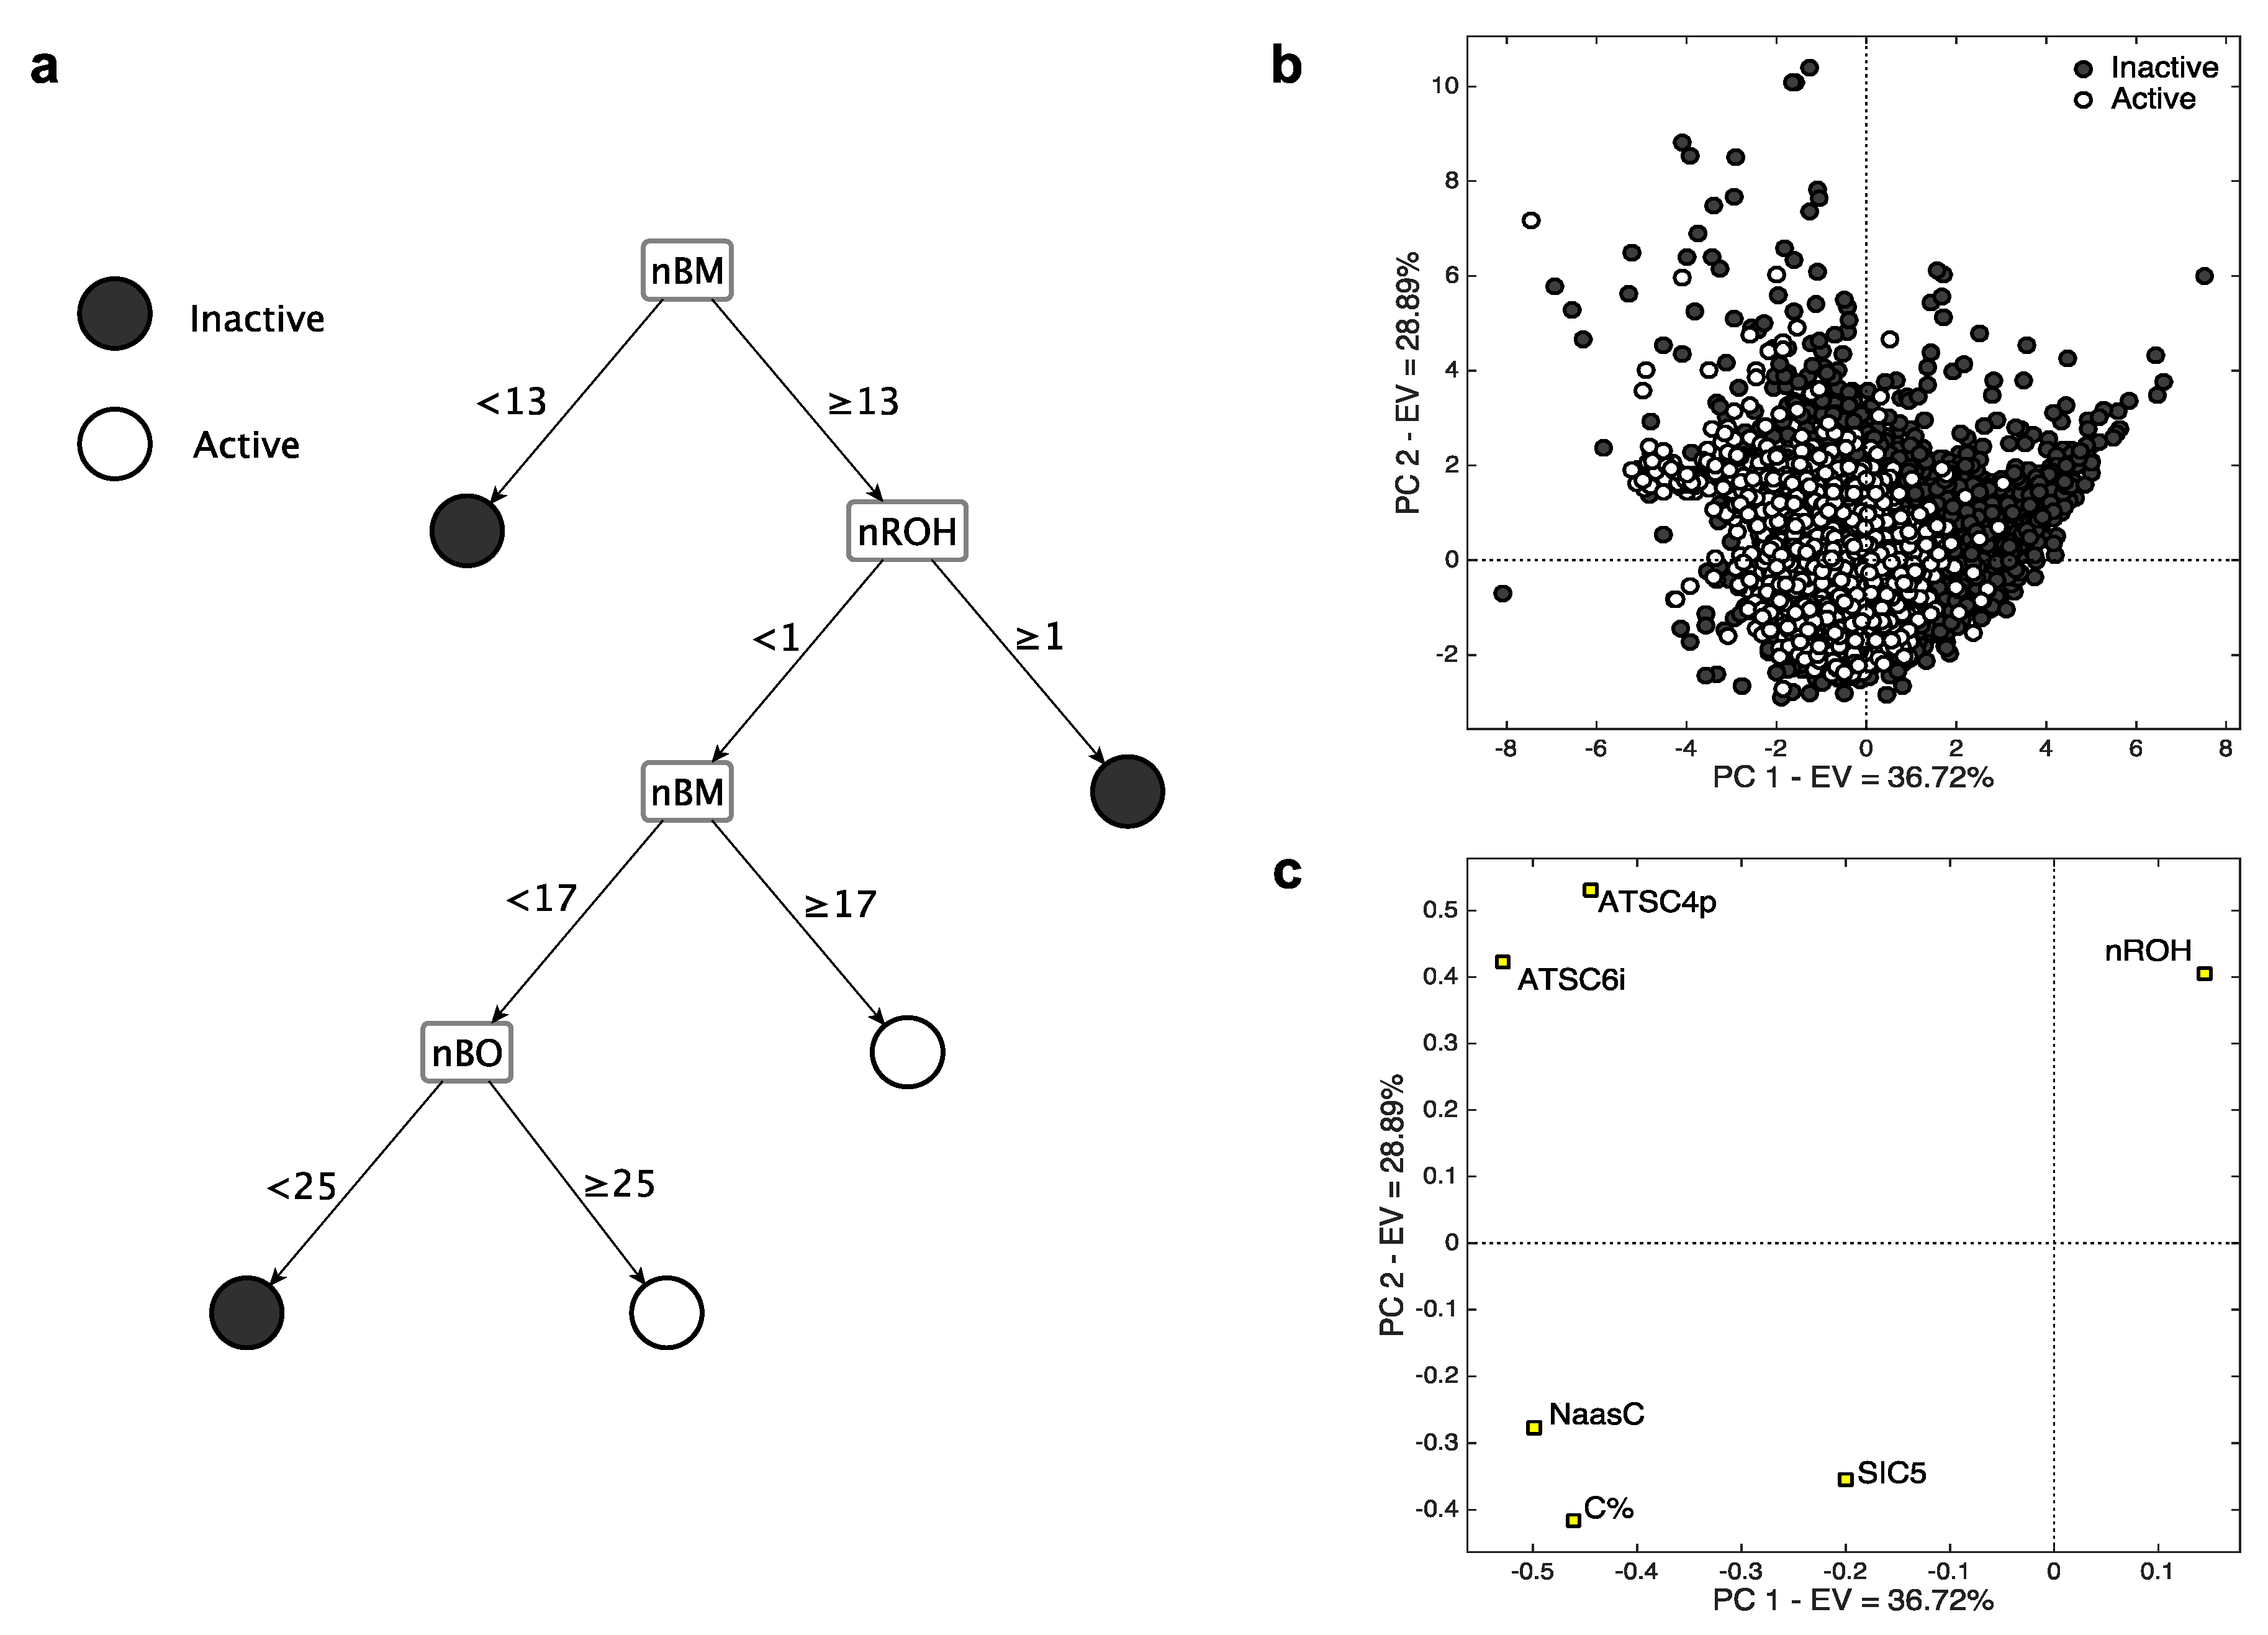
- The descriptor nROH represents the number of hydroxyl groups. It was independently selected in both the models based on MDs, underscoring its relevance in modelling the CYP3A4 activity. In particular, in both cases (Figure 2), high nROH values tend to correspond to inactive molecules. An increasing number of hydroxyl group generally increases the hydrophilicity, while molecules with no (or a few of) hydroxyl groups have a lipophilic nature. Molecular lipophilicity is known to facilitate the adsorption and to limit the excretion of the compounds. As a result, lipophilic molecules are oxidated by CYP and converted into more hydrophilic compounds that can be easily eliminated [32].
- nBM and nBO are the number of multiple bonds and bonds in the H-depleted molecular structure, respectively, which were selected within the CART model (Figure 2c). The descriptor nBM represents a measure of the unsaturation level and, therefore, gives information about the molecular interaction ability with CYP. In addition, this descriptor contains information about molecular size, flexibility, presence of heteroatoms (Table 2). In particular, small and flexible molecules with a few of the multiple bonds (nBM < 13, Figure 2c) tend to be inactive. The relevance of heteroatoms can be related to the P450-mediated oxygen addition to nitrogen, sulfur, phosphorus, and iodine atoms [33,34,35,36].
- The descriptor nBO mainly encodes the information about molecular size. Molecules with no hydroxyl groups, less than 16 multiple bonds and with less than 25 non-hydrogen bonds tend to be inactive. These molecules probably have a small effective dimension within the receptor pocket, as they are either small or relatively small, but very flexible. In this branch also lie some hydrophilic compounds classified as inactive. They probably do not interact with CYP as they are easily dissolved in the aqueous body fluid and, consequently, are excreted from the body [37].
- C% and NaasC are the percentage of C atoms and number of aromatic carbons bonded with non-H atoms, respectively (Table 2). They have a crucial role in identifying the active compounds of k-NN, as shown by their very high loadings on PC1. This means that relative large and/or aromatic molecules are generally classified as actives. The mechanisms of aromatic oxidation have been already elucidated [36,38].
- SIC5 is the structural information content of order 5 [39]. It encodes information about atom equivalence and represents a general measure of structural complexity, the higher, the larger SIC5. It has negative PC1/PC2 loadings, suggesting that relatively large, branched and/or polycyclic compounds tend to be active. The effect of dimension on activity was already suggested (e.g., [40]), as well-known CYP3A4 ligands are commonly relatively large molecules.
- ATSC4p and ATSC6i are the Centred Broto-Moreau autocorrelations [10] of lag 4 and 6, respectively. The former is weighed on the atomic polarizability, while the latter on the atomic ionization potential. They lie very close to each other in the PC space and have positive loadings on PC2, indicating that inactive compounds tend to have high values of both these MDs. They increase when increasing the molecular dimension, the number of heteroatoms and the branching/cyclicity. Because of their weighting scheme type, ATSC4p and ATSC6i increase when increasing the atomic polarizability and the ionization potential, respectively. These features are known for their relevant contribution in receptor binding, especially when charged systems are taken into consideration [41,42].
2.2.2. Isoform 2C9
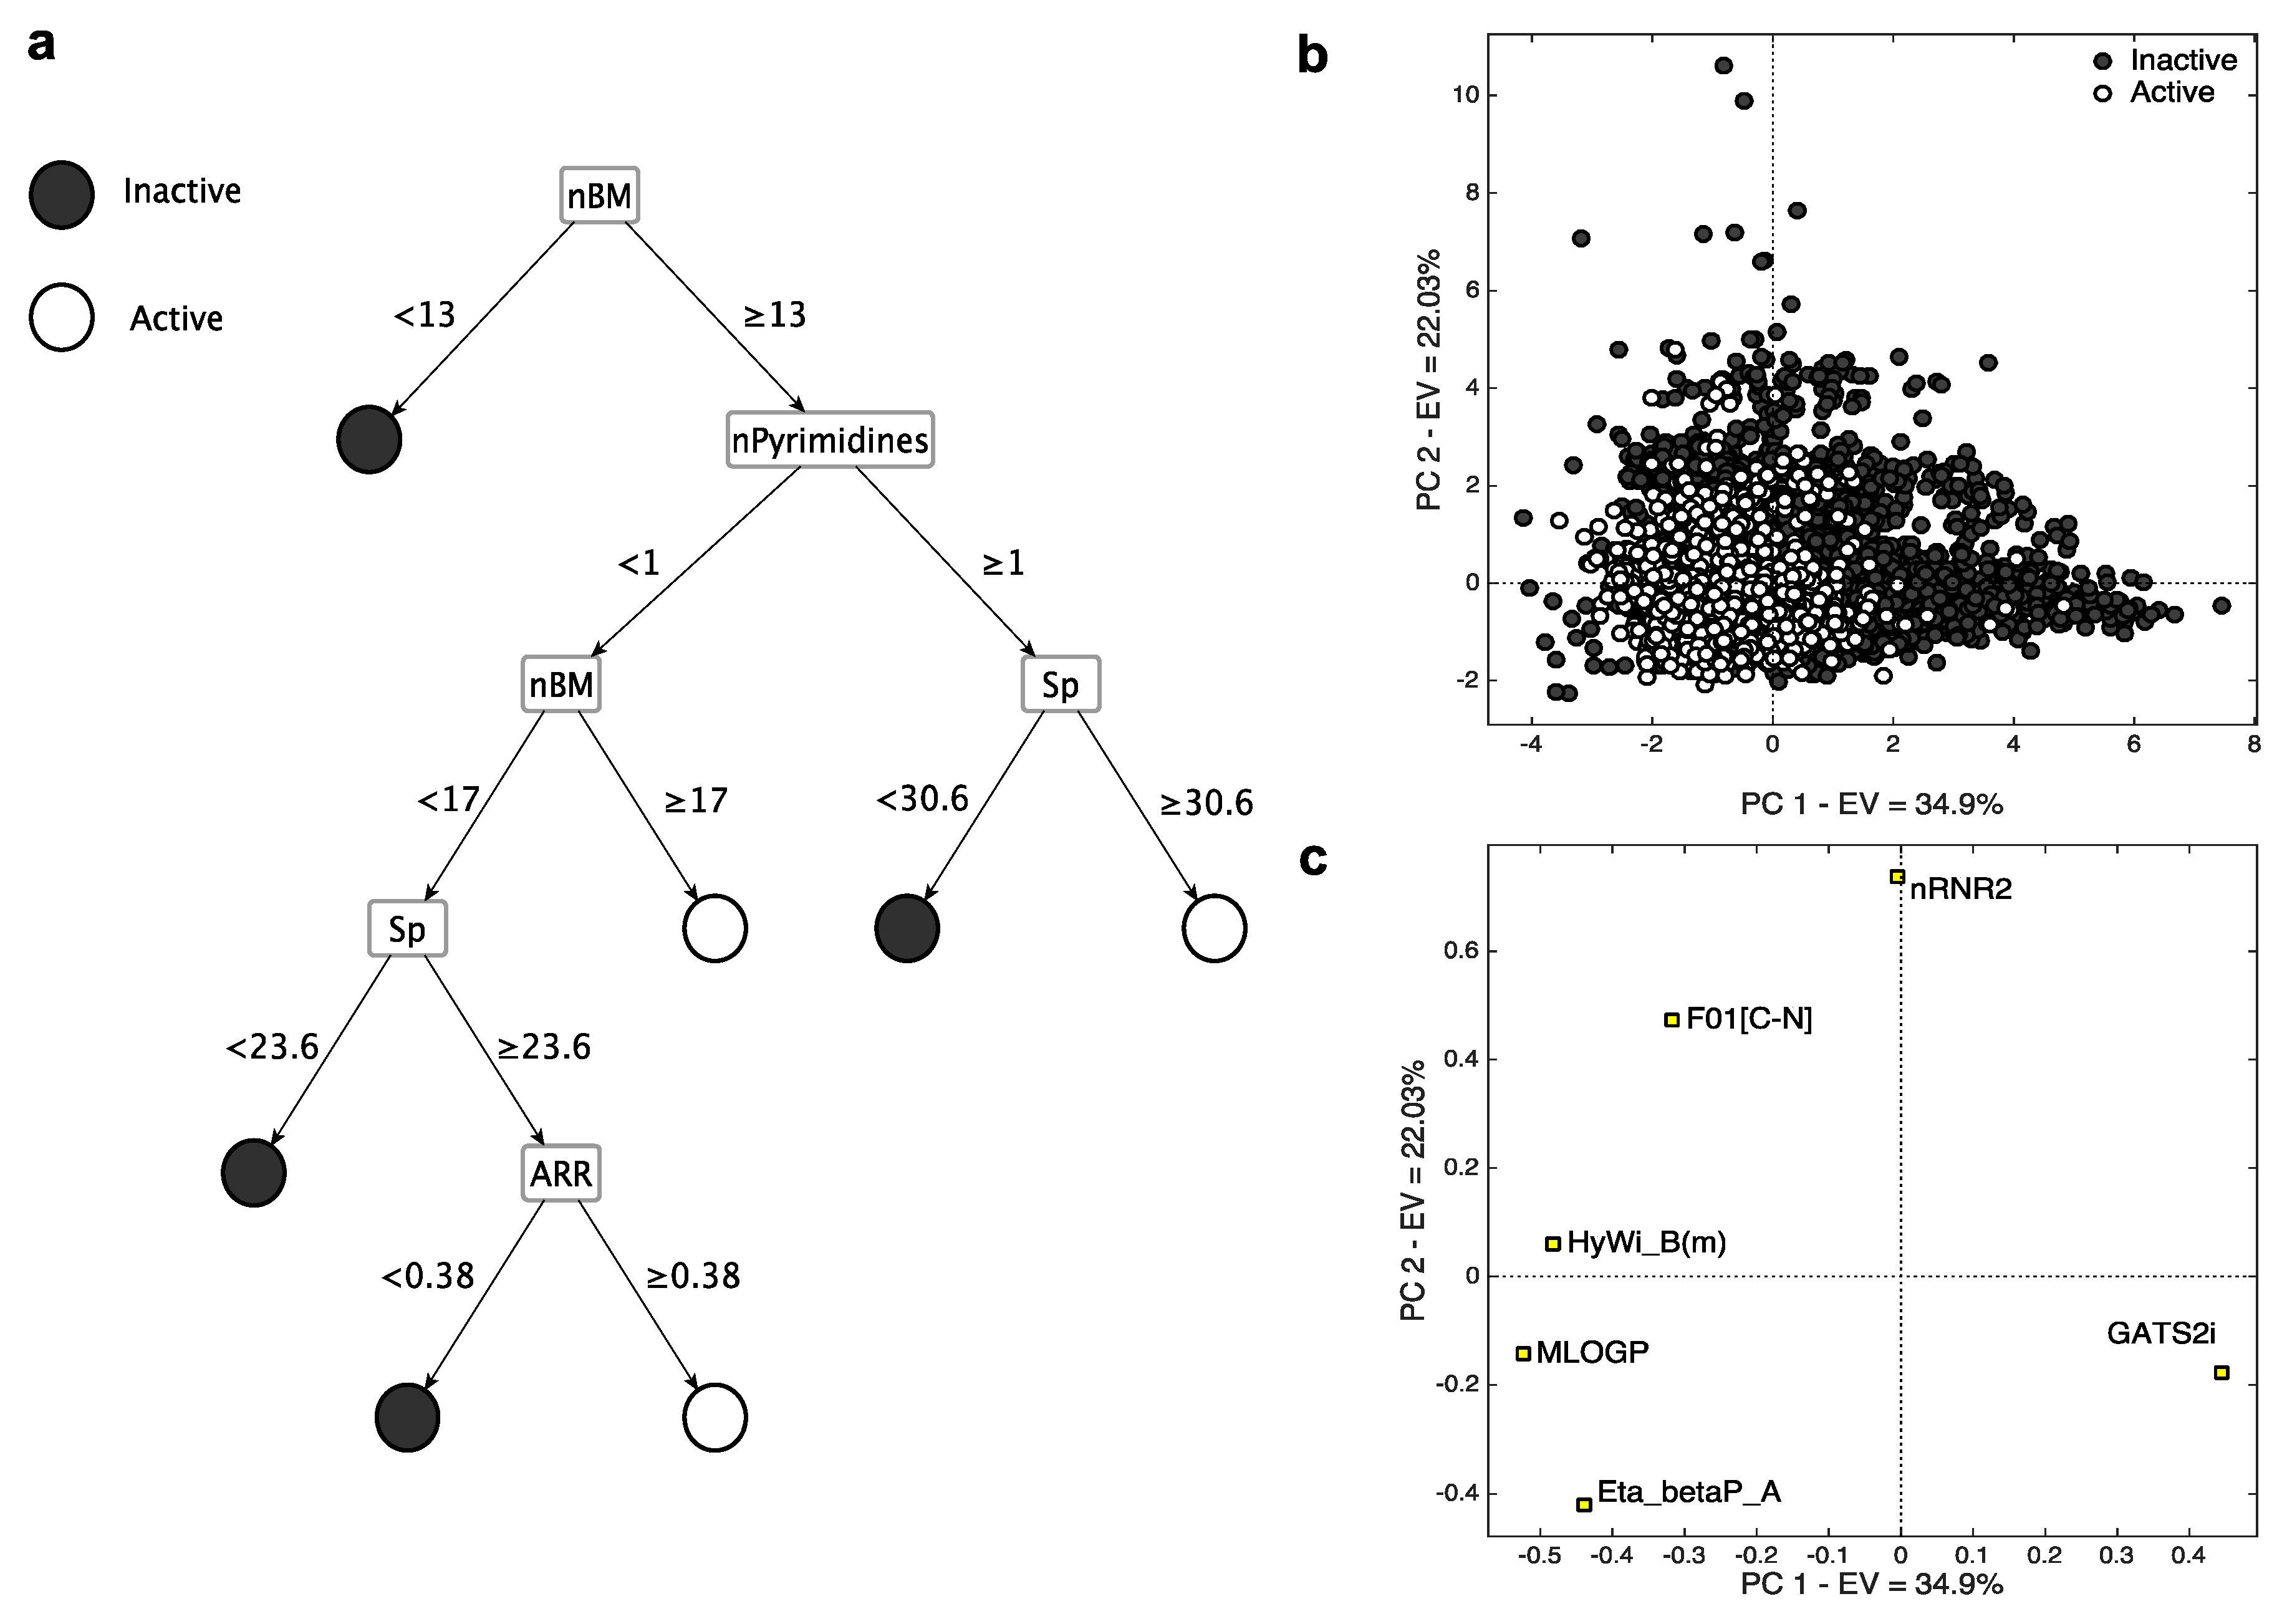
- nBM (number of multiple bonds) resulted to be relevant also for this isoform. As for the 3A4 CART model, small flexible molecules with a few number of multiple bonds (nBM < 13, Figure 4c) are classified as inactive, while those with a high number of multiple bonds (nBM > 17, Figure 4c) are classified as active.
- ARR represents the aromatic ratio, that is, the ratio between the number of aromatic bonds and bonds in the H-depleted molecular structure. Molecules without pyrimidine rings but with an aromatic character (ARR ≥ 0.38) and high atomic polarizability value (Sp ≥ 23.6) are active. The presence of two MDs related to aromaticity (i.e., ARR and nPyrimidines) suggests that this feature is fundamental for CYP2C9-drug interaction, in agreement with previous studies (e.g., [40]).
- GATS2i is the Geary autocorrelation of lag 2 weighted by the ionization potential [10]. It plays a crucial role in identifying the inactive compounds for the k-NN model, as denoted by its (high) positive loading on PC1. The inactive compounds, distributed on the right side of the score plot, are characterized by low values of this MD and have, therefore, low ionization potential. When increasing the ionization potential, the number of active compounds increases.
- nRNR2 counts the number of aliphatic tertiary amines. It has high PC2 loading, meaning that it tends to be higher for inactive compounds. Tertiary aliphatic amines are, in fact, generally oxidized by Flavin monooxygenase [48] and are inactive on CYP.
- F01[C–N], represents the frequency of bonded C and N atoms. It has a positive loading on PC2 and, in analogy with nRNR2, tends to be higher for inactive compounds, meaning that a high number of C-N could limit the interaction with the CYP2C9 isoform. In addition to the information overlap with nRNR2, F01[C–N] also takes into account the information about the presence of primary/secondary amines and of amides.
- Eta_betaP_A, is the average measure of π bonds and lone pairs of non-H atoms [49]. It has the lowest loading on PC2 and it increases when increasing the number of multiple bonds and lone pairs. Molecules with a high value of Eta_betaP_A tend to be active, confirming the previous considerations, that is, the higher the unsaturation, the higher the probability of activity towards CYP.
- MLOGP is the Moriguchi octanol-water partition coefficient [50]. Drug lipophilicity is known for playing a crucial role in the CYP binding affinity [51], and a significant correlation was reported between the P450 binding affinity and the compound lipophilicity [51,52,53,54]. As noted from the PCA, the compounds with high MLOGP value are active.
- HyWi_B(m) is the hyper-Wiener-like index weighted by mass [10]. It contains information about molecular size, branching, cyclicity and presence of heavy atoms. HyWi_B(m) tends to be higher for relatively large and polycyclic compounds, in analogy with the 3A4 isoform. As this descriptor captures several types of chemical information and its contribution is not easily detectable from the PCA, it needs further investigation.
2.3. Consensus Modelling
- Consensus 1: a molecule was classified if and only if the following conditions were met: (1) all the model predictions agreed in its predicted class; (2) the molecule was inside the AD of all of the models.
- Consensus 2: is based on the majority vote approach, i.e., the compound is classified according to the most frequently predicted class. In this case, the AD of the models used for the prediction was considered.
2.4. External Validation
3. Materials and Methods
3.1. Data Curation
- Shared set (9122 molecules), comprising the molecule available for both the isoforms. It served to calibrate, validate and choose the optimal model(s) for each isoform.
- External sets (2996 and 2818 molecules for CYP3A4 and CYP2C9, respectively). These datasets comprise the molecules with annotated activity values for one isoform only. They were used as an external validation tool to further evaluate the model predictivity on unknown molecules.
3.2. Molecular Descriptors
- Classical molecular descriptors (MDs) were calculated using Dragon 6 [20]. From the obtained 3763 MDs, we filtered out those that: (a) were constant or near-constant; (b) had at least one missing value; (c) had a pairwise correlation larger than 0.95. Eventually, 1472 descriptors were retained.
- Two types of binary fingerprints (FPs) were calculated, namely: (1) extended connectivity (ECFP) [21], circular/topological FPs that encode for several molecular features including stereochemical information; and (2) path connectivity (PFP) [64] based on the presence of particular molecular fragments without accounting for the stereochemical information. A total of 1024 bit FPs were calculated using Dragon 7 [22]. The detailed settings can be found in the Supplementary Material. PFP were considered in the preliminary phase, but their results were not reported as they were outperformed by ECFP.
3.3. Variable Selection
3.4. Applicability Domain (AD) Assessment
- As CART is based on univariate splits of data, a “bounding box” approach was applied, by excluding the molecules with descriptor values outside the training set ranges (reported as Supplementary Material) [58].
- For k-NN, every compound too far from its k neighbors was considered out of the AD, using the approach proposed by Sahigara et al. [67]. The same distance metric of the best k-NN models (Euclidean distance) was used.
- For what concerns N3, as the largest contribute to the classification is given by the closest compound, a query was considered inside the AD if its similarity with its nearest neighbor was larger than or equal to 0.2. The same similarity metric of best models (Jaccard-Tanimoto) was used.
3.5. Software and Code
4. Conclusions
Supplementary Materials
Author Contributions
Conflicts of Interest
Abbreviations
| AD | Applicability Domain |
| ADMET | Absorption, Distribution, Metabolism, Excretion and Toxicity |
| CART | Classification and Regression Trees |
| CYP | Cytochrome P450 |
| FP | binary Fingerprints |
| ECFP | Extended Connectivity Fingerprints |
| k-NN | k-Nearest Neighbors |
| MD | classical Molecular Descriptors |
| MF | Molecular Fragment |
| N3 | N-Nearest neighbors |
| NER | Non-Error Rate |
| QSAR | Quantitative Structure-Activity Relationship |
| SMILES | Simplified Molecular Input Line Entry System |
| Sn | Sensitivity |
| Sp | Specificity |
References
- Munro, A.W.; Girvan, H.M.; Mason, A.E.; Dunford, A.J.; McLean, K.J. What makes a P450 tick? Trends Biochem. Sci. 2013, 38, 140–150. [Google Scholar] [CrossRef] [PubMed]
- Yan, Z.; Caldwell, G.W. Metabolism Profiling, and Cytochrome P450 inhibition & induction in drug discovery. Curr. Top. Med. Chem. 2001, 1, 403–425. [Google Scholar] [PubMed]
- Singh, D.; Kashyap, A.; Pandey, R.V.; Saini, K.S. Novel advances in cytochrome P450 research. Drug Discov. Today 2011, 16, 793–799. [Google Scholar] [CrossRef] [PubMed]
- Zanger, U.M.; Schwab, M. Cytochrome P450 enzymes in drug metabolism: Regulation of gene expression, enzyme activities, and impact of genetic variation. Pharmacol. Ther. 2013, 138, 103–141. [Google Scholar] [CrossRef] [PubMed]
- Pb, W. Role of cytochromes P450 in drug metabolism and hepatotoxicity. Semin. Liver Dis. 1990, 10, 235–250. [Google Scholar]
- Gonzalez, F.J.; Gelboin, H.V. Role of human cytochromes P450 in the metabolic activation of chemical carcinogens and toxins. Drug Metab. Rev. 1994, 26, 165–183. [Google Scholar] [CrossRef] [PubMed]
- Gonzalez, F.J. Role of cytochromes P450 in chemical toxicity and oxidative stress: Studies with CYP2E1. Mutat. Res. Mol. Mech. Mutagen. 2005, 569, 101–110. [Google Scholar] [CrossRef] [PubMed]
- Langowski, J.; Long, A. Computer systems for the prediction of xenobiotic metabolism. Adv. Drug Deliv. Rev. 2002, 54, 407–415. [Google Scholar] [CrossRef]
- Kirton, S.B.; Baxter, C.A.; Sutcliffe, M.J. Comparative modelling of cytochromes P450. Adv. Drug Deliv. Rev. 2002, 54, 385–406. [Google Scholar] [CrossRef]
- Todeschini, R.; Consonni, V. Molecular Descriptors for Chemoinformatics; John Wiley & Sons: Hoboken, NJ, USA, 2009; Volume 41. [Google Scholar]
- Li, H.; Sun, J.; Fan, X.; Sui, X.; Zhang, L.; Wang, Y.; He, Z. Considerations and recent advances in QSAR models for cytochrome P450-mediated drug metabolism prediction. J. Comput. Aided Mol. Des. 2008, 22, 843–855. [Google Scholar] [CrossRef] [PubMed]
- Yap, C.W.; Chen, Y.Z. Prediction of Cytochrome P450 3A4, 2D6, and 2C9 inhibitors and substrates by using support vector machines. J. Chem. Inf. Model. 2005, 45, 982–992. [Google Scholar] [CrossRef] [PubMed]
- Rostkowski, M.; Spjuth, O.; Rydberg, P. WhichCyp: Prediction of cytochromes P450 inhibition. Bioinformatics 2013, 29, 2051–2052. [Google Scholar] [CrossRef] [PubMed]
- Pan, X.; Chao, L.; Qu, S.; Huang, S.; Yang, L.; Mei, H. An improved large-scale prediction model of CYP1A2 inhibitors by using combined fragment descriptors. RSC Adv. 2015, 5, 84232–84237. [Google Scholar] [CrossRef]
- Sun, H.; Veith, H.; Xia, M.; Austin, C.P.; Huang, R. Predictive models for cytochrome P450 isozymes based on quantitative high throughput screening data. J. Chem. Inf. Model. 2011, 51, 2474–2481. [Google Scholar] [CrossRef] [PubMed]
- Jensen, B.F.; Vind, C.; Brockhoff, P.B.; Refsgaard, H.H.F. In silico prediction of cytochrome P450 2D6 and 3A4 inhibition using gaussian kernel weighted k-Nearest neighbor and extended connectivity fingerprints, including structural fragment analysis of inhibitors versus noninhibitors. J. Med. Chem. 2007, 50, 501–511. [Google Scholar] [CrossRef] [PubMed]
- Balakin, K.V.; Ekins, S.; Bugrim, A.; Ivanenkov, Y.A.; Korolev, D.; Nikolsky, Y.V.; Skorenko, A.V.; Ivashchenko, A.A.; Savchuk, N.P.; Nikolskaya, T. Kohonen maps for prediction of binding to human cytochrome P450 3A4. Drug Metab. Dispos. 2004, 32, 1183–1189. [Google Scholar] [CrossRef] [PubMed]
- Veith, H.; Southall, N.; Huang, R.; James, T.; Fayne, D.; Artemenko, N.; Shen, M.; Inglese, J.; Austin, C.P.; Lloyd, D.G.; et al. Comprehensive characterization of cytochrome P450 isozyme selectivity across chemical libraries. Nat. Biotechnol. 2009, 27, 1050–1055. [Google Scholar] [CrossRef] [PubMed]
- NCBI The PubChem Project. Available online: http://pubchem.ncbi.nlm.nih.gov/ (accessed on 1 March 2016).
- Talete srl. Dragon (Software for Molecular Descriptor Calculation). Version 6.0. 2012. Available online: http://www.talete.mi.it/(accessed on 8 June 2016). [Google Scholar]
- Rogers, D.; Hahn, M. Extended-connectivity fingerprints. J. Chem. Inf. Model. 2010, 50, 742–754. [Google Scholar] [CrossRef] [PubMed]
- Kode srl. Dragon (Software for Molecular Descriptor Calculation), Version 7.0; Pisa, Italy, 2016.
- Goldberg, D.E.; Holland, J.H. Genetic algorithms and machine learning. Mach. Learn. 1988, 3, 95–99. [Google Scholar] [CrossRef]
- Grisoni, F.; Cassotti, M.; Todeschini, R. Reshaped sequential replacement for variable selection in QSPR: Comparison with other reference methods. J. Chemom. 2014, 28, 249–259. [Google Scholar] [CrossRef]
- Breiman, L.; Friedman, J.; Stone, C.J.; Olshen, R.A. Classification and Regression Trees; CRC Press: Boca Raton, FL, USA, 1984. [Google Scholar]
- Kowalski, B.R.; Bender, C.F. K-Nearest Neighbor Classification Rule (pattern recognition) applied to nuclear magnetic resonance spectral interpretation. Anal. Chem. 1972, 44, 1405–1411. [Google Scholar] [CrossRef]
- Todeschini, R.; Ballabio, D.; Cassotti, M.; Consonni, V. N3 and BNN: Two new similarity based classification methods in comparison with other classifiers. J. Chem. Inf. Model. 2015, 55, 2365–2374. [Google Scholar] [CrossRef] [PubMed]
- McLachlan, G.J. Discriminant Analysis and Statistical Pattern Recognition; Wiley: Hoboken, NJ, USA, 1992. [Google Scholar]
- Ståhle, L.; Wold, S. Partial least squares analysis with cross-validation for the two-class problem: A Monte Carlo study. J. Chemom. 1987, 1, 185–196. [Google Scholar] [CrossRef]
- Sahigara, F.; Mansouri, K.; Ballabio, D.; Mauri, A.; Consonni, V.; Todeschini, R. Comparison of different approaches to define the applicability domain of QSAR models. Molecules 2012, 17, 4791–4810. [Google Scholar] [CrossRef] [PubMed]
- Jolliffe, I. Principal component analysis. In Wiley StatsRef: Statistics Reference Online; John Wiley & Sons, Ltd.: Boca Raton, FL, USA, 2014. [Google Scholar]
- Smith, D.A.; Jones, B.C.; Walker, D.K. Design of drugs involving the concepts and theories of drug metabolism and pharmacokinetics. Med. Res. Rev. 1996, 16, 243–266. [Google Scholar] [CrossRef]
- De Montellano, P.R.O. Cytochrome P450: Structure, Mechanism, and Biochemistry; Springer Science & Business Media: Berlin, Germany; Heidelberg, Germany, 2005. [Google Scholar]
- Guengerich, F.P. Mechanisms of cytochrome P450 substrate oxidation: MiniReview. J. Biochem. Mol. Toxicol. 2007, 21, 163–168. [Google Scholar] [CrossRef] [PubMed]
- Guengerich, F.P. Oxidation of halogenated compounds by cytochrome P-450, peroxidases, and model metalloporphyrins. J. Biol. Chem. 1989, 264, 17198–17205. [Google Scholar]
- Meunier, B.; Visser, S.P.D. Mechanism of oxidation reactions catalyzed by cytochrome P450 enzymes. Chem. Rev. 2004, 104, 3947–3980. [Google Scholar] [CrossRef] [PubMed]
- Mutschler, E.; Derendorf, H. Drug Actions: Basic Principles and Theraputic Aspects; CRC Press: Boca Raton, FL, USA, 1995. [Google Scholar]
- Guroff, G.; Daly, J.W.; Jerina, D.M.; Renson, J.; Witkop, B.; Udenfriend, S. Hydroxylation-induced migration: The NIH shift. Recent experiments reveal an unexpected and general result of enzymatic hydroxylation of aromatic compounds. Science 1967, 157, 1524–1530. [Google Scholar] [CrossRef] [PubMed]
- Magnuson, V.R.; Harriss, D.K.; Basak, S.C. Topological indices based on neighborhood symmetry: Chemical and biological applications. Chem. Appl. Topol. Graph Theory 1983, 178–191. [Google Scholar]
- Raunio, H.; Kuusisto, M.; Juvonen, R.O.; Pentikäinen, O.T. Modeling of interactions between xenobiotics and cytochrome P450 (CYP) enzymes. Front. Pharmacol. 2015, 6. [Google Scholar] [CrossRef] [PubMed]
- Jiao, D.; Golubkov, P.A.; Darden, T.A.; Ren, P. Calculation of protein-ligand binding free energy by using a polarizable potential. Proc. Natl. Acad. Sci. USA 2008, 105, 6290–6295. [Google Scholar] [CrossRef] [PubMed]
- Stauffer, D.A.; Karlin, A. Electrostatic potential of the acetylcholine binding sites in the nicotinic receptor probed by reactions of binding-site cysteines with charged methanethiosulfonates. Biochemistry 1994, 33, 6840–6849. [Google Scholar] [CrossRef] [PubMed]
- Butina, D. Performance of Kier-hall E-state descriptors in quantitative structure activity relationship (QSAR) studies of multifunctional molecules. Molecules 2004, 9, 1004–1009. [Google Scholar] [CrossRef] [PubMed]
- Gunes, A.; Coskun, U.; Boruban, C.; Gunel, N.; Babaoglu, M.O.; Sencan, O.; Bozkurt, A.; Rane, A.; Hassan, M.; Zengil, H.; et al. Inhibitory effect of 5-fluorouracil on cytochrome P450 2C9 activity in cancer patients. Basic Clin. Pharmacol. Toxicol. 2006, 98, 197–200. [Google Scholar] [CrossRef] [PubMed]
- Gilbar, P.J.; Brodribb, T.R. Phenytoin and fluorouracil interaction. Ann. Pharmacother. 2001, 35, 1367–1370. [Google Scholar] [CrossRef] [PubMed]
- Brown, M.C. An adverse interaction between warfarin and 5-fluorouracil: A case report and review of the literature. Chemotherapy 1999, 45, 392–395. [Google Scholar] [CrossRef] [PubMed]
- Stiborová, M.; Bieler, C.A.; Wiessler, M.; Frei, E. The anticancer agent ellipticine on activation by cytochrome P450 forms covalent DNA adducts. Biochem. Pharmacol. 2001, 62, 1675–1684. [Google Scholar] [CrossRef]
- Beedham, C. The role of non-P450 enzymes in drug oxidation. Pharm. World Sci. 1997, 19, 255–263. [Google Scholar] [CrossRef] [PubMed]
- Roy, K.; Saha, A. QSPR with TAU indices: Water solubility of diverse functional acyclic compounds. Intern. Electron. J. Mol. Des. 2003, 2, 475–491. [Google Scholar]
- Moriguchi, I.; Hirono, S.; Liu, Q.; Nakagome, I.; Matsushita, Y. Simple method of calculating octanol/water partition coefficient. Chem. Pharm. Bull. 1992, 40, 127–130. [Google Scholar] [CrossRef]
- Lewis, D.F.V.; Jacobs, M.N.; Dickins, M. Compound lipophilicity for substrate binding to human P450s in drug metabolism. Drug Discov. Today 2004, 9, 530–537. [Google Scholar] [CrossRef]
- Hansch, C.; Zhang, L. Quantitative structure-activity relationships of cytochrome P-450. Drug Metab. Rev. 1993, 25, 1–48. [Google Scholar] [CrossRef] [PubMed]
- Al-Gailany, K.A.S.; Houston, J.B.; Bridges, J.W. The role of substrate lipophilicity in determining type 1 microsomal P450 binding characteristics. Biochem. Pharmacol. 1978, 27, 783–788. [Google Scholar] [CrossRef]
- Ramos-Nino, M.E.; Clifford, M.N.; Adams, M.R. Quantitative structure activity relationship for the effect of benzoic acids, cinnamic acids and benzaldehydes on Listeria monocytogenes. J. Appl. Bacteriol. 1996, 80, 303–310. [Google Scholar] [CrossRef] [PubMed]
- Consonni, V.; Todeschini, R. New spectral indices for molecule description. MATCH 2008, 1, 2. [Google Scholar]
- Geary, R.C. The contiguity ratio and statistical mapping. Inc. Stat. 1954, 5, 115–146. [Google Scholar] [CrossRef]
- Carhart, R.E.; Smith, D.H.; Venkataraghavan, R. Atom pairs as molecular features in structure-activity studies: Definition and applications. J. Chem. Inf. Comput. Sci. 1985, 25, 64–73. [Google Scholar] [CrossRef]
- Grisoni, F.; Consonni, V.; Vighi, M.; Villa, S.; Todeschini, R. Investigating the mechanisms of bioconcentration through QSAR classification trees. Environ. Int. 2016, 88, 198–205. [Google Scholar] [CrossRef] [PubMed]
- Cassotti, M.; Consonni, V.; Mauri, A.; Ballabio, D. Validation and extension of a similarity-based approach for prediction of acute aquatic toxicity towards Daphnia magna. SAR QSAR Environ. Res. 2014, 25, 1013–1036. [Google Scholar] [CrossRef] [PubMed]
- Mansouri, K.; Abdelaziz, A.; Rybacka, A.; Roncaglioni, A.; Tropsha, A.; Varnek, A.; Zakharov, A.; Worth, A.; Richard, A.M.; Grulke, C.M.; et al. CERAPP: Collaborative estrogen receptor activity prediction project. Environ. Health Perspect. 2016. [Google Scholar] [CrossRef] [PubMed]
- Gissi, A.; Nicolotti, O.; Carotti, A.; Gadaleta, D.; Lombardo, A.; Benfenati, E. Integration of QSAR models for bioconcentration suitable for REACH. Sci. Total Environ. 2013, 456–457, 325–332. [Google Scholar] [CrossRef] [PubMed]
- Fp, G. Role of cytochrome P450 enzymes in drug-drug interactions. Adv. Pharmacol. 1996, 43, 7–35. [Google Scholar]
- Walters, W.P.; Stahl, M.T.; Murcko, M.A. Virtual screening—An overview. Drug Discov. Today 1998, 3, 160–178. [Google Scholar] [CrossRef]
- James, C.A.; Weininger, D.; Delany, J. Daylight Theory Manual; Daylight Chemical Information Systems, Inc.: Aliso Viejo, CA, USA, 1995; p. 3951p. [Google Scholar]
- Leardi, R.; Lupiáñez González, A. Genetic algorithms applied to feature selection in PLS regression: How and when to use them. Chemom. Intell. Lab. Syst. 1998, 41, 195–207. [Google Scholar] [CrossRef]
- Cassotti, M.; Grisoni, F. Variable selection methods: An introduction. Available online: http://www.moleculardescriptors.eu (accessed on 2 February 2016).
- Sahigara, F.; Ballabio, D.; Todeschini, R.; Consonni, V. Defining a novel k-Nearest neighbours approach to assess the applicability domain of a QSAR model for reliable predictions. J. Cheminform. 2013, 5, 27. [Google Scholar] [CrossRef] [PubMed]
- Berthold, M.R.; Cebron, N.; Dill, F.; Gabriel, T.R.; Kötter, T.; Meinl, T.; Ohl, P.; Sieb, C.; Thiel, K.; Wiswedel, B. KNIME: The konstanz information miner. In Data Analysis, Machine Learning and Applications; Preisach, C., Burkhardt, P.D.H., Schmidt-Thieme, P.D.L., Decker, P.D.R., Eds.; Studies in Classification, Data Analysis, and Knowledge Organization; Springer: Berlin, Germany; Heidelberg, Germany, 2008; pp. 319–326. [Google Scholar]
- MATLAB, 2015. R2015a; The MathWorks Inc.: Natick, MA, USA, 2015.
- Milano Chemometrics and QSAR Research Group. Available online: http://michem.disat.unimib.it/chm/download/datasets.htm (accessed on 3 March 2016).


| Model | Descriptors | AD | p | Parameter | Fitting | Cross-Validation | Test Set | |||||||
|---|---|---|---|---|---|---|---|---|---|---|---|---|---|---|
| NER | Sn | Sp | NER | Sn | Sp | %out | NER | Sn | Sp | |||||
| CART | MD | y | 3 | 210 | 0.74 | 0.74 | 0.75 | 0.74 | 0.73 | 0.75 | - | 0.75 | 0.74 | 0.76 |
| n | 3 | 210 | 0.74 | 0.74 | 0.75 | 0.74 | 0.73 | 0.75 | 0 | 0.75 | 0.74 | 0.76 | ||
| k-NN | MD | y | 6 | 14 | 0.76 | 0.73 | 0.79 | 0.76 | 0.73 | 0.78 | - | 0.77 | 0.75 | 0.79 |
| n | 6 | 14 | 0.76 | 0.73 | 0.79 | 0.76 | 0.73 | 0.78 | 5 | 0.77 | 0.76 | 0.78 | ||
| N3 | ECFP | y | 1024 | 1 | 0.79 | 0.88 | 0.71 | 0.79 | 0.87 | 0.70 | - | 0.78 | 0.86 | 0.71 |
| n | 1024 | 1 | 0.79 | 0.88 | 0.71 | 0.79 | 0.87 | 0.70 | 1 | 0.78 | 0.86 | 0.71 | ||
| MD | Description | Reference | Model | Low Value | High Value | ||
|---|---|---|---|---|---|---|---|
| nBM | Number of multiple bonds. | [10] | CART |  | 0 |  | 66 |
| nBO | Number of non-hydrogen bonds. | [10] | CART |  | 3 |  | 59 |
| C% | Percentage of C atoms. | [10] | k-NN |  | 0 |  | 58.3 |
| SIC5 | Structural Information Content—order 5. | [39] | k-NN |  | 0.28 |  | 1.00 |
| ATSC4p | Centred Broto-Moreau autocorrelations—lag 4 (weighted by atomic polarizability). | [20] | k-NN |  | 0.21 |  | 46.6 |
| ATSC6i | Centred Broto-Moreau autocorrelations—lag 6 (weighted by atomic ionization potential). | [20] | k-NN |  | 0 |  | 4.1 |
| nROH | Number of hydroxyl groups. | [10] | CART, k-NN |  | 0 |  | 9 |
| NaasC | Counts of the E-state atom types. | [43] | k-NN |  | 0 |  | 16 |
| Model | Descriptors | AD | p | Parameter | Fitting | Cross-Validation | Test Set | |||||||
|---|---|---|---|---|---|---|---|---|---|---|---|---|---|---|
| NER | Sn | Sp | NER | Sn | Sp | %out | NER | Sn | Sp | |||||
| CART | MD | y | 4 | 210 | 0.75 | 0.75 | 0.75 | 0.75 | 0.75 | 0.75 | - | 0.75 | 0.75 | 0.74 |
| n | 4 | 210 | 0.75 | 0.75 | 0.75 | 0.75 | 0.75 | 0.75 | 0 | 0.75 | 0.75 | 0.74 | ||
| k-NN | MD | y | 6 | 14 | 0.77 | 0.69 | 0.85 | 0.77 | 0.68 | 0.85 | - | 0.76 | 0.67 | 0.86 |
| n | 6 | 14 | 0.77 | 0.69 | 0.85 | 0.77 | 0.68 | 0.85 | 5 | 0.76 | 0.67 | 0.84 | ||
| N3 | ECFP | y | 1024 | 1 | 0.80 | 0.87 | 0.73 | 0.80 | 0.86 | 0.73 | - | 0.78 | 0.83 | 0.73 |
| n | 1024 | 1 | 0.80 | 0.87 | 0.73 | 0.80 | 0.86 | 0.73 | 1 | 0.78 | 0.83 | 0.73 | ||
| MD | Description | Reference | Model | Low Value | High Value | ||
|---|---|---|---|---|---|---|---|
| nBM | Number of multiple bonds. | [10] | CART |  | 0 |  | 44 |
| Sp | Sum of atomic polarizabilities scaled on Carbon atom. | [10] | CART |  | 5.0 |  | 56.1 |
| ARR | Ratio between the number of aromatic bonds over the total number of non-H bonds. | [10] | CART |  | 0 |  | 0.96 |
| HyWi_B(m) | Hyper-Wiener-like index from Burden matrix weighted by mass. | [55] | k-NN |  | 2.3 |  | 5.1 |
| GATS2i | Geary autocorrelation of lag 2 weighted by ionization potential. | [56] | k-NN |  | 0.09 |  | 1.93 |
| Eta_betaP_A | Eta pi and lone pair average VEM count. | [49] | k-NN |  | 0 |  | 1.02 |
| nPyrimidines | Number of Pyrimidines. | [10] | CART |  | 0 |  | 2 |
| nRNR2 | Number of aliphatic tertiary amines. | [10] | k-NN |  | 0 |  | 3 |
| F01[C–N] | Frequency of C–N at topological distance 1. | [57] | k-NN |  | 0 |  | 19 |
| MLOGP | Moriguchi octanol-water partition coefficient. | [50] | k-NN |  | -6.3 |  | 9.6 |
| CYP | Type | Fitting | Cross-Validation | Test set | |||||||||
|---|---|---|---|---|---|---|---|---|---|---|---|---|---|
| %na | NER | Sn | Sp | %na | NER | Sn | Sp | %na | NER | Sn | Sp | ||
| 3A4 | cons 1 | 33 | 0.88 | 0.92 | 0.84 | 33 | 0.88 | 0.92 | 0.84 | 36 | 0.88 | 0.92 | 0.83 |
| cons 2 | - | 0.79 | 0.80 | 0.78 | - | 0.78 | 0.79 | 0.77 | 6 | 0.80 | 0.81 | 0.80 | |
| 2C9 | cons 1 | 33 | 0.89 | 0.90 | 0.88 | 34 | 0.89 | 0.90 | 0.88 | 40 | 0.89 | 0.89 | 0.88 |
| cons 2 | - | 0.81 | 0.80 | 0.82 | - | 0.81 | 0.80 | 0.82 | 1 | 0.79 | 0.77 | 0.81 | |
| CYP | Mod. | Fitting a | Cross-Validation a | External Set | |||||||||
|---|---|---|---|---|---|---|---|---|---|---|---|---|---|
| %na | NER | Sn | Sp | %na | NER | Sn | Sp | %na | NER | Sn | Sp | ||
| 3A4 | CART | - | 0.75 | 0.74 | 0.75 | - | 0.74 | 0.73 | 0.76 | - | 0.66 | 0.68 | 0.63 |
| k-NN | - | 0.76 | 0.73 | 0.79 | - | 0.76 | 0.73 | 0.79 | 1 | 0.70 | 0.70 | 0.69 | |
| N3 | - | 0.80 | 0.87 | 0.73 | - | 0.79 | 0.87 | 0.71 | 1 | 0.72 | 0.85 | 0.59 | |
| cons 1 | 32 | 0.88 | 0.91 | 0.85 | 33 | 0.88 | 0.91 | 0.84 | 42 | 0.80 | 0.89 | 0.70 | |
| cons 2 | - | 0.80 | 0.80 | 0.79 | - | 0.79 | 0.80 | 0.78 | 1 | 0.71 | 0.76 | 0.67 | |
| 2C9 | CART | - | 0.75 | 0.77 | 0.74 | - | 0.74 | 0.73 | 0.76 | - | 0.66 | 0.66 | 0.66 |
| k-NN | - | 0.77 | 0.69 | 0.85 | - | 0.77 | 0.68 | 0.85 | 1 | 0.69 | 0.58 | 0.81 | |
| N3 | - | 0.80 | 0.86 | 0.74 | - | 0.79 | 0.85 | 0.74 | - | 0.75 | 0.83 | 0.68 | |
| cons 1 | 34 | 0.89 | 0.91 | 0.88 | 35 | 0.89 | 0.90 | 0.88 | 45 | 0.83 | 0.85 | 0.82 | |
| cons 2 | - | 0.81 | 0.81 | 0.82 | - | 0.80 | 0.79 | 0.82 | 1 | 0.73 | 0.71 | 0.75 | |
| CYP Isoform | Shared Set | External Set | ||
|---|---|---|---|---|
| n | %act | n | %act | |
| 3A4 | 9122 | 40 | 2996 | 49 |
| 2C9 | 9122 | 33 | 2818 | 36 |
© 2016 by the authors; licensee MDPI, Basel, Switzerland. This article is an open access article distributed under the terms and conditions of the Creative Commons Attribution (CC-BY) license (http://creativecommons.org/licenses/by/4.0/).
Share and Cite
Nembri, S.; Grisoni, F.; Consonni, V.; Todeschini, R. In Silico Prediction of Cytochrome P450-Drug Interaction: QSARs for CYP3A4 and CYP2C9. Int. J. Mol. Sci. 2016, 17, 914. https://doi.org/10.3390/ijms17060914
Nembri S, Grisoni F, Consonni V, Todeschini R. In Silico Prediction of Cytochrome P450-Drug Interaction: QSARs for CYP3A4 and CYP2C9. International Journal of Molecular Sciences. 2016; 17(6):914. https://doi.org/10.3390/ijms17060914
Chicago/Turabian StyleNembri, Serena, Francesca Grisoni, Viviana Consonni, and Roberto Todeschini. 2016. "In Silico Prediction of Cytochrome P450-Drug Interaction: QSARs for CYP3A4 and CYP2C9" International Journal of Molecular Sciences 17, no. 6: 914. https://doi.org/10.3390/ijms17060914
APA StyleNembri, S., Grisoni, F., Consonni, V., & Todeschini, R. (2016). In Silico Prediction of Cytochrome P450-Drug Interaction: QSARs for CYP3A4 and CYP2C9. International Journal of Molecular Sciences, 17(6), 914. https://doi.org/10.3390/ijms17060914