
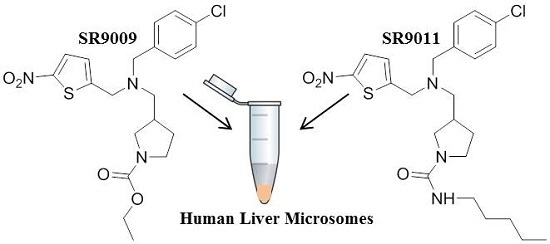
In Vitro Metabolic Studies of REV-ERB Agonists SR9009 and SR9011


Abstract
:
1. Introduction
2. Results
2.1. Analysis of Black Market Product
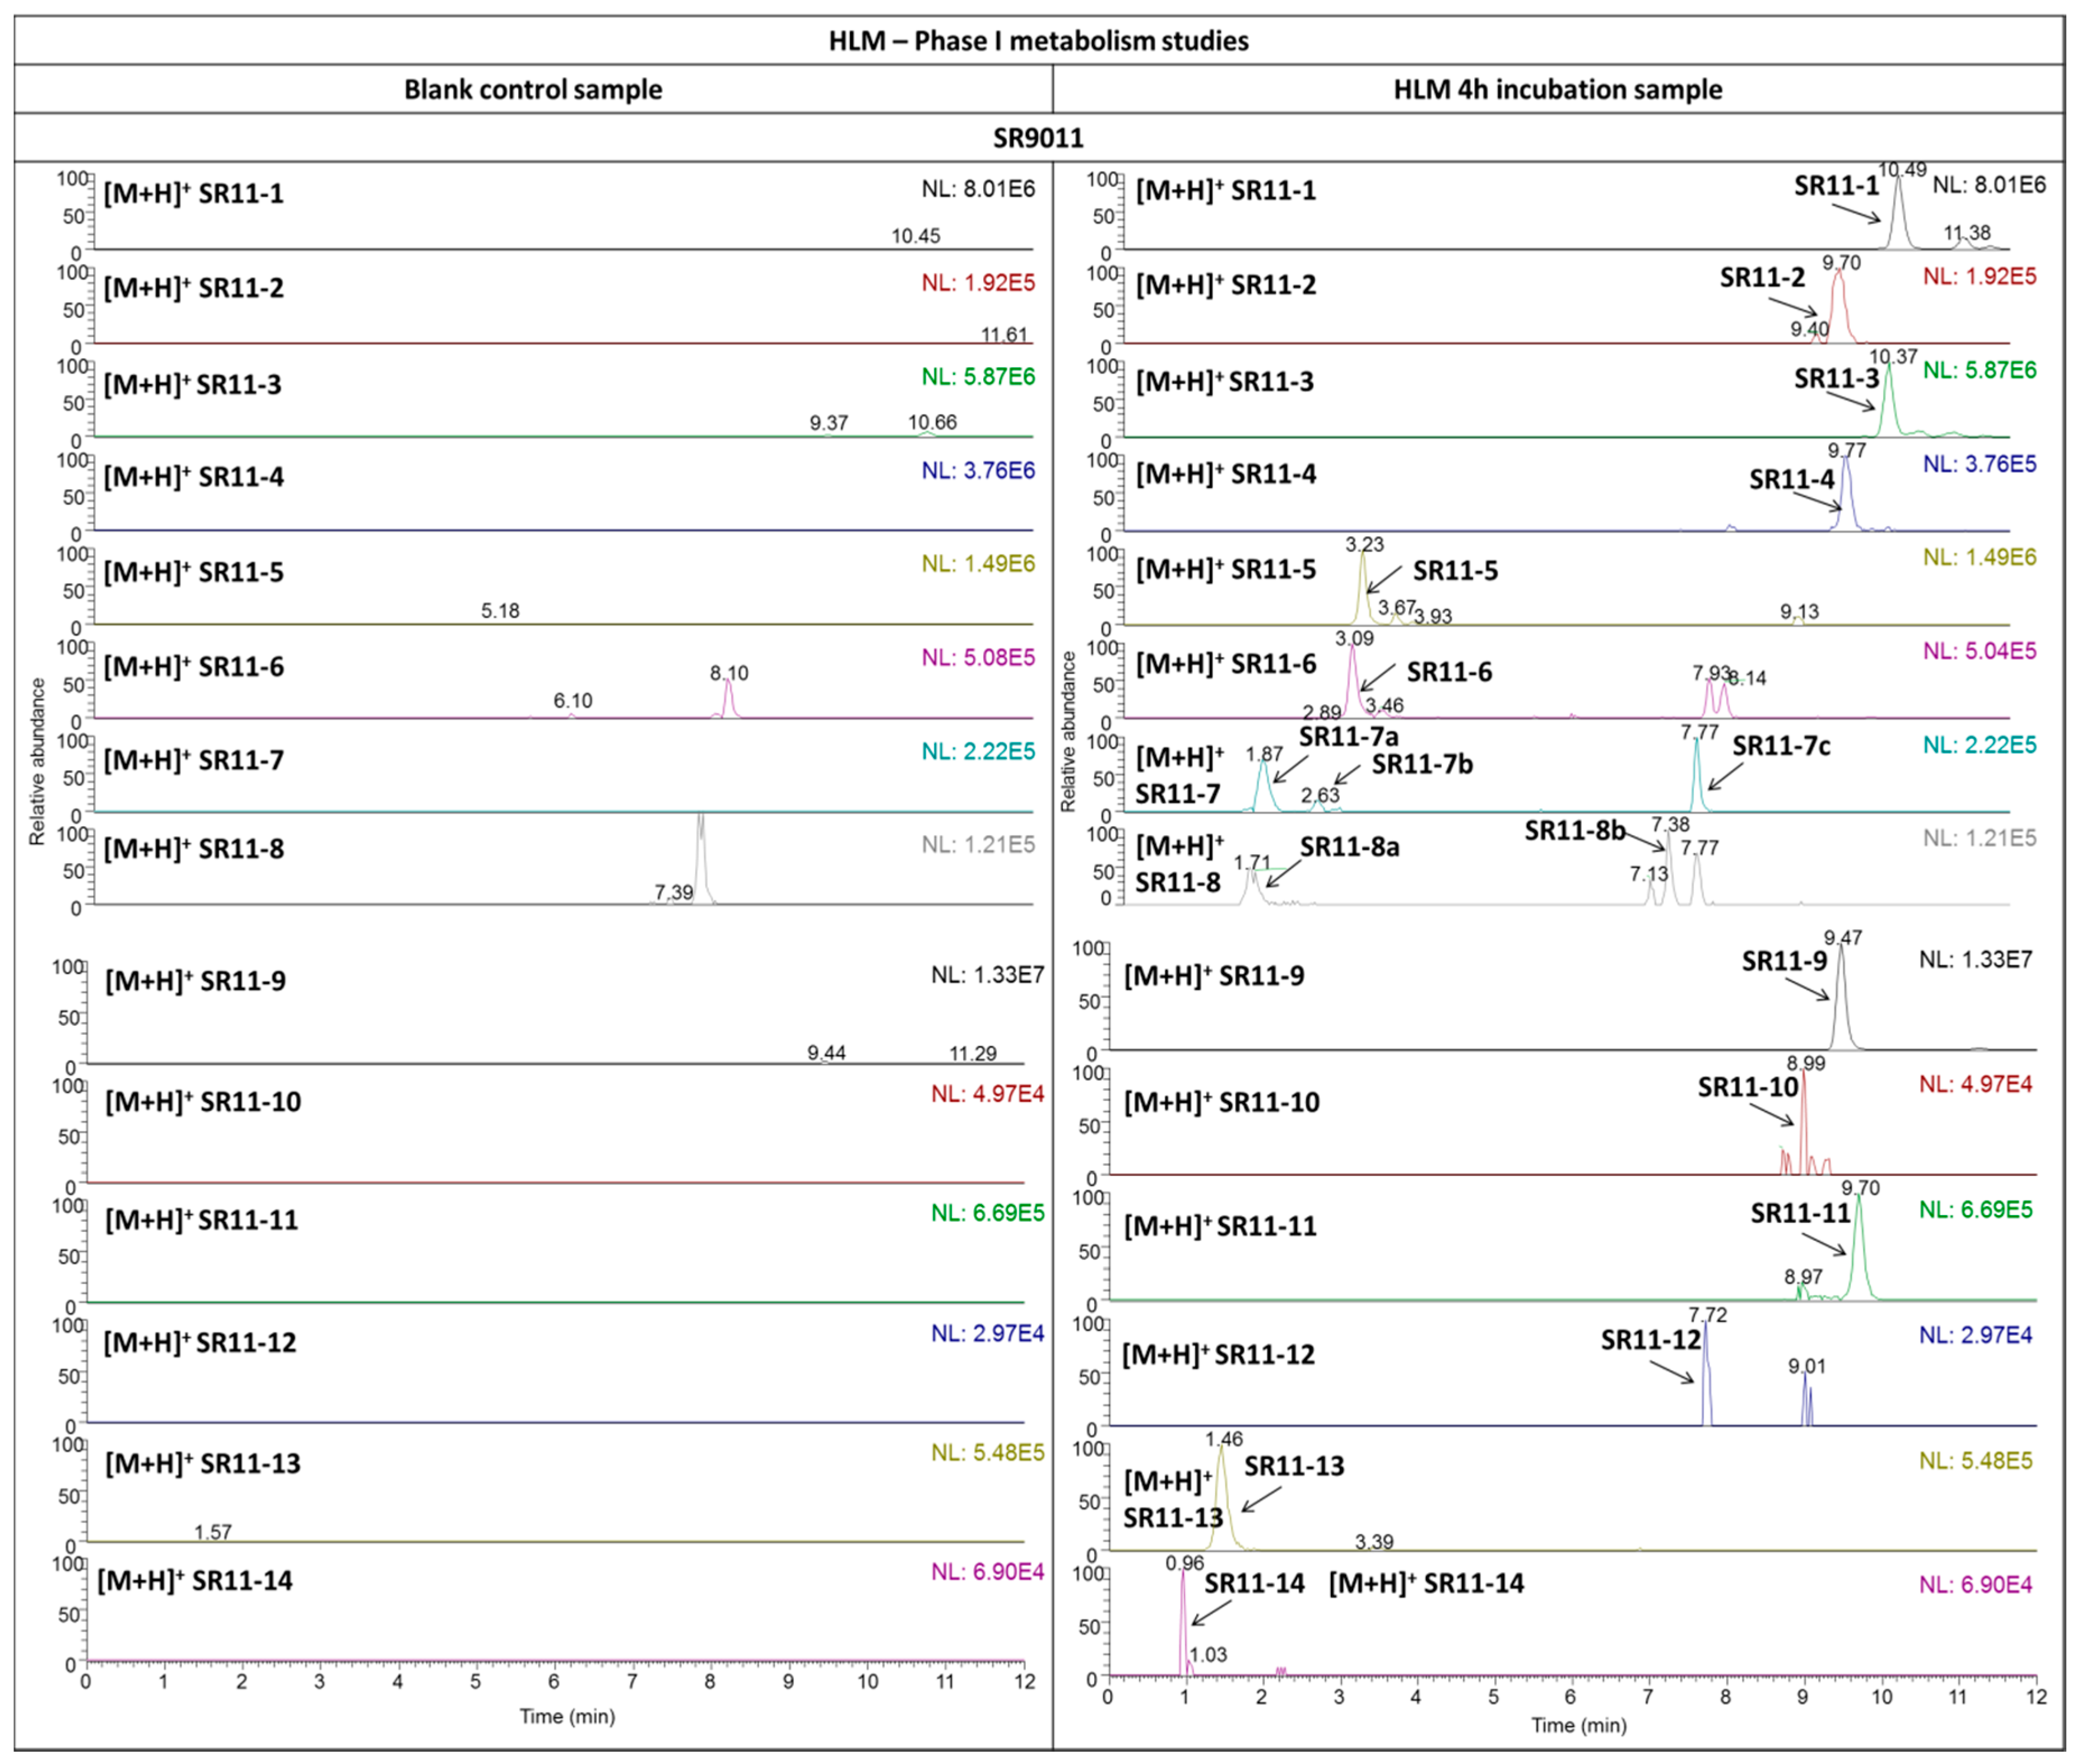
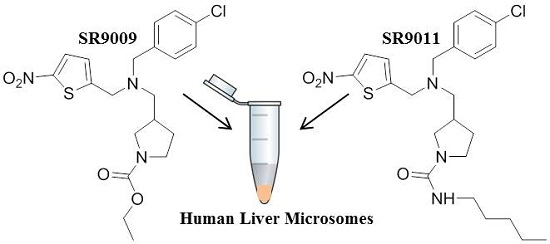
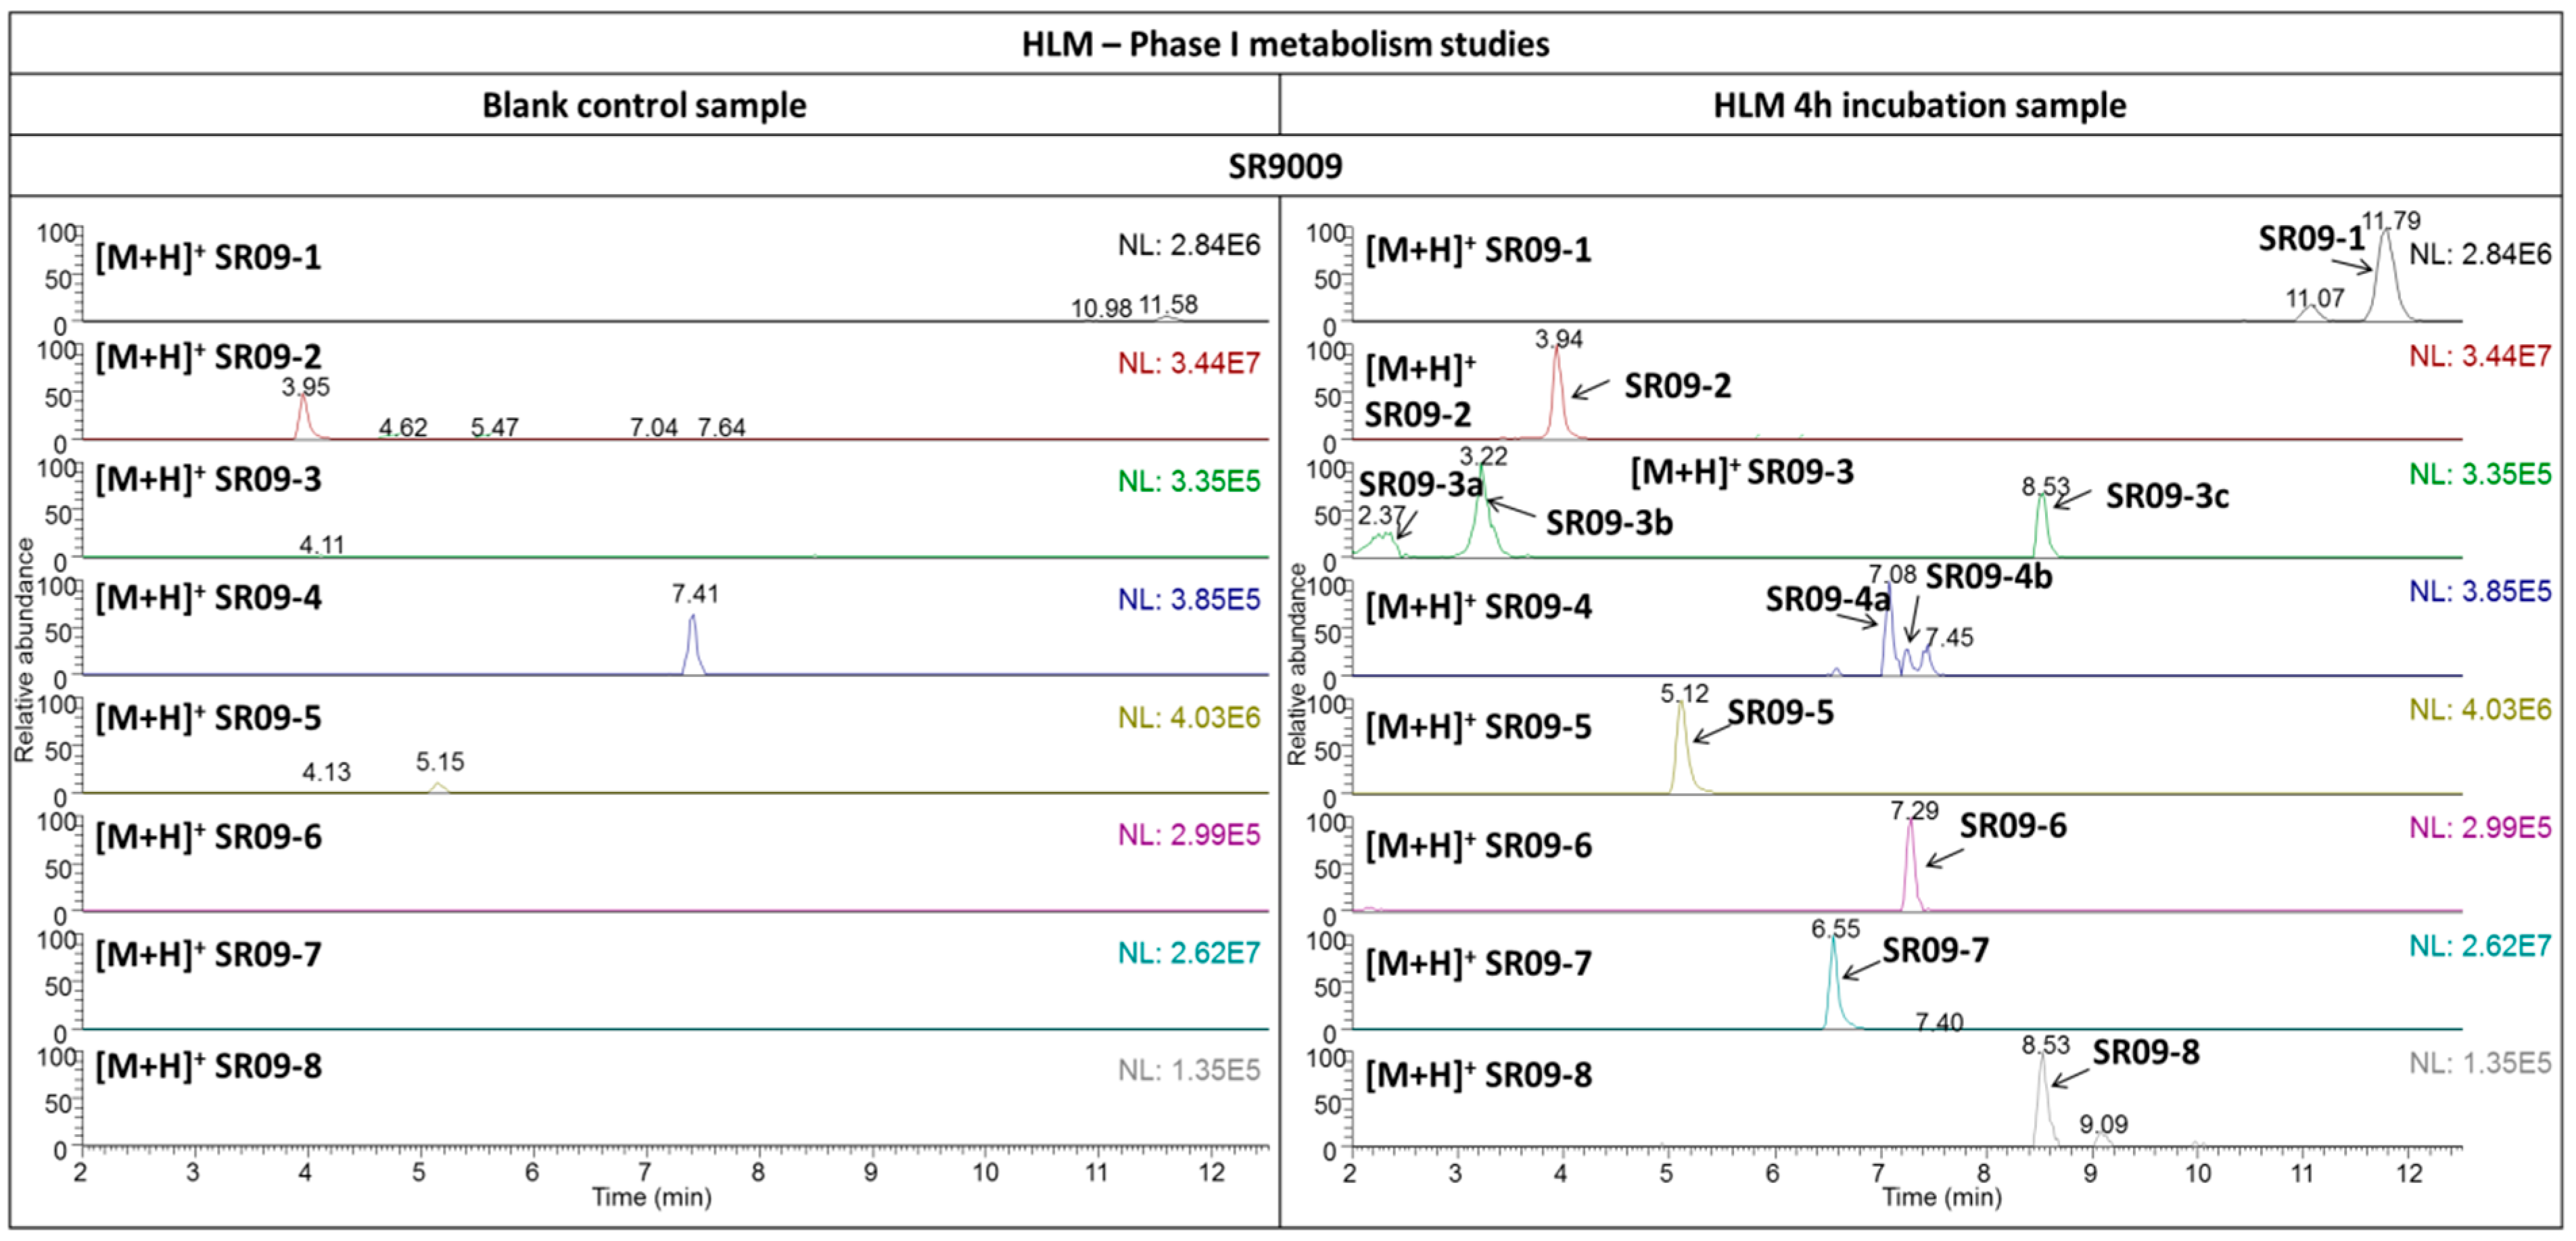
2.2. In Vitro Metabolic Studies
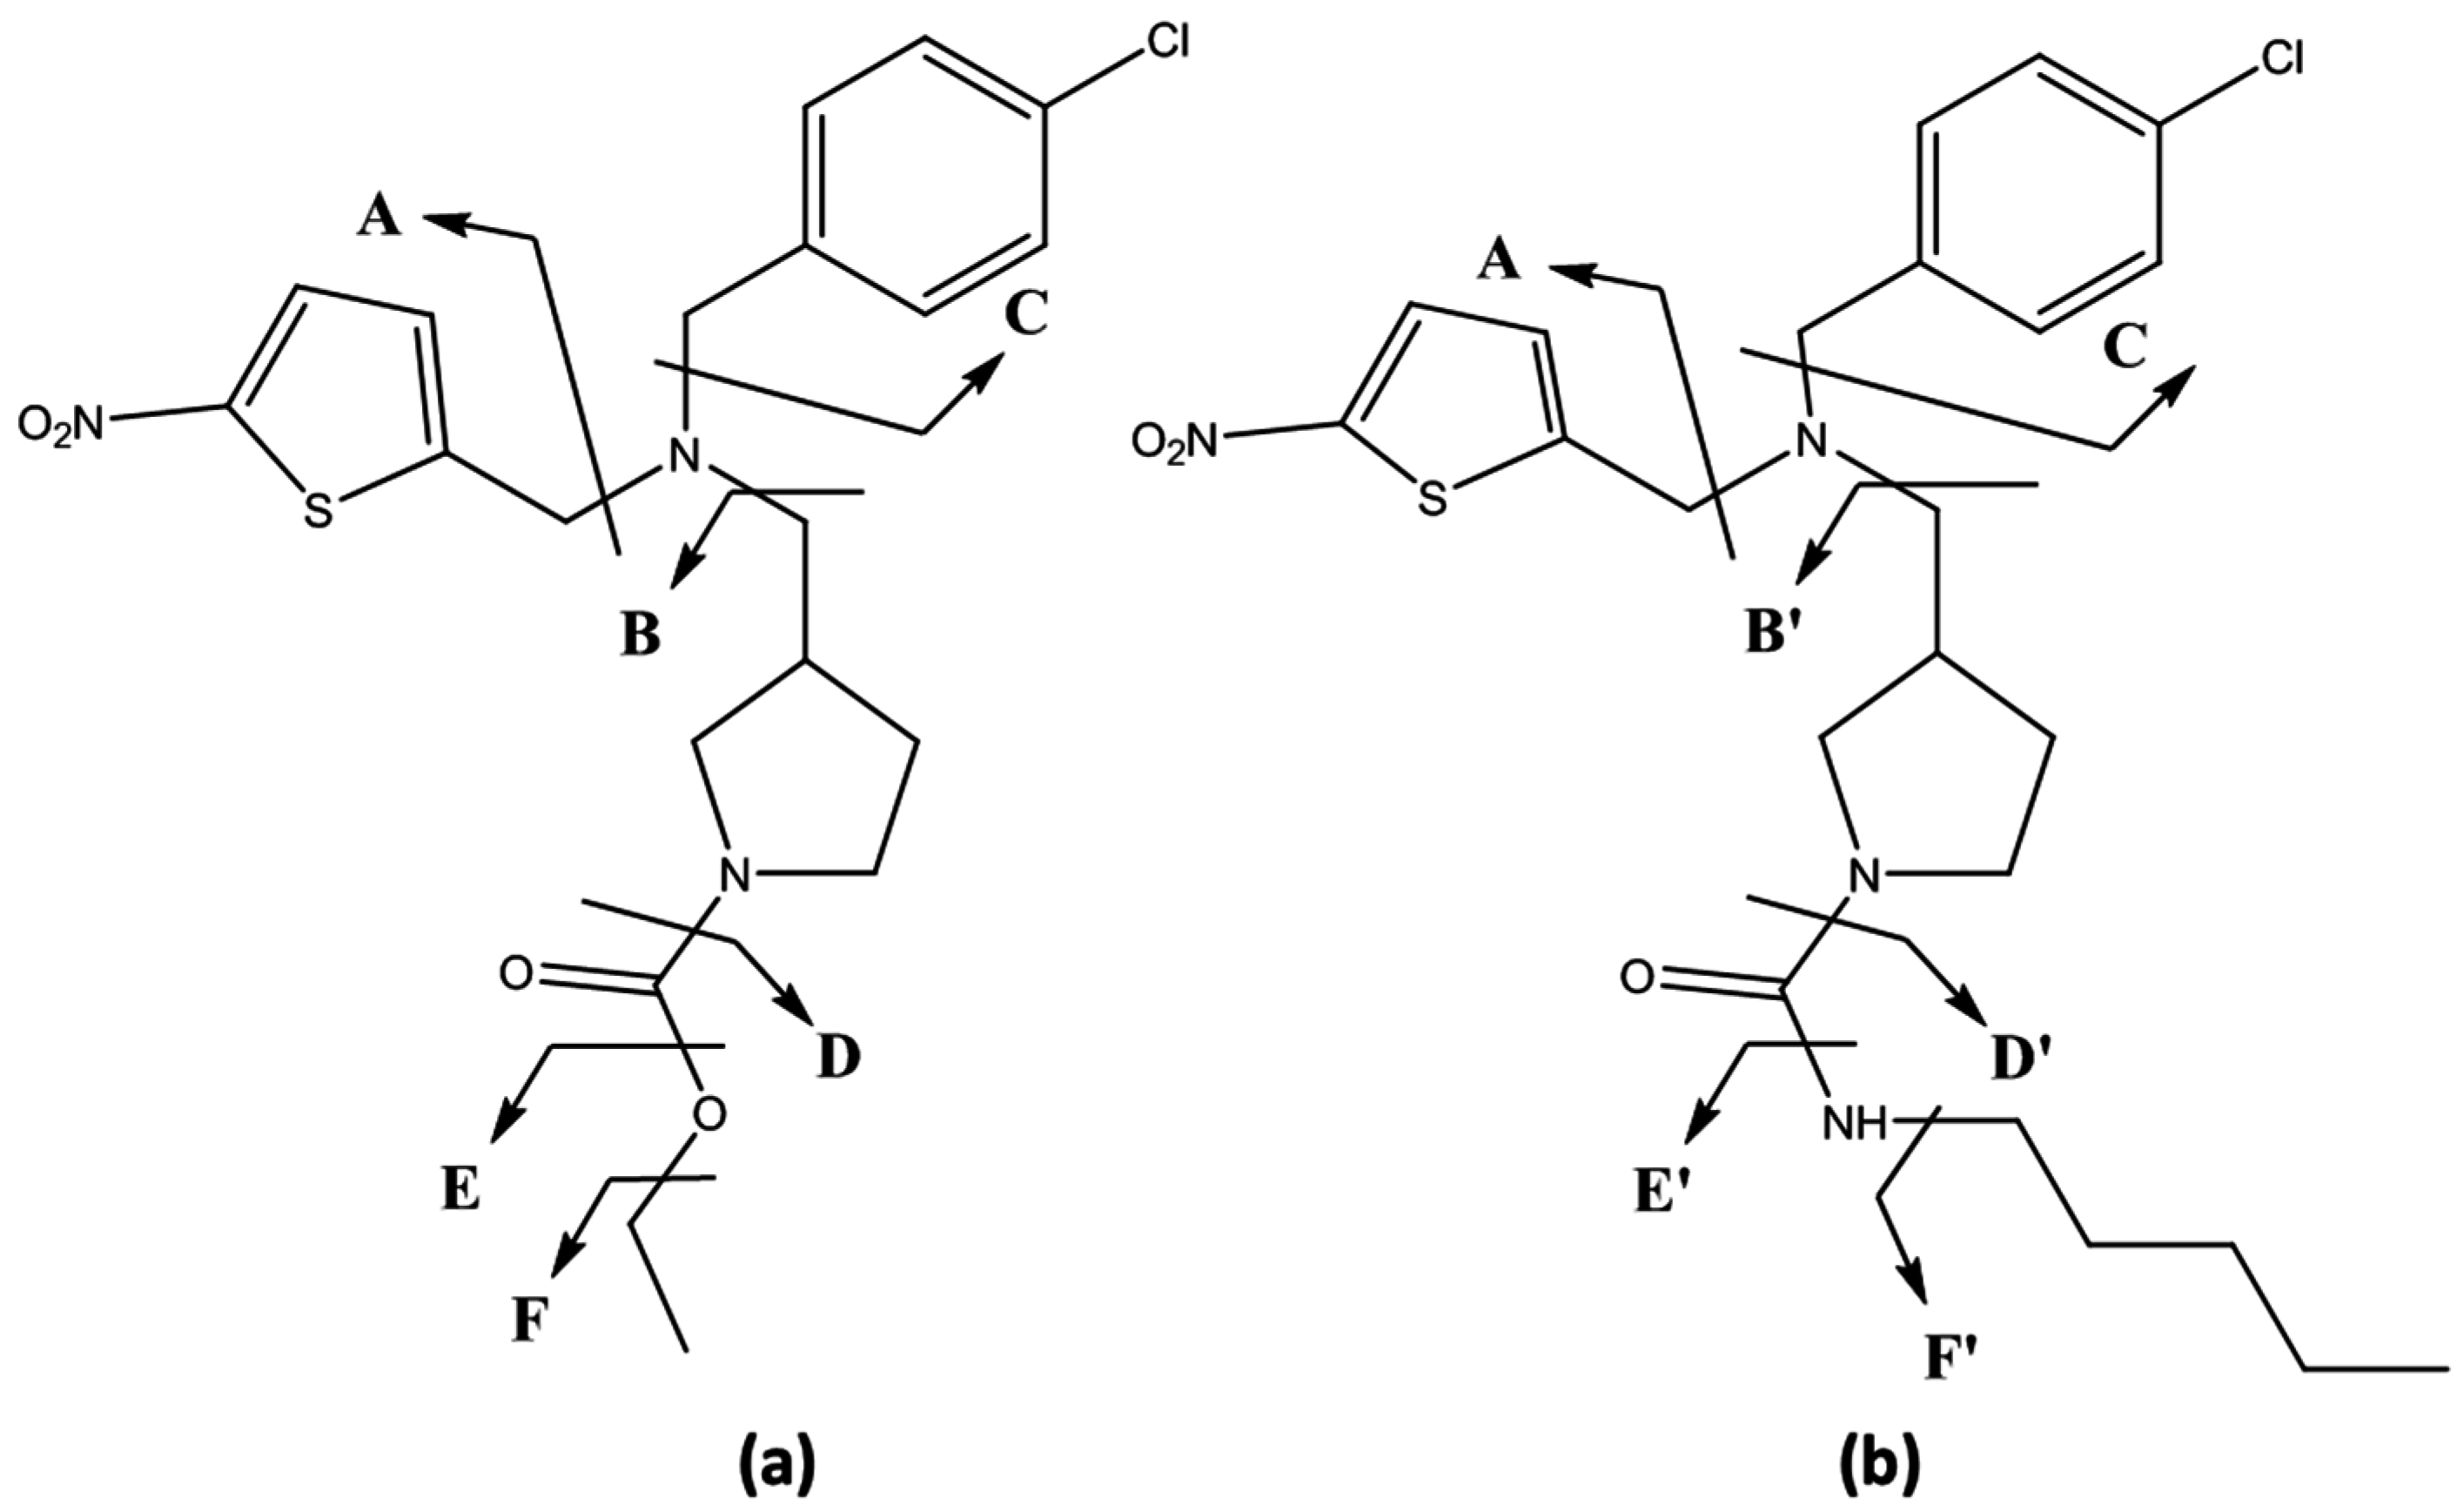
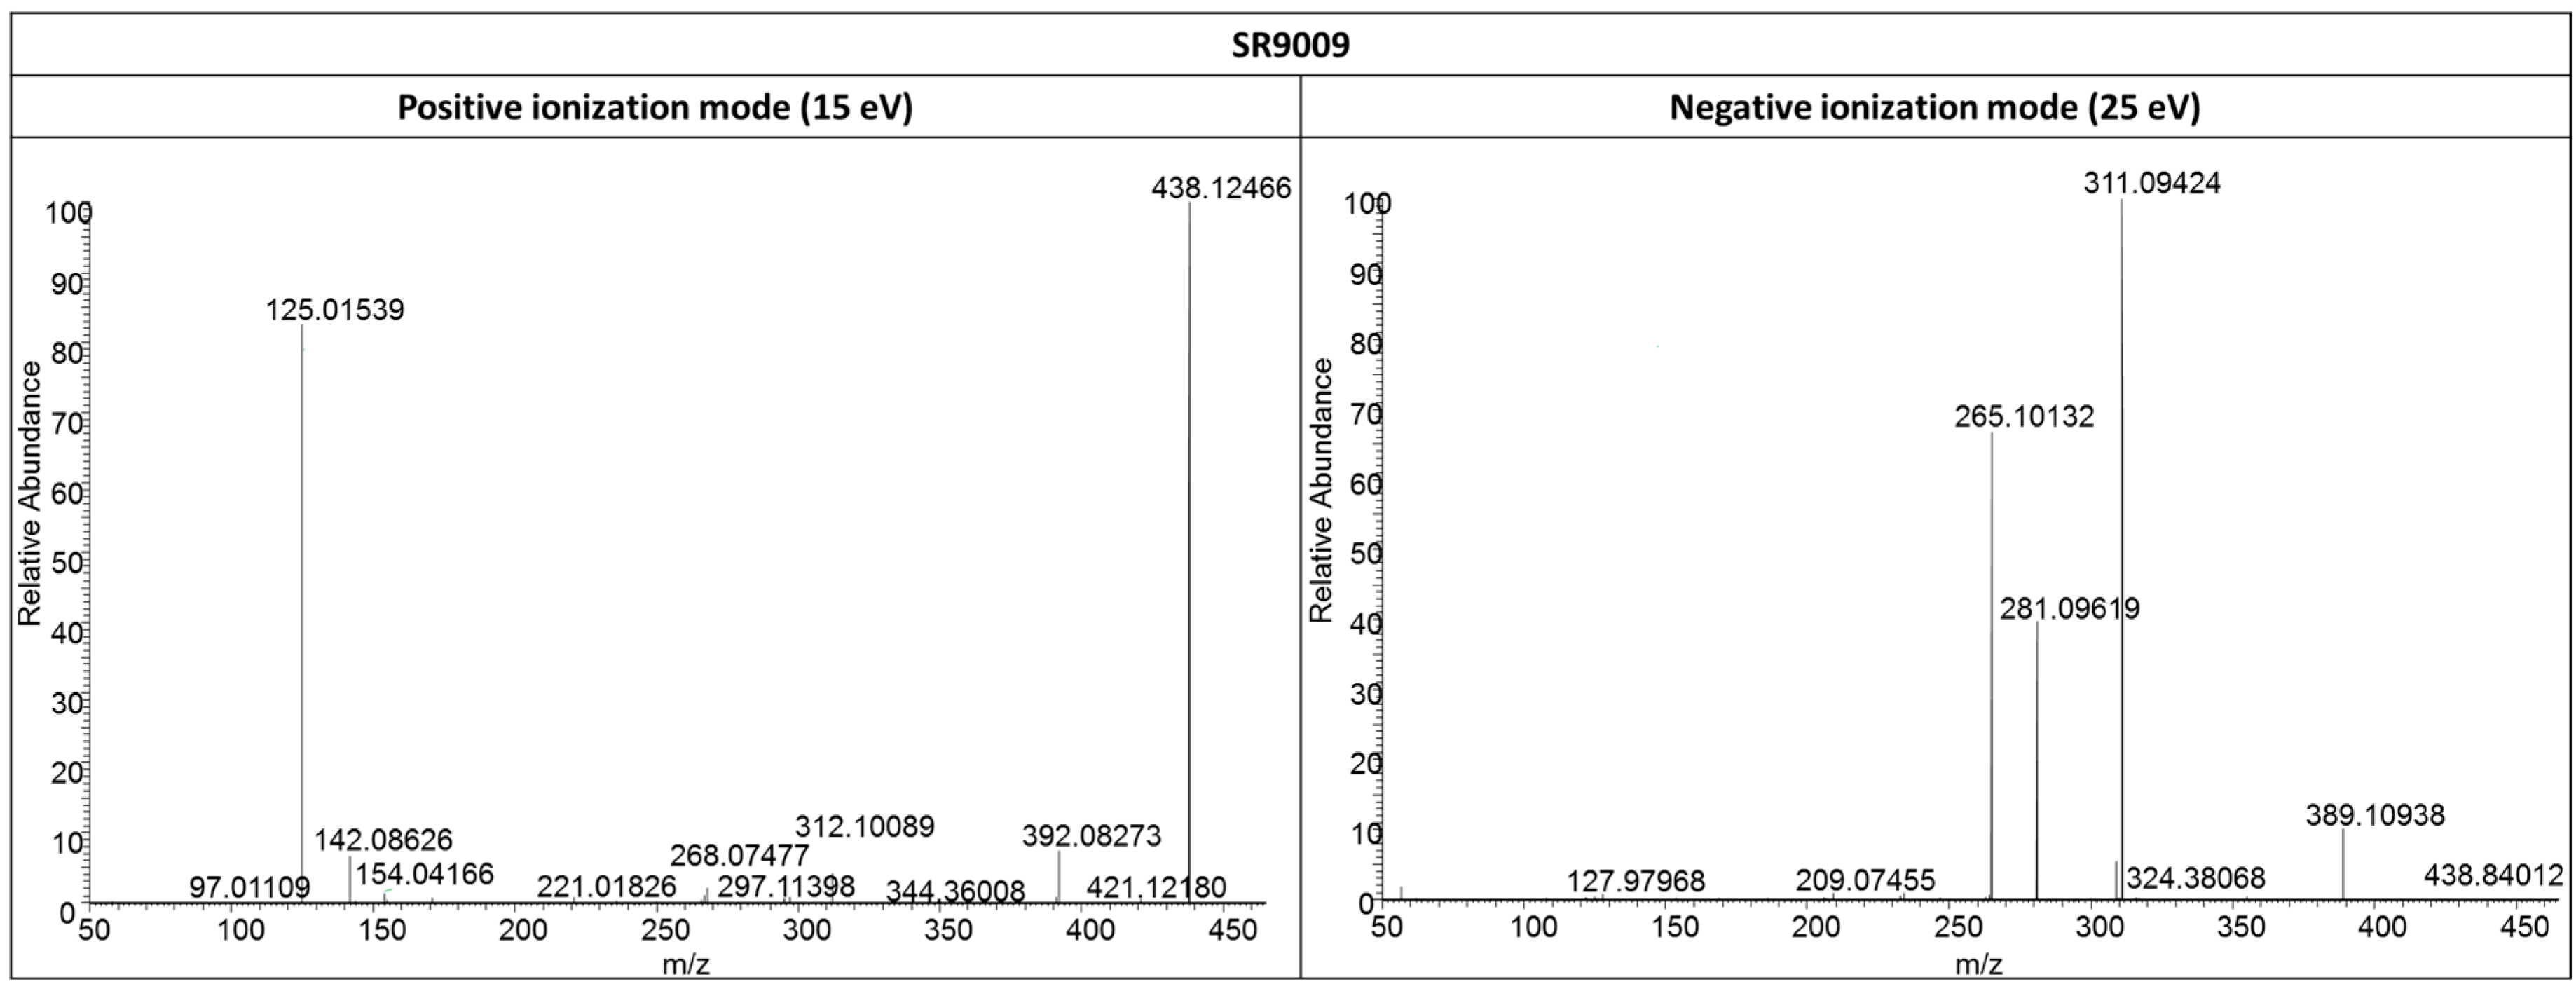
2.3. Structure Characterization by Liquid Chromatography–High Resolution Tandem Mass Spectrometry (LC–HRMS/MS)
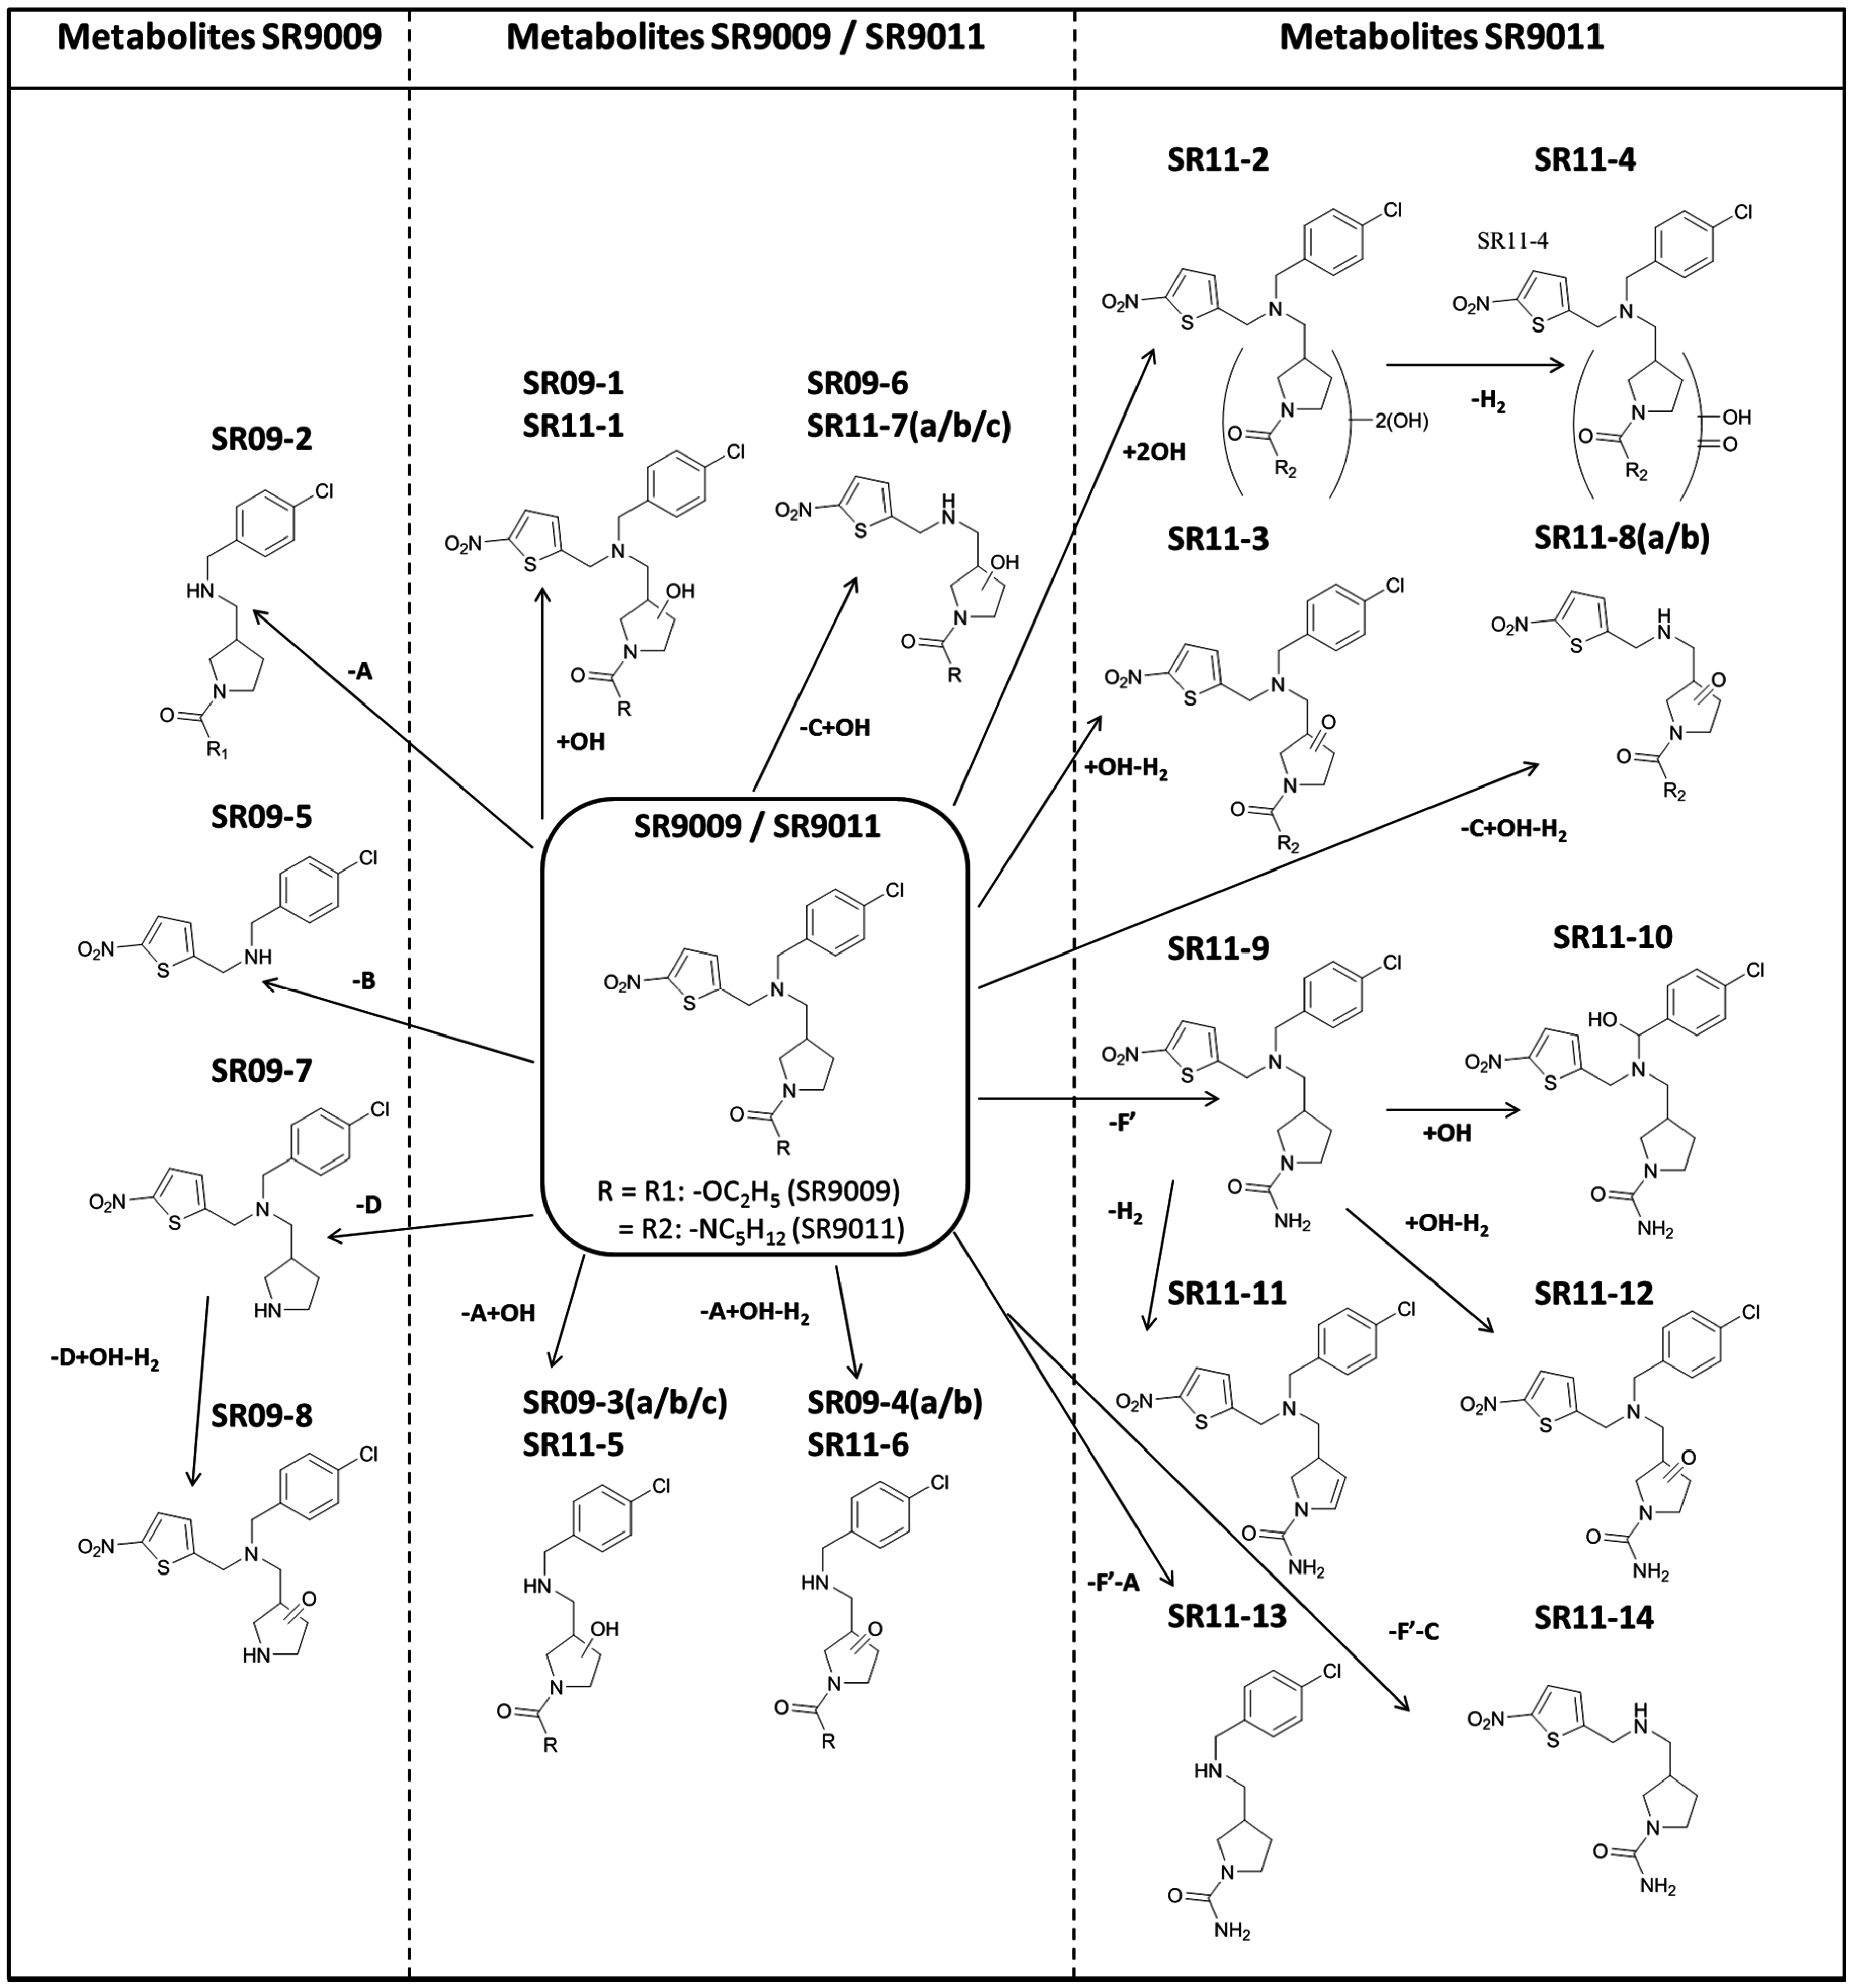
2.3.1. SR9009
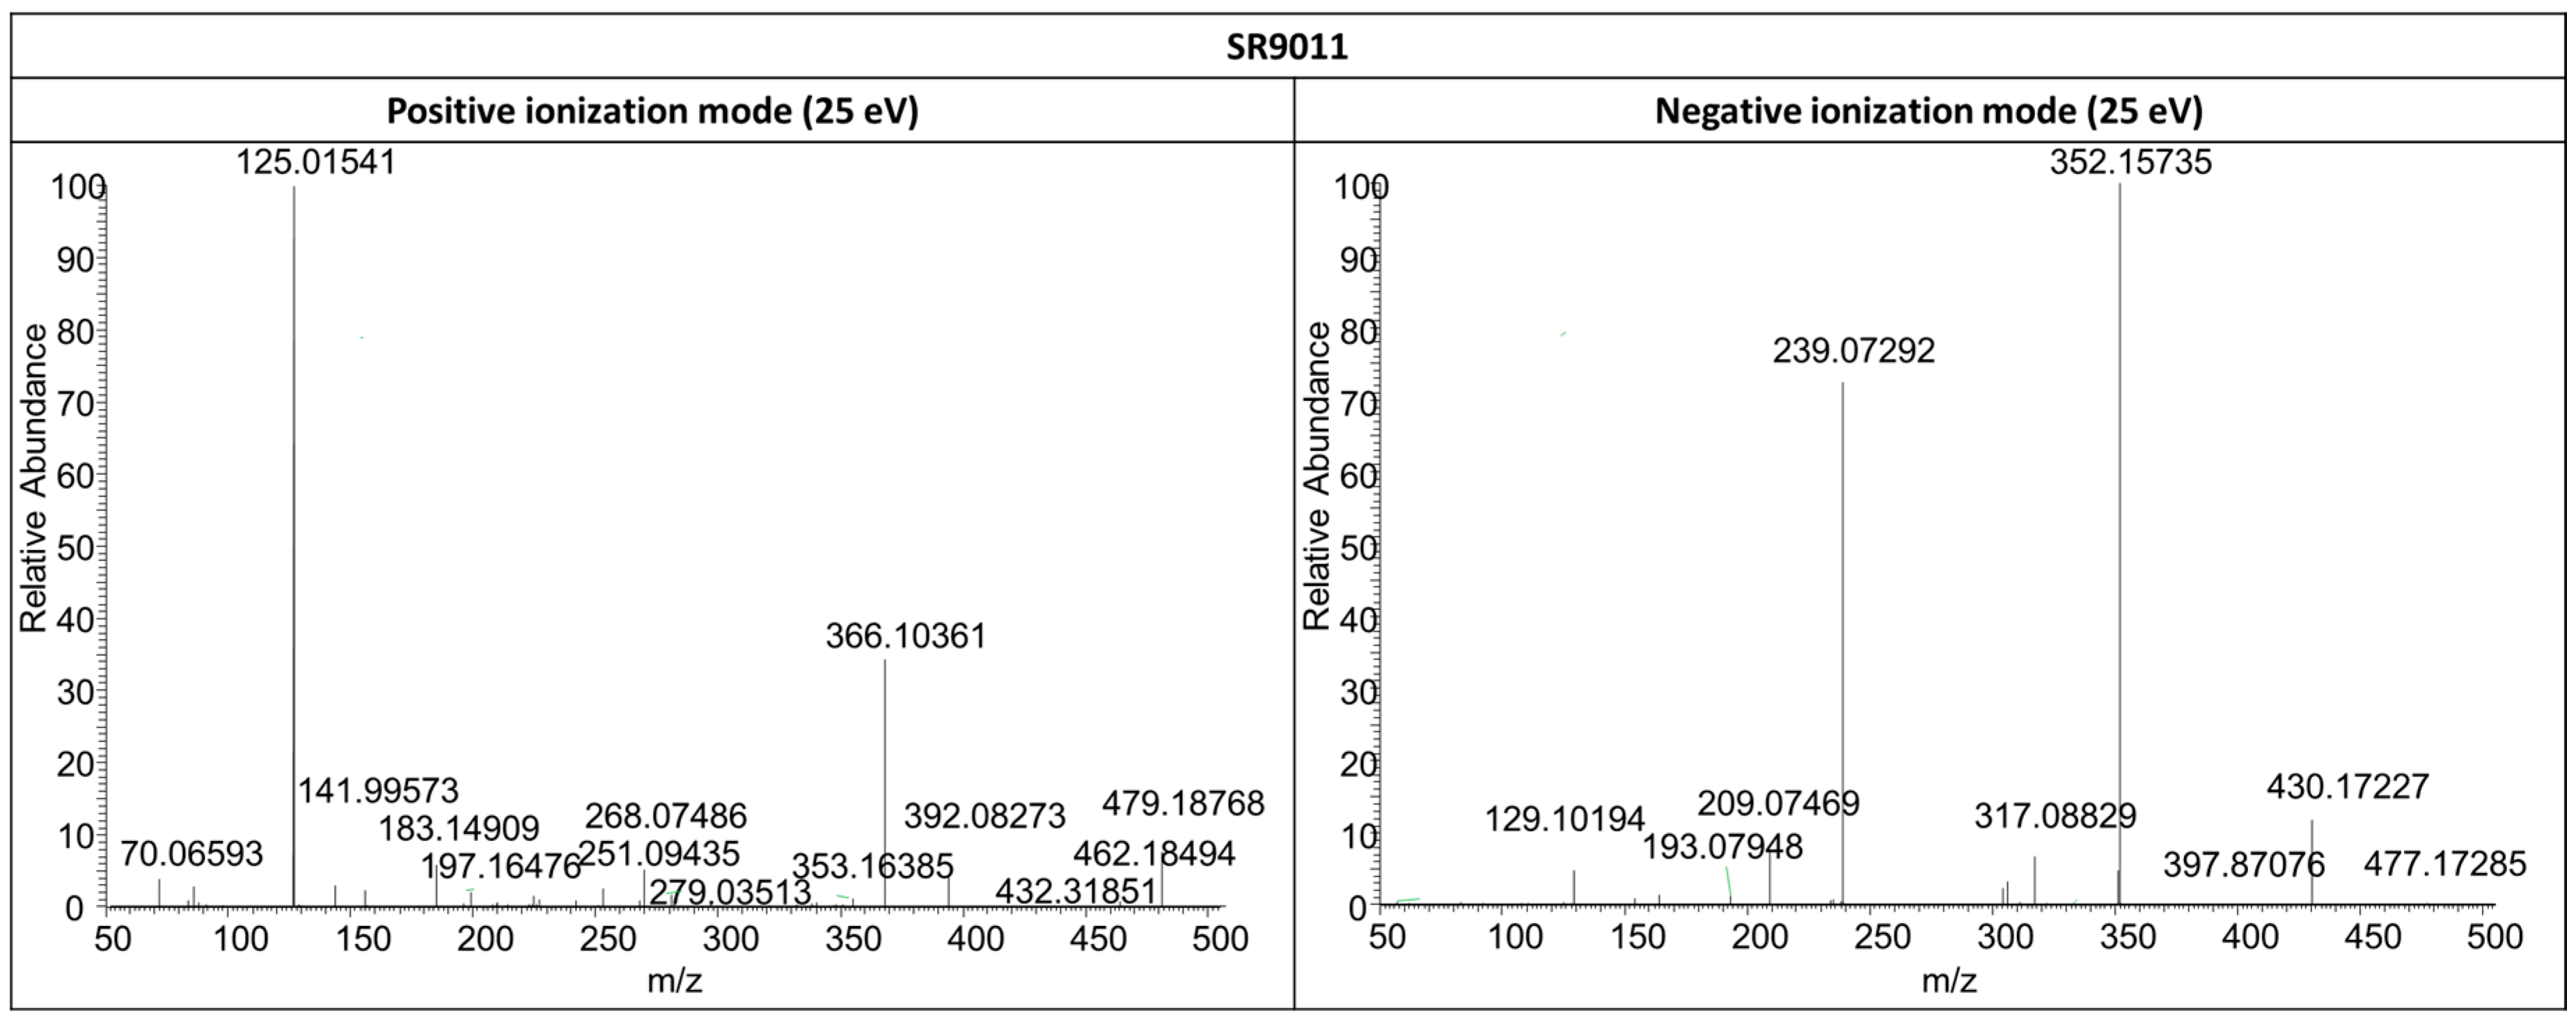
2.3.2. SR9011
2.4. Assay Validation
2.5. Retrospective Analysis
3. Discussion
4. Materials and Methods
4.1. Chemicals and Reagents
4.2. Instrumentation
Liquid Chromatography–(High Resolution) Mass Spectrometry (LC–(HR)MS)
4.3. In Vitro Incubation Studies
4.4. Assay Validation
4.5. Sample Preparation
5. Conclusions
Acknowledgments
Author Contributions
Conflicts of Interest
References
- Shea, S.A. Obesity and pharmacologic control of the body clock. N. Engl. J. Med. 2012, 367, 175–178. [Google Scholar] [CrossRef] [PubMed]
- Duez, H.; Staels, B. REV-ERB α gives a time cue to metabolism. FEBS Lett. 2008, 582, 19–25. [Google Scholar] [CrossRef] [PubMed]
- Bass, J. Drug discovery time in a bottle. Nature 2012, 485, 45–46. [Google Scholar] [CrossRef] [PubMed]
- Solt, L.A.; Wang, Y.J.; Banerjee, S.; Hughes, T.; Kojetin, D.J.; Lundasen, T.; Shin, Y.; Liu, J.; Cameron, M.D.; Noel, R.; et al. Regulation of circadian behaviour and metabolism by synthetic REV-ERB agonists. Nature 2012, 485, 62–68. [Google Scholar] [CrossRef] [PubMed]
- Ramakrishnan, S.N.; Muscat, G.E. The orphan REV-ERB nuclear receptors: A link between metabolism, circadian rhythm and inflammation? Nucl. Recept. Signal. 2006, 4, e009. [Google Scholar] [CrossRef] [PubMed]
- Woldt, E.; Sebti, Y.; Solt, L.A.; Duhem, C.; Lancel, S.; Eeckhoute, J.; Hesselink, M.K.C.; Paquet, C.; Delhaye, S.; Shin, Y.S.; et al. REV-ERB-α modulates skeletal muscle oxidative capacity by regulating mitochondrial biogenesis and autophagy. Nat. Med. 2013, 19, 1039–1046. [Google Scholar] [CrossRef] [PubMed]
- Shin, Y.; Noel, R.; Banerjee, S.; Kojetin, D.; Song, X.Y.; He, Y.J.; Lin, L.; Cameron, M.D.; Burris, T.P.; Kamenecka, T.M. Small molecule tertiary amines as agonists of the nuclear hormone receptor REV-ERB α. Bioorg. Med. Chem. Lett. 2012, 22, 4413–4417. [Google Scholar] [CrossRef] [PubMed]
- Li, S.; Laher, I. Exercise pills: At the starting line. Trends Pharmacol. Sci. 2015, 36, 906–917. [Google Scholar] [CrossRef] [PubMed]
- The Huffington Post. ‘Exercise Pill’ May Build Muscle, Boost Athletic Performance and Lower Cholesterol Levels. Available online: http://www.huffingtonpost.com/2013/08/23/exercise-pill-muscles-athletic-performance-health_n_3797332.html (accessed on 4 December 2015).
- The Huffington Post. An ‘Exercise Pill’ May Soon Exist. Available online: http://www.huffingtonpost.com/entry/exercise-pill_us_56128c64e4b0768127028b16 (accessed on 4 December 2015).
- ISarms. Stenabolic (SR9009). Available online: https://www.isarms.com/stenabolic-sr9009 (accessed on 25 January 2016).
- Elite Fitness.Com. Sarms RAD140 and SR9009. Available online: http://www.elitefitness.com/forum/bodybuilding-chemistry-sarms-serms-peptides/sarms-rad140-sr9009-log-1422363.html (accessed on 25 January 2016).
- Handschin, C. Caloric restriction and exercise “mimetics’’: Ready for prime time? Pharmacol. Res. 2016, 103, 158–166. [Google Scholar] [CrossRef] [PubMed]
- Fan, W.; Atkins, A.R.; Yu, R.T.; Downes, M.; Evans, R.M. Road to exercise mimetics: Targeting nuclear receptors in skeletal muscle. J. Mol. Endocrinol. 2013, 51, T87–T100. [Google Scholar] [CrossRef] [PubMed]
- Geyer, H.; Parr, M.K.; Koehler, K.; Mareck, U.; Schänzer, W.; Thevis, M. Nutritional supplements cross-contaminated and faked with doping substances. J. Mass Spectrom. 2008, 43, 892–902. [Google Scholar] [CrossRef] [PubMed]
- Van Thuyne, W.; van Eenoo, P.; Delbeke, F.T. Nutritional supplements: Prevalence of use and contamination with doping agents. Nutr. Res. Rev. 2006, 19, 147–158. [Google Scholar] [CrossRef] [PubMed]
- Van Eenoo, P.; Delbeke, F.T. Metabolism and excretion of anabolic steroids in doping control—New steroids and new insights. J. Steroid Biochem. Mol. Biol. 2006, 101, 161–178. [Google Scholar] [CrossRef] [PubMed]
- Thevis, M.; Kuuranne, T.; Geyer, H.; Schänzer, W. Annual banned-substance review: Analytical approaches in human sports drug testing. Drug Test. Anal. 2013, 5, 1–19. [Google Scholar] [CrossRef] [PubMed]
- Esposito, S.; Deventer, K.; Goeman, J.; Van der Eycken, J.; Van Eenoo, P. Synthesis and characterization of the n-terminal acetylated 17–23 fragment of thymosin β 4 identified in TB-500, a product suspected to possess doping potential. Drug Test. Anal. 2012, 4, 733–738. [Google Scholar] [CrossRef] [PubMed]
- Esposito, S.; Deventer, K.; Van Eenoo, P. Characterization and identification of a C-terminal amidated mechano growth factor (MGF) analogue in black market products. Rapid Commun. Mass Spectrom. 2012, 26, 686–692. [Google Scholar] [CrossRef] [PubMed]
- Henninge, J.; Pepaj, M.; Hullstein, I.; Hemmersbach, P. Identification of CJC-1295, a growth-hormone-releasing peptide, in an unknown pharmaceutical preparation. Drug Test. Anal. 2010, 2, 647–650. [Google Scholar] [CrossRef] [PubMed]
- Kohler, M.; Thomas, A.; Walpurgis, K.; Terlouw, K.; Schänzer, W.; Thevis, M. Detection of his-tagged long-R-3-IGF-I in a black market product. Growth Horm. IGF Res. 2010, 20, 386–390. [Google Scholar] [CrossRef] [PubMed]
- Thomas, A.; Kohler, M.; Mester, J.; Geyer, H.; Schänzer, W.; Petrou, M.; Thevis, M. Identification of the growth-hormone-releasing peptide-2 (GHRP-2) in a nutritional supplement. Drug Test. Anal. 2010, 2, 144–148. [Google Scholar] [CrossRef] [PubMed]
- Thevis, M.; Schänzer, W. Synthetic anabolic agents: Steroids and nonsteroidal selective androgen receptor modulators. In Doping in Sports: Biochemical Principles, Effects and Analysis; Thieme, D., Hemmersbach, P., Eds.; Springer: Berlin/Heidelberg, Germany, 2010; Volume 195, pp. 99–126. [Google Scholar]
- Kohler, M.; Thomas, A.; Geyer, H.; Petrou, M.; Schänzer, W.; Thevis, M. Confiscated black market products and nutritional supplements with non-approved ingredients analyzed in the cologne doping control laboratory 2009. Drug Test. Anal. 2010, 2, 533–537. [Google Scholar] [CrossRef] [PubMed]
- Thevis, M.; Thomas, A.; Kohler, M.; Beuck, S.; Schänzer, W. Emerging drugs: Mechanism of action, mass spectrometry and doping control analysis. J. Mass Spectrom. 2009, 44, 442–460. [Google Scholar] [CrossRef] [PubMed]
- WADA (World Anti-Doping Agency). The 2016 Prohibited List, International Standard. Available online: https://wada-main-prod.s3.amazonaws.com/resources/files/wada-2016-prohibited-list-en.pdf (accessed on 4 January 2016).
- Brandon, E.F.A.; Raap, C.D.; Meijerman, I.; Beijnen, J.H.; Schellens, J.H.M. An update on in vitro test methods in human hepatic drug biotransformation research: Pros and cons. Toxicol. Appl. Pharmacol. 2003, 189, 233–246. [Google Scholar] [CrossRef]
- Scarth, J.P.; Spencer, H.A.; Timbers, S.E.; Hudson, S.C.; Hillyer, L.L. The use of in vitro technologies coupled with high resolution accurate mass LC-MS for studying drug metabolism in equine drug surveillance. Drug Test. Anal. 2010, 2, 1–10. [Google Scholar] [PubMed]
- WADA (World Anti-Doping Agency). Minimum Criteria for Chromatographic-Mass Spectrometric Confirmation of the Identity of Analytes for Doping Control Purposes. Available online: https://wada-main-prod.s3.amazonaws.com/resources/files/wada_td2015idcr_minimum_criteria_chromato-mass_spectro_conf_en.pdf (accessed on 20 October 2015).
- Timbrell, J. Metabolism of foreign compounds. In Introduction to Toxicology, 3rd ed.; Taylor & Francis: London, UK, 2002; Volume 3, pp. 39–56. [Google Scholar]
- Dominguez-Romero, J.C.; Garcia-Reyes, J.F.; Martinez-Romero, R.; Berton, P.; Martinez-Lara, E.; Del Moral-Leal, M.L.; Molina-Diaz, A. Combined data mining strategy for the systematic identification of sport drug metabolites in urine by liquid chromatography time-of-flight mass spectrometry. Anal. Chim. Acta 2013, 761, 1–10. [Google Scholar] [CrossRef] [PubMed]
- Deventer, K.; van Eenoo, P. Screening and confirmation of a glycerol-positive case. Drug Test. Anal. 2015, 7, 1009–1013. [Google Scholar] [CrossRef] [PubMed]
- Sobolevsky, T.; Dikunets, M.; Rodchenkov, G. Metabolism study of GSK4122, SR9009 and SR9011, new “exercise-in-a-pill” drug candidates. In Poster Presented at Manfred Donike Workshop—33rd Cologne Workshop on Dope Analysis (1–6 March 2015); MDI: Cologne, Germany, 2015. [Google Scholar]
- Eurachem. The Fitness for Purpose of Analytical Methods: A Laboratory Guide to Method Validation and Related Topics; Eurachem: Teddington, London, UK, 1998. [Google Scholar]
- WADA (World Anti-Doping Agency). International Standard for Laboratories, version 7.0; World Anti-Doping Agency (WADA): Montreal, QC, Canada, 2012. [Google Scholar]


| Compound | Fragment 1 | Chemical Formula | Polarity Mode | Calculated Mass (m/z) | Δ ppm 2 | Detected in Metabolites |
|---|---|---|---|---|---|---|
| SR9009/SR9011 | A | C5H3NO2S | + | 141.9957 | 2.58 | SR09-: 1; 5–8 |
| SR11-: 1–4; 7a/b/c; 8a/b; 9–11; 14 | ||||||
| SR9009 | B | C8H11NO2 | + | 154.0863 | 0.94 | SR09-: 1; 2; 6 |
| SR9011 | B’ | C11H20N2O | + | 197.1648 | 0.41 | / 3 |
| SR9009/SR9011 | C | C7H5Cl | + | 125.0153 | 3.96 | SR09-: 1; 2; 3(a/b/c); 4(a/b); 5; 7; 8 SR11-: 1–6; 9–13 |
| SR9009 | −C | C13H17N3O4S | + | 312.1013 | 1.78 | SR09-1 |
| − | 311.0945 | 1.30 | / 3 | |||
| −C−NO2 | C13H18N2O2S | − | 265.1016 | 1.25 | / 3 | |
| SR9011 | −C | C16H24N4O3S | + | 353.1642 | 1.99 | SR11-: 1; 7 |
| −C−D’ | C10H13N3OS | − | 239.0734 | 1.86 | SR11-: 1; 3; 9 | |
| −C−D’−NO2 | C10H14N2S | − | 193.0805 | 4.83 | SR11-: 1; 9 | |
| −D’+2H | C17H20N3O2ClS | + | 366.1038 | 2.18 | SR11-: 1–4; 9 | |
| SR9009/SR9011 | −E/E’ | C18H18N3O3ClS | + | 392.0830 | 2.08 | SR11-: 1–4 |
| SR9009/SR9011 | C+CNH4 | C8H8NCl | + | 154.0418 | 1.06 | SR09-: 3(b/c); 4b; 8 |
| SR11-: 1–6; 9–11; 13 | ||||||
| SR9009 | B−CH2 | C7H11NO2 | + | 142.0863 | 0.18 | SR09-: 2; 3(b/c); 4b |
| −B+CH2 | C13H11N2O2ClS | + | 295.0303 | 0.96 | SR09-: 1; 8 | |
| SR11-: 10; 11 | ||||||
| −A | C15H19N2O2Cl | + | 295.1208 | 0.72 | SR09-: 1; 3a/b/c | |
| SR9011 | B’−CH2 | C10H18N2O | + | 183.1492 | 0.49 | SR11-: 8b |
| SR9009/SR9011 | −C−E/E’ | C11H13N3O3S | + | 268.0750 | 0.12 | SR11-: 1, 2; 4; 7a/b; 8a; 9; 14 |
| Compound | Metabolic Modification 1 | Chemical Formula | [M + H]+ (∆ ppm) | Product Ion | ||||
|---|---|---|---|---|---|---|---|---|
| Polarity Mode | Exp m/z 2 | Chemical Formula | ∆ ppm 3 | Origin 1 | ||||
| SR09-1 | +OH | C20H24N3O5ClS | 454.1192 (0.94) | + | 172.0965 | C8H14NO3 | 1.68 | B+H2O |
| − | 327.0895 | C13H17N3O5S | 0.31 | −C+OH | ||||
| 281.0476 | C11H11N3O4S | 0.09 | −C−F+OH | |||||
| SR09-2 | −A | C15H21N2O2Cl | 297.1361 (1.08) | + | 251.0942 | C13H16N2OCl | 1.42 | −A−E |
| SR09-3 a | −A+OH | C15H21N2O3Cl | 313.1309 (1.36) | + | 251.0942 | C13H16N2OCl | 1.38 | −A−E−H2O |
| 225.1150 | C12H18N2Cl | 1.30 | −A−D−H2O | |||||
| 158.0811 | C7H12NO3 | 0.63 | B+CH2+OH | |||||
| SR09-3 b | 141.0100 | C7H6OCl | 1.12 | C+OH | ||||
| SR09-3 c | 267.0890 | C13H16N2O2Cl | 1.95 | −A−F−H2O | ||||
| SR09-4 a | −A+OH−H2 | C15H19N2O3Cl | 311.1148 (1.19) | + | 265.0731 | C13H14N2O2Cl | 0.85 | −F−H2O |
| SR09-4 b | 293.1046 | C15H18N2O2Cl | 1.88 | −H2O | ||||
| 265.0734 | C13H14N2O2Cl | 1.78 | −A−F−H2−H2O | |||||
| 170.0364 | C8H9NOCl | 1.75 | A+CH3NO | |||||
| SR09-5 | −B | C12H11N2O2SCl | 283.0297 (1.88) | + | see 4 | |||
| SR09-6 | −C+OH | C13H19N3O5S | 330.1112 (1.84) | + | 284.0694 | C11H14N3O4S | 2.05 | −C−F−H2O |
| 157.9904 | C5H4NO3S | 1.33 | A+OH | |||||
| SR09-7 | −D | C17H20N3O2ClS | 366.1031 (1.81) | + | see 4 | |||
| SR09-8 | −D+OH−H2 | C17H18N3O3ClS | 380.0826 (1.15) | + | 362.07120 | C17H17N3O2ClS | 1.36 | −H2O |
| Compound | Metabolic Modification 1 | Chemical Formula | [M + H]+ (∆ ppm) | Product Ion | ||||
|---|---|---|---|---|---|---|---|---|
| Polarity Mode | Exp m/z 2 | Chemical Formula | ∆ ppm 3 | Origin 1 | ||||
| SR11-1 | +OH | C23H31N4O4ClS | 495.1818 (1.84) | + | 181.1333 | C10H17N2O | 1.49 | B’−CH2−H2 |
| − | 368.1523 | C16H24N4O4S | 0.34 | −C+OH | ||||
| SR11-2 | +2OH | C23H31N4O5SCl | 511.1771 (1.09) | + | 242.0954 | C10H16N3O2S | 1.67 | −C−D’−2H2O |
| 215.1387 | C10H19N2O3 | 1.53 | B’−CH2−H2+2OH | |||||
| SR11-3 | −H2+OH | C23H29N4O4ClS | 493.1665 (1.24) | + | 475.1562 | C23H28N4O3ClS | 0.62 | −H2O |
| − | 366.1365 | C16H22N4O4S | 0.69 | −C+OH−H2 | ||||
| SR11-4 | −H2+2OH | C23H29N4O5ClS | 509.1616 (0.80) | + | 409.1091 | C18H22N4O3ClS | 1.06 | −F’−2H2O |
| 242.0952 | C10H16N3O2S | 2.33 | −C−D’−2H2O | |||||
| 227.1387 | C11H19N2O3 | 1.45 | B’+2OH−H2 | |||||
| 213.1230 | C10H17N2O3 | 1.59 | B’−CH2+2OH | |||||
| SR11-5 | −A+OH | C18H28N3O2Cl | 354.1932 (3.11) | + | 225.1147 | C12H18N2Cl | 2.81 | −A−D’−H2O |
| 197.1489 | C11H19N2O | 1.28 | B’ | |||||
| 144.1130 | C6H14N3O | 1.24 | B’−F’ | |||||
| SR11-6 | −A+OH−H2 | C18H26N3O2Cl | 352.1781 (1.59) | + | 225.1149 | C12H18N2Cl | 1.61 | −A−D’−H2O |
| 211.1436 | C11H19N2O2 | 2.29 | B’+OH-H2 | |||||
| 197.1280 | C10H17N2O2 | 2.20 | B’−CH2 +OH−H2 | |||||
| SR11-7 a/b | −C+OH | C16H26N4O4S | 371.1742 (1.52) | + | 242.0953 | C10H16N3O2S | 2.00 | −C−D’−H2O |
| 199.1438 | C10H19O2N2 | 1.63 | B’−CH2+OH | |||||
| SR11-7 c | 258.0903 | C10H16N3O3S | 1.51 | −C−D’+OH | ||||
| 229.1782 | C11H23N3O2 | 1.30 | B’+OH | |||||
| SR11-8 a | −C+OH−H2 | C16H24N4O4S | 369.1587 (1.20) | + | 285.1011 | C11H17N4O3S | 1.47 | −C−F’−H2O |
| 242.0953 | C10H16N3O2S | 1.67 | −C−D’−H2O | |||||
| SR11-8 b | 282.0538 | C11H12N3O4S | 1.89 | −C−E’+OH | ||||
| 256.0745 | C10H14N3O3S | 2.26 | −C−D’+OH | |||||
| SR11-9 | −F’ | C18H21N4O3ClS | 409.1088 (1.97) | + | 283.0853 | C11H15N4O3S | 2.15 | −F’−C |
| 251.0940 | C13H16N2OCl | 2.90 | −A−E’ | |||||
| SR11-10 | −F’+OH | C18H21N4O4ClS | 425.1051 (1.39) | + | 364.0876 | C17H18N3O2ClS | 1.41 | −D’−H2O |
| 237.0786 | C12H14N2OCl | 1.17 | −A−D’+OH | |||||
| 194.0729 | C6H14N2O3S | 4.92 | A+CH2+OH | |||||
| SR11-11 | −F’−H2 | C18H19N4O3ClS | 407.0932 (1.83) | + | 266.0588 | C11H12N3O3S | 2.06 | −C−E’−H2 |
| 249.0784 | C13H14N2OCl | 2.20 | −A−E’−H2 | |||||
| SR11-12 | −F’−H2+OH | C18H19N4O4ClS | 423.1621 (1.94) | + | 380.0823 | C17H19N3O3ClS | 1.86 | −D’+OH |
| 282.0537 | C11H12N3O4S | 2.21 | −C−E’+OH | |||||
| 256.0746 | C10H14N3O3S | 2.03 | −C−D’+OH | |||||
| SR11-13 | −F’−A | C13H18N3OCl | 268.1205 (2.15) | + | 225.1149 | C12H18N2Cl | 1.66 | −A−D’ |
| SR11-14 | −F’−C | C11H16N4O3S | 285.1011 (1.57) | + | see 4 | |||
© 2016 by the authors; licensee MDPI, Basel, Switzerland. This article is an open access article distributed under the terms and conditions of the Creative Commons Attribution (CC-BY) license (http://creativecommons.org/licenses/by/4.0/).
Share and Cite
Geldof, L.; Deventer, K.; Roels, K.; Tudela, E.; Van Eeno, P. In Vitro Metabolic Studies of REV-ERB Agonists SR9009 and SR9011. Int. J. Mol. Sci. 2016, 17, 1676. https://doi.org/10.3390/ijms17101676
Geldof L, Deventer K, Roels K, Tudela E, Van Eeno P. In Vitro Metabolic Studies of REV-ERB Agonists SR9009 and SR9011. International Journal of Molecular Sciences. 2016; 17(10):1676. https://doi.org/10.3390/ijms17101676
Chicago/Turabian StyleGeldof, Lore, Koen Deventer, Kris Roels, Eva Tudela, and Peter Van Eeno. 2016. "In Vitro Metabolic Studies of REV-ERB Agonists SR9009 and SR9011" International Journal of Molecular Sciences 17, no. 10: 1676. https://doi.org/10.3390/ijms17101676
APA StyleGeldof, L., Deventer, K., Roels, K., Tudela, E., & Van Eeno, P. (2016). In Vitro Metabolic Studies of REV-ERB Agonists SR9009 and SR9011. International Journal of Molecular Sciences, 17(10), 1676. https://doi.org/10.3390/ijms17101676