Article

Single-Stage Operation of Hybrid Dark-Photo Fermentation to Enhance Biohydrogen Production through Regulation of System Redox Condition: Evaluation with Real-Field Wastewater

1
Bioengineering and Environmental Sciences (BEES), CSIR-Indian Institute of Chemical Technology (CSIR-IICT), Hyderabad 500 007, India
2
Academy of Scientific and Innovative Research (AcSIR), CSIR-Indian Institute of Chemical Technology (CSIR-IICT), Hyderabad 500 007, India
*
Author to whom correspondence should be addressed.
Int. J. Mol. Sci. 2015, 16(5), 9540-9556; https://doi.org/10.3390/ijms16059540
Submission received: 10 March 2015 / Revised: 16 April 2015 / Accepted: 20 April 2015 / Published: 28 April 2015
(This article belongs to the Special Issue Photosynthesis and Biological Hydrogen Production)

Abstract

:
Harnessing hydrogen competently through wastewater treatment using a particular class of biocatalyst is indeed a challenging issue. Therefore, biohydrogen potential of real-field wastewater was evaluated by hybrid fermentative process in a single-stage process. The cumulative hydrogen production (CHP) was observed to be higher with distillery wastewater (271 mL) than with dairy wastewater (248 mL). Besides H2 production, the hybrid process was found to be effective in wastewater treatment. The chemical oxygen demand (COD) removal efficiency was found higher in distillery wastewater (56%) than in dairy wastewater (45%). Co-culturing photo-bacterial flora assisted in removal of volatile fatty acids (VFA) wherein 63% in distillery wastewater and 68% in case of dairy wastewater. Voltammograms illustrated dominant reduction current and low cathodic Tafel slopes supported H2 production. Overall, the augmented dark-photo fermentation system (ADPFS) showed better performance than the control dark fermentation system (DFS). This kind of holistic approach is explicitly viable for practical scale-up operation.

Graphical Abstract

1. Introduction

Recently, a great deal of attention has been paid to the biological production of hydrogen (H2) as alternative and eco-friendly fuel throughout the world [1,2]. Microbial conversion of substrate to H2 and volatile fatty acid (VFA) by anaerobic fermentation is a complex series of biochemical reactions manifested by diverse group of selective bacteria [3,4]. Accumulation of organic acid metabolites inhibits the H2 production process and makes the H2 production process unfavorable by limiting the substrate degradation. Further utilization of the organic acids towards H2 production is thermodynamically feasible only if there is an additional energy input [5]. This energy input can be in the form of electricity in microbial electrolysis cell (MEC) [6,7,8] or in the form of light in two-stage photofermentation [9,10] or augmentation of photosynthetic bacteria with dark fermentative culture in a single-stage hybrid system [11]. Photofermentataion can be carried out with a wide variety of organic substrates such as carbohydrates; lactate, malate, benzoate and sucrose which are utilized by different species of phototrophic bacteria as electron donors for H2 production [12,13,14,15].
Exploitation of wastewater as substrate for H2 production with concurrent wastewater treatment is an attractive and effective way of tapping clean energy from renewable resources in a sustainable approach. This provides dual environmental benefits in the direction of wastewater treatment along with sustainable bioenergy (H2) generation [16]. Molasses-based distilleries generate 8–15 L of wastewater having high chemical oxygen demand (COD) (100–126 g/L) for every litre of the alcohol produced [17]. Distillery wastewater generated in the form of spent wash or spillage is one of the most complex and strongest industrial organic effluents. It possesses high concentration of biodegradable organic material, such as sugars, lignin, hemicelluloses, dextrin, resins and organic acids [18]. Dairy wastewater contains complex organics, such as polysaccharides, proteins and lipids, which on hydrolysis form sugars, amino acids, and fatty acids [19]. In subsequent acidogenic reaction, these intermediate products are converted to volatile fatty acids (VFA), which are further degraded by acetogens, forming VFA, CO2, and H2. High organic load and persistent color associated with the distillery and wastewater pose a serious problem to the environment and treatment of such kind of wastewater is challenging [20]. The technologies currently used by distilleries and dairies for treatments of wastewater are biomethanation followed by two-stage biological treatment, concentration and incineration [18]. High organic load, absence of toxic chemicals and availability of large quantities of wastewater may be considered as potential sources for biohydrogen production by integration [21,22]. In this context, a hybrid strategy comprising dark-photofermentation was investigated using designed synthetic wastewater (DSW) as previously reported [11]. In this study, an attempt was made to harvest biohydrogen using real field wastewater (distillery and dairy wastewater obtained from brewery and milk processing industries, respectively) by combining dark and photo-fermentation in a single stage hybrid system using mixed anaerobic bacteria and photosynthetic bacteria.

2. Result and Discussion

2.1. Bio-Hydrogenesis

2.1.1. Dark-Fermentation (DFS)

The experimental data depicted feasibility of H2 production by utilizing distillery and dairy wastewater as substrate (Figure 1). Acidogenesis of distillery wastewater in control (CDi) resulted in H2 production with an initial value of 84 mL during the start-up phase and thereafter gradually increased with cycle operation and reached a maximum consistent value of 133 mL. A similar trend of acidogenesis was observed when the control (CDa) was operated with dairy wastewater. During start-up, the CDa reactor produced 7 mL, and thereafter gradually increased to a maximum of 144 mL. Steady increments in the H2 evolution is attributed to the acclimatization and enrichment of H2 producing acidogenic bacteria. These experimental results evidenced relatively higher H2 production with distillery wastewater than dairy wastewater because of high carbohydrate content in distillery compared with high protein and fat content in dairy waste. Dark-fermentation process involves VFA production as co-metabolites during conversion of organic substrates to H2 (Equations (1)–(3)) [3]. The production of VFA affects the buffering capacity that can inhibit the functioning of acidogenic bacteria; perhaps the decline in HPR was consequently noticed.
C6H12O6 + 2H2O → 2CH3COOH + 2CO2 + 4H2
C6H12O6 + 2H2O → CH3CH2CH2COOH + 2CO2 + 2H2
3C6H12O6 → 4CH3CH2COOH + 2CH3COOH + 2CO2 + 2H2O
Figure 1. Temporal profile of Cumulative Hydrogen production (CHP) in dark-fermentative system (DFS-CDi, CDa) and augmented dark-photo fermentative system (ADPFS-EDi, EDa) as function of time with dairy and distillery wastewater.
Ijms 16 09540 g001

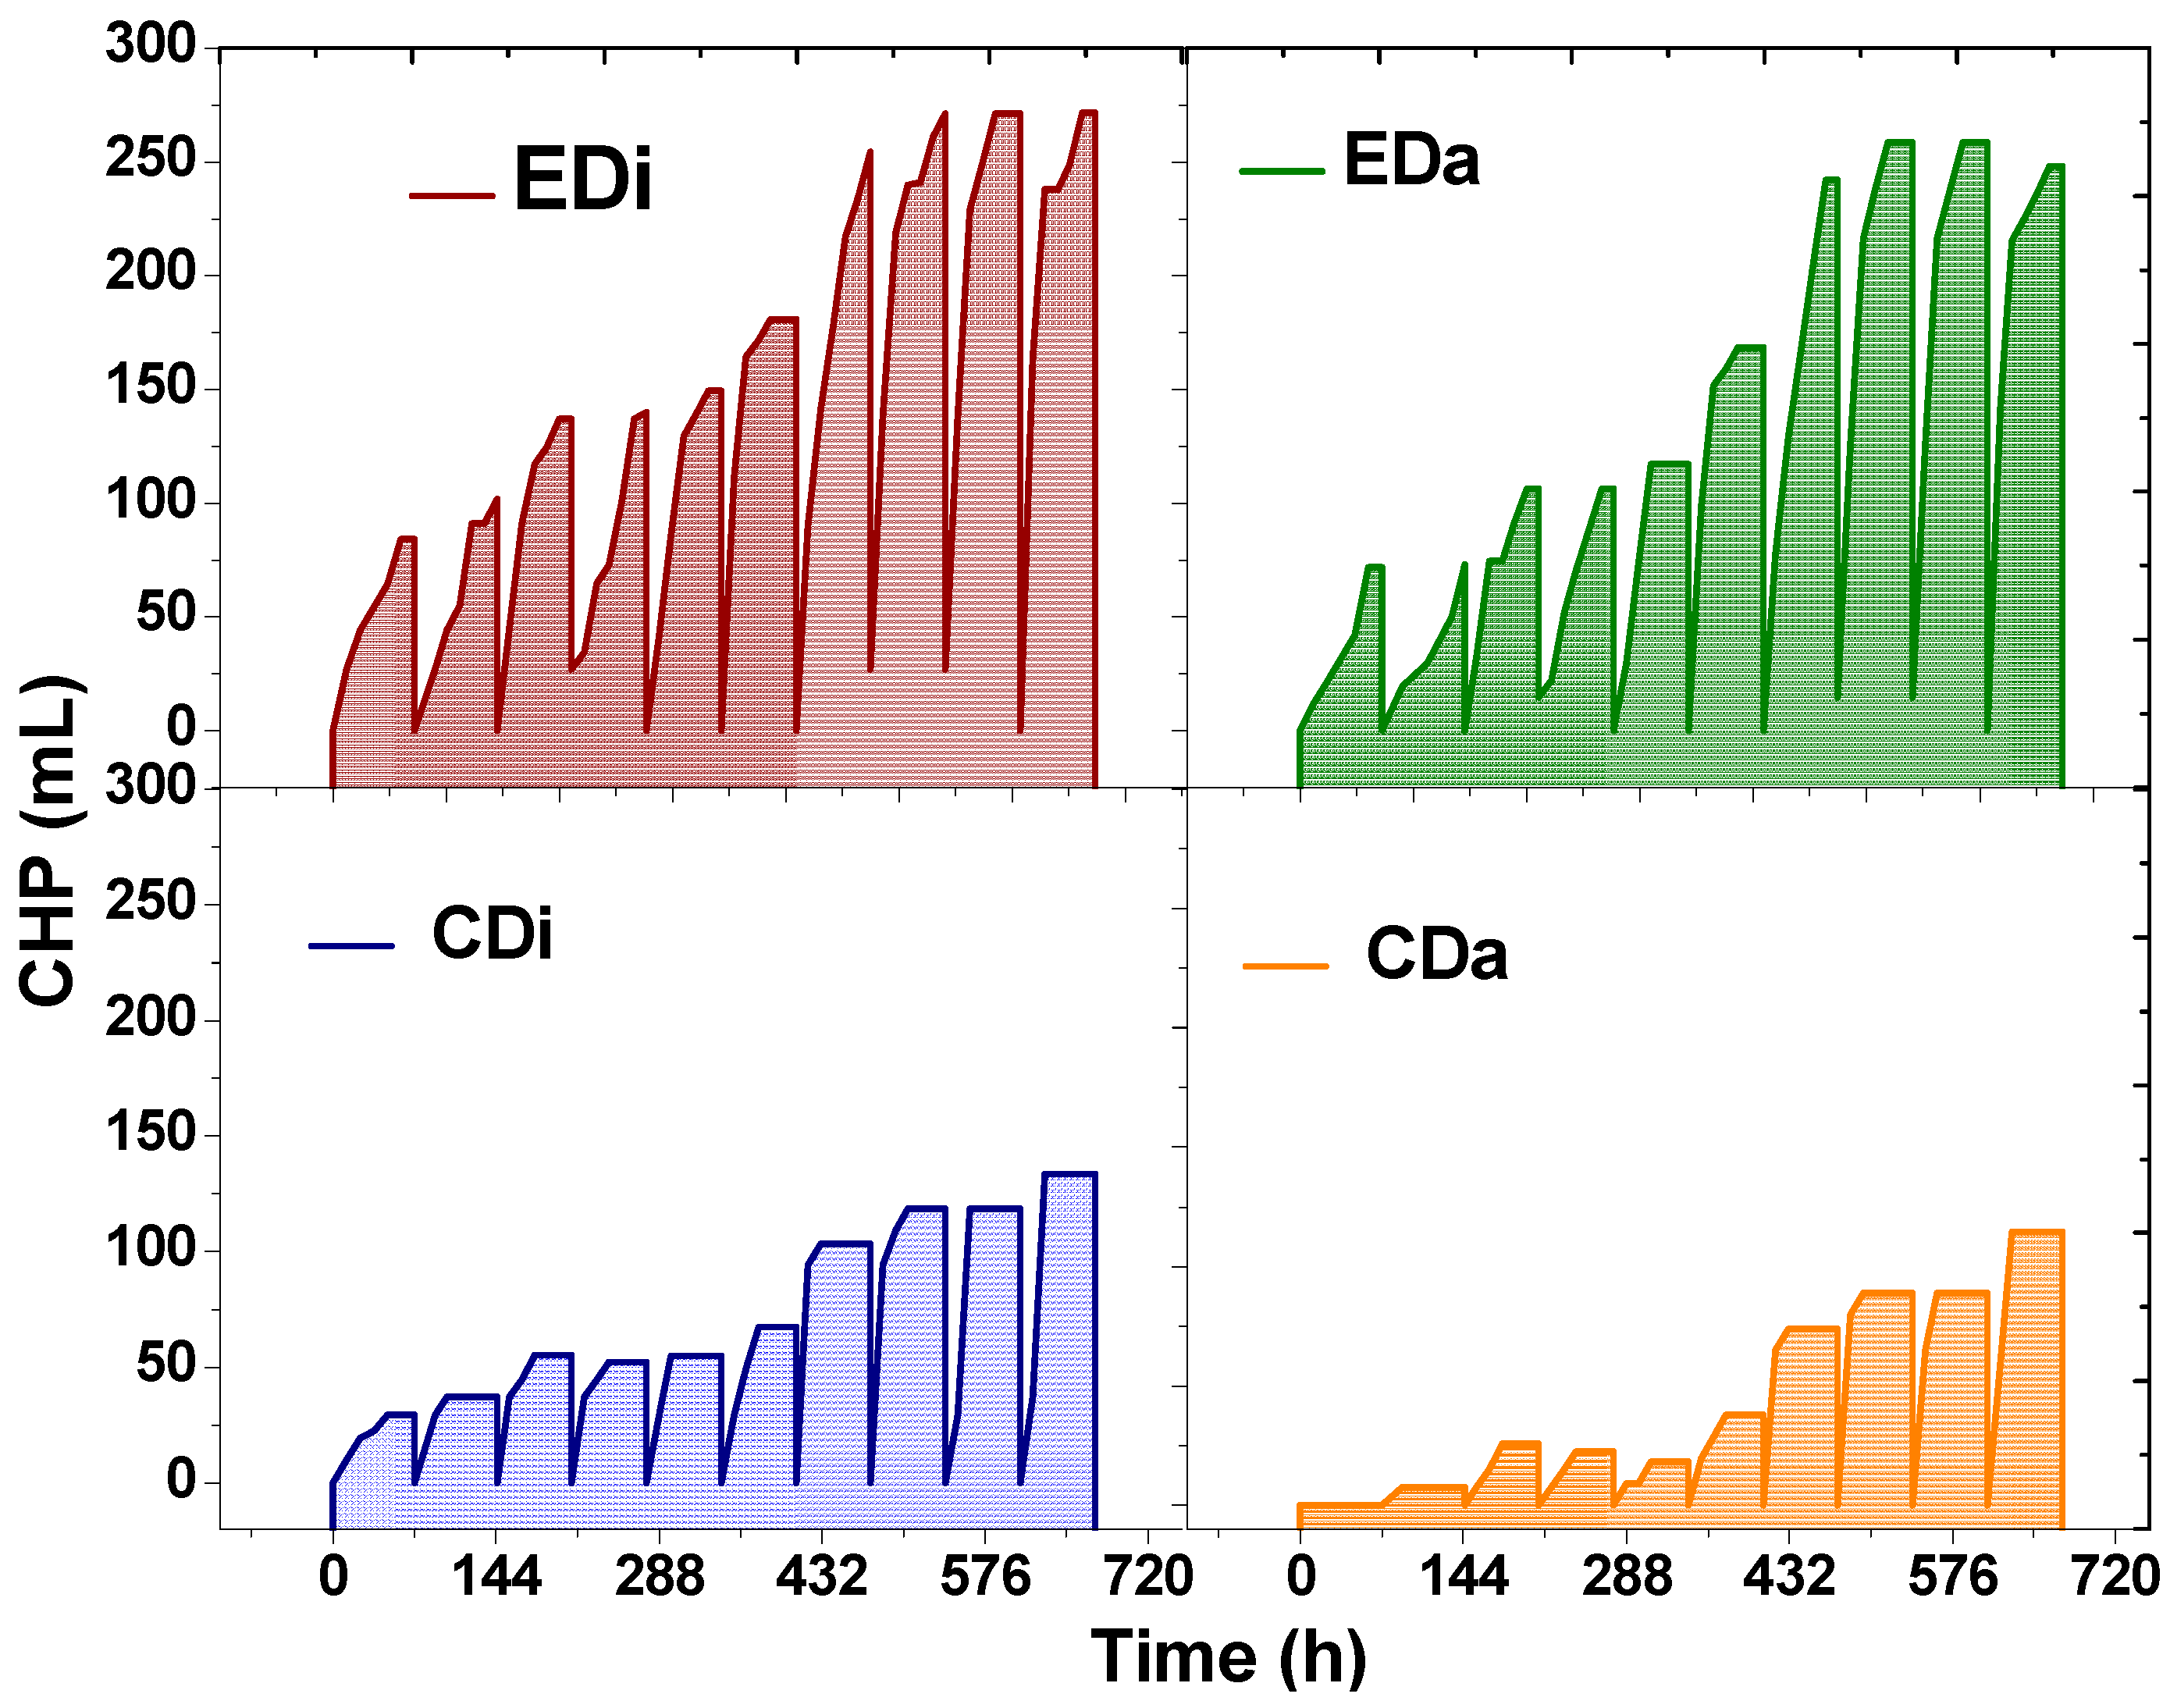
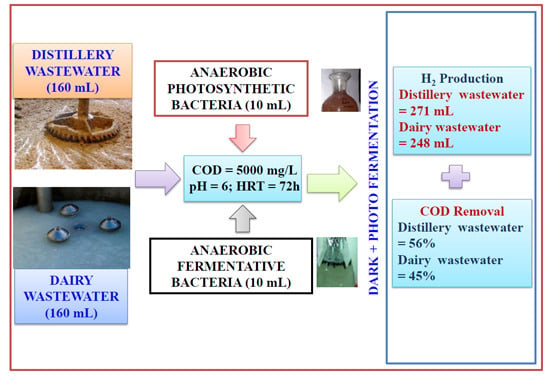
2.1.2. Hybrid Dark-Photo Fermentation

Another set of experiments (EDi and EDa) were carried out where dark fermentation was augmented with photosynthetic bacteria (PSB) (Figure 1). This is designed as hybrid dark-photo fermentation system (ADPFS) operated in a single stage with both the wastewaters, separately. A remarkable performance was noticed with ADPFS relative to controls. Comparing both augmented systems, cumulative H2 was noted as higher in EDi (271 mL) than in EDa (248 mL), which is almost double than the controls (CDi, 133 mL and CDa, 114 mL). In the ADPFS, an interesting observation was noticed i.e., the H2 production was maximum at the 48th h unlike in the control at 24th h. Higher H2 production with ADPFS can be attributed to the co-existence of photosynthetic bacteria with dark-fermentative microflora, which facilitates dark fermentation as well as photofermentataion. The increased duration of H2 production is attributed to the role of PSB which are competent in VFA consumption thereby minimizing the acidic stress. The short-chain organic acids (VFA) released during dark-fermentation gets further metabolized to H2 by photosynthetic bacteria thereby resulting in higher H2 production. Theoretically one mole of acetate can produce four moles of H2 while one mole of butyrate can produces 10 moles of H2 by photofermentation (Equations (4)–(6)) [3,11]. However, the H2 production efficiency and yield was found to depend on the type of wastewater and amount of organic content which is biodegradable.
2CH3COOH + Light→ 2CO2 + 4H2
CH3CH2CH2COOH + 3H2O + Light → 4CO2 + 10H2
HCOOH + Light → CO2 + H2

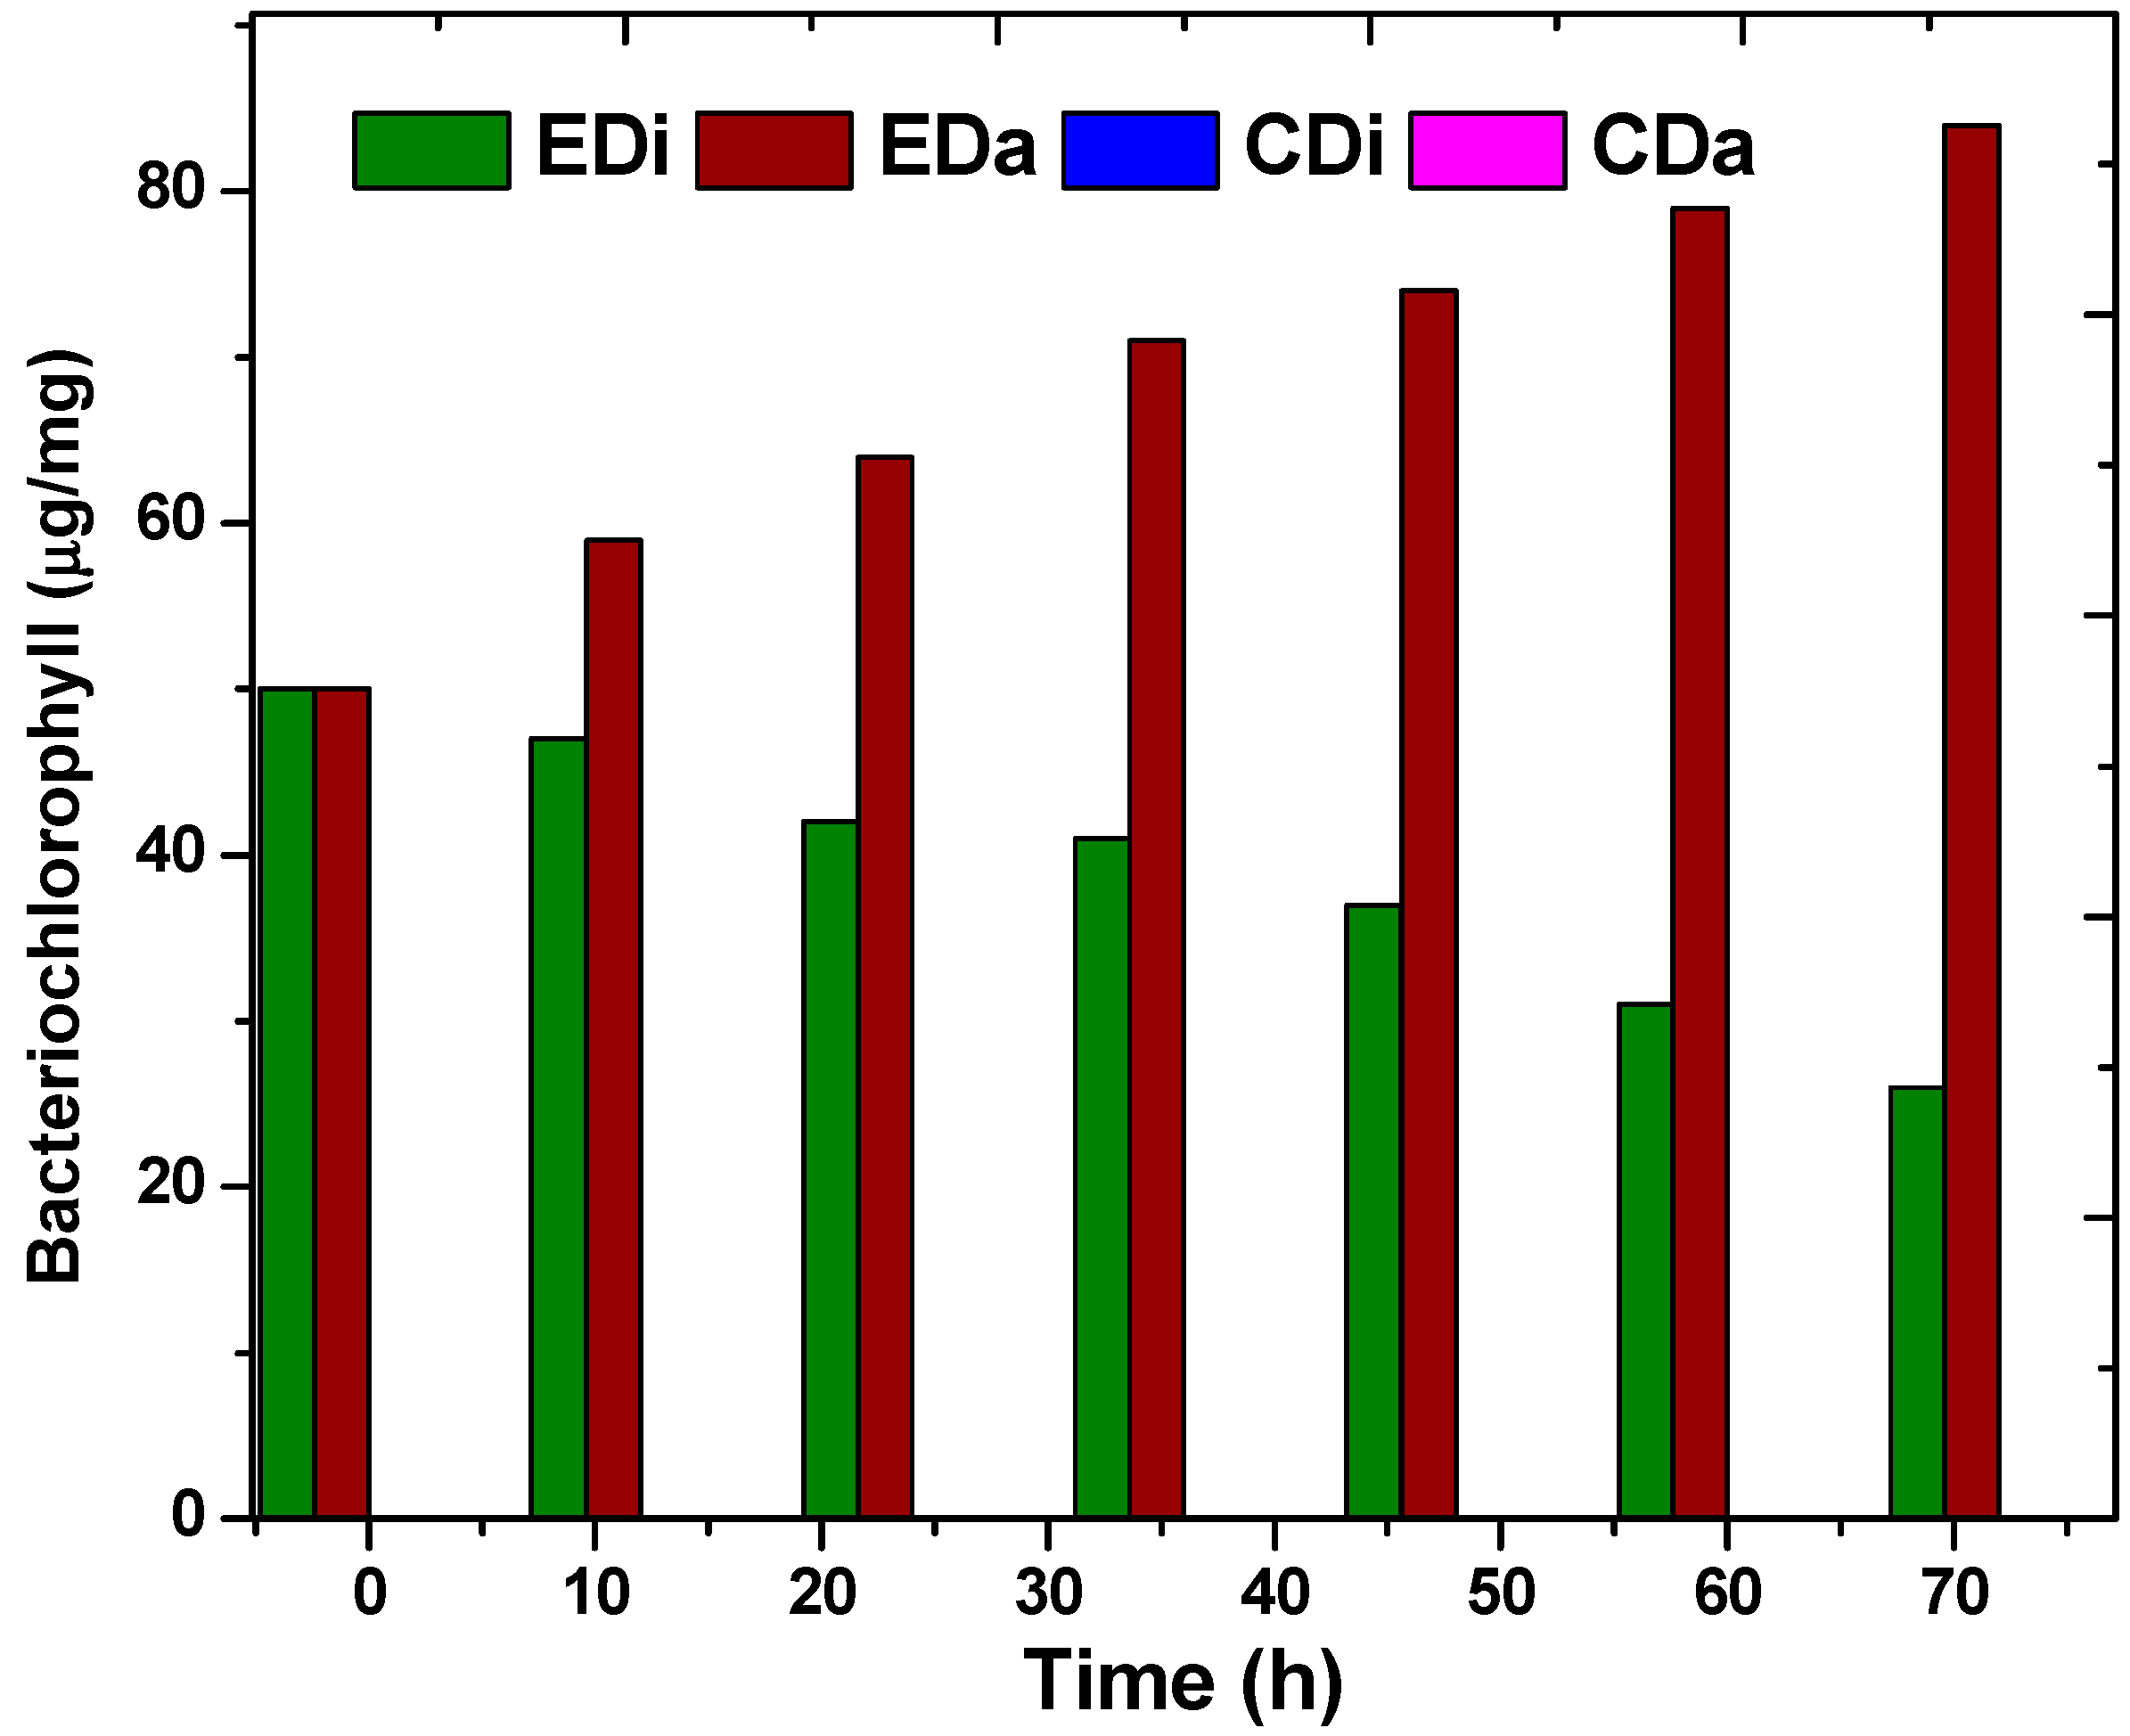
2.2. Pigments and Biomass

Biomass concentration of photosynthetic bacteria was calculated indirectly via bacteriochlorophyll estimation. Bacteriochlorophyll (BChl) is a pyrrole derivative specific to photosynthetic bacteria and plays a major role in anoxygenic photosynthesis [23]. To confirm the growth of photosynthetic bacteria during ADPFS operation of all experimental variants, BChl was analyzed (Figure 2). Control systems (CDi and CDa) did not contain PSB throughout the study. On the other hand, augmented systems (EDi and EDa) showed growth of PSB. Among the two experimental runs, EDa showed significant increments in photosynthetic BChl over a cyclic operation and a maximum of 84 µg/mg at 72 h was noticed. Dairy wastewater is rich in protein and is a good source of nitrogen for the PSB biomass growth (Figure 3). However, in the case of the EDi system, a decline in PSB growth was noticed at the end of each cycle. Therefore, prior to the start of each batch, a fixed inoculum volume of 10 mL was added to the ADPFS and at the end of the batch 26 µg/mg (72 h) was noted. The deficiency in PSB growth is possibly attributed to the absence of protein in distillery wastewater. Besides, the decrease in PSB biomass is attributed to the acidic shock caused by VFA present in the system. BChl is pH sensitive and at acidic pH structural and functional aspects of BChl to PhBChl was previously reported [11]. In the present experiment, the pH drop and VFA present in the system was sufficient to trigger pheophytinization of the Bchl which automatically hinders bacterial photosynthetic activity. Pheophytinization is a bio-physio-chemical process where at low pH and high proton (H+) concentration, the central metal ion (Mg2+) of BChl gets bleached out and is replaced by H+ ion [11,24,25,26]. Decrease in pH was noticed in DFS (CDi and CDa) due to anaerobic fermentation and release of VFA. But, in case of hybrid ADPFS (EDi and EDa) the pH increase was noticed due to the consumption of VFA (Figure 4). In this regard, to revive the batch, an aliquot of PSB inoculum was added to the system.
Figure 2. Pigment analysis (bacteriochlorophyll) of dark-fermentative system (DFS-CDi, CDa) and augmented dark-photo fermentative system (ADPFS-EDi, EDa) as function of time with distillery and dairy wastewater.
Ijms 16 09540 g002
Figure 3. Variation in protein content in dark-fermentative system (DFS-CDi, CDa) and augmented dark-photo fermentative system (ADPFS-EDi, EDa) as a function of time with distillery and dairy wastewater.
Ijms 16 09540 g003
Figure 4. Changes in pH profile as function of time with dairy and distillery wastewater in dark-fermentative system (DFS-CDi, CDa) and augmented dark-photo fermentative system (ADPFS-EDi, EDa).
Ijms 16 09540 g004

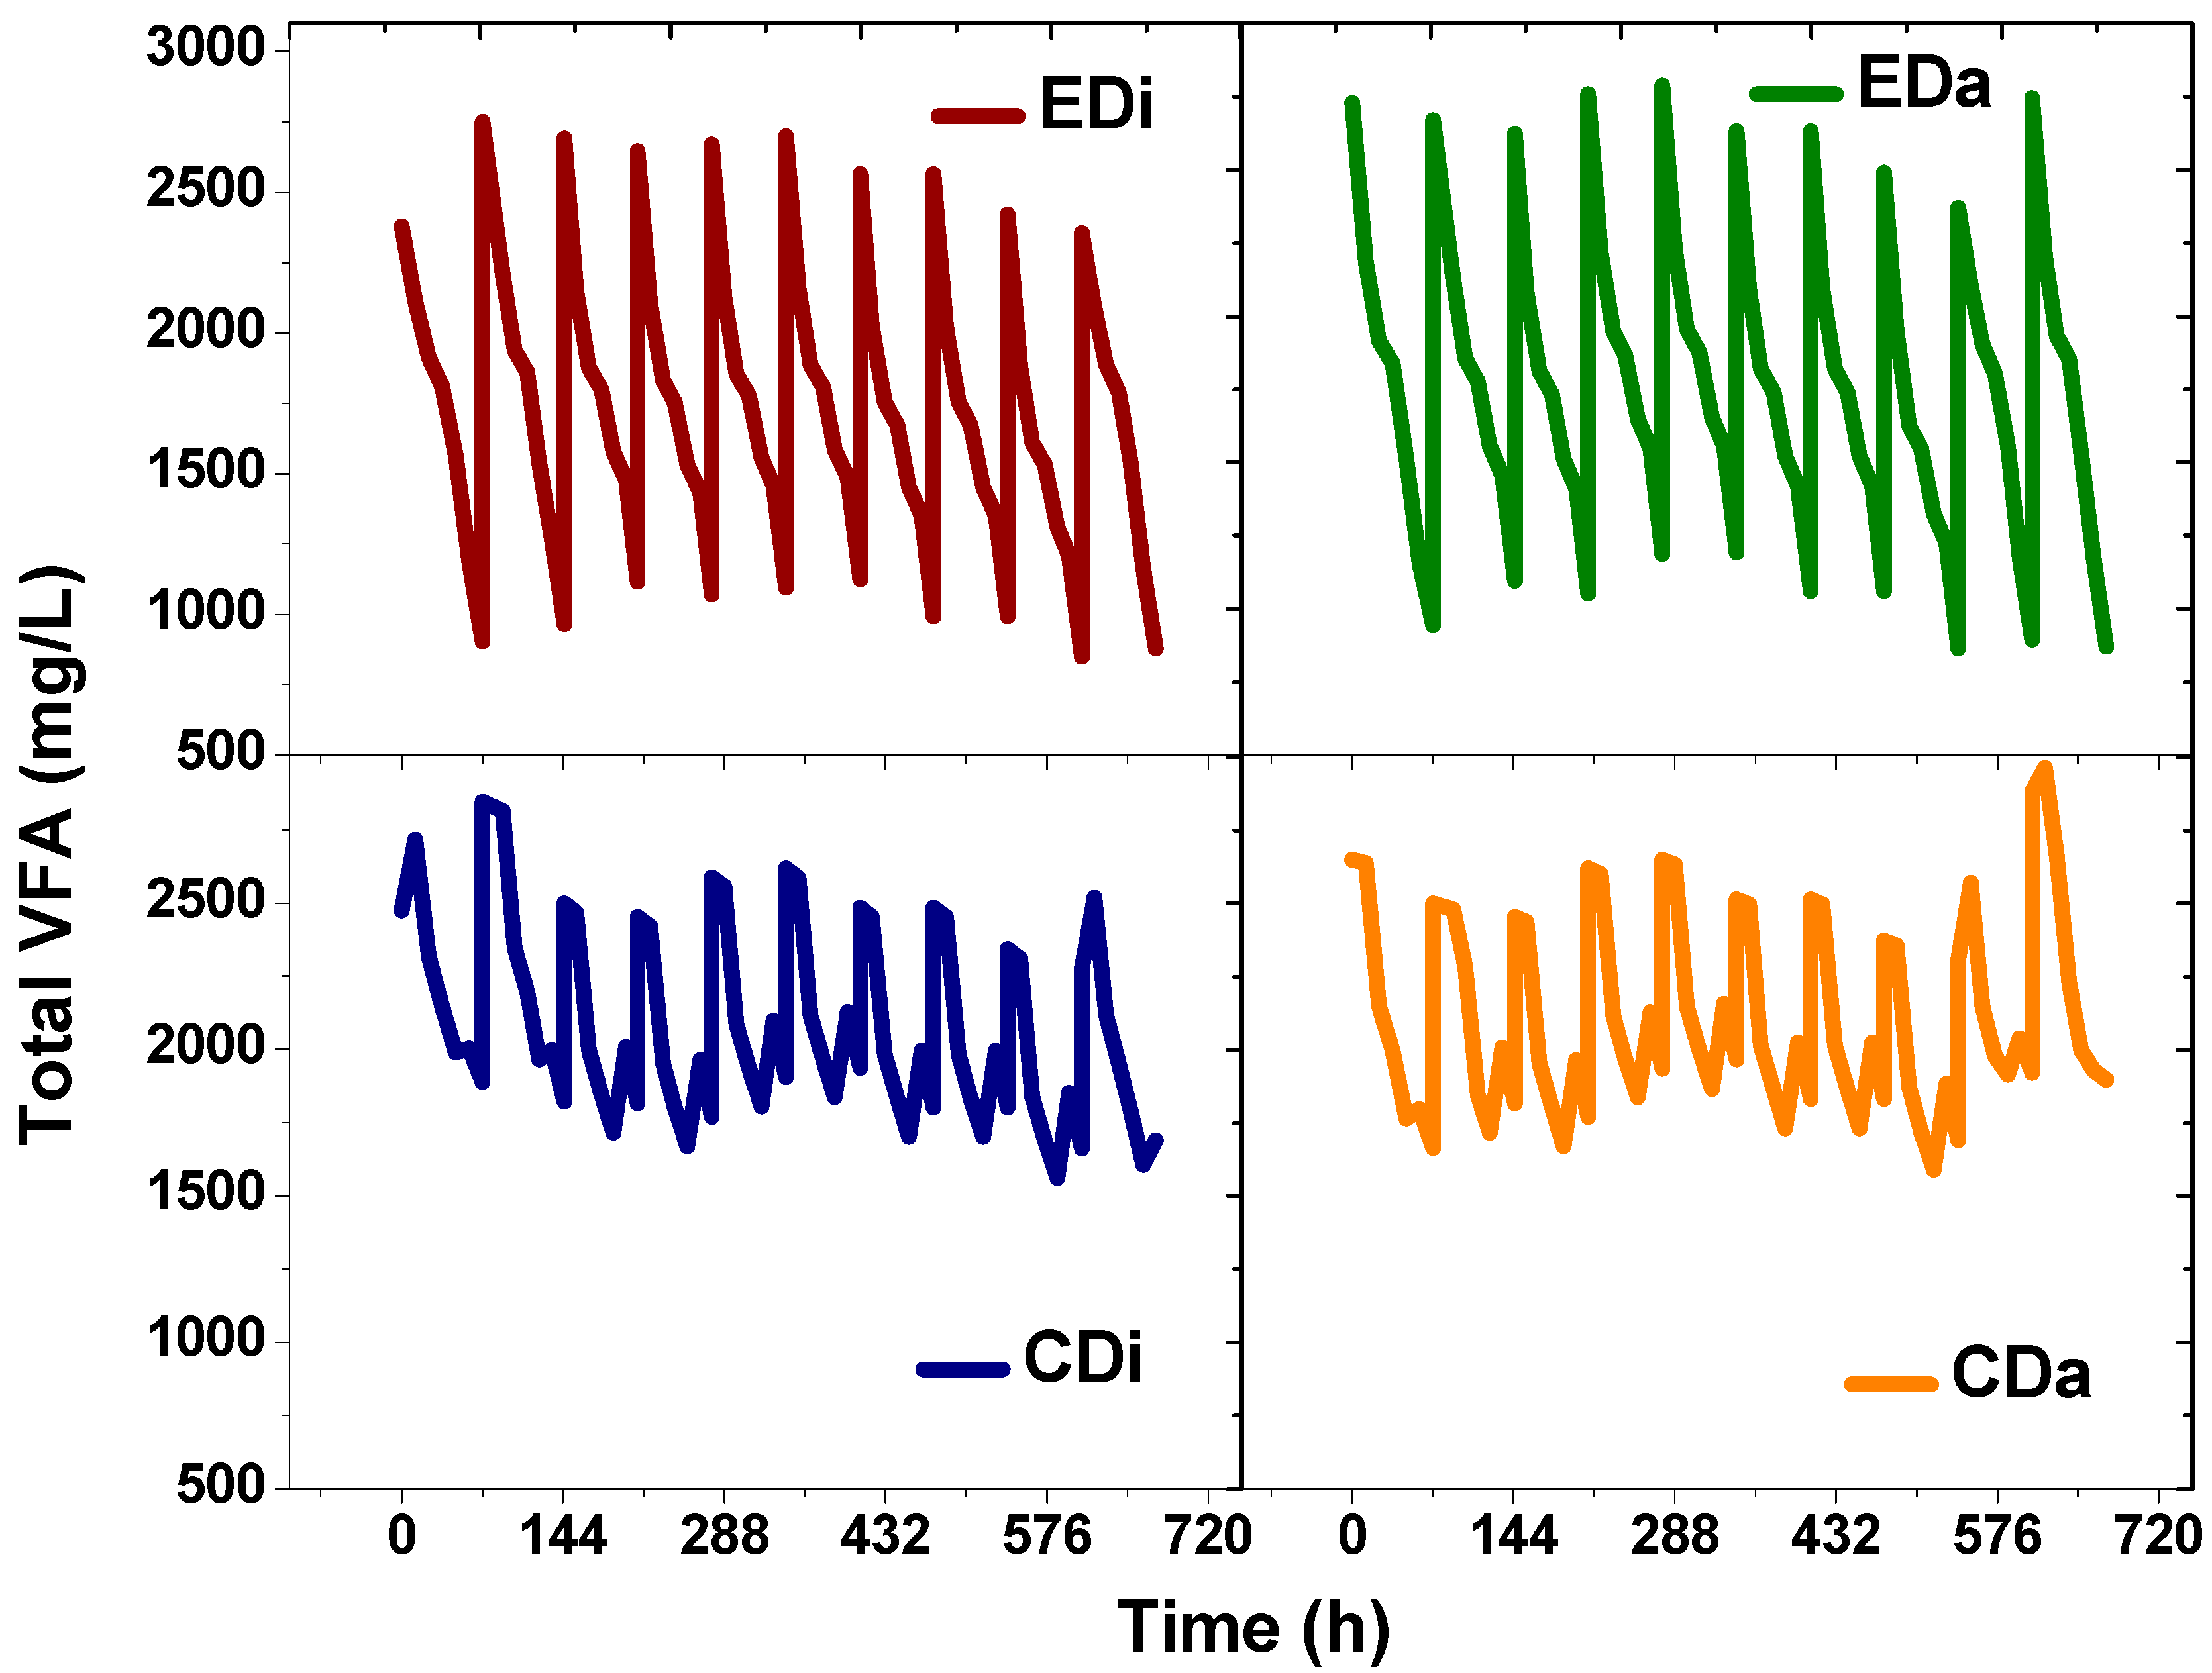
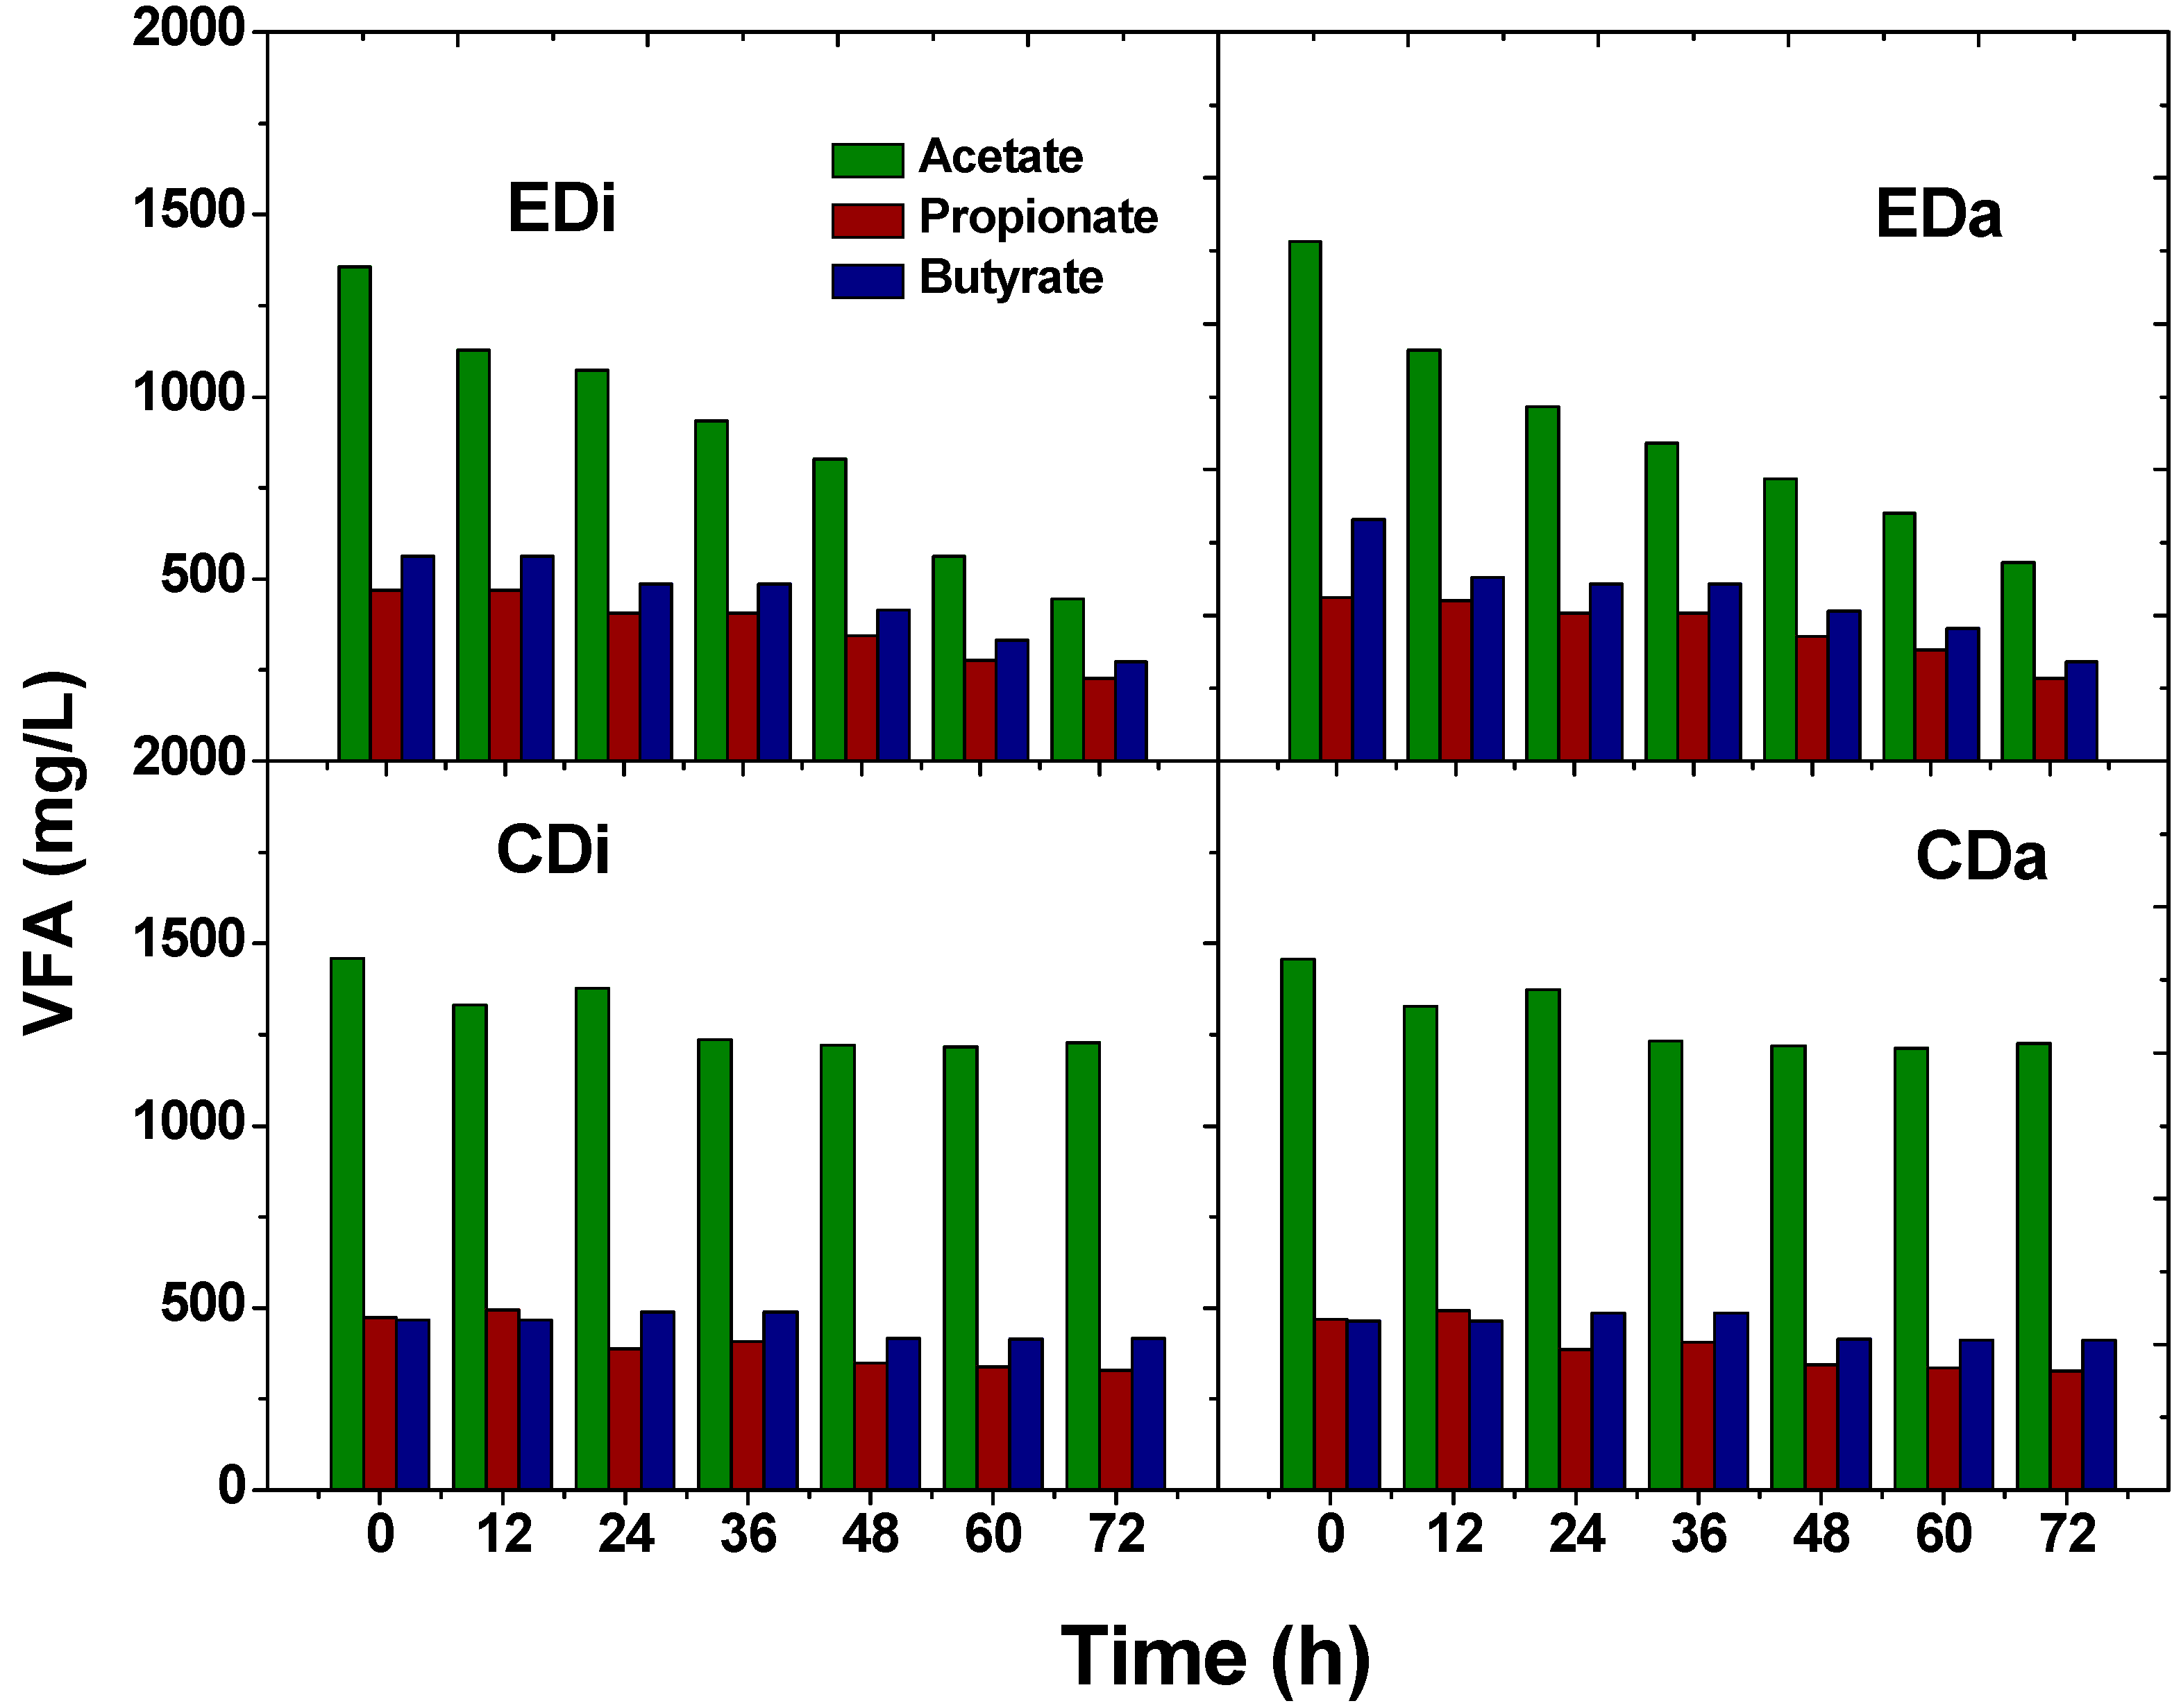
2.3. Total Volatile Fatty Acids and Composition

Both the wastewaters contained a certain amount of VFA prior to the start-up of experiments; distillery wastewater (2500 ± 200 mg/L) and dairy wastewater (2744 ± 200 mg/L). Thereafter, when fed to control systems (CDi and CDi) and ADPFS (EDi and EDa) changes in total VFA concentration and its composition were observed. In CDi operation, VFA concentration increased to a maximum value of 2519 ± 200 mg/L at 12 h and thereafter decreased to 1690 mg/L at the end of the batch. Similarly, in CDa, VFA increased to a maximum value of 2962 mg/L at 12 h and thereafter declined to 1898 mg/L at the end of the batch. These variations were much seen in case of EDi and EDa where the initial/final total VFA concentrations were 2356/880 and 2744/872 mg/L, respectively (Figure 5). VFA production is associated with conversion of organic fraction to acid intermediates in the anaerobic microenvironment. Change in the concentration of acid metabolites can affect the system buffering capacity and higher acid concentrations will inhibit the function of acidogenic bacteria specifically, H2 production. Therefore, individual composition was also analyzed using HPLC which assists in tracking the biochemical pathway of the biocatalyst during process operation. Acetate or butyrate pathway favors H2 production, while propionic acid is not as favorable for H2 production [27]. In the present study, a higher proportion of acetic acid along with butyric acid and propionic acid was observed in the controls (CDi and CDa). Initial concentrations of observed VFA (CDi-acetate, 1457 mg/L; propionate, 469 mg/L; butyrate, 463 mg/L; CDa-acetate, 1459 mg/L; propionate, 472 mg/L; butyrate, 466 mg/L) were changed by the end of the batch (CDi-acetate, 1225 mg/L; propionate, 327 mg/L; butyrate, 412 mg/L; CDa-acetate, 1228 mg/L; propionate, 330 mg/L; butyrate, 415 mg/L) (Figure 6). The temporal profile of these acids did not show much variation indicating the inefficiency of the dark-fermentative consortia. However, a remarkable change in the acid composition profile was noticed in the same wastewaters when fed to the experimental set-up inoculated with PSB The initial concentrations of acetic, butyric and propionic were (EDi-acetate, 1357 mg/L; propionate, 469 mg/L; butyrate, 563 mg/L; EDa-acetate, 1427 mg/L; propionate, 449 mg/L; butyrate, 663 mg/L) decreased by the end of the batch (EDi-acetate, 445 mg/L; propionate, 227 mg/L; butyrate, 272 mg/L; CDa-acetate, 545 mg/L; propionate, 227 mg/L; butyrate, 272 mg/L). VFA removal was about 62% in the EDi system and 68% in the EDa system. Remarkably, total VFA in ADPFS removed about 50% less than control DFS. The above experiment (ADPFS) documented the functional role of PSB in utilizing the VFA for its growth and maintenance. Interestingly, dairy wastewater showed higher removal of VFA in spite of less H2 production which was due to the utilization of these VFAs towards the biomass production. Besides, dairy wastewater contains high protein content which is a good nitrogen source for PSB growth. Although VFA removal was observed in distillery wastewater, PSB growth declined with batch time and also the protein content was minimal, which supports maintenance but not growth [3,11].
Figure 5. Total volatile fatty acids (VFA) profile in dark-fermentative system (DFS-CDi, CDa) and augmented dark-photo fermentative system (ADPFS-EDi, EDa) as a function of time with dairy and distillery wastewater.
Ijms 16 09540 g005
Figure 6. Compositional analysis of volatile fatty acids composition as a function of time with distillery and dairy wastewater in dark-fermentative system (DFS-CDi, CDa) and augmented dark-photo fermentative system (ADPFS-EDi, EDa).
Ijms 16 09540 g006

2.4. Substrate Degradation

Substrate degradation efficiencies (based on COD) showed variation as a function of biocatalyst and complexity of wastewater. EDi operation showed COD removal efficiency of 18% at the 12th h which improved with time (24 h-24.32%, 36 h-43.52%; 48 h-50.80%; 60 h-56.80%) and approached a maximum value of 56.8% at the 72nd h. EDa operation showed COD removal efficiency of 14% at the 12th h which improved with time (24 h-21.72%, 36 h-29.81%; 48 h-37.69%; 60 h-41.31%) and approached a maximum value of 45.42% at 72nd h. CDi operation showed COD removal efficiency of 5.36% at the 12th h which improved with time (24 h-17.31%, 36 h-31.20%; 48 h-34.69%; 60 h-39.63%) and approached a maximum value of 39.63% at 72nd h. CDa operation showed COD removal efficiency of 6.89% at the 12th h which improved with time (24 h-10.85%, 36 h-16.84%; 48 h-20.84%; 60 h-28.84%) and approached a maximum value of 35.42% at the 72nd h (Figure 7). Almost 20% increment in substrate degradation efficiency was observed with augmented operation which also demonstrated the effective functioning of photosynthetic consortia in treating wastewater. CDi and CDa operation showed comparatively lower substrate degradation. Microbial fermentation generates energy-rich reducing power (NADH, etc.), which subsequently gets re-oxidized during respiration with simultaneous generation of biological energy molecules (ATP) in the presence of a terminal electron acceptor (TEA). Anaerobic respiration has the ability to utilize a wide range of organic compounds by the acidogenic pathway and generates VFA in association with H2. Hydrogenase plays an important role for the generation of H2. Under anaerobic conditions, photosynthetic bacteria use sunlight as a source of energy and produce H2 and CO2 by degrading organic molecules [1]. The observed higher H2 production in hybrid system might be attributed to consumption of VFA by photosynthetic consortia towards additional H2. Light absorption by bacteriochlorophyll (BChl) molecules initiates e transfer from a reaction center to quinine pool (QA) and then to the cytochrome subunit for generating a H+ gradient, which finally gets reduced to H2. The ability of PSB to trap energy over a wide range of the light spectrum without producing oxygen and its versatility in utilizing various substrates like acetate, butyrate and propionate makes the hybridization of photo fermentation with dark fermentation a feasible and viable approach [2,11,28,29].
Figure 7. Substrate utilization in terms of chemical oxygen demand (COD) removal as function of time with distillery and dairy wastewater in dark-fermentative system (DFS-CDi, CDa) and augmented dark-photo fermentative system (ADPFS-EDi, EDa).
Ijms 16 09540 g007

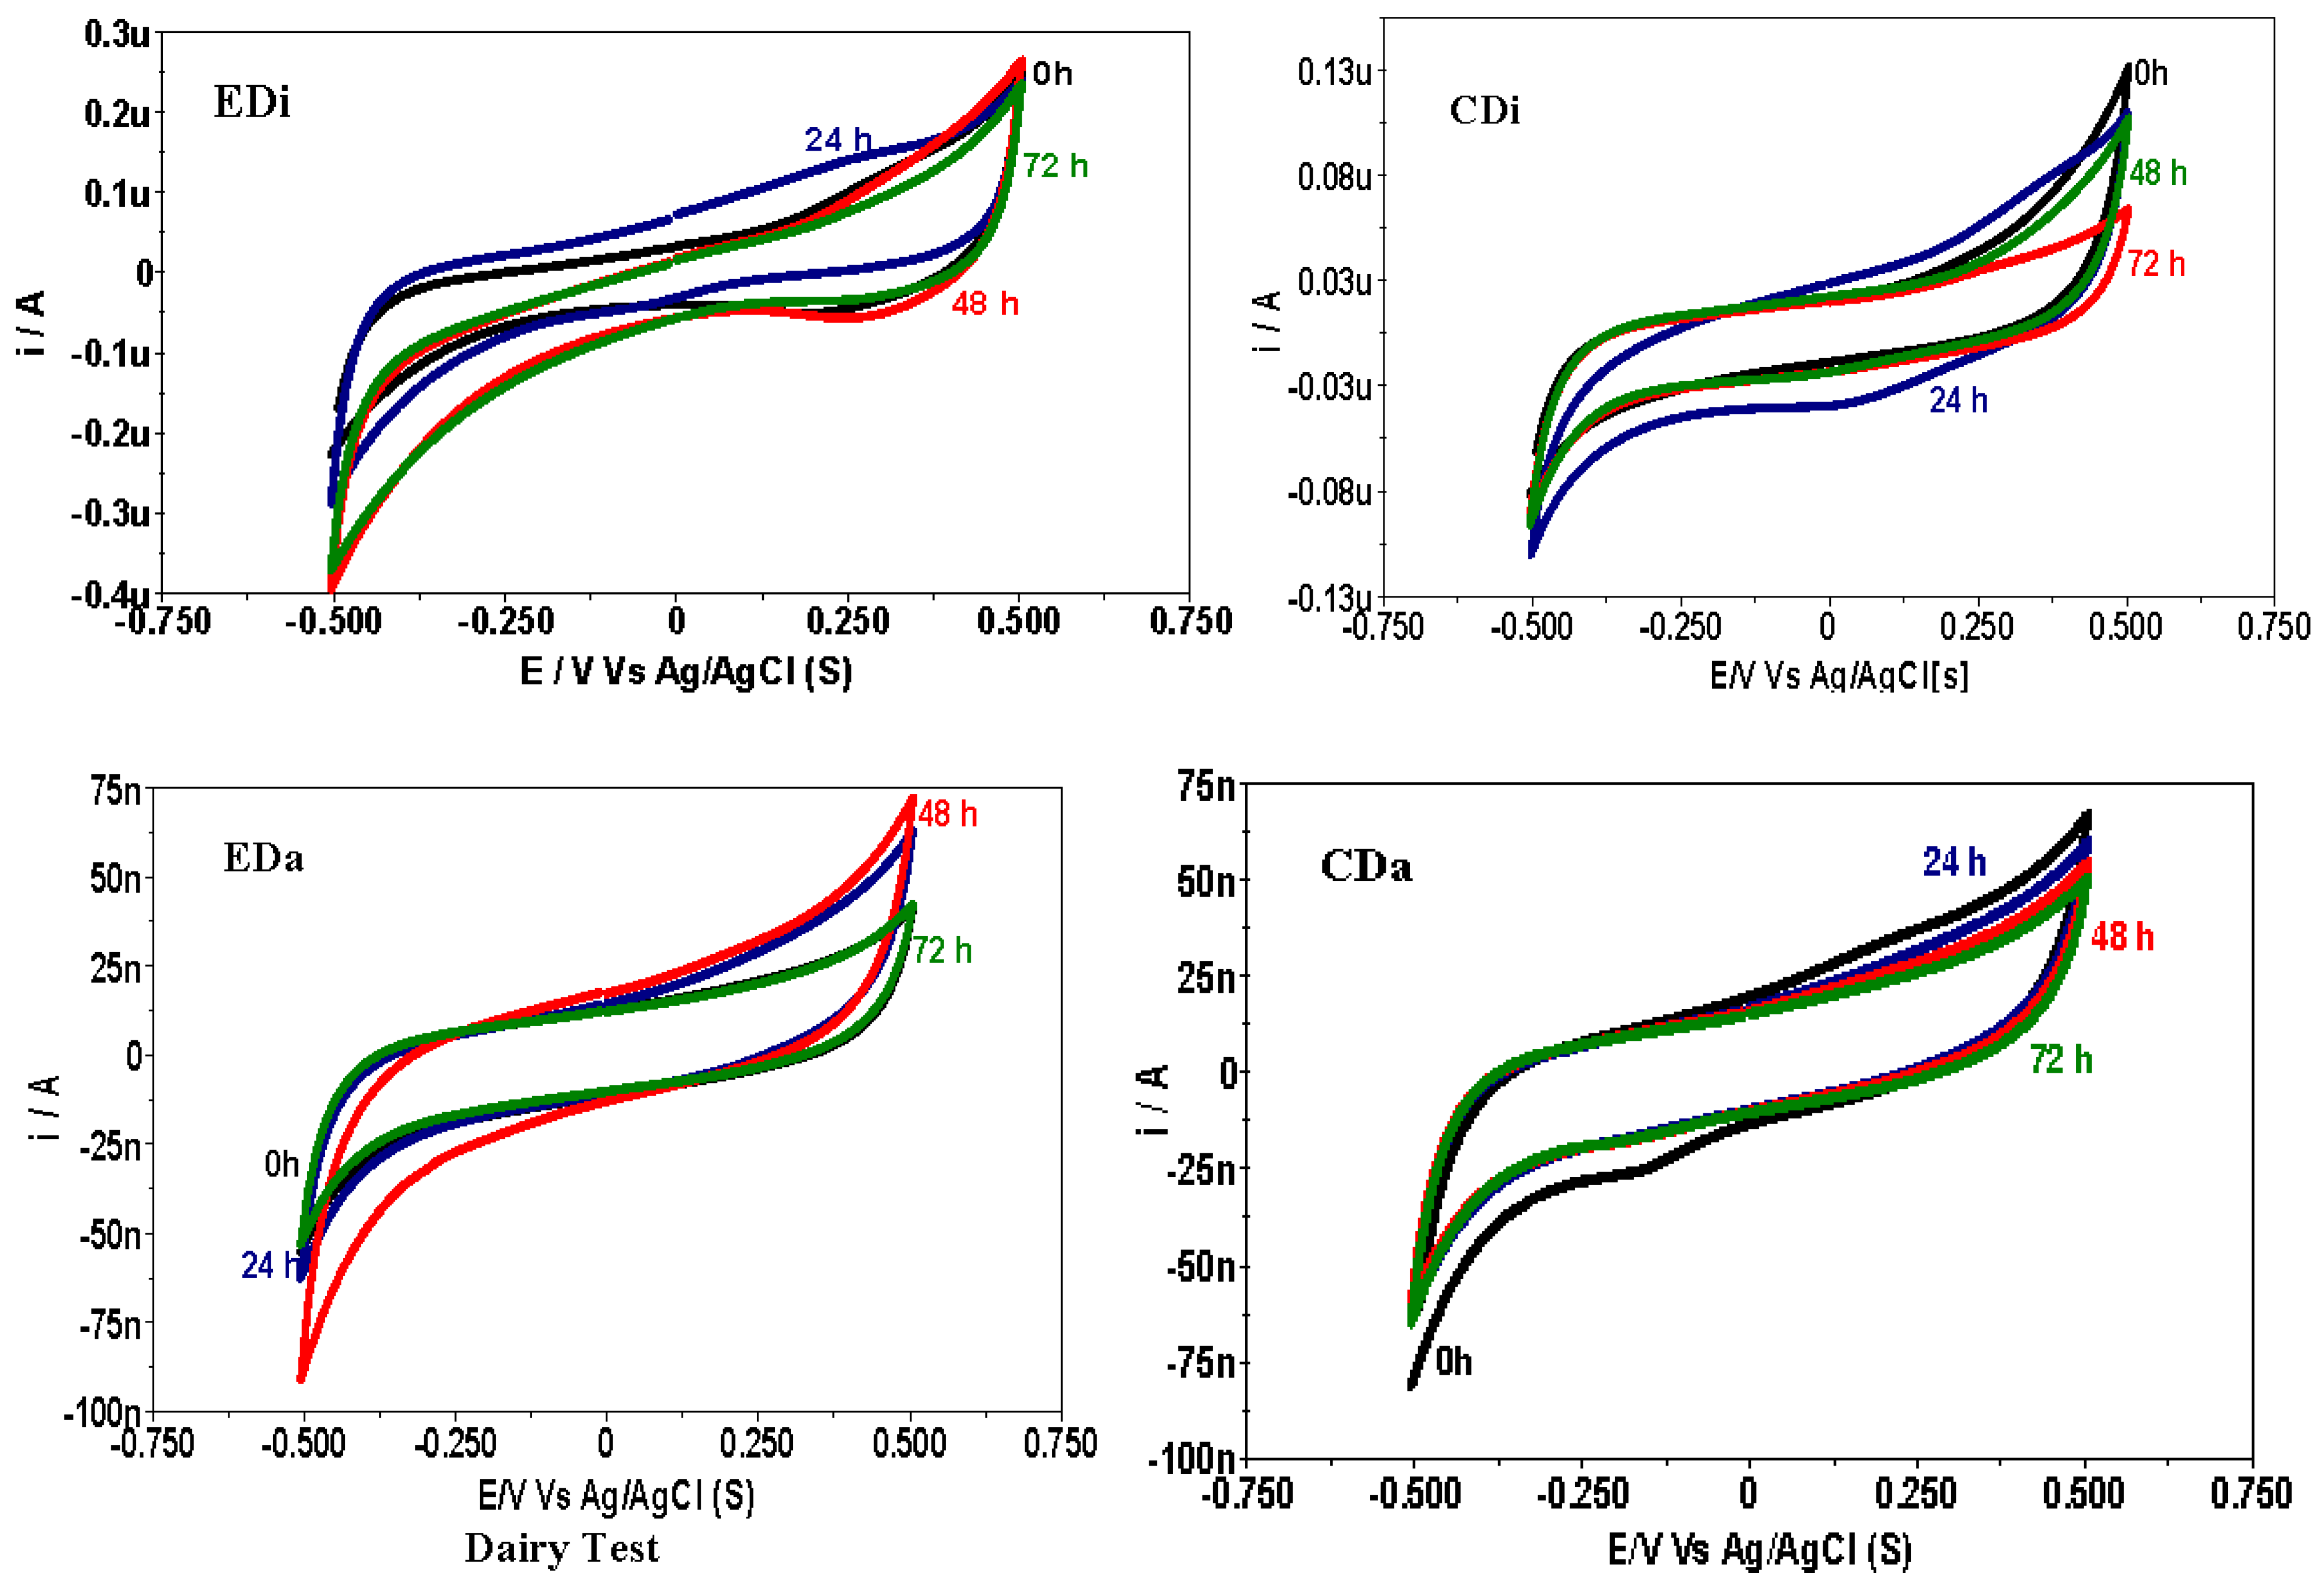
2.5. Bio-Electrocatalytic Analysis

Electron-transfer reactions are integral components in every act of microbial metabolism. These electron discharges are studied using bio-electrochemical techniques viz., cyclic voltammetry (CV). This is a highly versatile technique which allows understanding of the electron transfer from redox mediator species of the biocatalyst into solution using a three electrode set-up. Understanding the behavior of biocatalyst and its nature by scanning a definite potential window during H2 production is a significant aspect of this study. Voltammogram profiles (vs. Ag/AgCl) showed significant variation in both control (DFS) and experimental (ADPFS) set-up with both the wastewaters. Reduction current (RC) was relatively higher compared to the oxidation current (OC) in ADPFS operation, indicating a feasible anaerobic microenvironment for the evolution of hydrogen (Table 1). Analogous observations relating CHP was noticed in ADPFS (EDi and EDa) which was previously discussed. In the case of control DFS (CDi and CDa) as well the RC was higher than OC, and similarly, H2 production was relatively higher in distillery wastewater than dairy wastewater. The catalytic redox currents varied with batch time and the peak values were corroborating RC with maximum CHP and/or OC with substrate degradation. In CDi, the RC gradually increased from the 0th h (0.07 µA) and increased to a peak value at 24th h (0.10 µA) and thereafter decreased at 72nd (0.06 µA). In CDa, RC decreased along the batch process (0.081 µA at 0th and 0.064 µA at 72nd h) which is not favorable for H2 production. Likewise in case of EDi, the RC gradually increased from the 0th h (0.23 µA) to a peak value at the 48th h (0.40 µA) and thereafter declined at the 72nd h (0.37 µA). The disparity between CDi and EDi is the presence of PSB that involves acid consumption and consequently results in higher H2 than DFS. While, EDa responded in the same manner as in case of CDa, i.e., the RC values decreased from the batch start-up (0th h, 0.09 µA) till the end of the batch (72nd h, 0.053 µA) (Figure 8).
Table 1. Comprehensive results of bioelectrochemical analysis carried out for both the control (DFS) and experimental systems (ADPFS).
Time (h)OC (µA)RC (µA)βc (V/dec)βa (V/dec)Rp (kΩ)
EDi00.250.230.2190.40815,216
240.240.290.2630.62511,473
480.270.400.1570.35214,734
720.240.370.1650.37715,173
CDi00.120.070.2570.54415,038
240.100.100.1210.55716,325
480.080.080.0590.66715,440
720.060.060.0700.63215,290
EDa00.070.090.6830.15816,430
240.060.060.2050.62217,580
480.0410.0550.1650.60712,300
720.0420.0530.1550.72616,480
CDa00.0670.0811.7700.57613,330
240.0600.0640.2120.58418,890
480.0540.0600.1920.60818,136
720.0500.0640.1840.68117,020
DFS, dark fermentation system; ADPFS, augmented dark photo fermentation system; OC, oxidation current; RC, reduction current; βc, reduction slope; βa, oxidation slope; Rp, polarization resistance.
Further, these CV were analyzed for Tafel slopes which reveal the bioelectro-kinetic behavior of the biocatalyst in terms of exchange current density and electron transfer coefficients (oxidative βa, reductive βc). The electron transfer during redox reactions between the biocatalyst and solid electrode need to overcome different barriers referred to as overpotentials. Higher oxidation slope suggests the requirement of higher activation energy that makes oxidation less favorable and vice versa. The same relationship applies to the reduction slope. Remarkable variation was seen in these slope values both with batch time and operating process condition (specifically nature of biocatalyst and wastewater used). However, overall the βc values were lower than the βa values which supports for a reductive microenvironment which is congenial for H2 production. Rate of change in βc indicated the bioelectro-kinetics of biocatalyst used and variable profiles were noted with control and experimental systems. Interestingly, this change corroborated the RC of CV and CHP at that particular batch time. Besides, βc values were lower in control than in ADPFS, which indicates that dark-fermentative consortia have more tenacity for H2 production. But, this was not observed so in this study because of the VFA accumulation, which might have disturbed the biocatalyst buffer capacity leading to a drop in pH. On the other hand, in ADPFS the VFA are utilized in the process of H2 production.
Figure 8. Cyclic voltammograms of dark-fermentative system (DFS- CDi, CDa) and augmented dark-photo fermentative system (ADPFS- EDi, EDa) operated with distillery and dairy wastewater.
Ijms 16 09540 g008
Besides, polarization resistance (Rp) refers to the electron transfer from the biocatalyst at the solution electrode interface which is derived from Tafel analysis. The higher the Rp, the lower will be the electron transfer making the process less favorable. In this study, the Rp values are comparatively on a higher side because the electrode assembly is not continuously put in the system which assists in biofilm formation and for better electron conduction. The redox catalytic currents measured are due to suspended biocatalyst in the electrolyte, and in this manner heavy electron losses and resistances (referred to overpotentials) are noticed. The Tafel analysis therefore reports high activation loss (referred to as Rp). However, the solution conductivity is a criterion which showed considerable variation with the nature of wastewater used and the biocatalyst composition. In this study, Rp values were relatively lower with distillery wastewater than dairy wastewater and besides, these values were higher in control DFS than experimental ADPFS (Table 1). Notably the polarization resistance affects the Hydrogen Evolution Reaction (HER) kinetics which is consecutively influenced by the microbial catalytic capability within the tested potential region [30]. Perhaps, this could be a possible reason for high RC response and correspondingly higher H2 production.

3. Experimental Section

3.1. Biocatalyst

3.1.1. Anaerobic Culture

Anaerobic consortia acquired from a full scale operating anaerobic treatment unit was used as dark fermentative inoculums in the experiments. It was initially enriched in designed synthetic wastewater (DSW) (0.5 g/L NH4Cl, 0.25 g/L KH2PO4, 0.25 g/L K2HPO4, 0.3 g/L MgCl2∙6H2O, 0.025 g/L FeCl3, 0.016 g/L NiCl4, 0.025 g/L CoCl2, 0.0115 g/L ZnCl2, 0.0115 g/L CuCl2, 0.005 g/L CaCl2, 0.015 g/L MnCl2, 3.00 g/L C6H12O6) for a period of 72 h comprising 3 cycles each with 24 h under anaerobic microenvironment at pH 6.0 (100 rpm; 48 h). After enrichment of the inoculum it was subjected to sequential pretreatment with chemical, heat-shock and acid-shock to enrich H2 producers (hydrogenic bacteria) as well as to suppress methanogenic bacteria (MB) [31,32].

3.1.2. Photosynthetic Culture

An indigenous mixed photosynthetic consortium was acquired from existing photosynthetic hydrogen producing system reported in our previous experiments [11]. This culture was enriched in a succinate salt broth, consisting of 0.33 g KH2PO4, 0.33 g MgSO4∙7H2O, 0.33 g NaCl, 0.5 g NH4Cl, 0.5 g CaCl2∙2H2O, 1.0 g sodium succinate, 0.02 g yeast extract, 1 L Distilled H2O, 1 mL trace metal solution (10 mg ZnSO4∙7H2O, 3 mg MnCl2∙4H2O, 30 mg H3BO3, 20 mg CoCl2∙6H2O, 1 mg CuCl2 2H2O, 2 mg NiCl2∙6H2O, 3 mg Na2MoO4, 1.0 L Distilled H2O, pH 7) and 0.5 mL 0.02% FeSO4∙7H2O solution. This composition works well for enrichment of photosynthetic bacteria from natural sources. The cells were anaerobically grown in an incubator provided with an illumination (4000 lux (10.2 W/m2); 30 °C) for 7 days to reach logarithmic growth phase.

3.2. Wastewater

3.2.1. Dairy Wastewater

Dairy wastewater (suspended solids (SS), 1590 mg/L; total dissolved solids (TDS), 8840 mg/L; total solids (TS), 10,430 mg/L; COD, 11 g/L; BOD, 7173 mg/L, pH 7.2; nitrates, 1943 mg/L; phosphate, 22 mg/L; sulphate, 101 mg/L) was used as substrate. The wastewater can be considered as complex in nature (BOD/COD ≈ 0.61) due to the presence of proteins, carbohydrates, and fat content. After collection, the wastewater was transferred immediately to the laboratory and stored at 4 °C. Wastewater was diluted using tap water to requisite organic loading rate (OLR) prior to feeding and pH adjustment.

3.2.2. Distillery Wastewater

Distillery wastewater (Suspended solids (SS), 13,500 mg/L; total dissolved solids (TDS), 11,600 mg/L; total solids (TS), 25 g/L; COD, 124 g/L; BOD, 35 g/L, pH 8.2, nitrates, 1943 mg/L; phosphate, 80 mg/L; sulphate, 92 mg/L; alkalinity, 4000 mg/L and chlorides, 30 mg/L) was used as substrate. The wastewater can be considered as complex in nature (BOD/COD ~ 0.29) due to the presence of proteins, carbohydrates, and lipids content. After collection, the wastewater was transferred immediately to the laboratory and stored at 4 °C. Wastewater was diluted using tap water to requisite organic loading rate (OLR) prior to feeding and pH adjustment.

3.3. Experimental Methodology

Two set of experiments were carried out separately with distillery and dairy wastewater to investigate the augmentation effect of photosynthetic bacteria over H2 production (Figure 9). Control is a dark fermentative system (DFS) which is operated only with dark anaerobic mixed bacterial culture and designated as control distillery-CDi and control dairy-CDa. On the other hand, experimental systems are augmented dark-photo fermentative system (ADPFS) which is a hybrid setup operated with mixed photosynthetic bacteria (PSB) and designated as experimental distillery-EDi and experimental dairy EDa. All the experiments were operated in batch mode with a total/working volume of 250/180 mL (160 mL wastewater + 20 mL inocula) under anaerobic conditions. In the control, only dark anaerobic culture is taken; while, in the experimental system 10 mL dark and 10 mL PSB are taken for study. CDi and CDa experimental setups were wrapped with aluminum foil to restrict the penetration of light, whereas EDi and EDa ware illuminated with LED lights at intensity of 4000 lux (10.2 W/m2). All the systems were subjected to continuous agitation (120 rpm) using a temperature-controlled orbital shaker at an ambient temperature of 30 °C. Retention time of the batch experiments was kept as 72 h. The pH of wastewater was adjusted to 6, prior to inoculating the culture. All experiments were operated at organic loading rates (OLR) of 1.0 kg COD/m3-day. Organic loads (OL) were decided based on our previous experiments [11].
Figure 9. Schematic representation of experimental set-up employed.
Ijms 16 09540 g009

3.4. Analytical Methods

Production of H2 was estimated using a microprocessor based electrochemical gas sensor (ATMI GmBH Inc., Unterhaching, Germany). The output signal displayed represents the percentage volume of H2 accumulated in the headspace of the septum flasks. The variations in the bioprocess and microenvironment of both systems during H2 production was assessed by monitoring the COD removal efficiency, pH change during the operation and volatile fatty acid (VFA) profiling as per the standard methods [33]. Organic loading rate (kg COD/m3-day) based on COD and substrate degradation rate (SDR-kg CODR/m3-day) was calculated to study the rate and pattern of COD removal during the operation. VFA profile was monitored using high performance liquid chromatography (HPLC; UV detector; C18 reverse phase; 5 m particle size; flow rate-0.6 mL/h; wavelength-210 nm; mobile phase-acetonitrile (40%) in 1 mN H2SO4). At the end of each cycle total Bacteriochlorophyll (Bchl) was estimated by colorimetric procedure by centrifuging 5 mL of the bacterial culture (10,000 rpm for 10 min) and the supernatant was discarded. The pellet was re-suspended in 0.1 mL of milli-Q water to which 4.9 mL methanol was added to extract the pigments. Again, the culture was re-centrifuged to sediment the extracted cells and the supernatant were used for pigment analysis. The extinction coefficient of BChl of the extract was determined at 775 nm in a spectrophotometer and the BChl content was calculated by multiplying OD by a multiplication factor 2.19 [23,24]. Bio-electrocatalytic behavior of all the experimental variants was studied in situ by using a potentiostat-galvanostat system (Autolab-PGSTAT12, Utrecht, The Netherlands). Voltammograms (cyclic) were recorded by applying a potential ramp at a scan rate of 30 mV/s over the range from +0.5 to −0.5 V. A scan rate of 30 mV/s was optimized for the system, which showed significant interfacial electron-transfer kinetics. All the electrochemical assays in DFS and ADPFS were performed considering graphite (anode) as working electrode (WE) and platinum (cathode) as counter electrode (CE) against Ag/AgCl (s) reference electrode (RE) [29].

4. Conclusions

This study demonstrated the feasibility of biological H2 generation from distillery and dairy wastewater treatment in a single stage hybrid system. The hybrid system comprising dark and photo-fermentation facilitated higher H2 production with distillery wastewater over dairy waste because of its high organic fractions compared with dairy waste, which was protein-rich. An increment of about 40% was noticed in H2 production in photo-augmented system with simultaneous reduction in accumulated VFA. This study interprets the performance of hybrid process in a single system which is likely to provide the crucial information for the development of a full scale integrated photo-fermentation system.

Acknowledgments

The authors wish to thank the Director, CSIR-IICT for the encouragement in carrying out this work. RC duly acknowledges University Grant Commission (UGC) for providing Research Fellowship. GNN duly acknowledges Council of Scientific and Industrial Research (CSIR) for providing Senior Research Fellowship. Research was supported by CSIR in the form of XII task force projects (SETCA (CSC-0113); BioEn (CSC-0116)) and by the Ministry of New and Renewable Energy (Project No. 103/131/2008-NT).

Author Contributions

Rashmi Chandra performed the experiments. G. N. Nikhil assisted in preparing the manuscript. S. Venkata Mohan planned the experiments and supervised the research work.

Conflicts of Interest

The authors declare no conflict of interest.

References

  1. Hallenbeck, P.C.; Abo-Hashesh, M.; Ghosh, D. Strategies for improving biological hydrogen production. Bioresour. Technol. 2012, 110, 1–9. [Google Scholar] [CrossRef] [PubMed]
  2. Pandey, A.; Chang, J.-S.; Hallenbeck, P.C.; Larroche, C. Biohydrogen; Elsevier: San Diego, CA, USA, 2013. [Google Scholar]
  3. Venkata Mohan, S.; Lalit Babu, V.; Sarma, P.N. Anaerobic biohydrogen production from dairy wastewater treatment in sequencing batch reactor (AnSBR): Effect of organic loading rate. Enzym. Microb. Technol. 2007, 41, 506–515. [Google Scholar] [CrossRef]
  4. Venkata Mohan, S. Harnessing of biohydrogen from wastewater treatment using mixed fermentative consortia: Process evaluation towards optimization. Int. J. Hydrog. Energy 2009, 34, 7460–7474. [Google Scholar] [CrossRef]
  5. Mohanakrishna, G.; Mohan, S.V.; Sarma, P. Utilizing acid-rich effluents of fermentative hydrogen production process as substrate for harnessing bioelectricity: An integrative approach. Int. J. Hydrog. Energy 2010, 35, 3440–3449. [Google Scholar] [CrossRef]
  6. Babu, M.L.; Subhash, G.V.; Sarma, P.; Mohan, S.V. Bio-electrolytic conversion of acidogenic effluents to biohydrogen: An integration strategy for higher substrate conversion and product recovery. Bioresour. Technol. 2013, 133, 322–331. [Google Scholar] [CrossRef] [PubMed]
  7. Nikhil, G.; Mohan, S.V.; Swamy, Y. Applied potentials regulate recovery of residual hydrogen from acid-rich effluents: Influence of biocathodic buffer capacity over process performance. Bioresour. Technol. 2015. [Google Scholar] [CrossRef]
  8. Escapa, A.; San Martin, M.I.; Moran, A. Potential use of microbial electrolysis cells (MECS) in domestic wastewater treatment plants for energy recovery. Front. Energy Res. 2014, 2, 1–10. [Google Scholar] [CrossRef]
  9. Allakhverdiev, S.I.; Thavasi, V.; Kreslavski, V.D.; Zharmukhamedov, S.K.; Klimov, V.V.; Ramakrishna, S.; Los, D.A.; Mimuro, M.; Nishihara, H.; Carpentier, R. Photosynthetic hydrogen production. J. Photochem. Photobiol. C Photochem. Rev. 2010, 11, 101–113. [Google Scholar] [CrossRef]
  10. Hallenbeck, P.C.; Ghosh, D. Advances in fermentative biohydrogen production: The way forward? Trends Biotechnol. 2009, 27, 287–297. [Google Scholar] [CrossRef] [PubMed]
  11. Chandra, R.; Venkata Mohan, S. Enhanced bio-hydrogenesis by co-culturing photosynthetic bacteria with acidogenic process: Augmented dark-photo fermentative hybrid system to regulate volatile fatty acid inhibition. Int. J. Hydrog. Energy 2014, 39, 7604–7615. [Google Scholar] [CrossRef]
  12. Sasikala, C.; Ramana, C.V. Biotechnological potentials of anoxygenic phototrophic bacteria. I. Production of single cell protein, vitamins, ubiquinones, hormones, and enzymes and use in waste treatment. Adv. Appl. Microbiol. 1995, 41, 173–226. [Google Scholar] [PubMed]
  13. Singh, S.; Srivastava, S.; Singh, V.; Block, D.; Veziroglu, T. Photoproduction of hydrogen by rhodopseudomonas at the expense of cellulose: Development of two-stage bioreactor, hydrogen energy progress X: Volume 2. In Proceedings of the 10th World Hydrogen Energy Conference,Cocoa Beach, FL,USA, 20–24 June 1994; pp. 959–963.
  14. Tao, Y.; Chen, Y.; Wu, Y.; He, Y.; Zhou, Z. High hydrogen yield from a two-step process of dark-and photo-fermentation of sucrose. Int. J. Hydrog. Energy 2007, 32, 200–206. [Google Scholar] [CrossRef]
  15. Wang, X.; Jin, B.; Mulcahy, D. Impact of carbon and nitrogen sources on hydrogen production by a newly isolated Clostridium butyricum w5. Int. J. Hydrog. Energy 2008, 33, 4998–5005. [Google Scholar] [CrossRef]
  16. Mohan, S.V.; Mohanakrishna, G.; Goud, R.K.; Sarma, P. Acidogenic fermentation of vegetable based market waste to harness biohydrogen with simultaneous stabilization. Bioresour. Technol. 2009, 100, 3061–3068. [Google Scholar] [CrossRef] [PubMed]
  17. Chaudhary, A.; Sharma, A.; Singh, B. Study of physio-chemical characteristics and biological treatment of molasses-based distillery effluent. Int. J. Bioassays 2013, 2, 612–615. [Google Scholar]
  18. Nandy, T.; Shastry, S.; Kaul, S. Wastewater management in a cane molasses distillery involving bioresource recovery. J. Environ. Manag. 2002, 65, 25–38. [Google Scholar] [CrossRef]
  19. Hawkes, F.; Dinsdale, R.; Hawkes, D.; Hussy, I. Sustainable fermentative hydrogen production: Challenges for process optimisation. Int. J. Hydrog. Energy 2002, 27, 1339–1347. [Google Scholar] [CrossRef]
  20. Mohan, S.V.; Agarwal, L.; Mohanakrishna, G.; Srikanth, S.; Kapley, A.; Purohit, H.J.; Sarma, P. Firmicutes with iron dependent hydrogenase drive hydrogen production in anaerobic bioreactor using distillery wastewater. Int. J. Hydrog. Energy 2011, 36, 8234–8242. [Google Scholar] [CrossRef]
  21. Lee, C.-M.; Chen, P.-C.; Wang, C.-C.; Tung, Y.-C. Photohydrogen production using purple nonsulfur bacteria with hydrogen fermentation reactor effluent. Int. J. Hydrog. Energy 2002, 27, 1309–1313. [Google Scholar] [CrossRef]
  22. Mohanakrishna, G.; Mohan, S.V. Multiple process integrations for broad perspective analysis of fermentative H2 production from wastewater treatment: Technical and environmental considerations. Appl. Energy 2013, 107, 244–254. [Google Scholar] [CrossRef]
  23. Blankenship, R.E.; Madigan, M.T.; Bauer, C.E. Anoxygenic Photosynthetic Bacteria; Kluwer Academic Publishers: Dordrecht, The Netherlands, 1995. [Google Scholar]
  24. Clayton, R.K. Spectroscopic analysis of bacteriochlorophylls in vitro and in vivo. Photochem. Photobiol. 1966, 5, 669–677. [Google Scholar] [CrossRef]
  25. Fujimori, E. Bacteriochlorophyll pheophytinization in chromatophores and subchromatophores from Rhodospirillum rubrum. Biochim. Biophys. Acta Bioenerg. 1969, 180, 360–367. [Google Scholar] [CrossRef]
  26. Kobayashi, M.; Hamano, T.; Akiyama, M.; Watanabe, T.; Inoue, K.; Oh-oka, H.; Amesz, J.; Yamamura, M.; Kise, H. Light-independent isomerization of bacteriochlorophyll g to chlorophyll a catalyzed by weak acid in vitro. Anal. Chim. Acta 1998, 365, 199–203. [Google Scholar] [CrossRef]
  27. Ren, N.-Q.; Liu, B.-F.; Ding, J.; Guo, W.-Q.; Cao, G.-L.; Xie, G.-J. The effect of butyrate concentration on photo-hydrogen production from acetate by Rhodopseudomonas faecalis RLD-53. Int. J. Hydrog. Energy 2008, 33, 5981–5985. [Google Scholar] [CrossRef]
  28. Abo-Hashesh, M.; Desaunay, N.; Hallenbeck, P.C. High yield single stage conversion of glucose to hydrogen by photofermentation with continuous cultures of Rhodobacter capsulatus JP91. Bioresour. Technol. 2013, 128, 513–517. [Google Scholar] [CrossRef] [PubMed]
  29. Srikanth, S.; Venkata Mohan, S.; Prathima Devi, M.; Peri, D.; Sarma, P.N. Acetate and butyrate as substrates for hydrogen production through photo-fermentation: Process optimization and combined performance evaluation. Int. J. Hydrog. Energy 2009, 34, 7513–7522. [Google Scholar] [CrossRef]
  30. Liu, Y.; Ghosh, D.; Hallenbeck, P.C. Biological reformation of ethanol to hydrogen by Rhodopseudomonas palustris CGA009. Bioresour. Technol. 2015, 176, 189–195. [Google Scholar] [CrossRef] [PubMed]
  31. Mohan, S.V.; Babu, V.L.; Sarma, P. Effect of various pretreatment methods on anaerobic mixed microflora to enhance biohydrogen production utilizing dairy wastewater as substrate. Bioresour. Technol. 2008, 99, 59–67. [Google Scholar] [CrossRef] [PubMed]
  32. Chandra, R.; Venkata Mohan, S. Microalgal community and their growth conditions influence biohydrogen production during integration of dark-fermentation and photo-fermentation processes. Int. J. Hydrog. Energy 2011, 36, 12211–12219. [Google Scholar] [CrossRef]
  33. Eaton, A.D.; Franson, M.A.H.; Association, A.P.H.; Association, A.W.W.; Federation, W.E. Standard Methods for the Examination of Water & Wastewater; American Public Health Association: Washington, DC, USA, 2005. [Google Scholar]

