
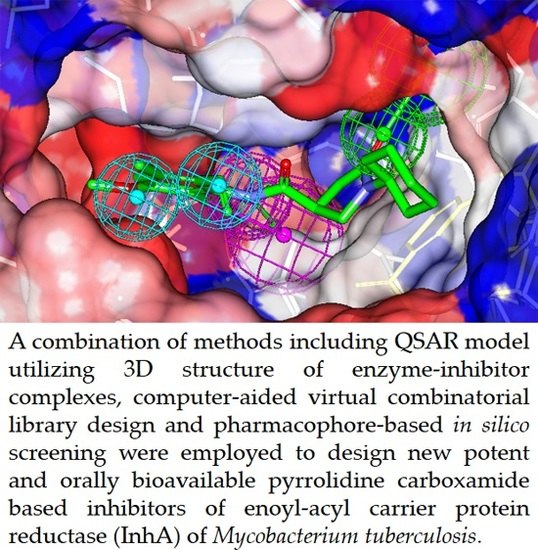
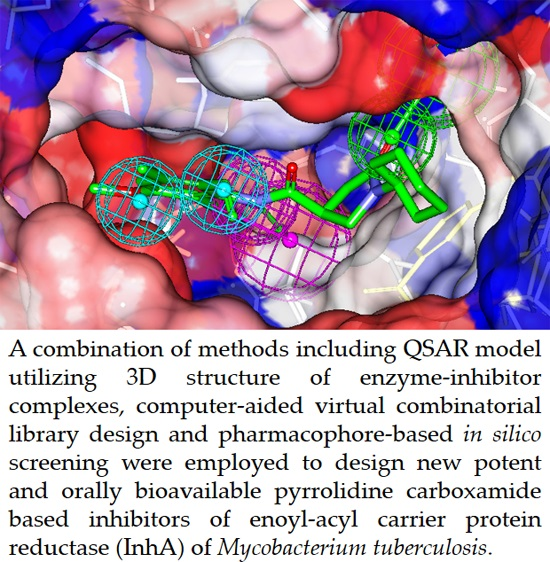
Computer-Aided Design of Orally Bioavailable Pyrrolidine Carboxamide Inhibitors of Enoyl-Acyl Carrier Protein Reductase of Mycobacterium tuberculosis with Favorable Pharmacokinetic Profiles

 and
and
Abstract
:
1. Introduction


2. Results and Discussion

 | ||||||
|---|---|---|---|---|---|---|
| Training Set | R1 | R2 | R3 | R4 | R5 | IC50exp (μM) |
| PCAM1 | –H | –H | –H | vH | –H | 10.66 |
| PCAM2 | –H | –H | –Br | –H | –H | 28.02 |
| PCAM3 | –H | –Br | –H | –H | –H | 0.89 |
| PCAM4 | –H | –Cl | –H | –H | –H | 1.35 |
| PCAM5 | –H | –CF3 | –H | –H | –H | 3.51 |
| PCAM6 | –H | –H | –CH2COOH | –H | –H | 73.58 |
| PCAM7 | –H | –NO2 | –H | –H | –H | 10.59 |
| PCAM8 | –Br | –H | –H | –H | –H | 101.00 |
| PCAM9 | –H | vCl | –H | –Cl | –H | 0.39 |
| PCAM10 | –Cl | –H | –Cl | –H | –H | 56.02 |
| PCAM11 | –Cl | –H | –H | –Cl | –H | 56.50 |
| PCAM12 | –CH3 | –Cl | –H | –H | –H | 23.12 |
| PCAM13 | –H | –Cl | –F | –H | –H | 14.83 |
| PCAM14 | –H | –F | –F | –H | –H | 1.49 |
| PCAM15 | –H | –CH3 | –H | –CH3 | –H | 3.14 |
| PCAM16 | –CH3 | –H | –H | –Cl | –H | 0.97 |
| PCAM17 | –H | –CF3 | –H | –CF3 | –H | 3.67 |
| PCAM18 | –H | –CH2(CH3)2 | –H | –H | –H | 5.55 |
| PCAM19 | –H | –OCH3 | –H | –CF3 | –H | 1.30 |
| PCAM20 | –H | –Br | –H | –CF3 | –H | 0.85 |
| Validation Set | R1 | R2 | R3 | R4 | R5 | IC50exp (μM) |
| PCAM21 | –H | –CH3 | –H | –H | vH | 16.79 |
| PCAM22 | –H | –H | –Cl | –H | –H | 101.00 |
| PCAM23 | –H | –CH3 | –Br | –H | –H | 37.41 |
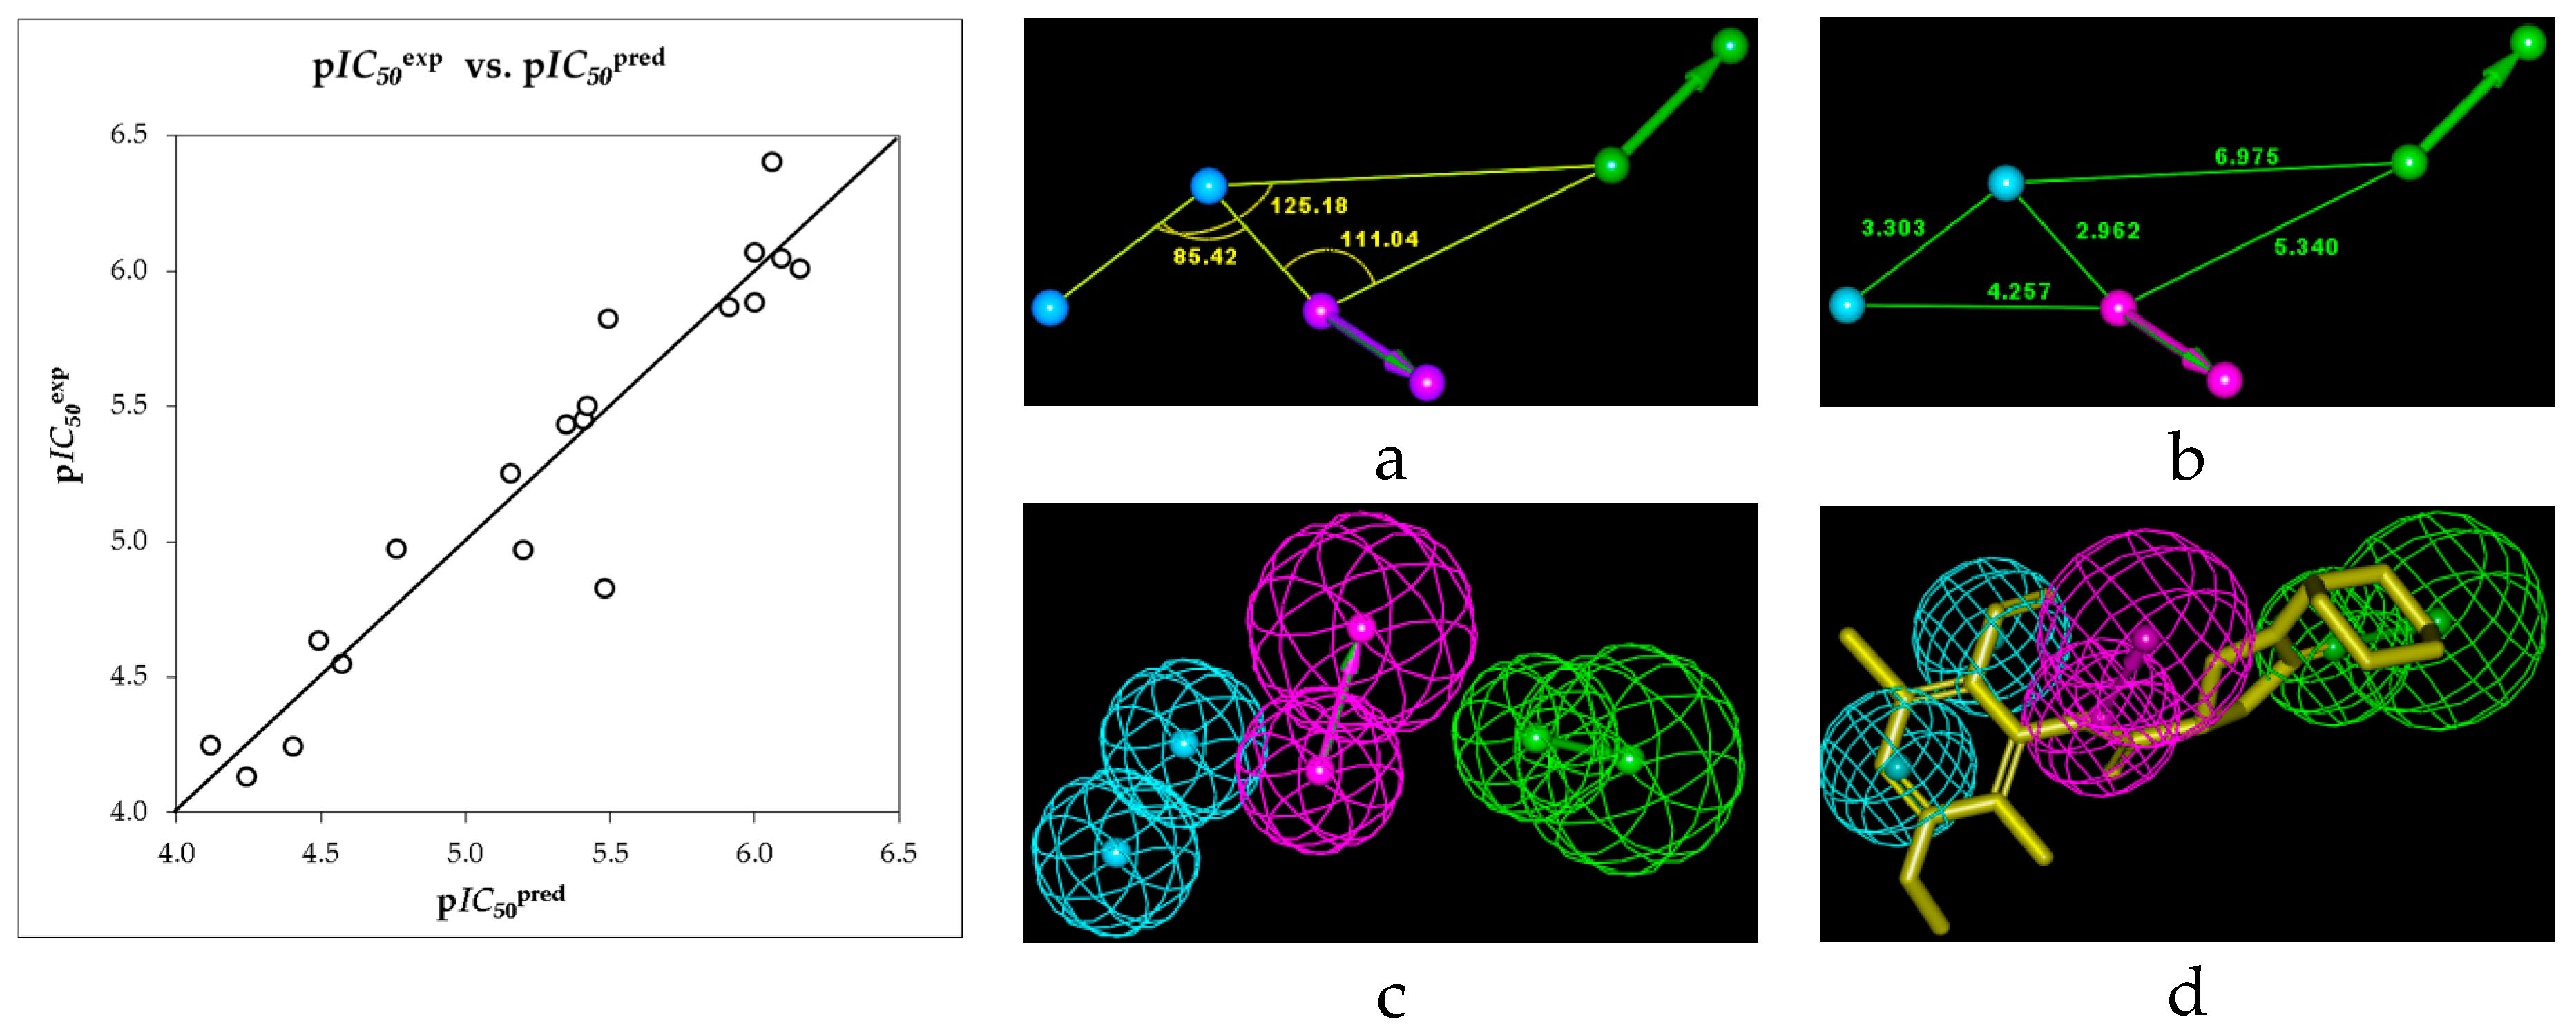
2.1. Quantitative Structure-Activity Relationships (QSAR) Model
| Training Set a | MW b | ΔΔHMM c | ΔΔGsol d | ΔΔTSvib e | ΔΔGcom f | IC50exp g |
|---|---|---|---|---|---|---|
| (g·mol−1) | (kcal·mol−1) | (kcal·mol−1) | (kcal·mol−1) | (kcal·mol−1) | (μM) | |
| PCAM1 | 286 | 0 | 0 | 0 | 0 | 10.66 |
| PCAM2 | 365 | 1.63 | −0.49 | −2.47 | 3.61 | 28.02 |
| PCAM3 | 365 | −6.69 | −0.03 | −2.09 | −4.62 | 0.89 |
| PCAM4 | 320 | −5.14 | −0.25 | −1.77 | −3.62 | 1.35 |
| PCAM5 | 354 | −4.55 | −1.81 | −3.90 | −2.46 | 3.51 |
| PCAM6 | 328 | 1.60 | 0.12 | −0.01 | 1.73 | 73.58 |
| PCAM7 | 331 | −3.25 | −0.33 | −2.30 | −1.28 | 10.59 |
| PCAM8 | 365 | 3.45 | −0.38 | −2.41 | 5.48 | 101.00 |
| PCAM9 | 355 | −7.51 | −0.57 | 0.18 | −8.25 | 0.39 |
| PCAM10 | 355 | 1.25 | −0.36 | −2.83 | 3.72 | 56.02 |
| PCAM11 | 355 | 6.15 | −0.52 | 0.13 | 5.50 | 56.50 |
| PCAM12 | 335 | 1.66 | −0.43 | 0.21 | 1.02 | 23.12 |
| PCAM13 | 339 | −3.11 | 0.11 | −2.92 | −0.09 | 14.83 |
| PCAM14 | 322 | −4.91 | −0.30 | 0.12 | −5.34 | 1.49 |
| PCAM15 | 314 | −4.68 | −0.25 | −0.69 | −4.24 | 3.14 |
| PCAM16 | 335 | −3.54 | −0.42 | 1.42 | −5.38 | 0.97 |
| PCAM17 | 423 | −8.87 | −0.13 | −6.92 | −2.07 | 3.67 |
| PCAM18 | 328 | 1.11 | −1.37 | 3.11 | −3.36 | 5.55 |
| PCAM19 | 385 | −7.71 | −0.70 | −4.68 | −3.74 | 1.30 |
| PCAM20 | 433 | −9.56 | −0.80 | −3.70 | −6.66 | 0.85 |
| Validation Set | MW b | ΔΔHMM c | ΔΔGsol d | ΔΔTSvib e | ΔΔGcom f | pIC50pre/pIC50exp h |
| (g·mol−1) | (kcal·mol−1) | (kcal·mol−1) | (kcal·mol−1) | (kcal·mol−1) | ||
| PCAM21 | 315 | 0.12 | −0.16 | 0.37 | −0.41 | 1.069 |
| PCAM22 | 320 | 4.43 | −0.01 | −1.90 | 6.33 | 1.016 |
| PCAM23 | 379 | 2.27 | −0.61 | −1.94 | 3.60 | 1.013 |
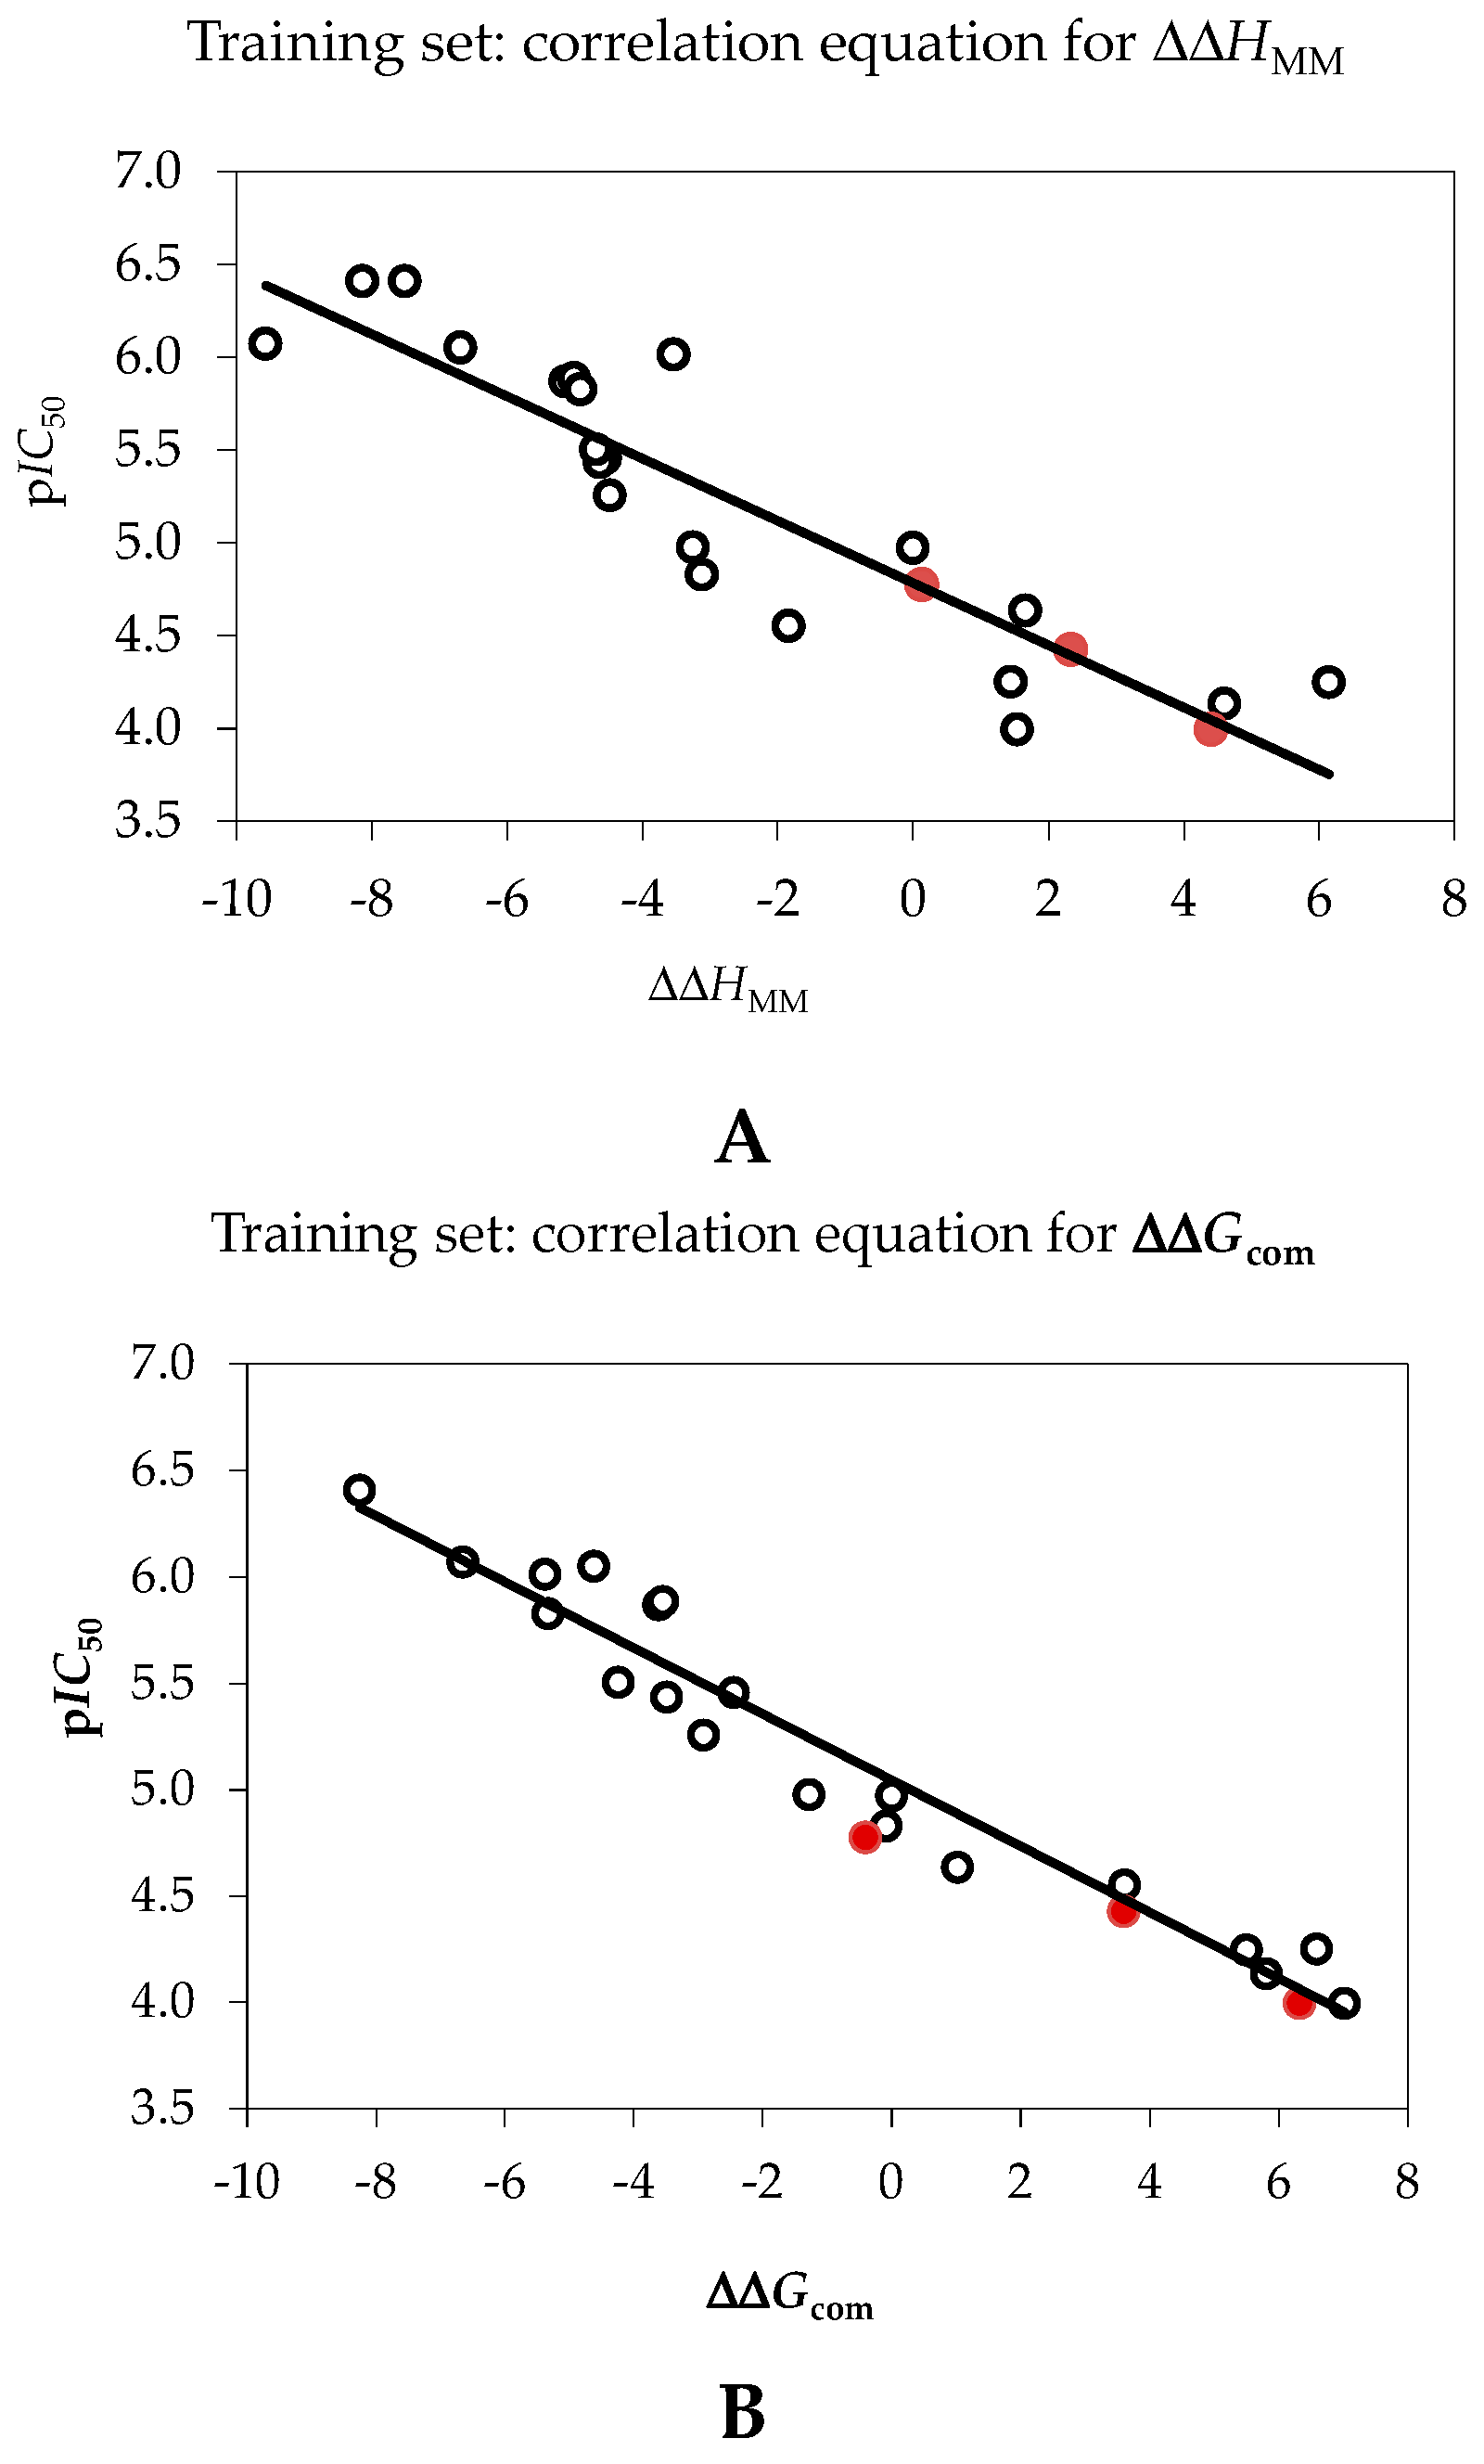
| Statistical Data of Linear Regression | (A) | (B) |
|---|---|---|
| pIC50exp = −0.1674·ΔΔHMM + 4.7843 (A) | – | – |
| pIC50exp = −0.1552·ΔΔGcom + 5.0448 (B) | – | – |
| Number of compounds n | 20 | 20 |
| Square correlation coefficient of regression R2 | 0.80 | 0.94 |
| LOO cross-validated square correlation coefficient R2xv | 0.76 | 0.93 |
| Standard error of regression σ | 0.38 | 0.22 |
| Statistical significance of regression, Fisher F-test | 52.7 | 199.8 |
| Level of statistical significance α | >95% | >95% |
| Range of activities IC50exp (μM) | 0.39–101.0 | |

2.2. Ligand-Based 3D-QSAR Pharmacophore Model of Inhibitory Activity
| Hypothesis | RMSD a | R2 b | Total Costs c |
|---|---|---|---|
| Hypo1 | 1.827 | 0.88 | 64.6 |
| Hypo2 | 1.887 | 0.87 | 65.9 |
| Hypo3 | 2.561 | 0.75 | 86.1 |
| Hypo4 | 2.744 | 0.72 | 93.7 |
| Hypo5 | 2.762 | 0.71 | 93.9 |
| Hypo6 | 2.725 | 0.72 | 94.8 |
| Hypo7 | 3.144 | 0.63 | 113.7 |
| Hypo8 | 3.144 | 0.63 | 113.7 |
| Hypo9 | 3.172 | 0.62 | 115.1 |
| Hypo10 | 3.138 | 0.63 | 115.6 |
| Fixed Cost | 0.0 | 1.0 | 40.1 |
| Null Cost | 5.167 | 0.0 | 217.4 |

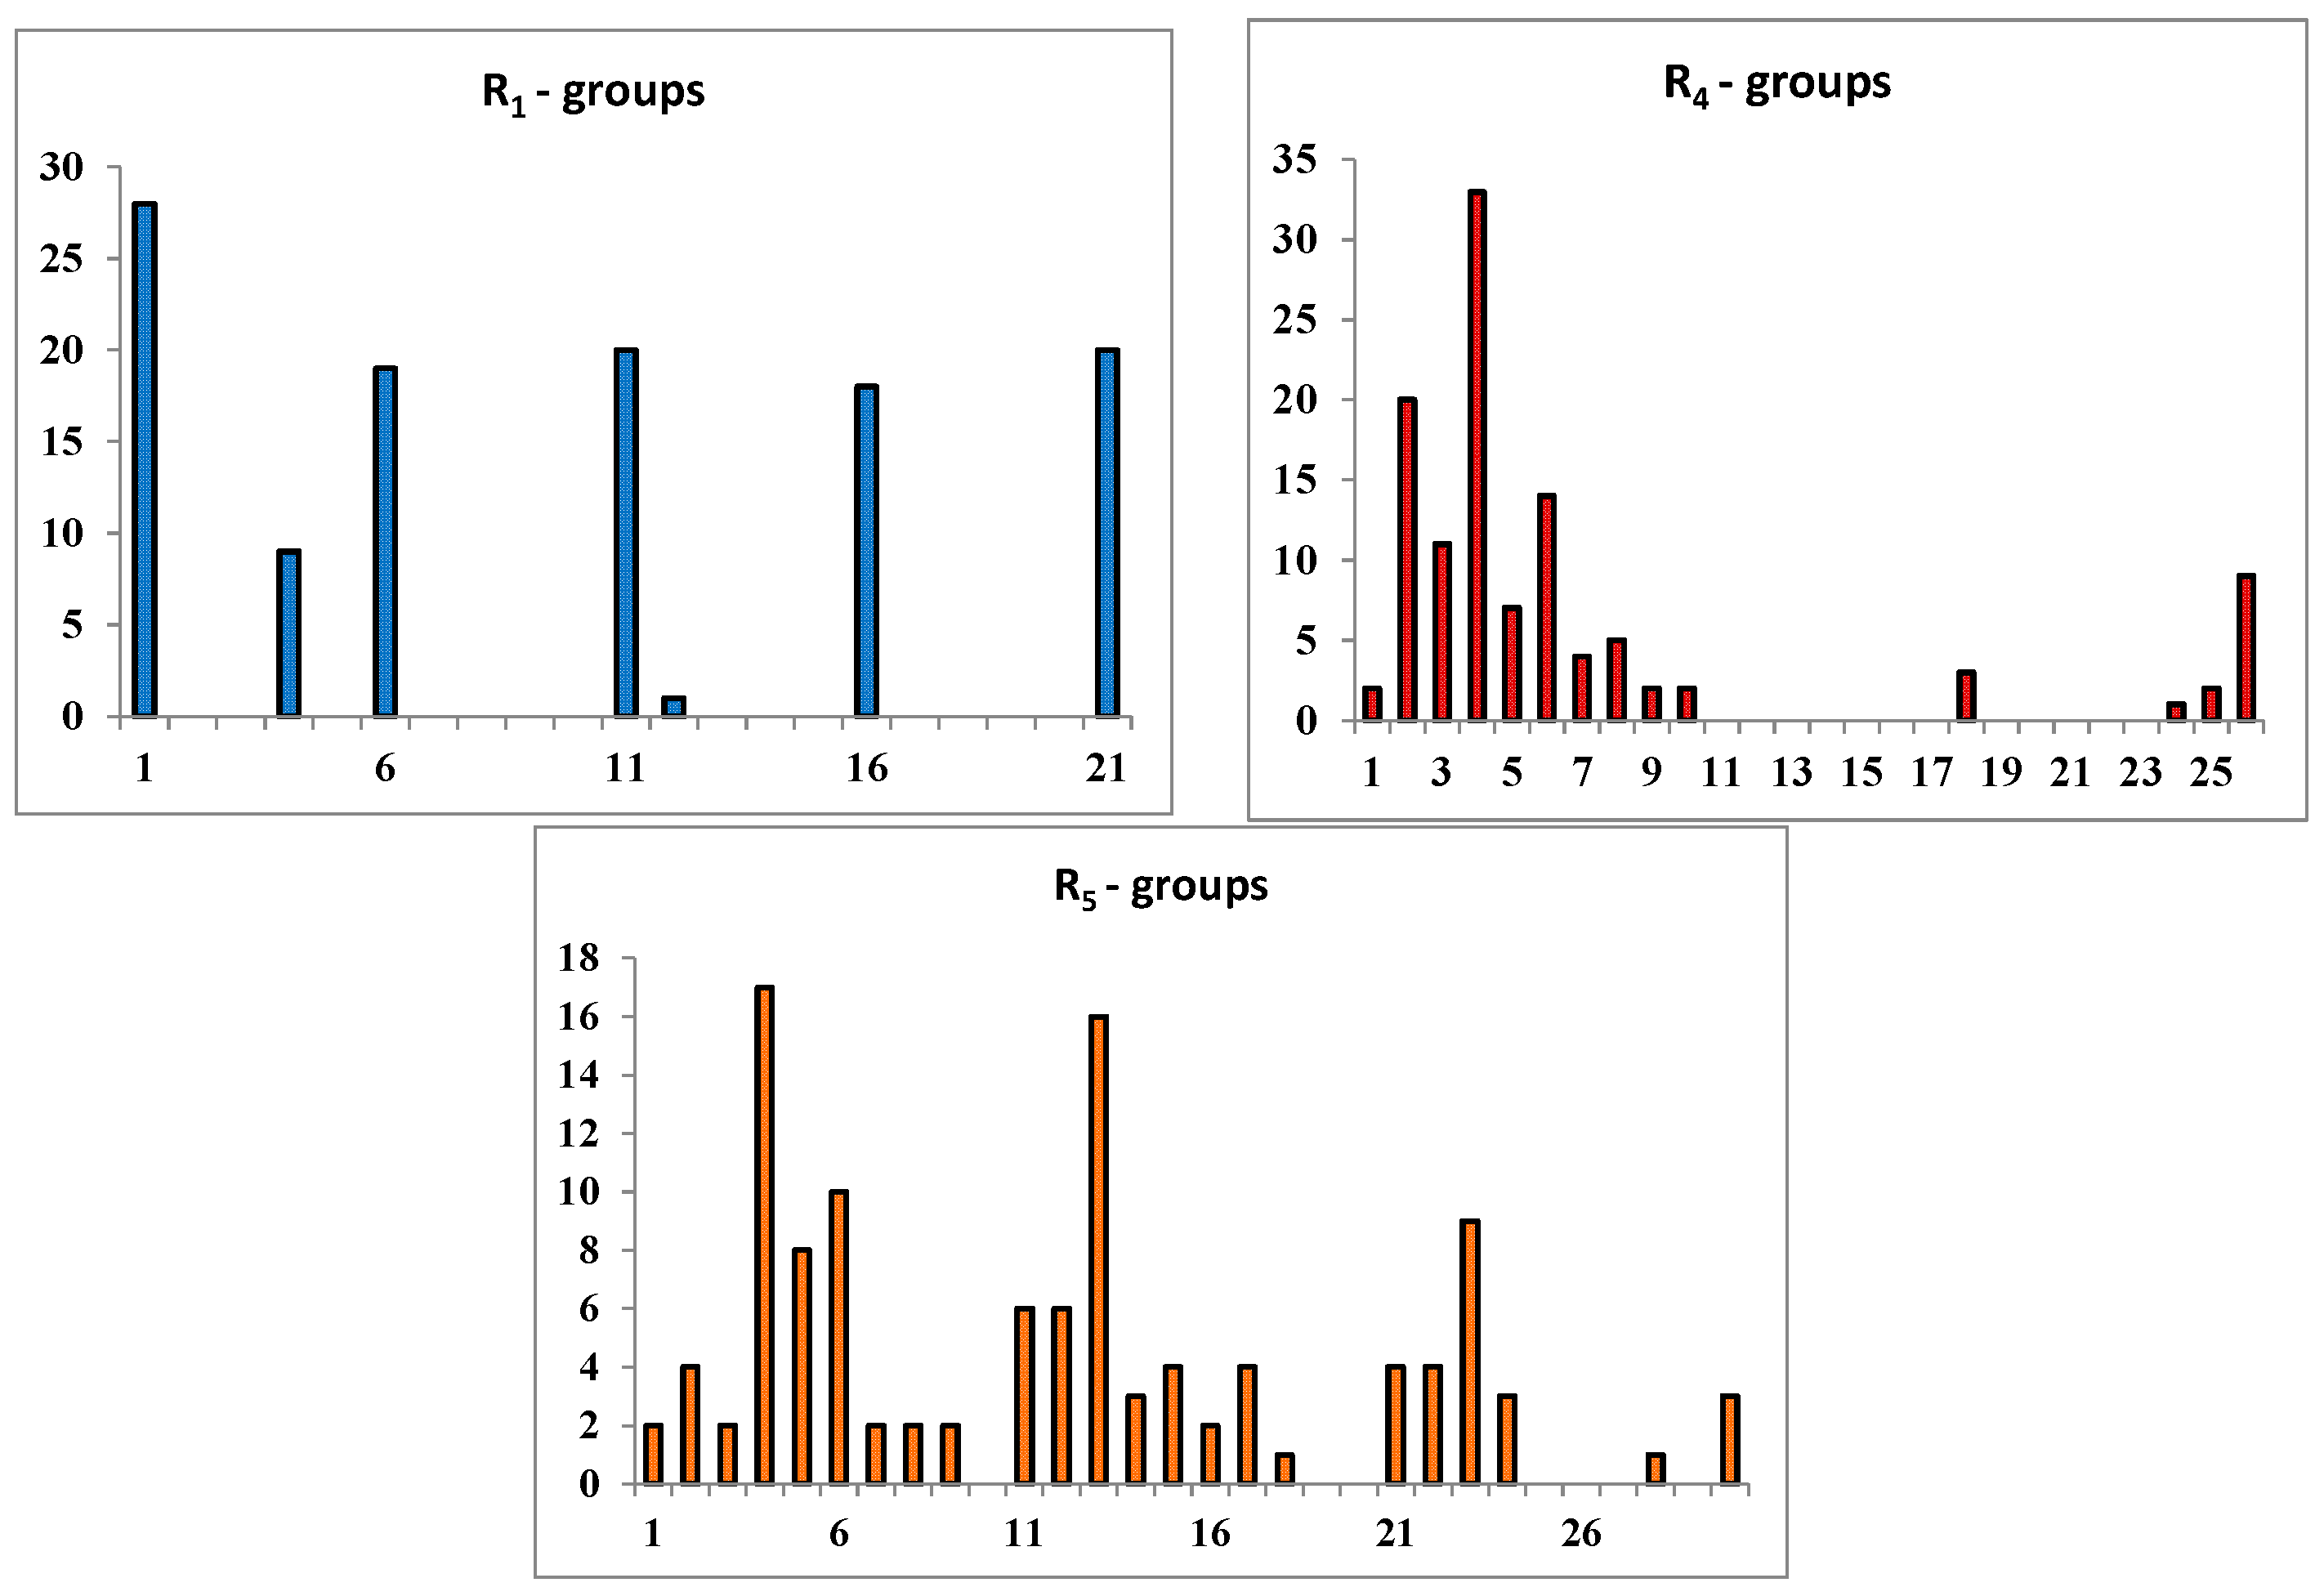
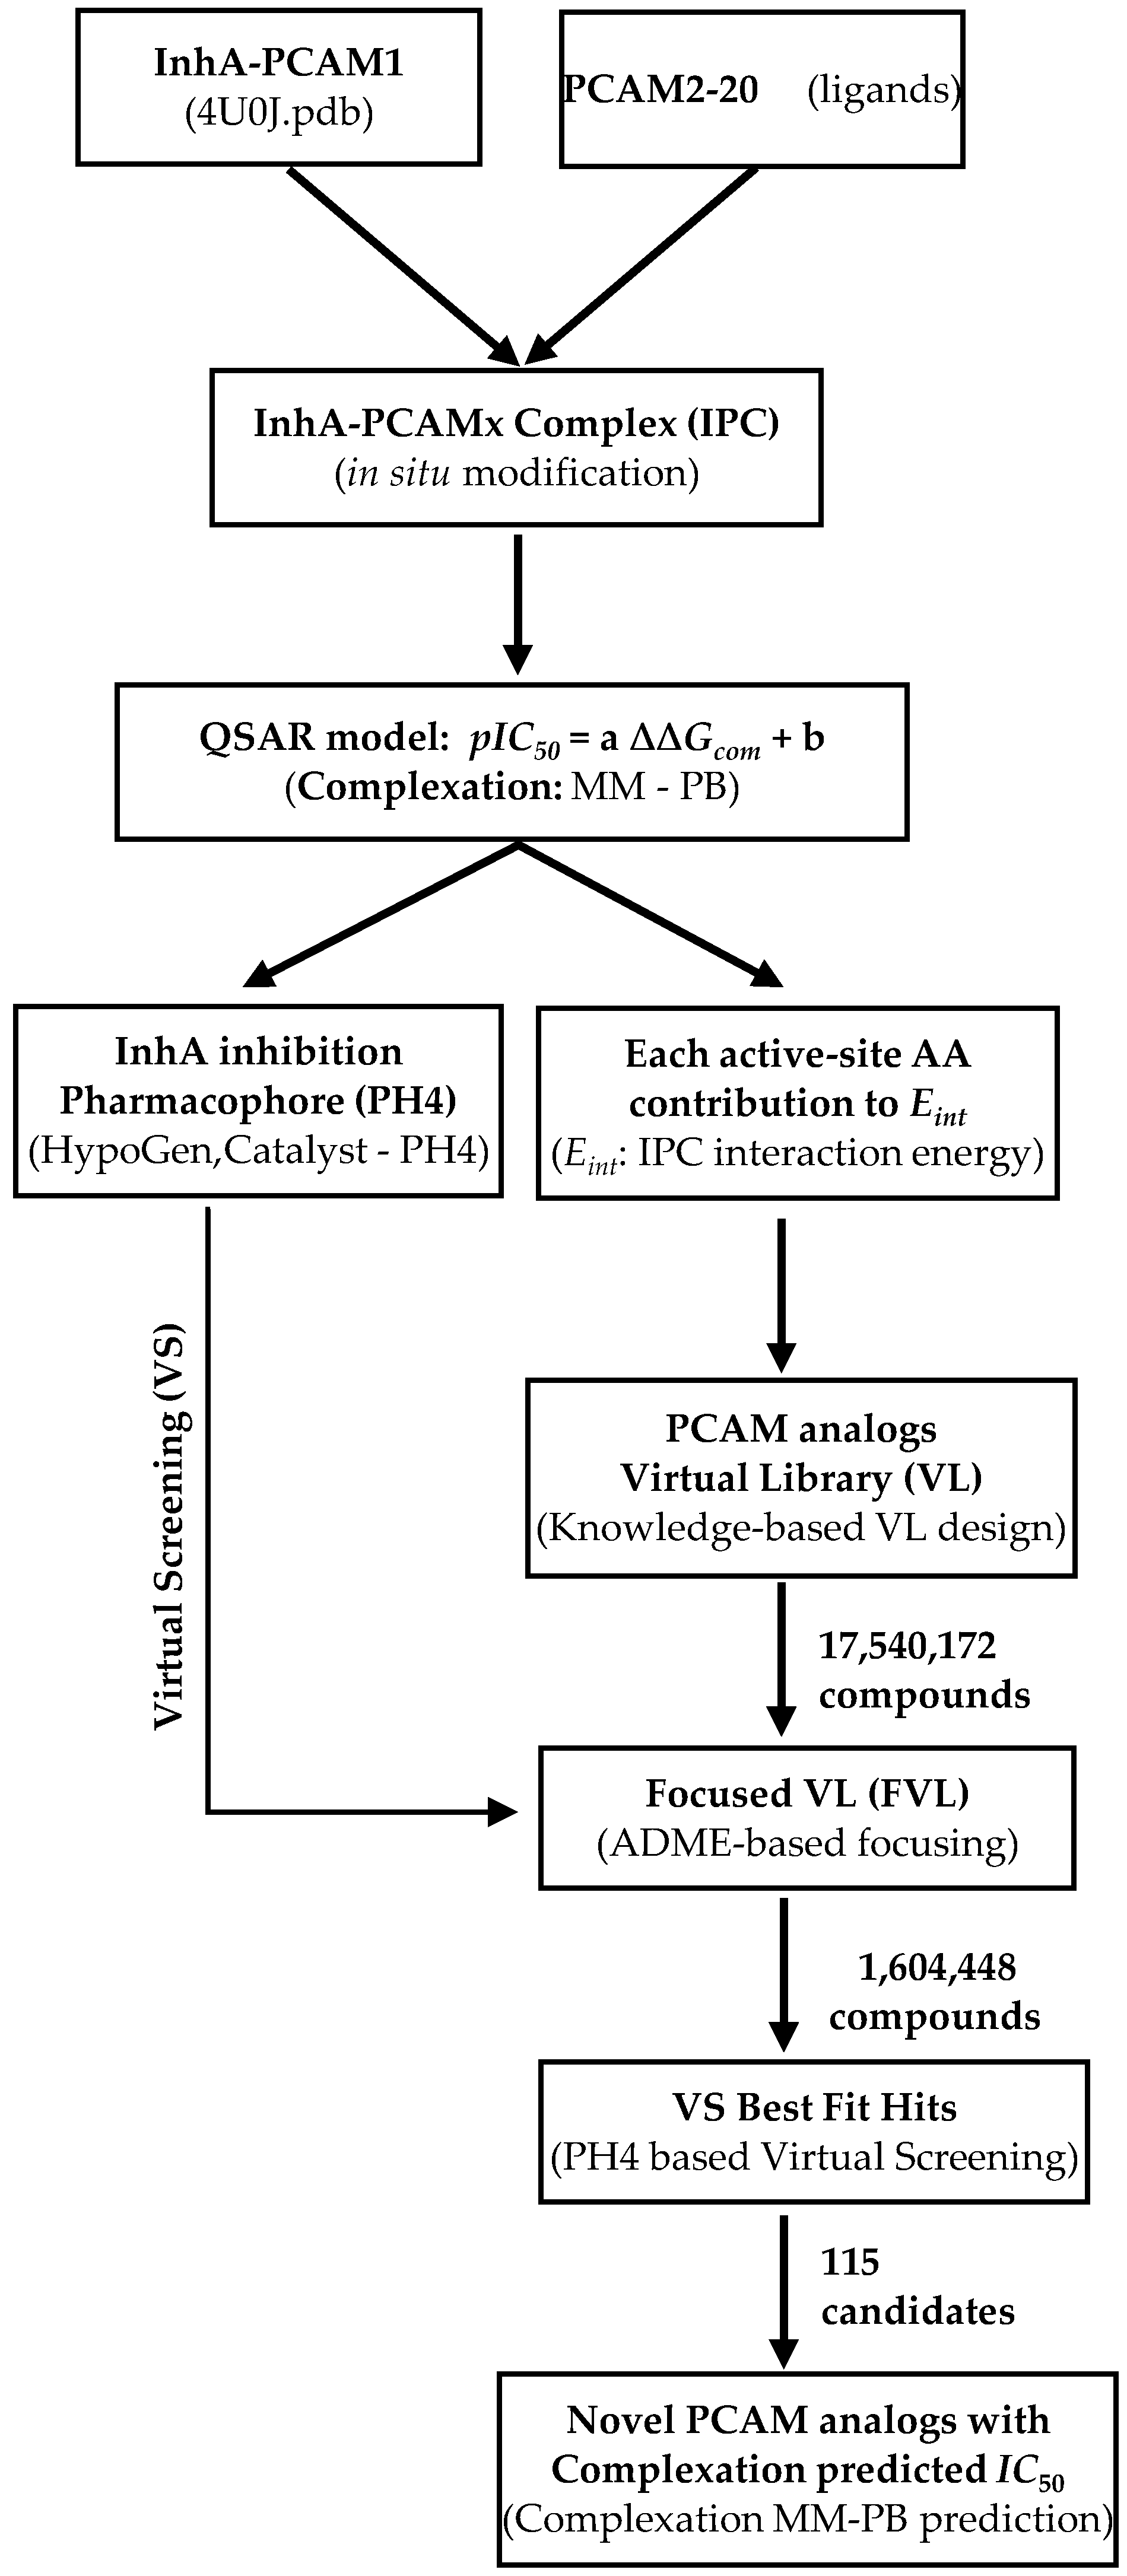
2.3. Library Design and Adsorption, Distribution, Metabolism and Excretion (ADME) Focusing
 | |||||
|---|---|---|---|---|---|
| R-Groups a,b | |||||
| 1 | –F | 2. | –Cl | 3. | –Br |
| 4. | –CH3 | 5. | –C2H5 | 6. | –OCH3 |
| 7. | –OC2H5 | 8. | –CH2F | 9. | –CH2Cl |
| 10. | –CH2Br | 11. | –COOMe | 12. | –CHO |
| 13. | –OH | 14. | –NO2 | 15. | –NO |
| 16. | –CN | 17. | –SO2H | 18. | –CF3 |
| 19. | –NCS | 20. | –C≡CH | 21. | –CH=CH2 |
| 22. | –NH2 | 23. | –CONH2 | 24. | –C(CH3)=CH2 |
| 25. | –I | 26. | i-Prop | 27. | –CH2I |
| 28. | –SH | 29. | –CH=C=CH2 | 30. | –CH2–CHO |
| 31. | –SO2NH2 | ||||
2.4. In Silico Screening of Library of PCAMs
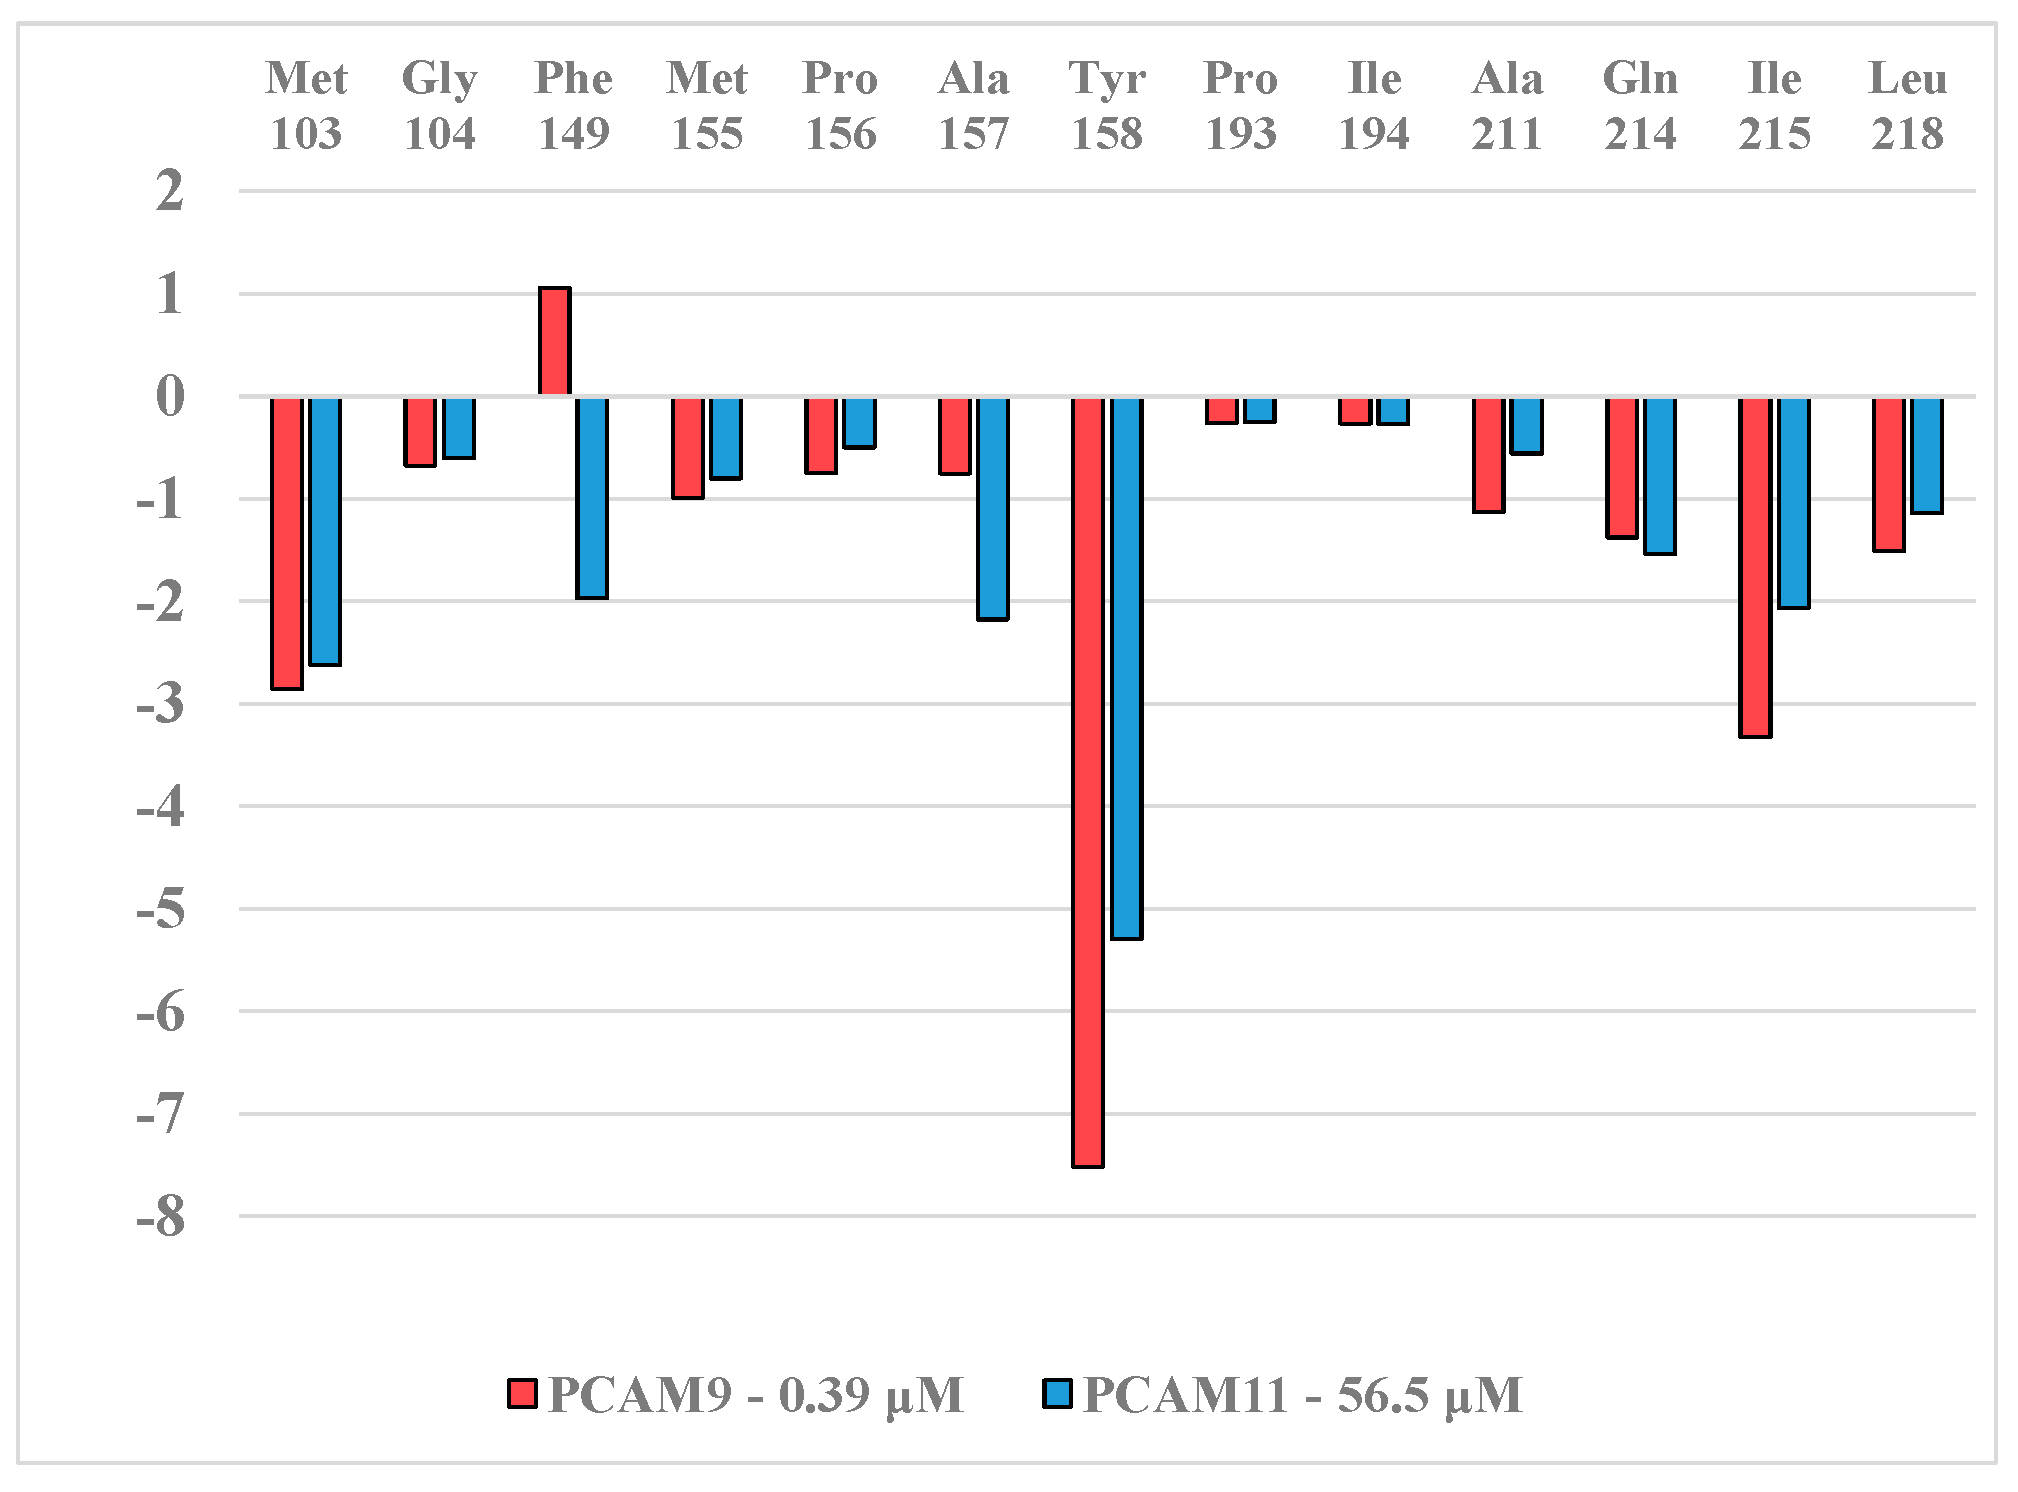
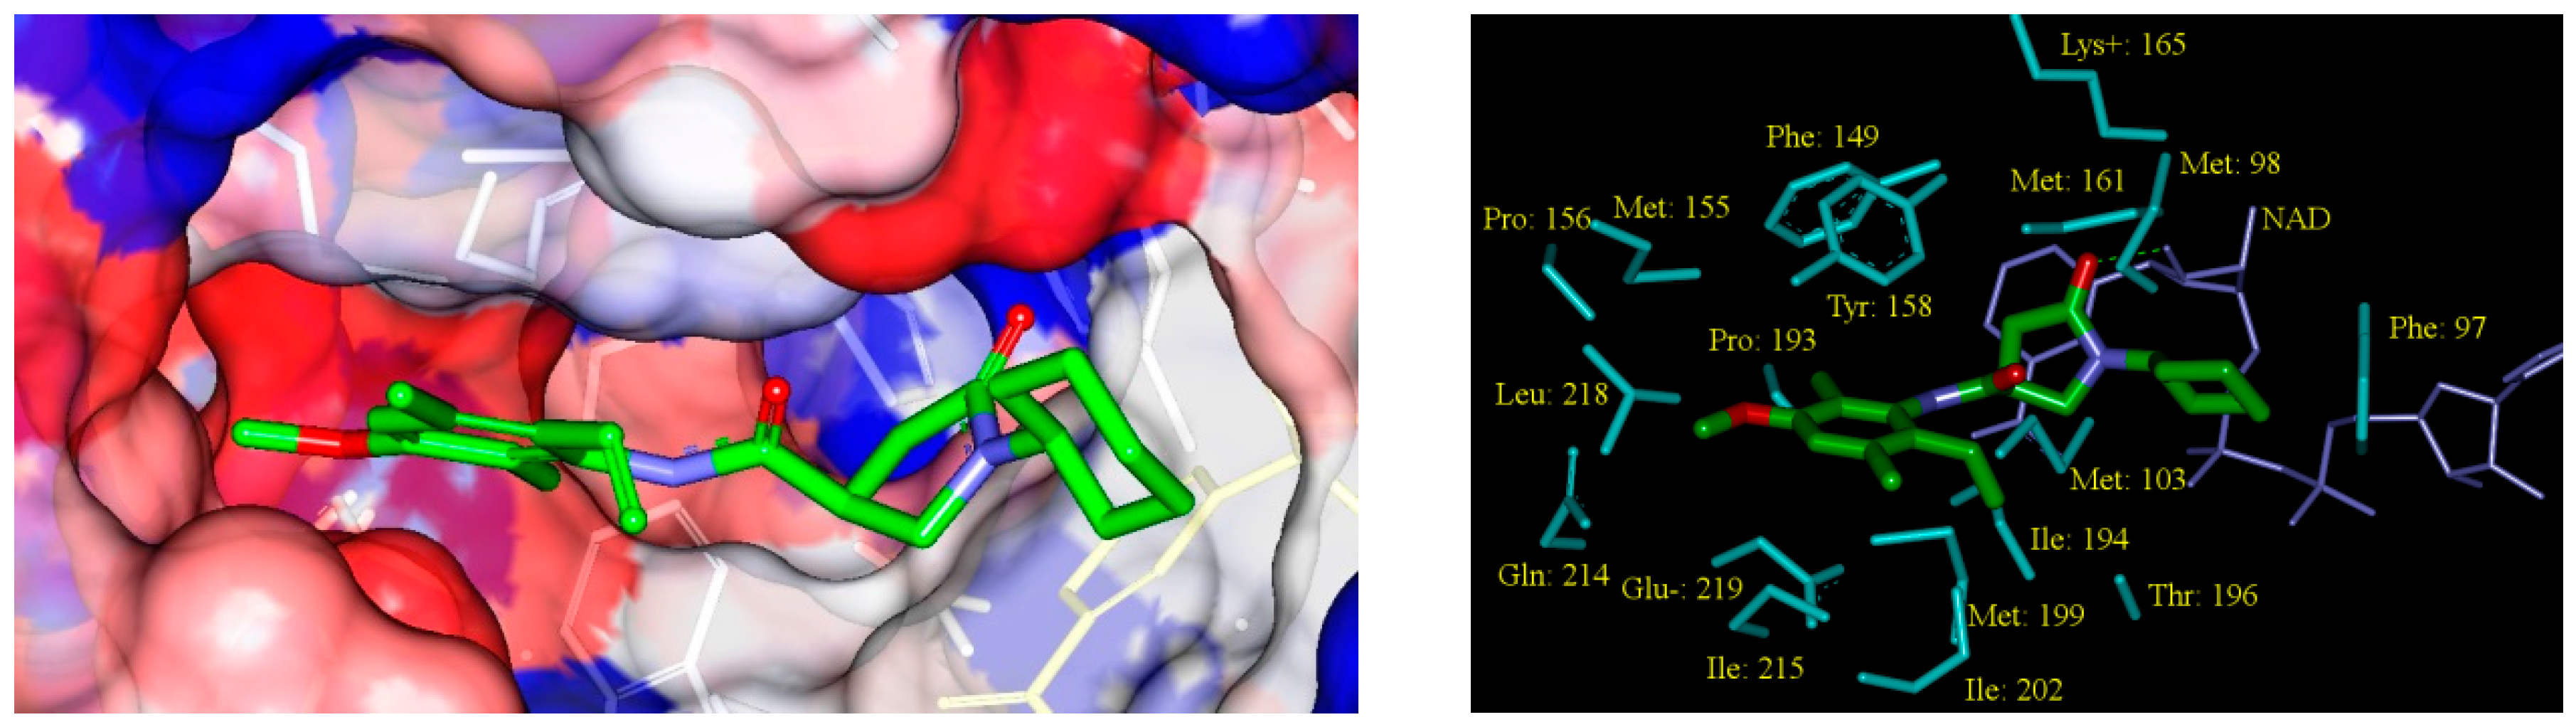
2.5. Analysis of New Inhibitors

 | |||||||||||
|---|---|---|---|---|---|---|---|---|---|---|---|
| Designed Analogues | Substituents | MW a | ΔΔHMM b | ΔΔGsol c | ΔΔTSvib d | ΔΔGcom e | IC50pre f | ||||
| R1 | R2 | R3 | R4 | R5 | (g/mol) | (kcal/mol) | (kcal/mol) | (kcal/mol) | (kcal/mol) | (nM) | |
| PCAM1 | –H | –H | –H | –H | –H | 286 | 0 | 0 | 0 | 0 | 10,660.0 g |
| 1-2-1-4-2 | –F | –Cl | –F | –CH3 | –Cl | 405 | −7.15 | −8.21 | −4.81 | −10.54 | 206.9 |
| 1-2-1-4-5 | –F | –Cl | –F | –CH3 | –C2H5 | 399 | −6.89 | −8.12 | −0.84 | −14.17 | 56.4 |
| 1-2-1-4-21 | –F | –Cl | –F | –CH3 | –CH=CH2 | 397 | −8.56 | −8.34 | −1.98 | −14.92 | 43.1 |
| 1-2-1-6-13 | –F | –Cl | –F | –OCH3 | –OH | 403 | −11.63 | −6.95 | −2.97 | −15.62 | 33.6 |
| 1-2-1-7-14 | –F | –Cl | –F | –OC2H5 | –NO2 | 446 | −13.30 | −5.87 | −4.26 | −14.91 | 43.2 |
| 1-2-1-26-13 | –F | –Cl | –F | i-Propyl | –OH | 415 | −7.39 | −7.23 | −1.95 | −12.67 | 96.4 |
| 1-2-1-26-23 | –F | –Cl | –F | i-Propyl | –CONH2 | 442 | −11.98 | −5.41 | −2.76 | −14.63 | 47.8 |
| 6-2-1-2-5 | –OCH3 | –Cl | –F | –Cl | –C2H5 | 431 | −11.44 | −6.06 | −2.61 | −14.89 | 43.5 |
| 6-2-1-2-13 | –OCH3 | –Cl | –F | –Cl | –OH | 419 | −7.90 | −7.19 | −3.28 | −11.81 | 131.3 |
| 6-2-1-2-23 | –OCH3 | –Cl | –F | –Cl | –CONH2 | 446 | −9.78 | −6.24 | −3.20 | −12.82 | 91.4 |
| 6-2-1-3-13 | –OCH3 | –Cl | –F | –Br | –OH | 464 | −9.32 | −7.29 | −3.07 | −13.53 | 70.77 |
| 6-2-1-3-23 | –OCH3 | –Cl | –F | –Br | –CONH2 | 491 | −10.96 | −6.86 | −3.81 | −14.01 | 59.6 |
| 6-2-1-4-4 | –OCH3 | –Cl | –F | –CH3 | –CH3 | 397 | −8.95 | −6.58 | −1.27 | −14.26 | 54.5 |
| 6-2-1-4-7 | –OCH3 | –Cl | –F | –CH3 | –OC2H5 | 427 | −12.34 | −7.83 | −1.29 | −18.88 | 10.5 |
| 6-2-1-4-9 | –OCH3 | –Cl | –F | –CH3 | –CH2Cl | 431 | −8.45 | −7.98 | −2.35 | −14.08 | 58.2 |
| 11-2-1-5-3 | –COOCH3 | –Cl | –F | –C2H5 | –Br | 506 | −11.72 | −8.11 | −3.69 | −16.15 | 27.8 |
| 11-2-1-5-4 | –COOCH3 | –Cl | –F | –C2H5 | –CH3 | 439 | −11.24 | −8.48 | −0.5 | −19.22 | 8.0 |
| 11-2-1-6-24 | –COOCH3 | –Cl | –F | –OCH3 | –CH3C=CH2 | 467 | −5.86 | −7.59 | −3.01 | −10.45 | 213.8 |
| 11-2-1-8-6 | –COOCH3 | –Cl | –F | –CH2F | –OCH3 | 459 | −9.65 | −5.65 | −2.94 | −12.36 | 107.6 |
| 11-2-1-9-5 | –COOCH3 | –Cl | –F | –CH2Cl | –C2H5 | 473 | −11.07 | −6.91 | −2.91 | −15.07 | 40.8 |
| 11-2-1-10-1 | –COOCH3 | –Cl | –F | ––CH2Br | –F | 459 | −12.63 | −8.52 | −4.26 | −16.89 | 21.3 |
| 11-2-1-26-4 | –COOCH3 | –Cl | –F | i-Propyl | –CH3 | 453 | −16.25 | −3.61 | −1.76 | −18.10 | 13.8 |
| 16-2-1-2-4 | –CN | –Cl | –F | –Cl | –CH3 | 412 | −6.60 | −7.88 | −3.67 | −10.82 | 187.3 |
| 16-2-1-4-6 | –CN | –Cl | –F | –CH3 | –OCH3 | 408 | −8.94 | −6.86 | −1.48 | −14.33 | 53.3 |
| 16-2-1-4-8 | –CN | –Cl | –F | –CH3 | –CH2F | 410 | −6.51 | −6.86 | −1.25 | −12.12 | 117.3 |
| 16-2-1-4-12 | –CN | –Cl | –F | –CH3 | –CH2O | 406 | −7.99 | −7.27 | −0.42 | −14.84 | 44.3 |
| 21-2-1-2-22 | –CH=CH2 | –Cl | –F | –Cl | –NH2 | 414 | −7.52 | −7.66 | −1.86 | −13.32 | 76.3 |
| 21-2-1-4-4 | –CH=CH2 | –Cl | –F | –CH3 | –CH3 | 393 | −7.90 | −7.60 | 0.29 | −15.79 | 31.5 |
| 21-2-1-4-12 | –CH=CH2 | –Cl | –F | –CH3 | –CH2O | 407 | −7.39 | −6.49 | 0.01 | −13.89 | 62.3 |
| 21-2-1-4-23 | –CH=CH2 | –Cl | –F | –CH3 | –CONH2 | 422 | −8.40 | −5.33 | −2.25 | −11.48 | 147.5 |
| 21-2-1-5-13 | –CH=CH2 | –Cl | –F | Et | –OH | 409 | −8.39 | −6.95 | 0.70 | −16.03 | 28.9 |
| 21-2-1-6-2 | –CH=CH2 | –Cl | –F | –OCH3 | –Cl | 429 | −11.45 | −8.04 | −2.59 | −16.89 | 21.3 |
| 21-2-1-6-4 | –CH=CH2 | –Cl | –F | –OCH3 | –CH3 | 409 | −10.85 | −8.45 | 0.47 | −19.77 | 7.6 |
| 21-2-1-6-11 | –CH=CH2 | –Cl | –F | –OCH3 | –COOCH3 | 507 | −7.16 | −6.30 | −1.43 | −12.03 | 121.1 |
| 21-2-1-6-17 | –CH=CH2 | –Cl | –F | –OCH3 | –SO2H | 459 | −14.65 | −2.64 | −3.36 | −13.93 | 61.5 |
| 1-1-H-1-14 | –F | –F | –H | –F | –NO2 | 385 | −18.52 | −2.39 | −6.47 | −14,44 | 51.2 |
| 1-1-H-1-15 | –F | –F | –H | –F | –NO | 369 | −7.69 | −7.78 | −5.89 | −9.57 | 292.1 |
| 1-1-H-2-15 | –F | –F | –H | –Cl | –NO | 385 | −9.16 | −7.72 | −6.05 | −10.82 | 186.9 |
| 1-1-H-2-21 | –F | –F | –H | –Cl | –C=CH2 | 383 | −7.02 | −7.98 | −4.49 | −10.51 | 209.1 |
| 1-1-H-2-24 | –F | –F | –H | –Cl | –C(CH3)=CH2 | 397 | −6.92 | −7.89 | −4.69 | −10.12 | 240.4 |
| 1-1-H-4-5 | –F | –F | –H | –CH3 | –C2H5 | 352 | −6.40 | −7.80 | 0.57 | −14.77 | 45.5 |
| 1-1-H-4-13 | –F | –F | –H | –CH3 | –OH | 362 | −5.32 | −8.15 | −0.74 | −12.74 | 94.1 |
| 1-1-H-4-21 | –F | –F | –H | –CH3 | –C=CH2 | 351 | −7.80 | −8.24 | −1.53 | −14.52 | 49.8 |
| 1-1-H-4-22 | –F | –F | –H | –CH3 | –NH2 | 368 | −5.62 | −8.31 | −2.13 | −11.81 | 131.4 |
| 1-1-H-4-28 | –F | –F | –H | –CH3 | –SH | 364 | −4.13 | −8.38 | −2.42 | −10.09 | 242.7 |
| 1-2-H-4-5 | –F | –Cl | –H | –CH3 | –C2H5 | 381 | −6.28 | −8.19 | −0.17 | −14.30 | 53.8 |
| 1-2-H-4-2 | –F | –Cl | –H | –CH3 | –Cl | 387 | −5.01 | −8.47 | −3.38 | −10.10 | 241.9 |
| 1-2-H-6-13 | –F | –Cl | –H | –OCH3 | –OH | 385 | −10.90 | −7.36 | −1.43 | −16.83 | 21.8 |
| 1-2-H-4-21 | –F | –Cl | –H | –CH3 | –CH=CH2 | 379 | −7.74 | −8.20 | −0.45 | −15.5 | 35.2 |
| 1-2-H-7-11 | –F | –Cl | –H | –OC2H5 | –COOCH3 | 419 | −7.21 | −6.77 | −3.33 | −10.65 | 198.5 |
| 1-2-H-7-14 | –F | –Cl | –H | –OC2H5 | –NO2 | 428 | −12.75 | −5.81 | −2.91 | −15.66 | 33.1 |
| 1-2-H-26-13 | –F | –Cl | –H | i-Propyl | –OH | 397 | −6.70 | −7.30 | −0.38 | −13.62 | 68.7 |
| 1-2-H-26-17 | –F | –Cl | –H | i-Propyl | –SO2H | 445 | −9.15 | −3.42 | −2.01 | −10.56 | 205.2 |
| 1-2-H-26-23 | –F | –Cl | –H | i-Propyl | –CONH2 | 424 | −10.85 | −5.73 | −2.05 | −14.53 | 49.6 |
| 4-1-H-24-30 | –CH3 | –F | –H | –C(CH3)=CH2 | –CH2–COH | 429 | −7.43 | −6.72 | −0.14 | −14.01 | 59.6 |
| 4-1-H-25-4 | –CH3 | –F | –H | –I | –CH3 | 400 | −4.89 | −7.36 | 1.93 | −14.17 | 56.3 |
| 4-1-H-25-30 | –CH3 | –F | –H | –I | –CH2–COH | 486 | −8.42 | −7.78 | −0.41 | −15.79 | 31.6 |
| 4-1-H-26-12 | –CH3 | –F | –H | i-Propyl | –CHO | 458 | −2.75 | −9.06 | 1.77 | −13.58 | 69.6 |
| 4-2-H-2-13 | –CH3 | –Cl | –H | –Cl | –OH | 388 | −4.56 | −7.41 | −0.60 | −11.37 | 153.7 |
| 4-2-H-3-12 | –CH3 | –Cl | –H | –Br | –CHO | 385 | −7.28 | −8.12 | −3.03 | −12.38 | 107.2 |
| 4-2-H-5-13 | –CH3 | –Cl | –H | –C2H5 | –OH | 441 | −5.45 | −6.93 | 2.30 | −14.68 | 46.9 |
| 4-2-H-6-5 | –CH3 | –Cl | –H | –OCH3 | –C2H5 | 378 | −9.68 | −8.67 | 1.54 | −19.89 | 7.3 |
| 4-2-H-6-13 | –CH3 | –Cl | –H | –OCH3 | –OH | 381 | −8.19 | −7.20 | 0.45 | −15.85 | 30.9 |
| 6-2-H-2-5 | –OCH3 | –Cl | –H | –Cl | –C2H5 | 413 | −7.85 | −0.86 | −7.64 | −14.63 | 47.8 |
| 6-2-H-2-13 | –OCH3 | –Cl | –H | –Cl | –OH | 446 | −6.72 | −7.65 | −2.09 | −12.27 | 111.3 |
| 6-2-H-2-23 | –OCH3 | –Cl | –H | –Cl | –CONH2 | 428 | −7.26 | −6 | −2.54 | −10.72 | 193.8 |
| 6-2-H-3-13 | –OCH3 | –Cl | –H | –Br | –OH | 446 | −7.31 | −7.01 | −1.89 | −12.43 | 105.0 |
| 6-2-H-3-23 | –OCH3 | –Cl | –H | –Br | –CONH2 | 473 | −9.98 | −7.14 | −2.87 | −14.26 | 54.6 |
| 6-2-H-4-4 | –OCH3 | –Cl | –H | –CH3 | –CH3 | 379 | −7.20 | −8.37 | 0.12 | −15.69 | 32.7 |
| 6-2-H-4-7 | –OCH3 | –Cl | –H | –CH3 | –OC2H5 | 409 | −11.08 | −8.04 | 0.61 | −19.70 | 7.7 |
| 6-2-H-4-9 | –OCH3 | –Cl | –H | –CH3 | –CH2Cl | 413 | −9.52 | −1.42 | −8.28 | −16.39 | 25.5 |
| 6-20-H-18-22 | –OCH3 | –C≡CH | –H | –CF3 | –NH2 | 393 | −10,23 | −6,53 | −3,70 | −13,06 | 83.9 |
| 6-20-H-18-23 | –OCH3 | –C≡CH | –H | –CF3 | –CONH2 | 423 | −12,25 | −7,82 | −6,80 | −13,27 | 77.9 |
| 6-20-H-18-30 | –OCH3 | –C≡CH | –H | –CF3 | –CH2–COH | 451 | −13,99 | −6,50 | −3,99 | −16,50 | 24.5 |
| 11-2-H-3-6 | –COOCH3 | –Cl | –H | –Br | –OCH3 | 486 | −3.82 | −7.77 | −1.85 | −9.74 | 275.3 |
| 11-2-H-5-3 | –COOCH3 | –Cl | –H | –C2H5 | –Br | 488 | −9.93 | −6.99 | −1.72 | −15.20 | 39.0 |
| 11-2-H-5-4 | –COOCH3 | –Cl | –H | –C2H5 | –CH3 | 421 | −11.29 | −7.18 | 0.96 | −19.44 | 8.6 |
| 11-2-H-6-24 | –COOCH3 | –Cl | –H | –OCH3 | –CH3C=CH2 | 449 | −4.39 | −7.49 | −1.21 | −10.67 | 197.2 |
| 11-2-H-8-4 | –COOCH3 | –Cl | –H | –CH2F | –CH3 | 425 | −3.13 | −6.65 | −0.78 | −8.99 | 359.5 |
| 11-2-H-8-6 | –COOCH3 | –Cl | –H | –CH2F | –OCH3 | 440 | −8.96 | −5.53 | −1.62 | −12.97 | 86.6 |
| 11-2-H-9-5 | –COOCH3 | –Cl | –H | –CH2Cl | –C2H5 | 455 | −12.37 | −6.85 | −2.41 | −16.81 | 21.9 |
| 11-2-H-10-1 | –COOCH3 | –Cl | –H | –CH2Br | –F | 441 | −10.44 | −9.07 | −3.99 | −15.52 | 34.7 |
| 11-2-H-26-4 | –COOCH3 | –Cl | –H | i-Propyl | –CH3 | 435 | −16.30 | −1.95 | −0.86 | −17.38 | 17.9 |
| 12-22-H-8-18 | –CHO | –NH2 | –H | –CH2F | –CF3 | 450 | −11.56 | −7.71 | −3.04 | −16.23 | 27 |
| 16-2-H-2-4 | –CN | –Cl | –H | –Cl | –CH3 | 394 | −4.70 | −8.52 | −2.75 | −10.47 | 211.7 |
| 16-2-H-2-6 | –CN | –Cl | –H | –Cl | –OCH3 | 410 | −6.87 | −6.91 | −4.40 | −9.38 | 313.2 |
| 16-2-H-2-13 | –CN | –Cl | –H | –Cl | –OH | 396 | −5.52 | −7.32 | −3.61 | −9.23 | 330.8 |
| 16-2-H-3-6 | –CN | –Cl | –H | –Br | –OCH3 | 455 | −8.58 | −7.38 | −5.32 | −10.64 | 199.3 |
| 16-2-H-4-6 | ––CN | –Cl | –H | –CH3 | –OCH3 | 390 | −7.58 | −7.53 | −0.1 | −15.01 | 41.7 |
| 16-2-H-4-8 | –CN | –Cl | –H | –CH3 | –CH2F | 392 | −7.65 | −7.95 | −0.77 | −14.82 | 44.6 |
| 16-2-H-4-12 | –CN | –Cl | –H | –CH3 | –CH2O | 388 | −5.95 | −6.83 | 0.16 | −12.94 | 87.5 |
| 21-2-H-2-22 | –CH=CH2 | –Cl | –H | –Cl | –NH2 | 396 | −6.35 | −0.83 | −7.53 | −13.05 | 84.0 |
| 21-2-H-4-4 | –CH=CH2 | –Cl | –H | –CH3 | –CH3 | 375 | −7.31 | −7.56 | 0.97 | −15.85 | 30.9 |
| 21-2-H-4-12 | –CH=CH2 | –Cl | –H | –CH3 | –CH2O | 389 | −8.30 | −6.77 | 0.17 | −15.24 | 38.4 |
| 21-2-H-4-23 | –CH=CH2 | –Cl | –H | –CH3 | –CONH2 | 404 | −6.44 | −6.28 | −0.86 | −11.86 | 128.9 |
| 21-2-H-5-13 | –CH=CH2 | –Cl | –H | –C2H5 | –OH | 391 | −7.09 | −7.1 | 1.34 | −15.5 | 34.6 |
| 21-2-H-6-2 | –CH=CH2 | –Cl | –H | –OCH3 | –Cl | 411 | −11.55 | −8.14 | −1.16 | −18.5 | 11.9 |
| 21-2-H-6-4 | –CH=CH2 | –Cl | –H | –OCH3 | –CH3 | 391 | −10.70 | −8.46 | 2.05 | −21.2 | 4.5 |
| 21-2-H-6-11 | –CH=CH2 | –Cl | –H | –OCH3 | –COOCH3 | 490 | −6.84 | −6.24 | −0.86 | −12.22 | 113.5 |
| 21-2-H-6-17 | –CH=CH2 | –Cl | –H | –OCH3 | –SO2H | 441 | −12.45 | −2.69 | −1.52 | −13.62 | 68.6 |

2.6. ADME Profiles of Designed PCAMs
| PCAM a | #stars b | MW c (g·mol−1) | Smol d (Å2) | Smol, hfo e (Å2) | Vmol f (Å3) | RotB g | HBdon h | HBacc i | logPo/w j | logSwat k | logKHSA l | logB/B m | BIPcaco n (nm·s−1) | #meta ° | IC50pre p | HOA q | %HOA r |
|---|---|---|---|---|---|---|---|---|---|---|---|---|---|---|---|---|---|
| 1-2-1-6-13 | 0 | 402.8 | 663.6 | 395.3 | 1169 | 4 | 2 | 7 | 2.7 | −4.4 | −0.08 | −0.52 | 452.2 | 4 | 33.6 | 3 | 90.1 |
| 6-2-1-4-7 | 0 | 426.9 | 685 | 509.6 | 1285 | 5 | 1 | 7 | 3.8 | −4.5 | 0.20 | −0.06 | 1434.6 | 5 | 10.5 | 3 | 100 |
| 21-2-1-4-4 | 0 | 392.9 | 676 | 481.4 | 1237 | 3 | 1 | 5.5 | 4.1 | −5.2 | 0.46 | 0.04 | 1414.3 | 4 | 31.5 | 3 | 100 |
| 11-2-1-5-4 | 0 | 438.9 | 702.2 | 504.3 | 1313.1 | 4 | 0 | 6.5 | 3.8 | −4.6 | 0.2 | −0.3 | 721.4 | 4 | 8.0 | 3 | 100 |
| 21-2-1-6-2 | 0 | 429.3 | 686 | 441.9 | 1251 | 4 | 1 | 6.3 | 4.1 | −5.2 | 0.30 | 0.09 | 1414.3 | 3 | 21.3 | 3 | 100 |
| 21-2-1-5-13 | 0 | 408.9 | 695.5 | 472.8 | 1265 | 5 | 2 | 6.3 | 3.6 | −4.9 | 0.27 | −0.49 | 628.0 | 4 | 28.9 | 3 | 100 |
| 21-2-1-6-4 | 0 | 408.9 | 684.3 | 500.5 | 1260 | 4 | 1 | 6.3 | 3.9 | −4.9 | 0.32 | −0.04 | 1426.4 | 4 | 7.6 | 3 | 100 |
| 11-2-1-26-4 | 0 | 453 | 706.9 | 528.1 | 1346 | 4 | 0 | 6.5 | 4.0 | −4.7 | 0.30 | -0.28 | 840.5 | 4 | 13.8 | 3 | 100 |
| 21-2-H-6-4 | 0 | 390.9 | 698.2 | 521.8 | 1261 | 4 | 1 | 6.3 | 3.9 | −5 | 0.32 | −0.10 | 1467.3 | 5 | 4.5 | 3 | 100 |
| 6-2-H-4-7 | 0 | 408.9 | 689.8 | 524.4 | 1286 | 5 | 1 | 7 | 3.6 | −4.4 | 0.20 | −0.19 | 1311.2 | 6 | 7.7 | 3 | 100 |
| 21-2-H-6-2 | 0 | 411.3 | 688.7 | 445.5 | 1244 | 4 | 1 | 6.3 | 4.0 | −5.1 | 0.27 | 0.04 | 1413.9 | 4 | 11.9 | 3 | 100 |
| 21-2-H-5-13 | 0 | 390.9 | 691.5 | 476.4 | 1255 | 5 | 2 | 6.3 | 3.4 | −4.7 | 0.24 | −0.54 | 631.1 | 5 | 34.6 | 3 | 100 |
| 21-2-H-4-4 | 0 | 374.9 | 691.9 | 506.2 | 1249 | 3 | 1 | 5.5 | 4.1 | −5.4 | 0.48 | −0.04 | 1441.3 | 5 | 30.9 | 3 | 100 |
| 1-2-H-4-21 | 0 | 378.9 | 660.2 | 428.2 | 1194 | 3 | 1 | 5.5 | 3.9 | −5 | 0.34 | 0.01 | 1321.1 | 4 | 35.2 | 3 | 100 |
| 6-2-H-2-5 | 0 | 413.3 | 671.4 | 440.2 | 1241 | 4 | 1 | 6.3 | 4.0 | −4.8 | 0.28 | 0.05 | 1389.1 | 5 | 47.8 | 3 | 100 |
| 1-2-H-6-13 | 0 | 384.8 | 656.6 | 397.5 | 1155 | 4 | 2 | 7 | 2.5 | −4.2 | −0.11 | −0.56 | 452.7 | 5 | 21.8 | 3 | 89.3 |
| 1-2-H-7-14 | 0 | 427.9 | 721.2 | 435.4 | 1277 | 5 | 1 | 7.3 | 3.0 | −5 | 0.10 | −1.05 | 214.6 | 5 | 33.1 | 3 | 86.4 |
| 11-2-H-5-4 | 0 | 420.9 | 698.4 | 509.7 | 1304 | 4 | 0 | 6.5 | 3.7 | −4.4 | 0.17 | −0.38 | 748.6 | 5 | 8.6 | 3 | 100 |
| 11-2-H-26-4 | 0 | 435 | 707.2 | 534.8 | 1340 | 4 | 0 | 6.5 | 3.9 | −4.6 | 0.28 | −0.33 | 825.5 | 5 | 17.9 | 3 | 100 |
| 11-2-H-9-5 | 0 | 455 | 697.2 | 448.7 | 1326 | 4 | 0 | 6.5 | 4.1 | −4.7 | 0.24 | −0.18 | 780.0 | 5 | 21.9 | 3 | 100 |
| 4-1-H-25-30 | 0 | 486.3 | 672.7 | 386.1 | 1209 | 4 | 1 | 7.5 | 2.7 | −4.7 | −0.07 | −0.661 | 410.6 | 5 | 31.6 | 3 | 89.6 |
| 4-2-H-6-5 | 0 | 392.9 | 686.7 | 527.2 | 1241 | 4 | 1 | 6.2 | 3.7 | −5.2 | 0.27 | −0.126 | 1675.4 | 6 | 7.3 | 3 | 100 |
| 4-2-H-6-13 | 0 | 380.8 | 662.2 | 451.1 | 1173 | 4 | 2 | 7 | 2.5 | −4.2 | −0.06 | −0.576 | 532.9 | 6 | 30.9 | 3 | 90.7 |
| 6-20-H-18-30 | 0 | 450.4 | 727.9 | 446.8 | 1329 | 6 | 1.5 | 8.2 | 3.2 | −5.1 | 0.02 | −0.632 | 625.9 | 5 | 24.5 | 3 | 95.9 |
| 12-22-H-8-18 | 0 | 429.4 | 662.7 | 341.8 | 1201 | 4 | 1 | 6.5 | 2.9 | −4.9 | 0.12 | −0.885 | 216.7 | 5 | 27 | 3 | 85.9 |
| 11-2-H-10-1 | 0 | 489.8 | 685.6 | 380.4 | 1265 | 4 | 0 | 6.5 | 3.8 | −4.6 | 0.06 | −0.157 | 700.7 | 4 | 34.7 | 3 | 100 |
| 11-2-H-5-3 | 0 | 485.8 | 702.6 | 457.6 | 1304 | 4 | 0 | 6.5 | 3.8 | −4.7 | 0.17 | −0.296 | 703.9 | 4 | 39 | 3 | 100 |
| Rifampin | 1 | 137.1 | 313.3 | 0.0 | 479.2 * | 2 | 3 | 4.5 | −0.7 | 0 | −0.8 | −0.8 | 267.5 | 2 | - | 2 | 67 |
| Isoniazid | 4 | 123.1 * | 299.3 | 0.0 | 442.6 * | 1 | 2 | 5 | −0.6 | −0.5 | −0.8 | −0.7 | 298.4 | 4 | - | 2 | 67 |
| Ethambutol | 2 | 204.3 | 475.7 | 395.8 | 805.7 | 11 | 4 | 6.4 | −0.2 | 0.6 | −0.8 | 0.0 | 107.8 | 4 | - | 2 | 62 |
| Pyrazinamide | 10 | 823.0 * | 1090 * | 850.0 * | 2300 * | 25 * | 6 | 20.3 * | 3.0 | −3.1 | −0.3 | −2.7 | 38.2 | 11 * | - | 1 | 34 |
| Gatifloxacin | 0 | 375.4 | 597.5 | 355.7 | 1093.0 | 2 | 1 | 6.8 | 0.5 | −4.0 | 0 | −0.6 | 17.0 | 1 | - | 2 | 52 |
| Moxifloxacin | 0 | 401.4 | 641.2 | 395.6 | 1167.1 | 2 | 1 | 6.8 | 1.0 | −4.7 | 0.2 | −0.6 | 20.9 | 1 | - | 2 | 56 |
| Rifapentine | 10 | 877.0 * | 1024.3 * | 844.9 * | 2332.6 * | 24 * | 6 | 20.9 * | 3.6 | −2.2 | −0.2 | −1.5 | 224.0 | 13 * | - | 1 | 51 |
| Bedaquiline | 4 | 555.5 | 786.5 | 213.7 | 1531.7 | 9 | 1 | 3.8 | 7.6* | −6.9 | 1.7 | 0.4 | 1562.2 | 5 | - | 1 | 100 |
| Delamanid | 2 | 534.5 | 795.6 | 284.4 | 1469.9 | 7 | 0 | 6.0 | 5.8 | −7.6 | 1.0 | −1.0 | 590.9 | 2 | - | 1 | 85 |
| Linezolid | 0 | 337.4 | 554.6 | 337.2 | 995.4 | 2 | 1 | 8.7 | 0.6 | −2.0 | −0.7 | −0.5 | 507.0 | 2 | - | 3 | 79 |
| Sutezolid | 1 | 353.4 | 594.0 | 330.6 | 1046.2 | 2 | 1 | 7.5 | 1.3 | −3.4 | −0.4 | −0.4 | 449.3 | 0 | - | 3 | 82 |
| Ofloxacin | 1 | 361.4 | 580.5 | 337.0 | 1044.0 | 1 | 0 | 7.3 | −0.4 | −2.8 | −0.5 | −0.4 | 25.9 | 1 | - | 2 | 50 |
| Amikacin | 14 | 585.6 | 738.3 | 350.3 | 1499.5 | 22 * | 17 * | 26.9 * | −7.9 * | −0.2 | −2.1 | −3.5 | 0 | 14 * | - | 1 | 0 |
| Kanamycin | 10 | 484.5 | 655.8 | 258.9 | 1290.9 | 17 * | 15 * | 22.7 * | −6.7 * | 2.0 | −1.4 | −3.1 | 0 | 12 * | - | 1 | 0 |
| Imipenem | 0 | 299.3 | 486.5 | 259.1 | 879.4 | 8 | 3 | 7.2 | 1.0 | −1.8 | −0.7 | −1.4 | 35.0 | 3 | - | 3 | 61 |
| Amoxicillin | 2 | 365.4 | 560.8 | 164.6 | 1032.9 | 6 | 4.25 | 8.0 | −2.5 | −0.8 | −1.1 | −1.5 | 1.0 | 5 | - | 1 | 12 |
| Clavulanate | 0 | 199.2 | 396.1 | 184.6 | 629.5 | 4 | 2 | 6.5 | −0.8 | 0.3 | −1.3 | −1.3 | 13.3 | 2 | - | 2 | 42 |
3. Experimental Section
3.1. Training and Validation Sets
3.2. Model Building
3.3. Molecular Mechanics
3.4. Conformational Search
3.5. Solvation Gibbs free energies
3.6. Calculation of Binding Affinity and QSAR Model
+ TStran{I} + TSrot{I} − [TSvib{E:I} − TSvib{E} − TSvib{I}]
= ΔHMM + TStran{I} + TSrot{I} − ΔTSvib + ΔGsol
3.7. Interaction Energy
3.8. Pharmacophore Generation
3.9. ADME Properties
3.10. Virtual Combinatorial Library Generation
3.11. ADME-Based Library Focusing
3.12. Pharmacophore-Based Library Focusing
3.13. In Silico Screening
4. Conclusions
Supplementary Files
Supplementary File 1Acknowledgments
Author Contributions
Conflicts of Interest
References
- World Health Organization (WHO). Global Tuberculosis Report 2014; WHO: Geneva, Switzerland, 2014. [Google Scholar]
- Vilcheze, C.; Morbidoni, H.R.; Weisbrod, T.R.; Iwamoto, H.; Kuo, M.; Sacchettini, J.C.; Jacobs, W.R., Jr. Inactivation of the InhA-encoded fatty acid synthase II (FASII) enoyl-acyl carrier protein reductase induces accumulation of the FASI end products and cell lysis of Mycobacterium smegmatis. J. Bacteriol. 2000, 182, 4059–4067. [Google Scholar] [CrossRef] [PubMed]
- Aguero, F.; Al-Lazikani, B.; Aslett, M.; Berriman, M.; Buckner, F.S.; Campbell, R.K.; Carmona, S.; Carruthers, I.M.; Chan, A.W.; Chen, F.; et al. Genomic-scale prioritization of drug targets: The TDR Targets database. Nat. Rev. Drug Discov. 2008, 7, 900–907. [Google Scholar] [CrossRef] [PubMed]
- Campbell, J.W.; Cronan, J.E., Jr. Bacterial fatty acid biosynthesis: Targets for antibacterial drug discovery. Annu. Rev. Microbiol. 2001, 55, 305–332. [Google Scholar] [CrossRef] [PubMed]
- Timmins, G.S.; Deretic, V. Mechanisms of action of isoniazid. Mol. Microbiol. 2006, 62, 1220–1227. [Google Scholar] [CrossRef] [PubMed]
- Basso, L.A.; Zheng, R.; Musser, J.M.; Jacobs, W.R., Jr.; Blanchard, J.S. Mechanisms of isoniazid resistance in Mycobacterium tuberculosis: Enzymatic characterization of enoyl reductase mutants identified in isoniazid-resistant clinical isolates. J. Infect. Dis. 1998, 178, 769–775. [Google Scholar] [CrossRef] [PubMed]
- Dessen, A.; Quemard, A.; Blanchard, J.S.; Jacobs, W.R., Jr.; Sacchettini, J.C. Crystal structure and function of the isoniazid target of Mycobacterium tuberculosis. Science 1995, 267, 1638–1641. [Google Scholar] [CrossRef] [PubMed]
- Schroeder, E.K.; Basso, L.A.; Santos, D.S.; de Souza, O.N. Molecular dynamics simulation studies of the wild-type, I21V, and I16T mutants of isoniazid-resistant Mycobacterium tuberculosis enoyl reductase (InhA) in complex with NADH: Toward the understanding of NADH-InhA different affinities. Biophys. J. 2005, 89, 876–884. [Google Scholar] [CrossRef] [PubMed]
- Freundlich, J.S.; Wang, F.; Vilcheze, C.; Gulten, G.; Langley, R.; Schiehser, G.A.; Jacobus, D.P.; Jacobs, W.R., Jr.; Sacchettini, J.C. Triclosan derivatives: Towards potent inhibitors of drug-sensitive and drug-resistant Mycobacterium tuberculosis. ChemMedChem 2009, 4, 241–248. [Google Scholar] [CrossRef] [PubMed]
- Am Ende, C.W.; Knudson, S.E.; Liu, N.; Childs, J.; Sullivan, T.J.; Boyne, M.; Xu, H.; Gegina, Y.; Knudson, D.L.; Johnson, F.; et al. Synthesis and in vitro antimycobacterial activity of B-ring modified diaryl ether InhA inhibitors. Bioorg. Med. Chem. Lett. 2008, 18, 3029–3033. [Google Scholar] [CrossRef] [PubMed]
- Luckner, S.R.; Liu, N.; Am Ende, C.W.; Tonge, P.J.; Kisker, C. A slow, tight binding inhibitor of InhA, the enoyl-acyl carrier protein reductase from Mycobacterium tuberculosis. J. Biol. Chem. 2010, 285, 14330–14337. [Google Scholar] [CrossRef] [PubMed]
- He, X.; Alian, A.; Stroud, R.; de Montellano, P.R. Pyrrolidine carboxamides as a novel class of inhibitors of enoyl acyl carrier protein reductase from Mycobacterium tuberculosis. J. Med. Chem. 2006, 49, 6308–6323. [Google Scholar] [CrossRef] [PubMed]
- He, X.; Alian, A.; de Montellano, P.R. Inhibition of the Mycobacterium tuberculosis enoyl acyl carrier protein reductase InhA by arylamides. Bioorg. Med. Chem. 2007, 15, 6649–6658. [Google Scholar] [CrossRef] [PubMed]
- Punkvang, A.; Kamsri, P.; Kumkong, A.; Kunasa, K.; Saparpakorn, P.; Hannongbua, S.; Wolschann, P.; Pungpo, P. The structural requirement of direct InhA inhibitors for high potency against M. tuberculosis based on computer aided molecular design. In Science against Microbial Pathogens: Communicating Current Research and Technological Advances; Mendez-Vilas, A., Ed.; Formatex Research Center: Badajos, Spain, 2011; pp. 160–168. [Google Scholar]
- Hartkoorn, R.C.; Sala, C.; Neres, J.; Pojer, F.; Magnet, S.; Mukherjee, R.; Uplekar, S.; Rottger, S.; Altmann, K.; Cole, S. Towards a new tuberculosis drug: Pyridomycin—Nature’s isoniazid. EMBO Mol. Med. 2012, 4, 1032–1042. [Google Scholar] [CrossRef] [PubMed]
- Keita, M.; Kumar, A.; Dali, B.; Meqnassan, E.; Siddiqi, M.; Frecer, V.; Miertus, S. Quantitative structure-activity relationships and design of thymine-like inhibitors of thymidine monophosphate kinase of Mycobacterium tuberculosis with favourable pharmacokinetic profiles. RSC Adv. 2014, 4, 55853–55866. [Google Scholar] [CrossRef]
- Lipinski, C.A.; Lombardo, F.; Dominy, B.W.; Feeney, P.J. Experimental and computational approaches to estimate solubility and permeability in drug discovery and development settings. Adv. Drug Deliv. Rev. 2001, 46, 3–26. [Google Scholar] [CrossRef]
- Available Chemicals Directory (ACD); Version 95.1; MDL Information Systems: San Leandro, CA, USA, 2003.
- Duffy, E.M.; Jorgensen, W.L. Prediction of properties from simulations: Free energies of solvation in hexadecane, octanol, and water. J. Am. Chem. Soc. 2000, 122, 2878–2888. [Google Scholar] [CrossRef]
- Jorgensen, W.L.; Duffy, E.M. Prediction of drug solubility from Monte Carlo simulations. Bioorg. Med. Chem. Lett. 2000, 10, 1155–1158. [Google Scholar] [CrossRef]
- QikProp; Version 3.7, Release 14, X Schrödinger; LLC: New York, NY, USA, 2014.
- Berman, H.M.; Westbrook, J.; Feng, Z.; Gilliland, G.; Bhat, T.N.; Weissig, H.; Shindyalov, I.N.; Bourne, P.E. The Protein Data Bank. Nucleic Acids Res. 2000, 28, 235–242. [Google Scholar] [CrossRef] [PubMed]
- Insight-II and Discover Molecular Modeling and Simulation Package; Version 2005; Accelrys: San Diego, CA, USA, 2005.
- Owono Owono, L.C.; Keita, M.; Megnassan, E.; Frecer, V.; Miertus, S. Design of thymidine analogues targeting thymidilate kinase of Mycobacterium tuberculosis. Tuberc. Res. Treat. 2013, 2013, 670836. [Google Scholar] [CrossRef] [PubMed]
- Frecer, V.; Miertus, S.; Tossi, A.; Romeo, D. Rational design of inhibitors for drug-resistant HIV-1 aspartic protease mutants. Drug Des. Discov. 1998, 15, 211–231. [Google Scholar] [PubMed]
- Frecer, V.; Miertus, S. Interactions of ligands with macromolecules: Rational design of specific inhibitors of aspartic protease of HIV-1. Macromol. Chem. Phys. 2002, 203, 1650–1657. [Google Scholar] [CrossRef]
- Frecer, V.; Berti, F.; Benedetti, F.; Miertus, S. Design of peptidomimetic inhibitors of aspartic protease of HIV-1 containing -PheψPro- core and displaying favourable ADME-related properties. J. Mol. Graph. Model. 2008, 27, 376–387. [Google Scholar] [CrossRef] [PubMed]
- Dali, B.; Keita, M.; Megnassan, E.; Frecer, V.; Miertus, S. Insight into selectivity of peptidomimetic inhibitors with modified statine core for plasmepsin II of Plasmodium falciparum over human cathepsin D. Chem. Biol. Drug Des. 2012, 79, 411–430. [Google Scholar] [CrossRef] [PubMed]
- Megnassan, E.; Keita, M.; Bieri, C.; Esmel, A.; Frecer, V.; Miertus, S. Design of novel dihydroxynaphthoic acid inhibitors of Plasmodium falciparum lactate dehydrogenase. Med. Chem. 2012, 8, 970–984. [Google Scholar] [CrossRef] [PubMed]
- Owono Owono, L.C.; Ntie-Kang, F.; Keita, M.; Megnassan, E.; Frecer, V.; Miertus, S. Virtually designed triclosan-based inhibitors of enoyl-acyl carrier protein reductase of Mycobacterium tuberculosis and of Plasmodium falciparum. Mol. Inform. 2015, 34, 292–307. [Google Scholar] [CrossRef]
- Maple, J.R.; Hwang, M.-J.; Stockfisch, T.P.; dinur, U.; Waldman, M.; Ewig, C.; Hagler, A. Derivation of class II force fields. I. Methodology and quantum force field for the alkyl functional group and alkane molecules. J. Comput. Chem. 1994, 15, 162–182. [Google Scholar] [CrossRef]
- Discovery Studio Molecular Modeling and Simulation Program; Version 2.5; Accelrys, Inc.: San Diego, CA, USA, 2009.
- Gilson, M.K.; Honig, B. The inclusion of electrostatic hydration energies in molecular mechanics calculations. J. Comput. Aided Mol. Des. 1991, 5, 5–20. [Google Scholar] [CrossRef] [PubMed]
- Rocchia, W.; Sridharan, S.; Nicholls, A.; Alexov, E.; Chiabrera, A.; Honig, B. Rapid grid-based construction of the molecular surface and the use of induced surface charge to calculate reaction field energies: Applications to the molecular systems and geometric objects. J. Comput. Chem. 2002, 23, 128–137. [Google Scholar] [CrossRef] [PubMed]
- Böttcher, C.J.F. Theory of Electric Polarization; Elsevier: Amsterdam, The Netherlands, 1973. [Google Scholar]
- Miertuš, S.; Scrocco, E.; Tomasi, J. Electrostatic interaction of a solute with a continuum. A direct utilizaion of ab initio molecular potentials for the prevision of solvent effects. Chem. Phys. 1981, 55, 117–129. [Google Scholar]
- Frecer, V.; Miertuš, S. Polarizable continuum model of solvation for biopolymers. Int. J. Quantum Chem. 1992, 42, 1449–1468. [Google Scholar] [CrossRef]
- Copeland, R.A.; Lombardo, D.; Giannaras, J.; Decicco, C. Estimating {KI} values for tight binding inhibitors from dose-response plots. Bioorg. Med. Chem. Lett. 1995, 5, 1947–1952. [Google Scholar] [CrossRef]
- Fischer, S.; Smith, A.J.C.; Verma, C.S. Dissecting the Vibrational entropy change on protein/ligand binding: Burial of a water molecule in bovine pancreatic trypsin inhibitor. J. Phys. Chem. B 2001, 105, 8050–8055. [Google Scholar] [CrossRef]
- Schwarzl, S.M.; Tschopp, T.B.; Smith, J.C.; Fischer, S. Can the calculation of ligand binding free energies be improved with continuum solvent electrostatics and an ideal-gas entropy correction? J. Comput. Chem. 2002, 23, 1143–1149. [Google Scholar] [CrossRef] [PubMed]
- Li, H.; Sutter, J.; Hoffmann, R. Pharmacophore Perception, Development and Use in Drug Design; Güner, O.F., Ed.; International University Line: San Diego, CA, USA, 2000; pp. 171–189. [Google Scholar]
- Jorgensen, W.L.; Duffy, E.M. Prediction of drug solubility from structure. Adv. Drug Deliv. Rev. 2002, 54, 355–366. [Google Scholar] [CrossRef]
- Molecular Operating Environment (MOE); H3A 2R7; Chemical Computing Group Inc.: Montreal, QC, Canada, 2014.
- Willett, P. Molecular Similarity in Drug Design; Dean, P.M., Ed.; Chapman and Hall: Glasgow, UK, 1994; pp. 110–137. [Google Scholar]
© 2015 by the authors; licensee MDPI, Basel, Switzerland. This article is an open access article distributed under the terms and conditions of the Creative Commons by Attribution (CC-BY) license (http://creativecommons.org/licenses/by/4.0/).
Share and Cite
Kouassi, A.F.; Kone, M.; Keita, M.; Esmel, A.; Megnassan, E.; N’Guessan, Y.T.; Frecer, V.; Miertus, S. Computer-Aided Design of Orally Bioavailable Pyrrolidine Carboxamide Inhibitors of Enoyl-Acyl Carrier Protein Reductase of Mycobacterium tuberculosis with Favorable Pharmacokinetic Profiles. Int. J. Mol. Sci. 2015, 16, 29744-29771. https://doi.org/10.3390/ijms161226196
Kouassi AF, Kone M, Keita M, Esmel A, Megnassan E, N’Guessan YT, Frecer V, Miertus S. Computer-Aided Design of Orally Bioavailable Pyrrolidine Carboxamide Inhibitors of Enoyl-Acyl Carrier Protein Reductase of Mycobacterium tuberculosis with Favorable Pharmacokinetic Profiles. International Journal of Molecular Sciences. 2015; 16(12):29744-29771. https://doi.org/10.3390/ijms161226196
Chicago/Turabian StyleKouassi, Affiba Florance, Mawa Kone, Melalie Keita, Akori Esmel, Eugene Megnassan, Yao Thomas N’Guessan, Vladimir Frecer, and Stanislav Miertus. 2015. "Computer-Aided Design of Orally Bioavailable Pyrrolidine Carboxamide Inhibitors of Enoyl-Acyl Carrier Protein Reductase of Mycobacterium tuberculosis with Favorable Pharmacokinetic Profiles" International Journal of Molecular Sciences 16, no. 12: 29744-29771. https://doi.org/10.3390/ijms161226196