2.1. Texture of the Composites Obtained from Dry Mixtures
The raw
Manihot residues had an irregular elongated shape, which was retained in the carbonized samples. A preliminary trial consisted of mechanical dry mixing of the
Manihot carbon C800 with TiO
2 in a weight ratio 1:1. This corresponded to procedure (
i) mentioned in the introduction. The resulting material exhibited a specific surface S
BET of 345 m
2·g
−1, ~60% microporosity and an average pore diameter of 7.4 nm. However, the TiO
2 particles were not permanently immobilized on the carbon surface. This observation led us to develop two different one-step preparation methods using raw residues according to procedure (
iv). The two variants of the preparation method are shown in
Figure 1.
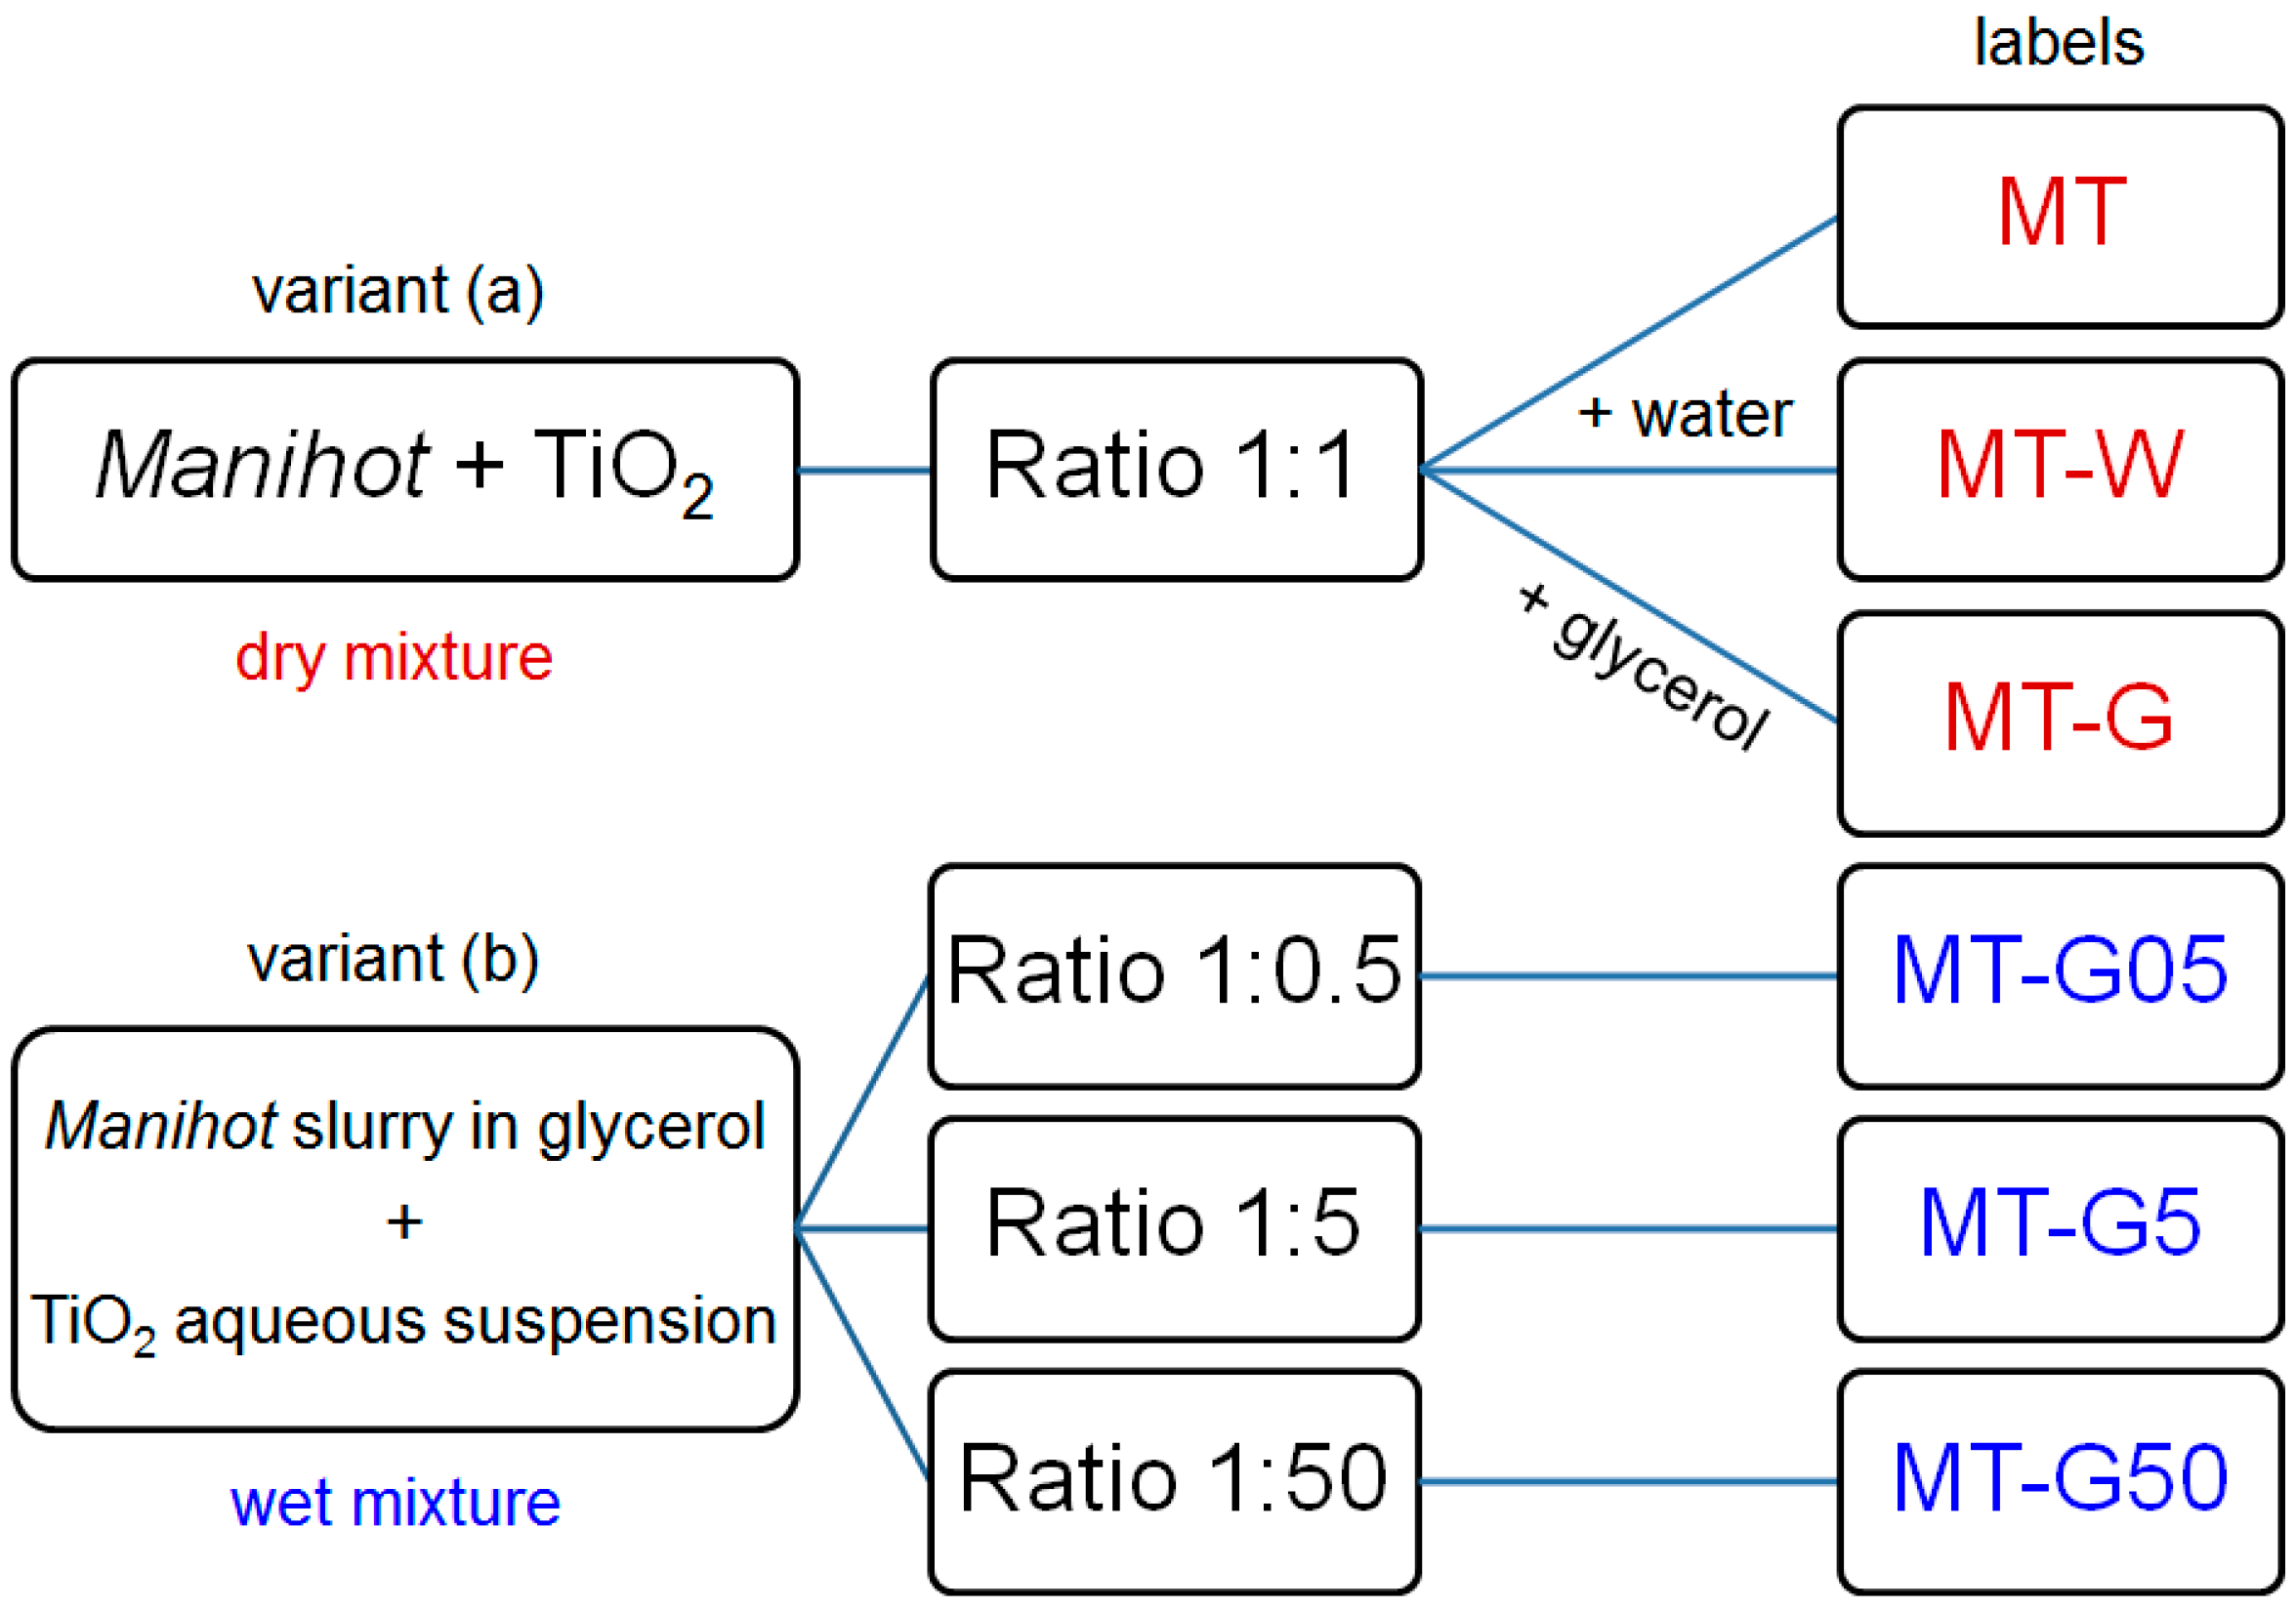
Figure 2a shows the nitrogen adsorption isotherms of the sieved samples of the MT, MT-W and MT-G composites prepared by dry mixing by variant (a), as shown in n
Figure 1. As a reference, the N
2 adsorption isotherms of the Manihot carbon C800 and commercial TiO
2 are shown in
Figure 2b.
Table 1 lists the texture parameters of the precursors (TiO
2 and
Manihot) and the carbon obtained at 800 °C using the vascular system of the
Manihot stems.
Figure 1.
General scheme depicting two preparation variants and labels of the materials prepared from the Manihot residues at 800 °C.
Figure 1.
General scheme depicting two preparation variants and labels of the materials prepared from the Manihot residues at 800 °C.
Figure 2.
N
2 adsorption (empty symbols) and desorption (filled symbols) isotherms at 77 K for (
a) the materials prepared from dry mixtures of raw
Manihot residues and TiO
2 (variant (a) in
Figure 1) and (
b)
Manihot carbon C800 (
dp 0.25 mm) and the photocatalyst TiO
2.
Figure 2.
N
2 adsorption (empty symbols) and desorption (filled symbols) isotherms at 77 K for (
a) the materials prepared from dry mixtures of raw
Manihot residues and TiO
2 (variant (a) in
Figure 1) and (
b)
Manihot carbon C800 (
dp 0.25 mm) and the photocatalyst TiO
2.
Table 1.
Texture parameters of the precursors, carbon C800 and TiO
2/C materials prepared in a 1:1
Manihot: TiO
2 ratio by variant (a) as depicted in
Figure 1, and the corresponding isotherms are shown in
Figure 2.
Table 1.
Texture parameters of the precursors, carbon C800 and TiO2/C materials prepared in a 1:1 Manihot: TiO2 ratio by variant (a) as depicted in Figure 1, and the corresponding isotherms are shown in Figure 2.
| Material | Specific Surface (m2·g−1) | Vμ, cm3·g−1 | Vtot, cm3·g−1 | Average Pore Diameter, nm |
|---|
| BET | S0t (%) | Set |
|---|
| Precursors | TiO2 | 58 | - | - | - | 0.678 | - |
| raw Manihot | 72 a | - | - | - | - | - |
| Carbon | C800 | 449 | 318 (71) | 130 | 0.160 | 0.263 | 2.6 |
| TiO2/C | MT | 226 | 100 (44) | 126 | 0.051 | 0.712 | 6.9 |
| MT-W | 493 | 245 (50) | 248 | 0.125 | 0.611 | 5.4 |
| MT-G | 87 | 24 (28) | 63 | 0.013 | 0.353 | 17.6 |
A comparison of the texture parameters in
Table 1 demonstrates the effect of the addition of water or glycerol on the dry Manihot + TiO
2 mixture. The specific surface area obtained for composite MT (S
BET = 226 m
2·g
−1) increased when the sample was prepared in the presence of water (
i.e., MT-W, S
BET = 493 m
2·g
−1) and decreased in the presence of glycerol (S
BET = 87 m
2·g
−1). A comparison of the micropore surface S
0t (318 m
2·g
−1) of carbon C800 with that of MT-G (24 m
2·g
−1) indicated that glycerol partially inhibited micropore development because the contribution of the micropore surface S
0t to the total specific surface decreased from 71% in C800 to 28% in MT-G.
Without glycerol, the TiO2 nanoparticles settled on the raw Manihot residues prior to carbonization in MT and MT-W. The contribution of S0t to SBET was similar (i.e., 44% and 50% in MT and MT-W, respectively). Because the values of microporosity were lower than those in carbon C800 (71%), the TiO2 nanoparticles also hindered the microporosity to some extent.
The prepared composites substantially exceeded the S
BET of bare TiO
2 (58 m
2·g
−1). However, the total pore volume V
tot, measured at p/p
0 = 0.99 for the MT and MT-W samples was similar to that of the precursor TiO
2 (0.678 cm
3·g
−1). The total pore volume of sample MT-G (0.353 cm
3·g
−1), which was prepared with glycerol, was comparable to that of carbon C800 (0.263 cm
3·g
−1). However, the glycerol prevented micropore formation, and the external surface provided the greatest contribution (72%) to the magnitude of the specific surface in MT-G. Nevertheless, the composites prepared by this methodology can be regarded as mesoporous materials with a broad pore size distribution because the average pore width varies within 5.4 ≤ D
p ≤ 17.6 nm (see
Table 1).
The raw
Manihot residues exhibited hydrophilic and nearly neutral characteristics with a pH
pzc of 6.7 [
20], which is very close to the pH
pzc of anatase (6.5) [
21]. Therefore, a certain chemical affinity can be expected between both materials.
However, the composites prepared using the dry mixture approach (variant (a) in
Figure 1) did not exhibit a satisfactorily homogeneous aspect when they were observed under the microscope, which may be due to a “like agglomerates like” effect (
i.e., the attraction of TiO
2 to TiO
2 and carbon to carbon) during mixing. Furthermore, the addition of water in MT-W or glycerol in MT-G affected the texture properties of the composites very differently. Because the strongest effect occurred in the micropore volume of MT-G, the glycerol additive aids in the formation of a homogeneous mixture of raw
Manihot residues and TiO
2 and favors the development of the external surface (up to 72% in MT-G). Carbonization of glycerol itself yields a smooth carbonaceous surface and hinders the TiO
2 nanoparticles from being trapped in the micropores, which improves exposure to irradiation.
2.2. Morphology and Texture of the Composites Obtained from Glycerol Slurries
All of the prepared TiO
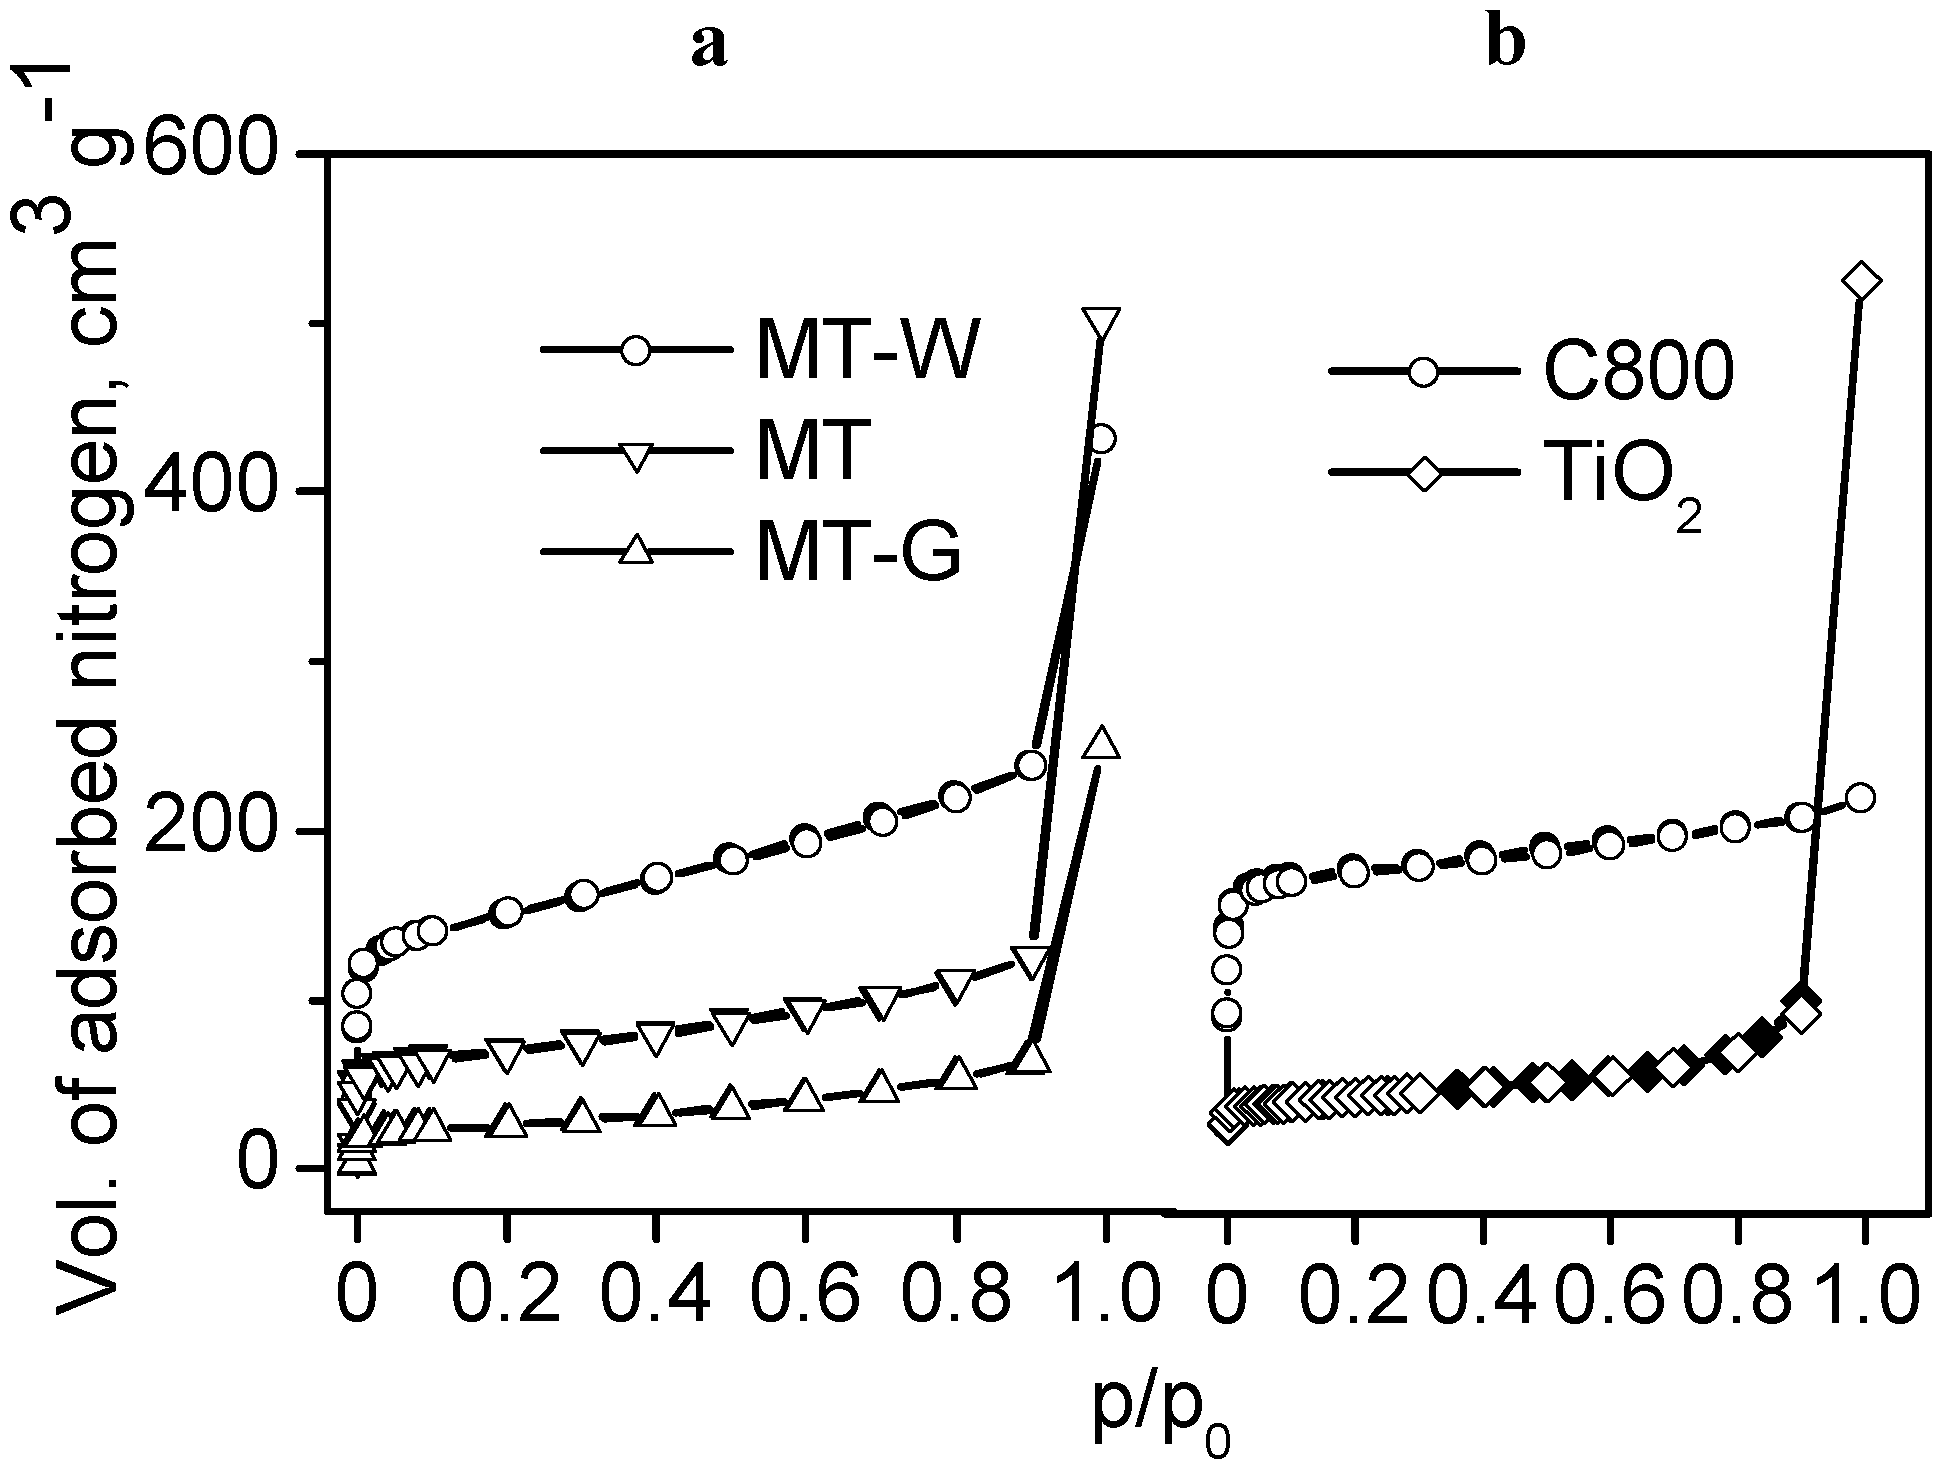
2/carbon composites were black, and their morphologies were similar.
Figure 3 shows the SEM images of the samples prepared by mixing the TiO
2 slurry with the raw residues in glycerol suspensions (variant (b) in
Figure 1): MT-G05 (a), MT-G5 (b) and MT-G50 (c). The incorporation of the TiO
2 nanoparticles or aggregates into the striae of the
Manihot carbon trunks was possible. The images indicated immobilization of TiO
2 agglomerates on the surface of MT-G5 as well as the presence of a free carbonaceous surface. The surface of composite MT-G50 (
Figure 3c), which contained 10-fold more TiO
2, exhibited a crust of TiO
2 covering the carbonaceous surface to a greater extent. For this material, we could expect near semiconductor behavior.
Figure 3.
Scanning electron microscopy images of the TiO2/carbon composites (left) and EDS spectra obtained at magnification 200× for semi-quantitative analysis (right). MT-G05 (a); MT-G5 (b) and MT-G50 (c).
Figure 3.
Scanning electron microscopy images of the TiO2/carbon composites (left) and EDS spectra obtained at magnification 200× for semi-quantitative analysis (right). MT-G05 (a); MT-G5 (b) and MT-G50 (c).
The surface analysis by SEM revealed that MT-G05 was comprised of TiO
2 immobilized aggregates (<1 μm in size), and MT-G5 contained irregular aggregates ~5 μm in size. Sreethawong
et al. also used glycerol as a mesopore-controlling agent and obtained clusters of uniform TiO
2 nanoparticles, which is in agreement with our results [
22].
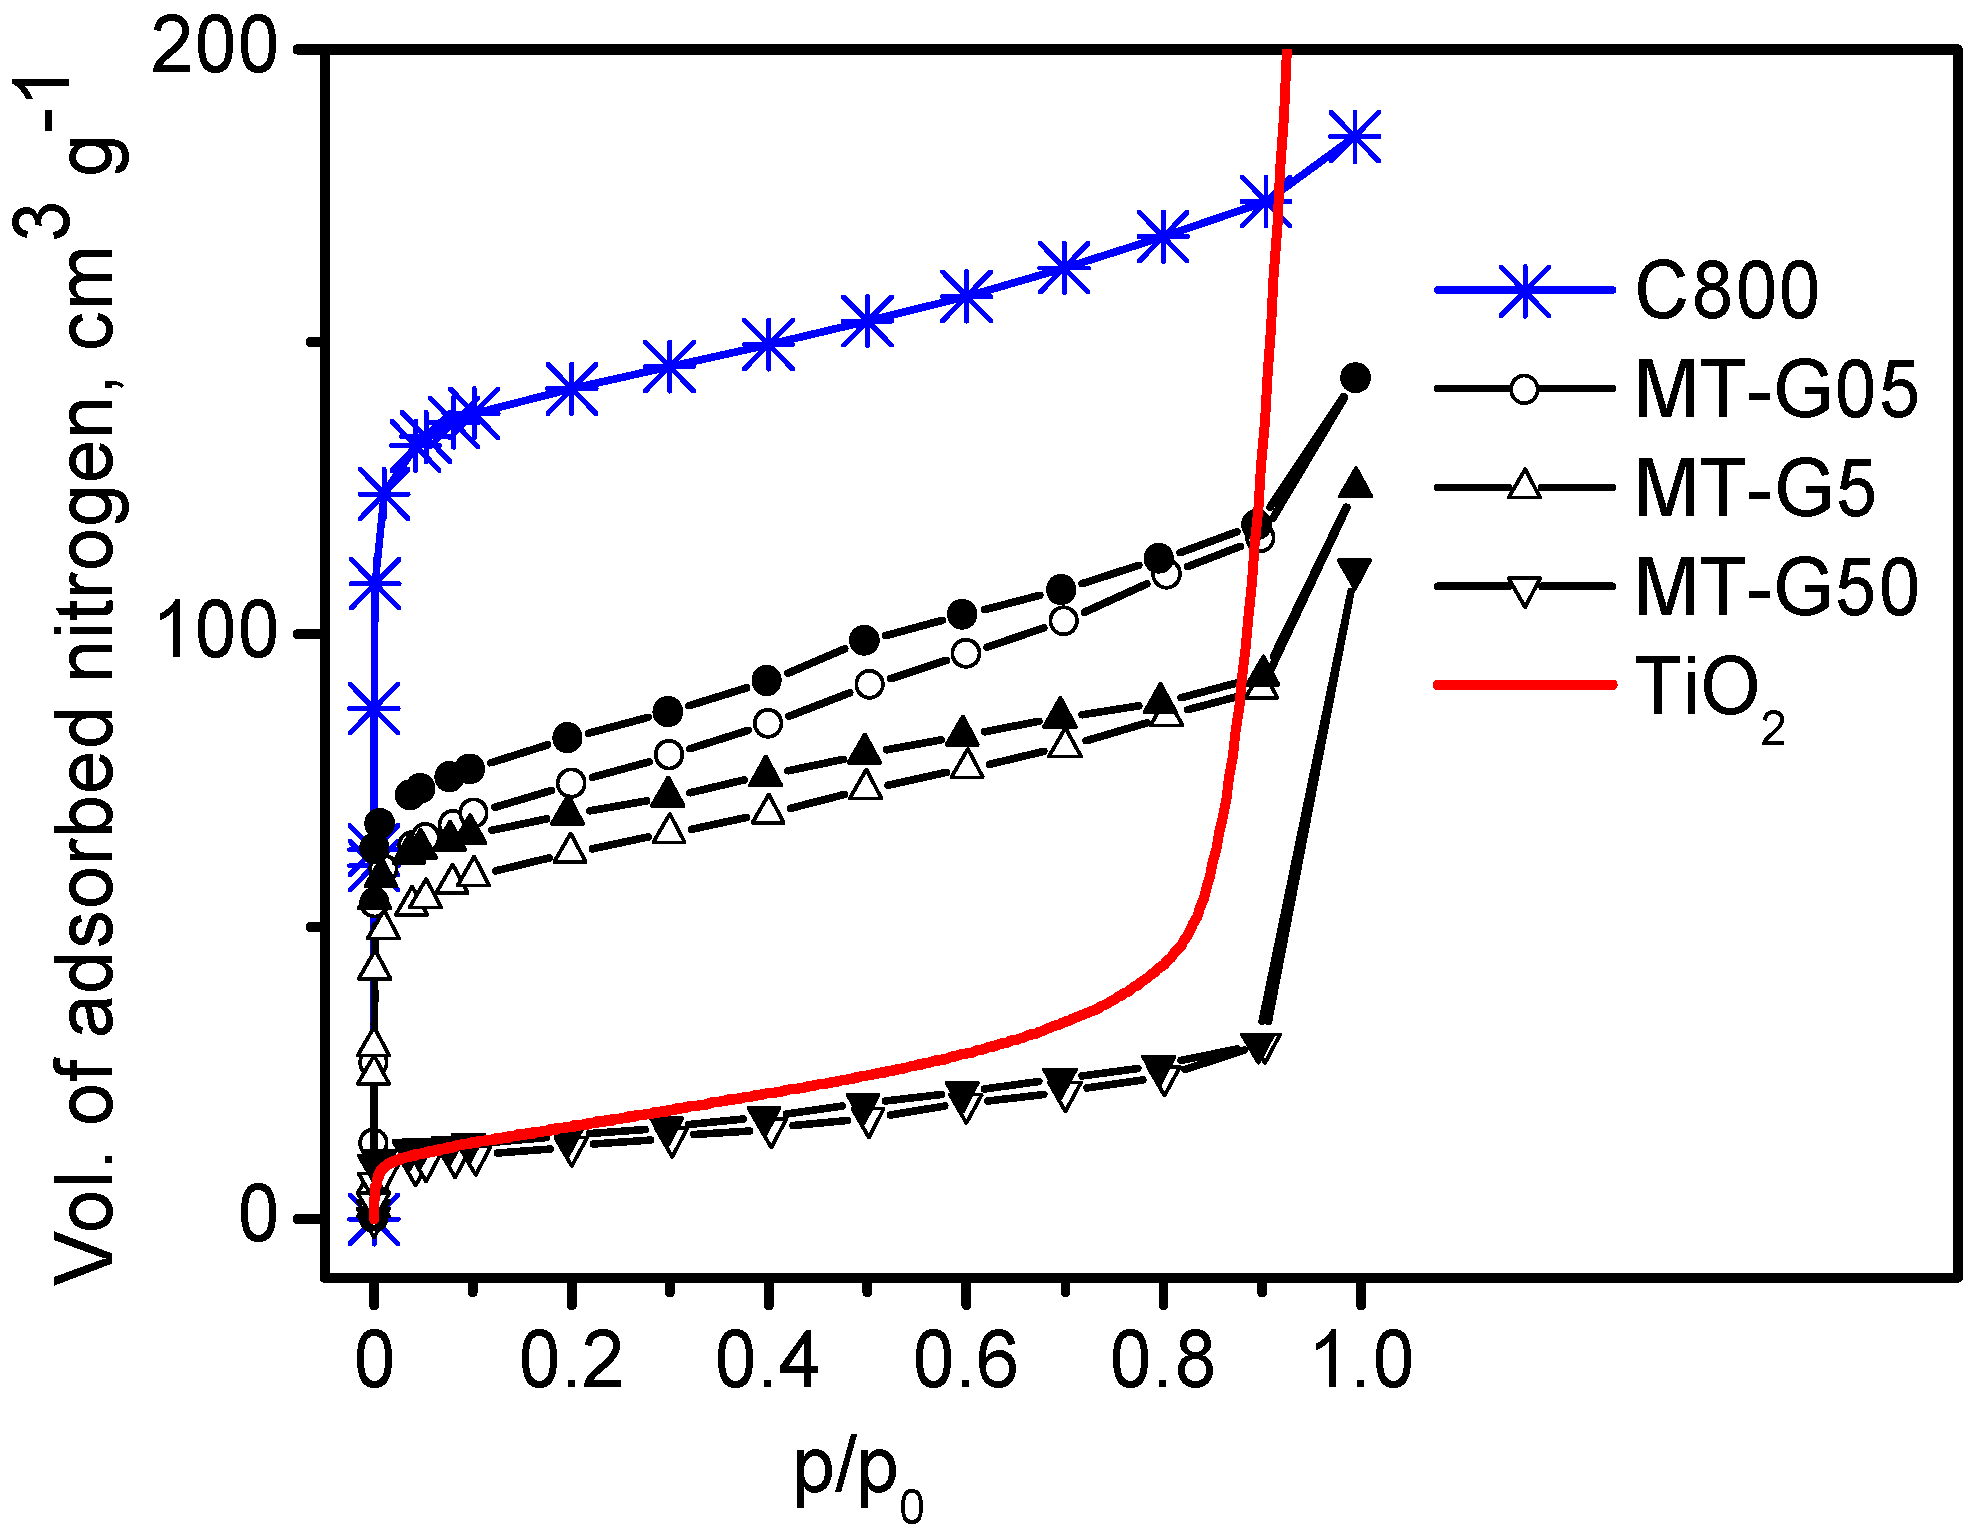
The loaded amount of TiO
2 influenced the textural characteristics of the composites prepared by mixing glycerol slurries, as demonstrated by measuring the N
2 adsorption–desorption isotherms. The specific surface area (S
BET) and other textural parameters of the composites prepared by variant (b) (see
Figure 1) are listed in
Table 2. The nitrogen adsorption isotherms of samples MT-G05 and MT-G5 were significantly different from the typical isotherm for the commercial nonporous anatase TiO
2 (
Figure 4). Remarkably, the curves of both composites with low and medium TiO
2 loading were located below the isotherm corresponding to
Manihot carbon C800 prepared at the same temperature. The decrease (see
Table 2) in the magnitude of S
BET (244 ± 22 m
2·g
−1 for low TiO
2 loading and 203 ± 9 m
2·g
−1 for medium TiO
2 loading) with respect to C800 (449 m
2·g
−1) was a direct result of the blockage of micropores by glycerol and TiO
2 nanoparticles in MT-G05 and agglomerates in MT-G5.
Figure 4.
N
2 adsorption (empty symbols)-desorption (filled symbols) isotherms at 77 K for the composites prepared by mixing slurries of the precursors in glycerol (variant (b) in
Figure 1) using different residue: TiO
2 ratios.
Figure 4.
N
2 adsorption (empty symbols)-desorption (filled symbols) isotherms at 77 K for the composites prepared by mixing slurries of the precursors in glycerol (variant (b) in
Figure 1) using different residue: TiO
2 ratios.
Table 2.
Specific surface S
BET, micropore S
0t, external surface S
et and point of zero charge pH
pzc of the TiO
2/C materials prepared by mixing the precursors in a glycerol suspension in different
Manihot: TiO
2 ratios according to variant (b) in
Figure 1, and the corresponding isotherms are shown in
Figure 4.
Table 2.
Specific surface SBET, micropore S0t, external surface Set and point of zero charge pHpzc of the TiO2/C materials prepared by mixing the precursors in a glycerol suspension in different Manihot: TiO2 ratios according to variant (b) in Figure 1, and the corresponding isotherms are shown in Figure 4.
| Composite | Manihot: TiO2 Ratio | Specific Surface, m2·g−1 | Vμ, cm3·g−1 | Vtot, cm3·g−1 | D, nm | pHpzc |
|---|
| BET | S0t | Set |
|---|
| MT-G05 | 1:0.5 | 244 | 118 | 126 | 0.060 | 0.204 | 3.6 | 11.4 |
| MT-G5 | 1:5 | 203 | 104 | 99 | 0.053 | 0.178 | 3.8 | 7.7 |
| MT-G50 | 1:50 | 40 | - | 40 | - | 0.158 | 26.7 | 6.0 |
The nitrogen adsorption isotherm (lowest curve in
Figure 4) for sample MT-G50 with a maximum TiO
2 load was in agreement with the isotherm of bare commercial TiO
2 (curve without points in
Figure 4). Correspondingly, the S
BET of composite MT-G50 (40 ± 3 m
2·g
−1) was similar to that of TiO
2 (58 m
2·g
−1).
As expected, composites MT-G05 and MT-G5 (
Figure 4) exhibited a type IIb hybrid isotherm. The hybrid isotherm was consistent with a combination of adsorption isotherms corresponding to the textural characteristics of two materials with different adsorption isotherms (
i.e., carbon (type I) and TiO
2 (type II)). The isotherms of these two composites exhibited a low-pressure hysteresis (LPH), which has been observed for some microporous adsorbents. The pore size distribution of composite MT-G50 (not shown here) indicated macropores.
Samples MT-G05 and MT-G5 exhibited mesoporosity with D
p > 2 nm, micropores with diameters ≤2 nm and a similar micropore volume (see
Table 2) due to partial blockage of the micropores. The micropore volumes of the composites with reduced TiO
2 content were similar, and in composite MT-G50, the micropores disappeared (
i.e., V
μ = 0.160 cm
3·g
−1 in carbon C800, V
μ = 0.060 cm
3·g
−1 in MT-G05 and V
μ = 0.053 cm
3·g
−1 in MT-G5). However, both composites exhibited a micropore/mesopore ratio of ~50%. Velasco
et al. demonstrated that immobilization of TiO
2 only occurred on the outer surface of the carbon when they prepared their carbon-TiO
2 composite by infiltration of TiO
2 nanoparticles into commercial carbon [
23]. The S
0t and S
et values of our TiO
2/carbon samples indicated no substantial difference in the contribution of the micropores to the magnitude of the specific surface area when the material was prepared with 0.5 and 5 mg of TiO
2. Notably, in solid-liquid photocatalytic reactions, large reactants do not diffuse into micropores. However, the creation of micropores directly leads to an increase in the specific surface area. As shown in our work, micropores and mesopores coexist, and their ratio can be affected by the immobilized TiO
2. The evidence for micropore (D
p < 2 nm) blocking by TiO
2 nanoparticles (d
p < 50 nm) complements Velasco’s
et al. demonstration of the immobilization of TiO
2 on the outer surface of commercial carbon [
23]. Furthermore, our results indicate that in addition to pore blocking, inhibition of pore formation also occurs because the formed TiO
2 nanoparticles settled on the raw
Manihot residues prior to carbonization, as described in this and the previous section.
Composites containing more than 20% TiO
2 have been reported to exhibit operational problems, and nearly 100% of the phenol from the aqueous solution was removed [
23]. In comparison, the TiO
2 loadings used in our work exhibited excellent wettability and could be separated from the solution by precipitation without additional operations.
The achievement of a high surface area is a challenge in the preparation of a crystalline TiO
2-containing photocatalyst, which is primarily due to the Degussa TiO
2 nanoparticles being non-porous. Notably, composites MT-G05 and MT-G5 exhibited S
BET magnitudes much higher than that of TiO
2 and approximately 50% microporosity. Despite the considerable number of publications on the preparation of TiO
2 loaded carbon, the reproducibility of the textural characteristics of the resulting composites has never been reported. In the current work, four lots of each composite were prepared, and their specific surface areas, which are shown in
Table 2, represent mean values with STD ≤ 9%. Based on the known error in the BET measurements, these results indicate the acceptable reproducibility of the preparation method. As previously reported [
19], the photocatalytic activity is also related to the texture of the material. We succeeded in preparing two composites (
i.e., MT-G05 and MT-G5) that exhibit similar textural properties but different TiO
2 loads. This fact has economic implications, and one cannot rule out that a low population of well-dispersed TiO
2 nanoparticles can perform differently from TiO
2 clusters (compare
Figure 3a,b). The photocatalytic performance of the samples prepared by this methodology will be discussed below.
2.4. Crystal Structure of TiO2 Immobilized on Manihot Carbon and the Structure of the Carbon
The phase content of P25 Degussa TiO
2 is not consistent, and it may vary from batch to batch. Nevertheless, P25 Degussa TiO
2 is a mixture of anatase and rutile phases with a predominance of anatase (>80%).
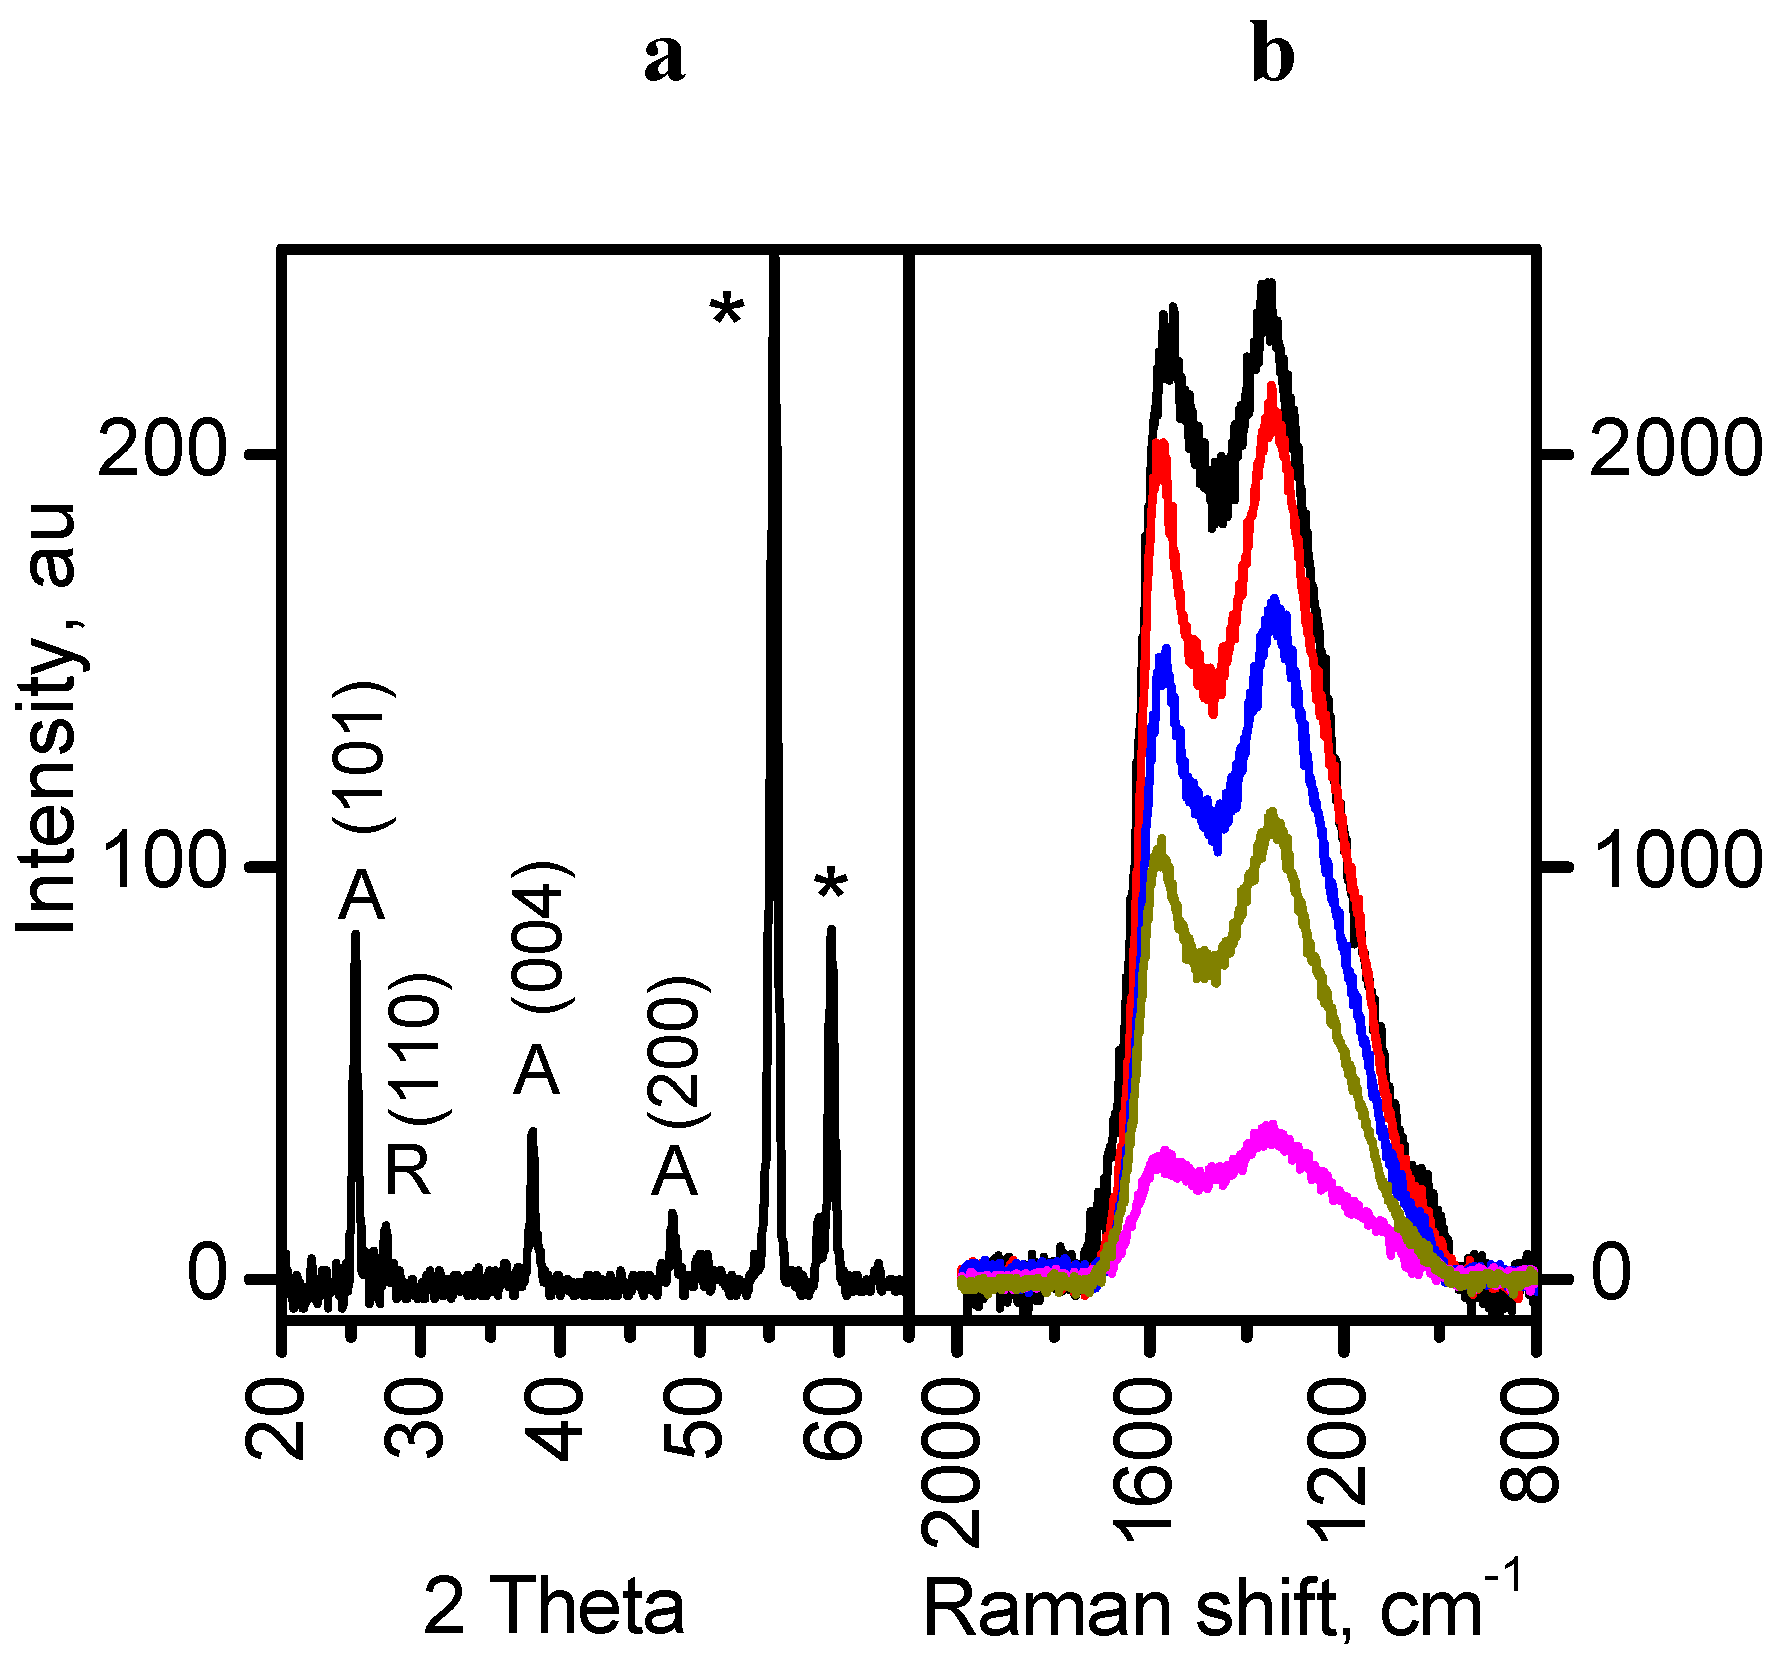
Figure 5a shows the XRD pattern of the MT-G5 composite. Despite the low intensity of the peaks, the persistence of the anatase phase was observed (PDF 96-900-9087 from the Crystallography Open Database). The series of composites prepared in this work exhibited similar diffractograms with the main peak corresponding to the (101) plane of anatase at approximately 2θ = 25.32°.
Figure 5.
(a) X-ray powder diffraction patterns of sample MT-G5 showing the characteristic planes of anatase (A); (b) Micro-Raman spectra at five different sites of MT-G05. * = sample holder.
Figure 5.
(a) X-ray powder diffraction patterns of sample MT-G5 showing the characteristic planes of anatase (A); (b) Micro-Raman spectra at five different sites of MT-G05. * = sample holder.
The phase transition from anatase to rutile occurs at approximately 600 °C, but in the materials prepared at 800 °C, this phase transition did not occur. Here, the presence of glycerol may link TiO
2 nuclei via hydrogen bonds and stabilize the anatase phase [
25]. Another possible explanation is that the carbon formed in the vicinity of TiO
2 suppresses the phase transformation at high temperature [
26].
A widely accepted notion is that the anatase phase is more active than the rutile phase [
27], although there are studies reporting the effectiveness of mixtures with different anatase-rutile ratios [
18]. However, both phases are used in the photodegradation of pollutants. The content of the rutile phase in Degussa TiO
2 can be observed as a very small peak at 2θ = 27.4° corresponding to the (110) plane. This peak is the most intense peak for the rutile phase, and this peak is less intense than the most intense peak for anatase in the Degussa TiO
2. The low intensity of the peak for rutile in the diffractograms of the prepared composites may be due to the low loading of TiO
2. In addition, the glycerol may produce linkages between the TiO
2 nanoparticles and the raw
Manihot residues creating a stabilizing effect against the transition of anatase to rutile during heating. If this linkage exists, this effect should occur before glycerol decomposes at 246 °C [
28]. In comparison, the vascular residues of
Manihot are completely decomposed at 400 °C [
20].
For the organic residues, the carbonization temperature (800 °C) was low to ensure complete graphitization in the TiO
2/carbon samples. Therefore, the peak at
ca. 2θ = 25° cannot be assigned to the reflections of the (002) plane of two-dimensional graphite and was unequivocally attributed to anatase.
Figure 5b shows the Raman spectra resulting from five micro-Raman measurements. These spectra contain the defect-derived D (1375 cm
−1) and the graphite structure-derived G (1550 cm
−1) bands, which are characteristic of carbonaceous materials that are specific for each material. The prepared composites exhibited a large D-band peak (I
D/I
G ~ 2.7), indicating an amorphous carbon content of approximately 75%. Because only slightly lower values were obtained in the absence of glycerol (I
D/I
G ~ 2.4 and the amorphism I
D/(I
D + I
G) ~ 70%), this additive did not substantially contribute to the amorphism of the carbonaceous component in the TiO
2/carbon materials.
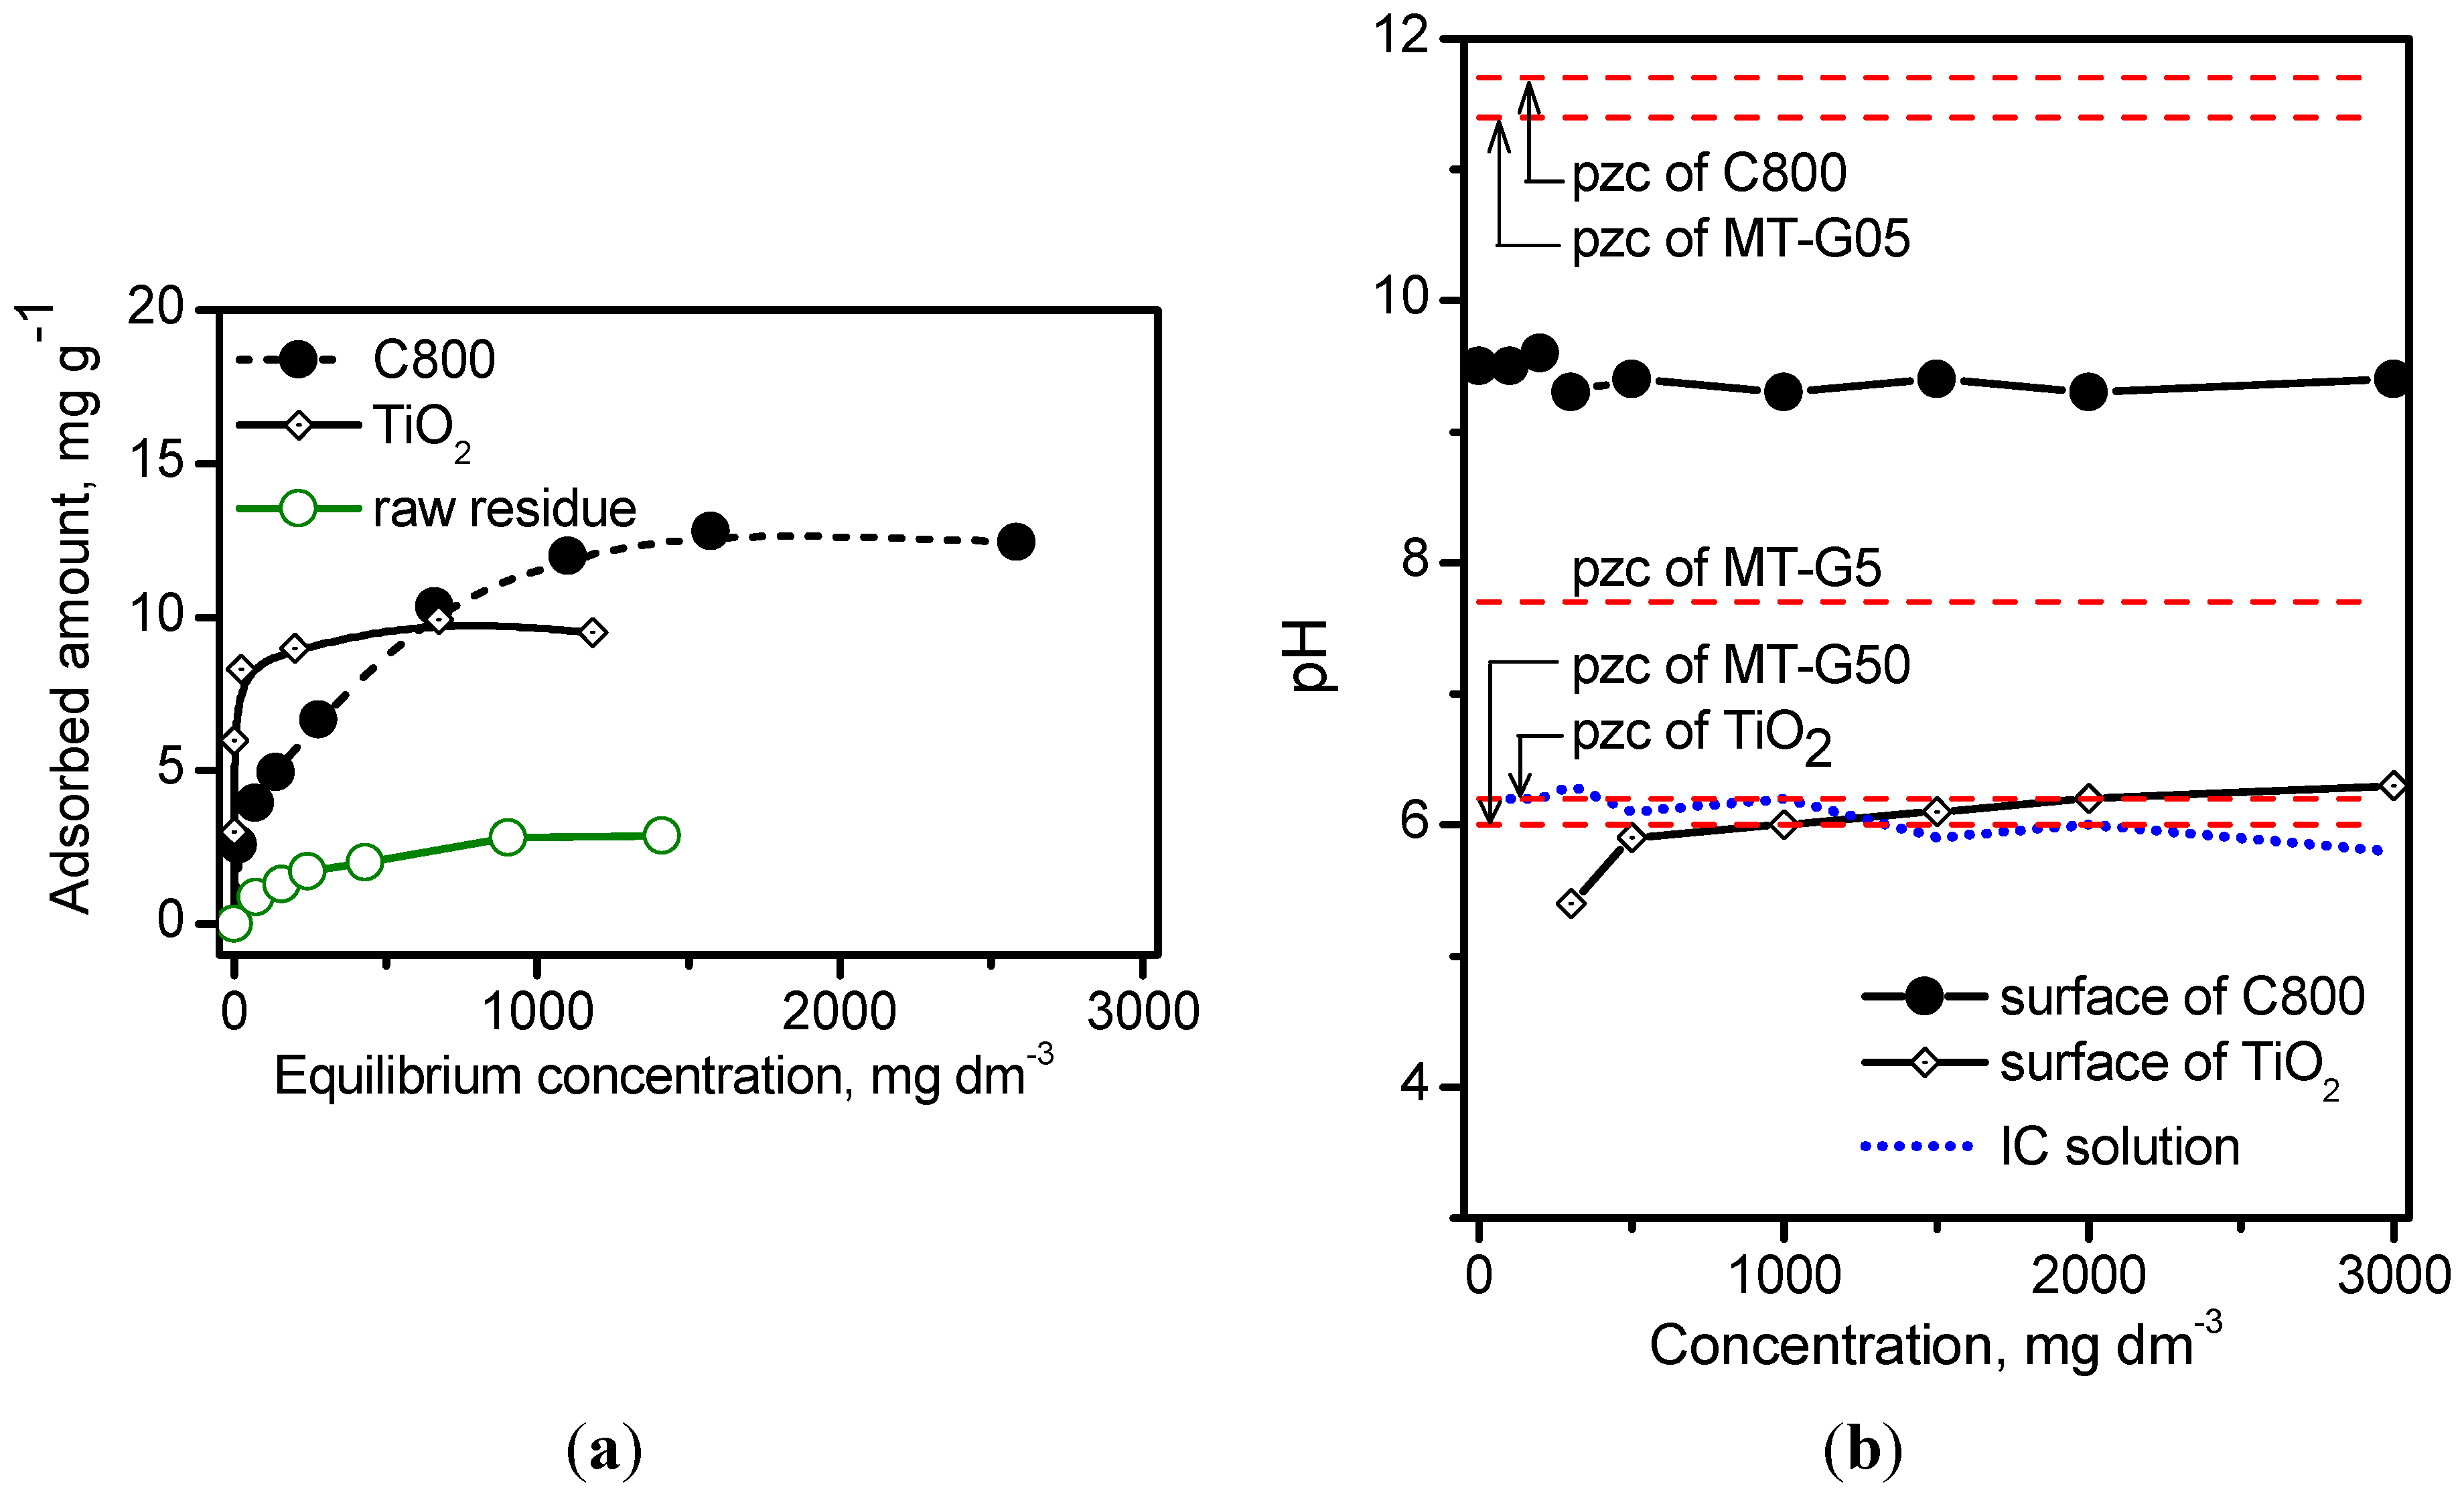
2.5. Adsorption of IC
Figure 6 shows the isotherms describing the adsorption of IC onto the raw
Manihot residues, carbon sample C800 and commercial TiO
2 without any adjustment. The Degussa TiO
2 used in this work exhibited a saturation capacity of 0.20 molecules·nm
−2 compared to 0.13 molecules·nm
−2 reported by Vautier
et al. [
29] for an adsorbent dose of 2.5 mg·cm
−3. Alahiane
et al. [
30] reported a saturation capacity of 0.21 molecules·nm
−2 for an adsorbent dose of 1.0 mg·dm
−3. Carbon C800 exhibited a slightly higher saturation capacity of 0.27 molecules·nm
−2. The corresponding Langmuir constant (k
L) was calculated by the non-linear form of the Langmuir equation, and these constants were 189 L·mg
−1 on the raw residue, 0.4 L·mg
−1 on TiO
2 and 256 L·mg
−1 on carbon C800.
Once the relative adsorption affinity of IC on the semiconductor TiO
2 and carbon was determined, we explored the acidity/basicity of the drained surface immediately after adsorption. The dotted line in
Figure 6 indicates that there is no variation in the pH, within the experimental error, with the IC concentration. The pH on the surface of the wet composites was measured after the adsorption process. The pH of the TiO
2 surface remained near the values of the IC solution and near the pH
pzc of TiO
2 at all of the concentrations. In contrast, the pH of the carbon C800 surface decreased from a pH
pzc value of 11.7 to 9.5 because the dye acted as a neutralizing agent. As previously discussed, the results in
Figure 6b indicate that the pH
pzc of MT-G05 resembles that of carbon C800, the pH
pzc of MT-G50 resembles that of Degussa TiO
2, and the pH
pzc of MT-G5 is midway between carbon and TiO
2. The results in
Figure 6b suggest that the adsorption of IC (pK
a 12.2) in basic medium (pH > 8) should only occur on composite MT-G05 because pH ˂ pH
pzc. In an acidic solution (pH ˂ 6), the adsorption occurs on all the composites because pH ˂ pH
pzc.
Figure 6.
(a) Adsorption isotherms of IC on raw Manihot residue, TiO2 and carbon C800 at 25 °C. Adsorbent dose: 33.3 mg·cm−3; (b) Variation in the pH of the IC solution as well as of the surface of TiO2 and the carbon C800 after adsorption of different concentrations of IC. The levels of pHpzc of the materials are denoted with dashed lines.
2.6. Photocatalytic Decomposition of IC
TiO
2/carbon materials can exhibit enhanced photoactivity because the synergistic effect that causes a rapid photoinduced charge separation and a diminution of the recombination of the electron-hole pairs in TiO
2. To better estimate the photoactivity of a series of samples, photoelectrochemical analysis offers an excellent opportunity to assess differences in the transfer of photogenerated electron-hole pairs from TiO
2. Zhang
et al. demonstrated that the higher and more stable photocurrent of the sample, the higher photoactivity and they showed the importance of the carriers lifetime in graphene-TiO
2 [
31].
The photocatalytic performance test of carbon-TiO
2 materials produced using biomass as carbon source has involved methylene blue [
14], Rhodamine B [
15], basic red 18 and basic red 46 [
17]. The decay of the TOC [
14] and COD [
15] values of the dye solutions was faster on the carbon-TiO
2 materials than on TiO
2. However, this result could be related with an adsorption effect. In contrast, Mahmoodi
et al. demonstrated that two azo dyes degraded faster using TiO
2 immobilized on activated carbon in comparison to TiO
2 [
17]. Total mineralization occurred after 80–100 min irradiation at 200–280 nm. One of the purposes of the current paper was to evaluate the performance of our TiO
2/carbon materials for the photocatalytic decomposition of IC. Research conducted for this purpose has been reported by Subramani
et al. [
32] by mixing both commercial TiO
2 and carbon (S
BET 1025 m
2·g
−1) in HNO
3 followed by heating in an autoclave at 150 °C. Recently, some novel visible-light photocatalytic materials have also been tested for photodegradation of IC [
33]. However, in contrast to those doped semiconductors, we investigated the simple preparation of a TiO
2/carbon composite to observe the adsorption and photocatalysis phenomena during the removal of IC.
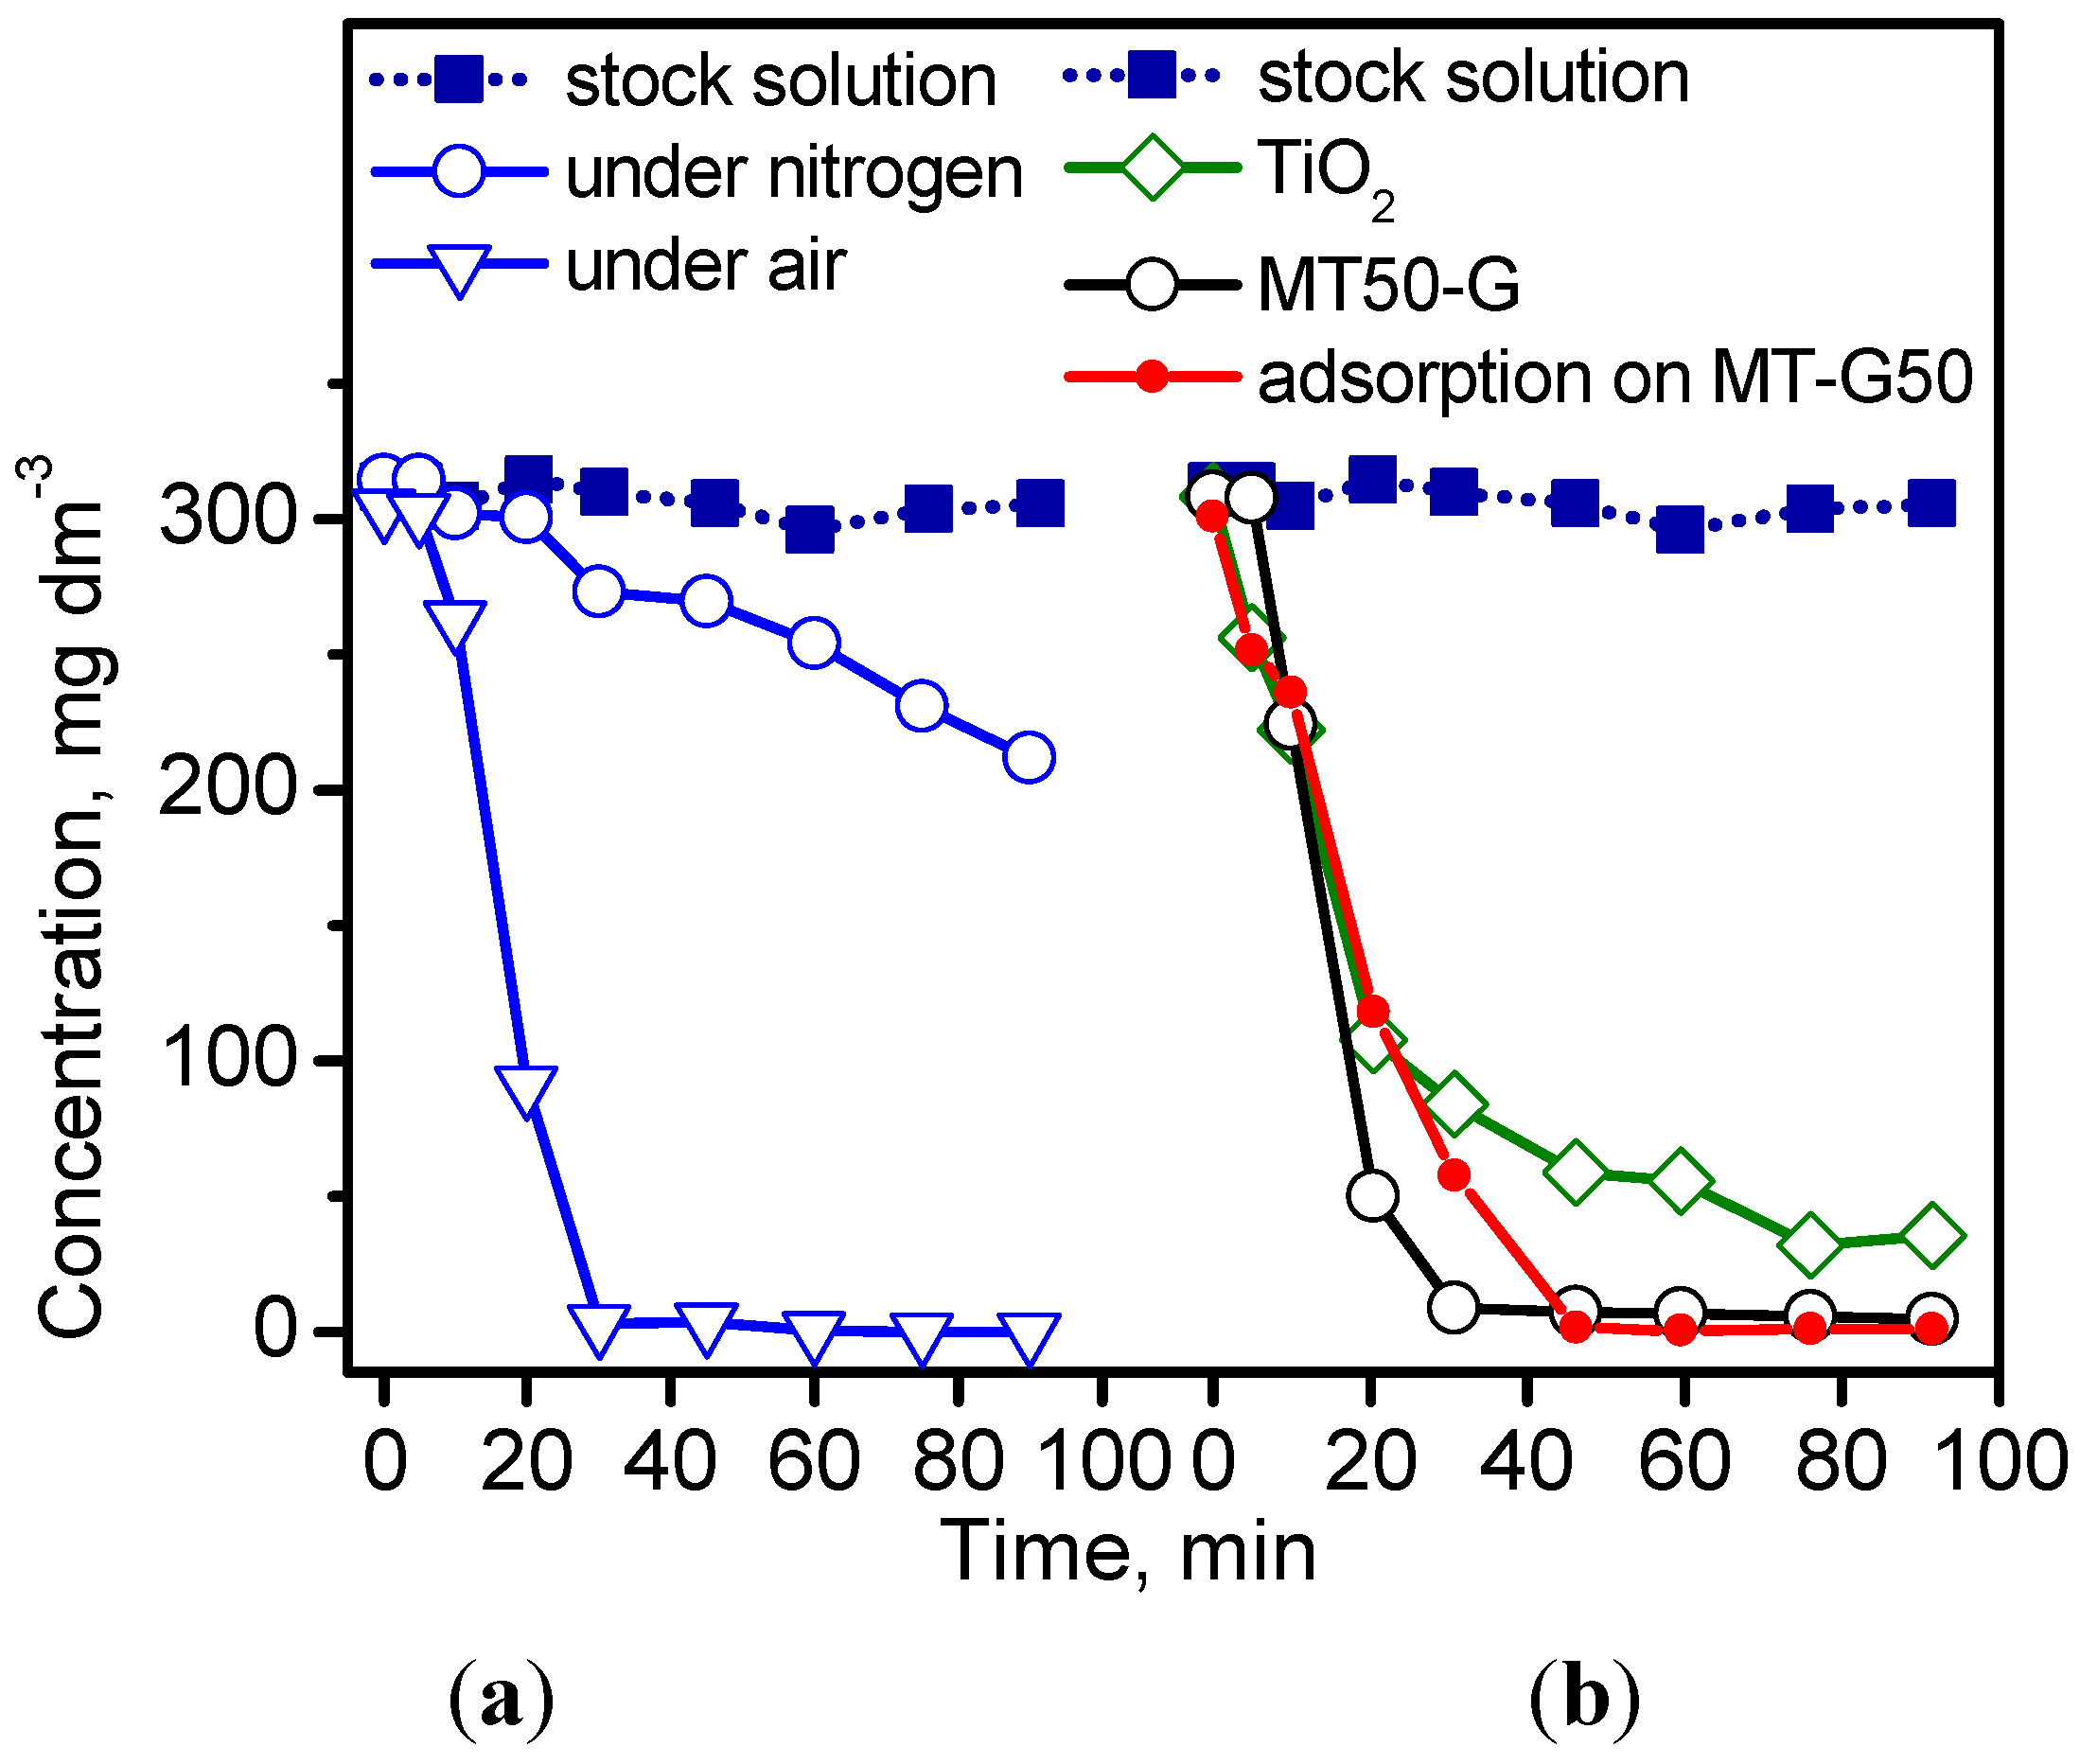
Figure 7 shows the concentration decay of the irradiated IC solutions at 254 nm after photolysis (
Figure 7a) and photocatalysis (
Figure 7b). As expected [
34], IC decomposed by photolysis and more readily in air atmosphere due to the presence of oxygen (
Figure 7a). Surprisingly, the prepared TiO
2/C MT-G50 sample exhibited superior elimination efficiency compared to TiO
2 (
Figure 7b) due to the adsorption capacity of the uncovered segments of the carbonaceous support in the composite.
As shown in
Figure 7b, carbon C800 completely adsorbs the dye after 40 min of contact. In addition, the carbon C800 reached saturation with 14 mg·g
−1 of IC, and the specific surface decreased from 434–346 m
2·g
−1 for the saturated adsorbent [
35]. However, the adsorption of IC on C800 was reversible because after contact with water, the original magnitude of S
BET was reestablished (
i.e., 437 m
2·g
−1).
Figure 7.
Kinetic curves of (a) photolysis at 50 °C in a nitrogen and air atmosphere and (b) photocatalysis of the dye IC at 50 °C in an air atmosphere. Adsorption experiment of IC on MT-G50 in the dark.
Figure 7.
Kinetic curves of (a) photolysis at 50 °C in a nitrogen and air atmosphere and (b) photocatalysis of the dye IC at 50 °C in an air atmosphere. Adsorption experiment of IC on MT-G50 in the dark.
Since the study of Vautier
et al. was reported, the photocatalytic degradation of IC as model indigoid dye has been studied extensively via UV irradiation [
29]. The most widely used photocatalysts are TiO
2, doped TiO
2, and TiO
2 containing composites. Barka
et al. [
36] demonstrated that the apparent degradation rate constant of IC was affected by the temperature, concentration, pH, and previous adsorption in the dark. After demonstration of the adsorption affinity between IC and the constituents of our TiO
2/carbon composites, the photocatalytic degradation of the dye under different conditions was explored.
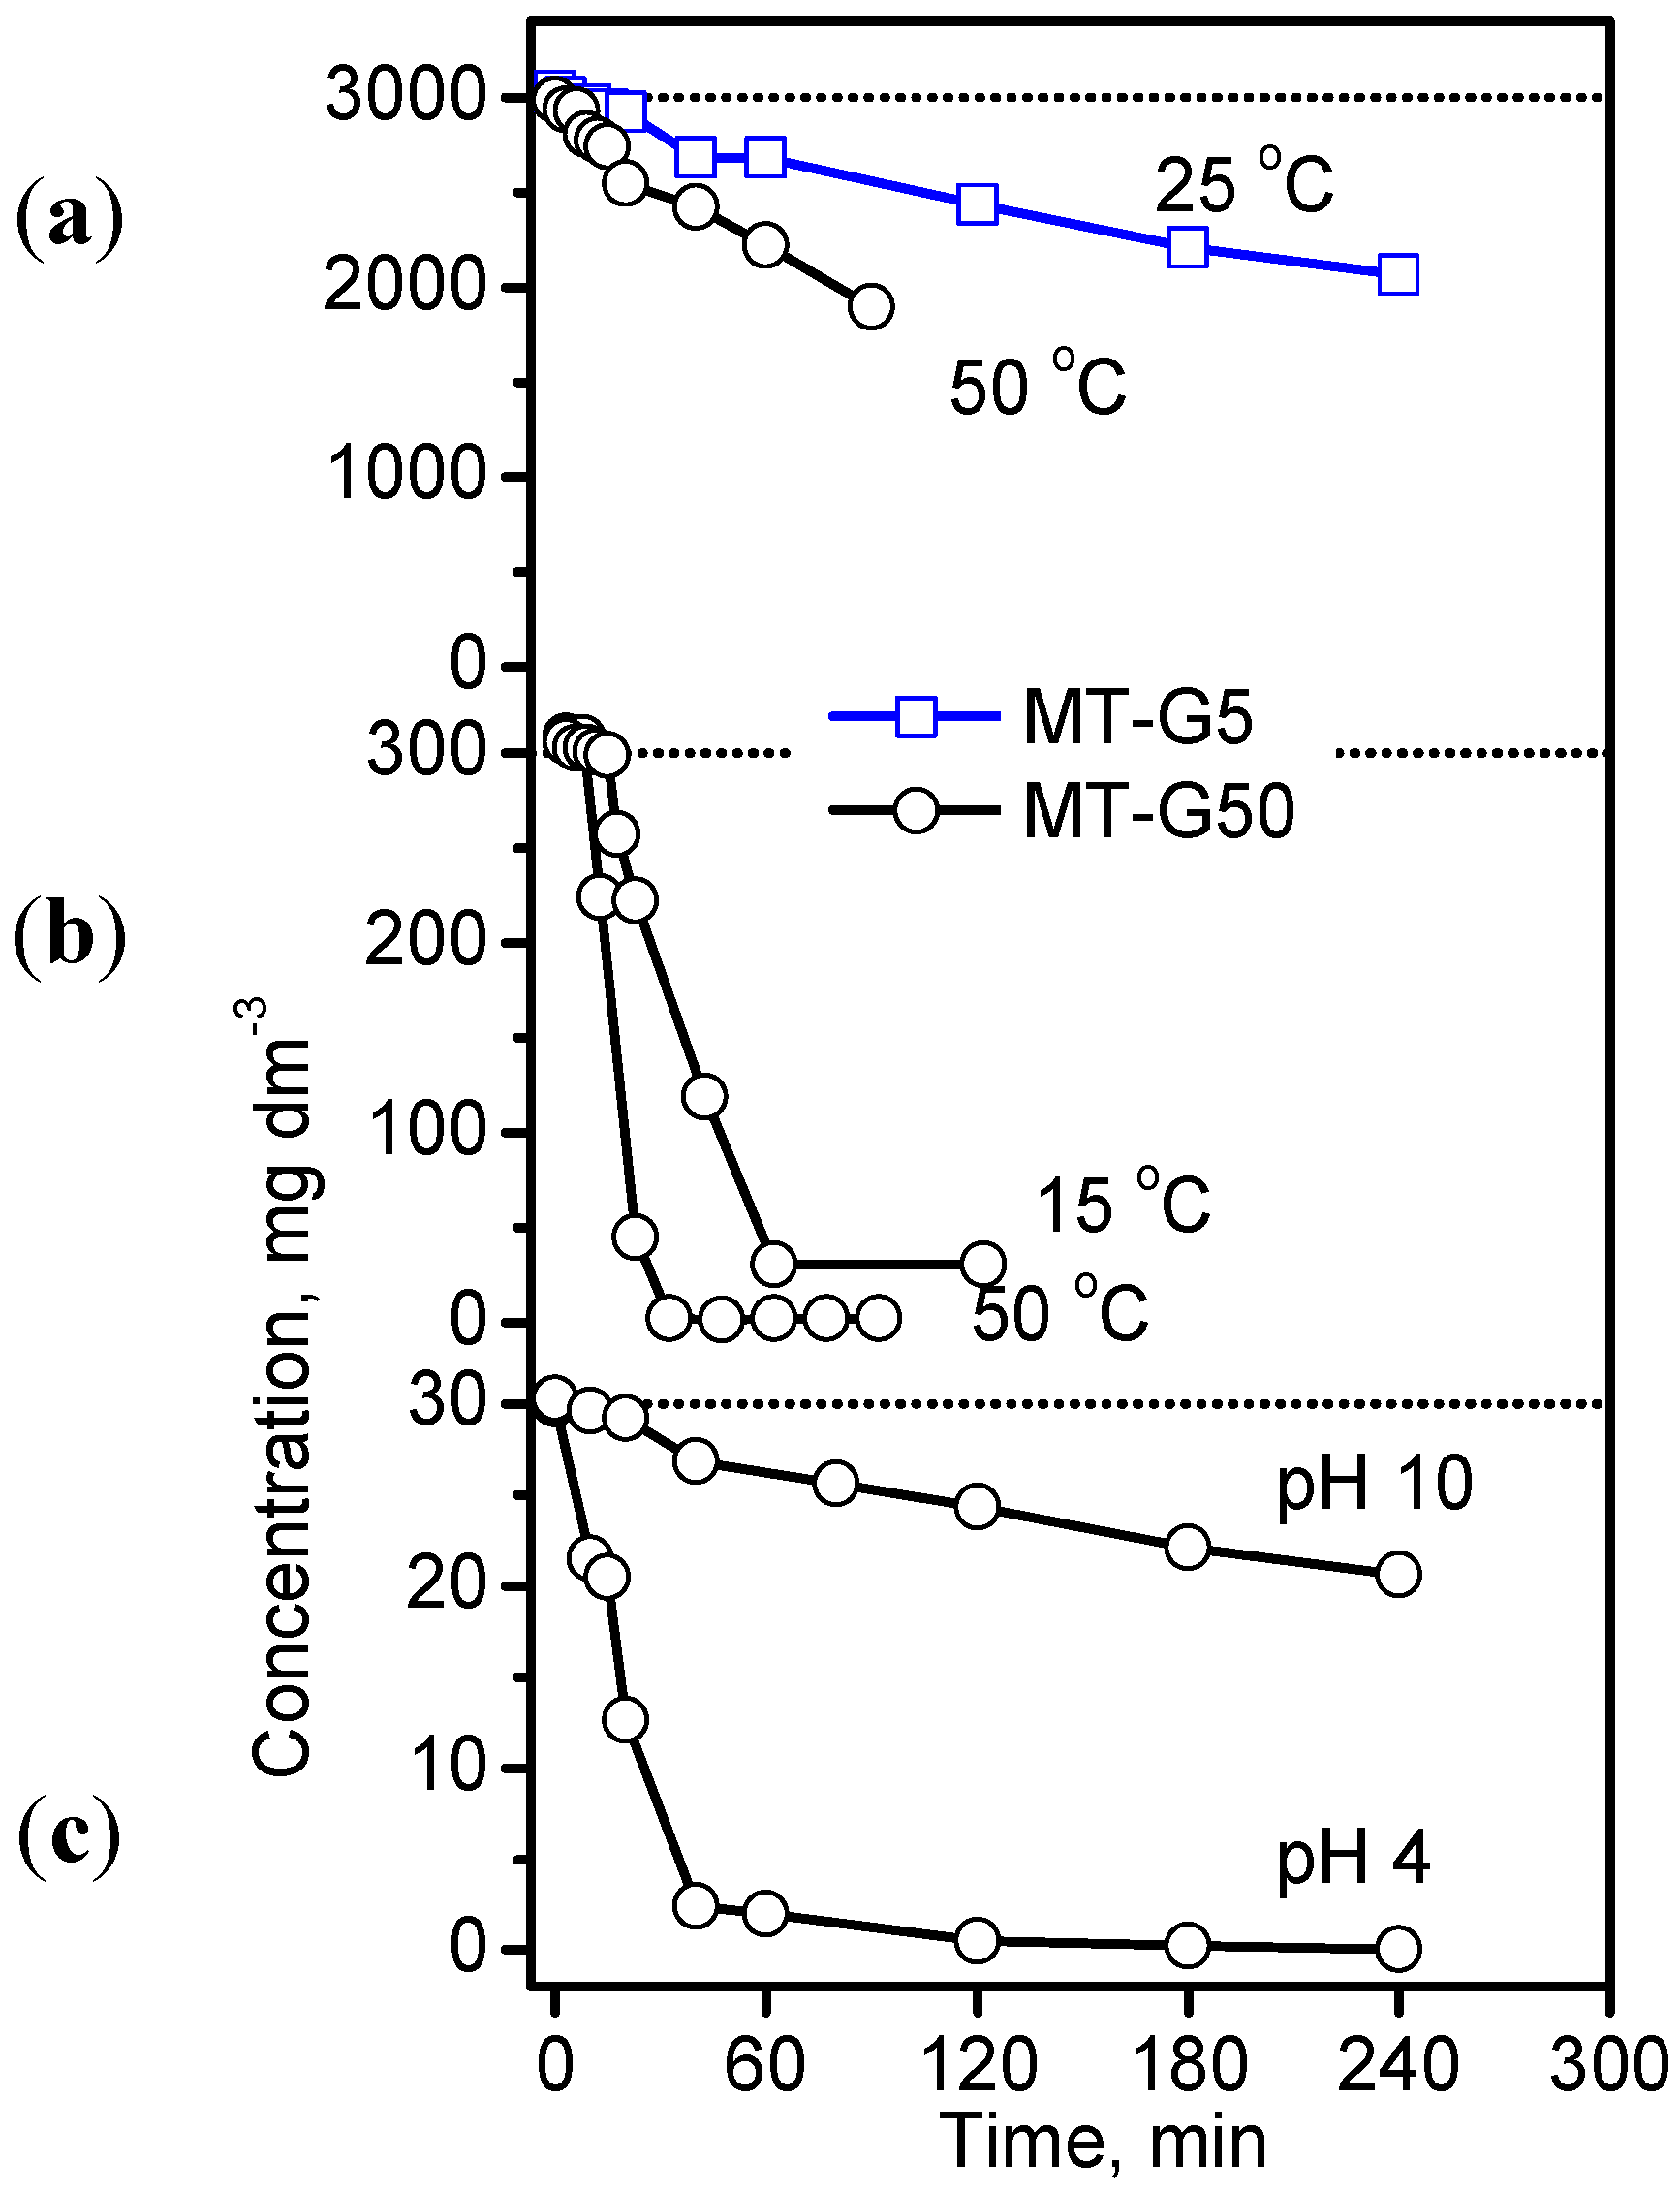
Figure 8 shows the decrease in the concentration of IC as a function of time at different temperatures and pH values for IC initial concentrations varying by two orders of magnitude using the photocatalysis conditions provided in the experimental section. The study of other factors influencing the photodegradation process, such as the volume of the IC solution and the mass of the photocatalyst, were excluded because they involve the design of the photoreactor. By comparing the results in
Figure 8a with those in
Figure 8b,c, we observed that an extreme initial concentration of 3000 mg·dm
−3 exhibited the slowest degradation rate independent of the composite and temperature. Despite the large differences in the initial concentrations used by us and other authors [
31,
36,
37], the effect was similar. The kinetic curves in
Figure 8a obeyed a second order rate equation, and the rate constants were 0.5 × 10
−2 for MT-G5 at 25 °C and 1.5 × 10
−2 g·mg
−1·h
−1 for MT-G50 at 50 °C. Using a concentration of 300 mg·dm
−3 (
Figure 8b), 90% degradation was achieved after 60 min of irradiation, and this degradation occurred more readily at 50 °C. The rate constant (
k2) at 25 °C was 8.4 × 10
−2 g·mg
−1·h
−1 using MT-G50 and 0.5 × 10
−2 g·mg
−1·h
−1 using MT-G5. Alahiane
et al. observed a first order degradation rate of 2 × 10
−2 min
−1 for 20 mg·dm
−3 IC using Degussa TiO
2 [
30], and Barka
et al. obtained a first rate constant of 3 × 10
−2 min
−1 using fibers coated with PC500 TiO
2 [
36]. However, Barka
et al. reported an unsatisfactory first order kinetic behavior at higher initial concentrations and suggested a competing adsorption/degradation mechanism.
Figure 8.
Photocatalytic decomposition of the IC dye with three concentration levels at natural pH and different temperatures (a,b) as well as at 25 °C in basic and acidic solutions (c) using two composites in an air atmosphere.
Figure 8.
Photocatalytic decomposition of the IC dye with three concentration levels at natural pH and different temperatures (a,b) as well as at 25 °C in basic and acidic solutions (c) using two composites in an air atmosphere.
The results in
Figure 8c indicate that IC degradation occurred slowly at pH 10 using composite MT-G50 with a pH
pzc of 6.0, (see
Figure 6b) where the surface is negatively charged resulting in repulsion of the dye molecule. In contrast, a pH of 4.0 favored the attraction between the positively charged surface and the dye, as discussed in the previous section. These results agree with those obtained for the adsorption of IC on TiO
2 PC500 [
36].
In addition, we decided to optimize the photodegradation of IC using the prepared TiO
2/carbon materials. Abaamrane
et al. reported on the optimal decolorization of IC using TiO
2/UV and the response surface methodology [
37]. In the current work, we used the Taguchi method [
38] for the evaluation of the color removal produced by IC through a small number of trials. This technique included transformation to a signal to noise ratio (S/N), which is a measure of the variations observed. An L
4 orthogonal array was applied, and the three factors selected included the specific surface (40 m
2·g
−1 in MT-G50 and 203 m
2·g
−1 in MT-G5), initial concentration (30 and 300 mg·dm
−3) and temperature (25 and 50 °C). The pH of the solution was maintained at 4 for all of the experiments because (i) composite MT-G05 was excluded due to a pH
pzc value that was very close to that of its precursor carbon C800. The removal involves both adsorption and photocatalysis occurring on prepared composites MT-G5 and MT-G50 with different TiO
2 loadings, the representative factor describing their whole removal capacity was the specific surface, which was determined to be 203 m
2·g
−1 for MT-G5 and 40 m
2·g
−1 for MT-G50; (ii) As demonstrated in
Figure 8c, the performance of MT-G50 at a pH of 4 was much better than that at a pH of 10. Therefore, according to
Figure 6b, the selected materials were used in acidic solutions of the IC dye, and the pH was not used as a factor in the optimization study. The array of experimental factors with two levels and the results are reported in
Table 3. The extent of decolorization varied from 10%–99% in the different combinations.
Table 3.
Experimental L4 Taguchi orthogonal array with the color percentage removal as an output variable. Factors and levels: A: SBET (40, 203 m2·g−1); B: concentration (30, 300 mg·dm−3); C: temperature (25, 50 °C).
Table 3.
Experimental L4 Taguchi orthogonal array with the color percentage removal as an output variable. Factors and levels: A: SBET (40, 203 m2·g−1); B: concentration (30, 300 mg·dm−3); C: temperature (25, 50 °C).
| Factor Levels | Color Removal, % | S/N | Removed TOC, % |
|---|
| A | B | C | Exper. 1 | Exper. 2 |
|---|
| 1 | 1 | 1 | 10 | 16 | 18 | 61 |
| 1 | 2 | 2 | 99 | 98 | 40 | 55 |
| 2 | 1 | 2 | 94 | 94 | 39 | 54 |
| 2 | 2 | 1 | 40 | 37 | 31 | 48 |
The array indicated that the temperature was the most influential factor (S/N = 40), and an experiment to confirm these results was carried using the optimal level of each factor (combination A2,B2,C2), and this experiment produced 95% removal (T = 50 °C, initial concentration = 300 mg·dm
−3 and specific surface = 203 m
2·g
−1 of the composite MT-G5). The specific surface influenced the removal of the dye rather than the amount of TiO
2 loaded on the materials. Regarding the decolorization, the elimination of the total organic carbon was slightly lower for a high initial concentration. For example (see last column in
Table 3), a 55% TOC removal was observed using an initial concentration of 300 mg·dm
−3 compared to a 61% TOC removal using 30 mg·dm
−3. The inconsistency between the high removal of color (e.g., 94% in the combination A2,B1,C2) and the 54% removal of TOC is due to the formation of uncolored products, and these products identification will be discussed in the next section.
2.7. Identification of the Photodegradation Products of IC
For product identification, we monitored selected aliquots of the IC solutions subjected to the photocatalytic experiments.
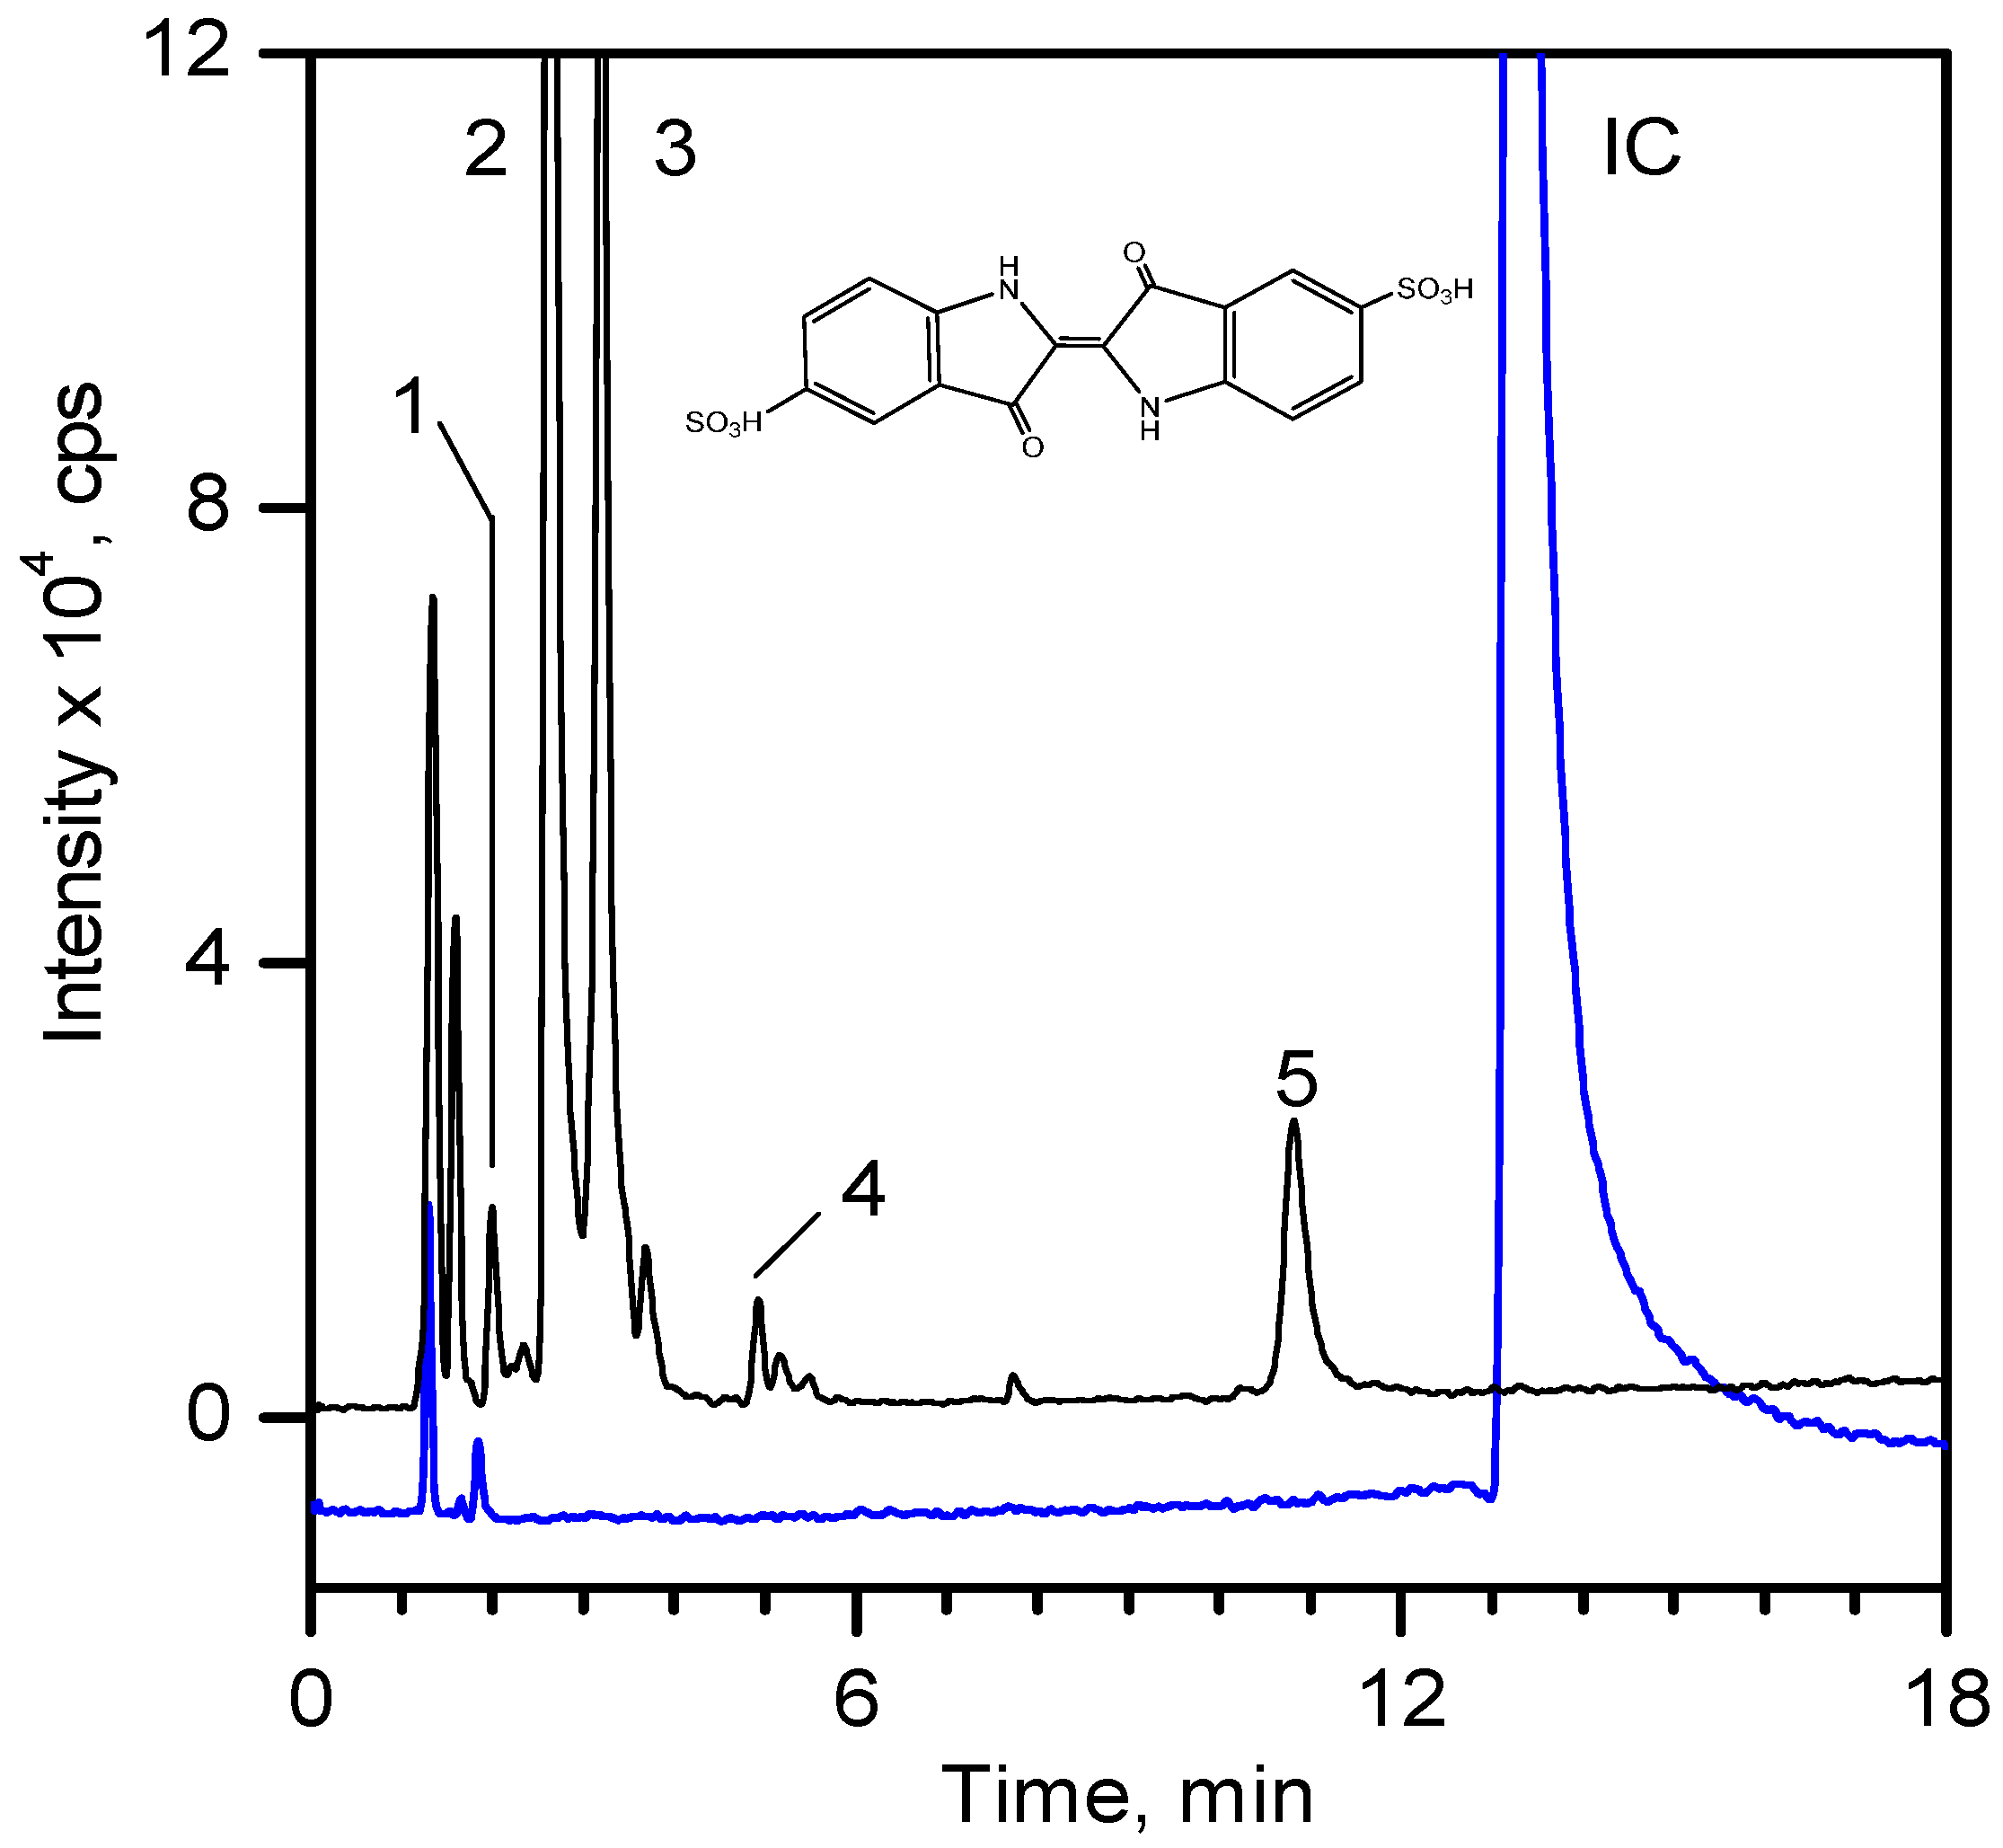
Figure 9 shows the LC-MS chromatograms of the stock solution of IC and one reaction mixture.
Table 4 lists the retention times, exact masses of the molecular ions (
m/
z), error values (Δ
m/
z), and the proposed structure of the products detected in
Figure 9.
Table 4.
Retention time and possible structures identified by LC-ESI-Qq-TOF-MS as products of IC during the photocatalytic reaction at 254 nm. The references reporting the same compound are given in brackets.
Figure 9.
LC-MS chromatogram of the stock solution of IC (300 mg·dm
−3) and a selected reaction mixture after 60 min of photocatalytic reaction using composite MT-G5 (200 m
2·g
−1) at a pH of 10 and 15 °C. The peak numbering is shown in
Table 4.
Figure 9.
LC-MS chromatogram of the stock solution of IC (300 mg·dm
−3) and a selected reaction mixture after 60 min of photocatalytic reaction using composite MT-G5 (200 m
2·g
−1) at a pH of 10 and 15 °C. The peak numbering is shown in
Table 4.
At least 6 new peaks eluted prior to the appearance of the dye peak in the aliquot chromatogram, and all of cases carried out under the Taguchi conditions exhibited the same products in different proportions. The mass error accuracy of the proposed structures was less than 5 ppm. In addition, the molecular ions with
m/
z 244 (peak 2) and 216 (peak 3) are the most abundant products and coincide with the compounds formed by photocatalysis on SnO
2 [
39] and photoelectrocatalysis on Ti/TiO
2/WO
3 electrodes [
40]. Interestingly, under visible-light irradiation, the ZnBiSbO
4 photocatalyst produced 2-amino benzoic acid, which is the non-sulfonated form of compound 2 in
Table 4 [
42]. Electrochemical [
43] and biological degradation processes [
41] have also been reported to produce the aromatic compound isatin-5-sulfonic acid (mass 226) as an important degradation product of IC. We did not detect this product from the oxidative breaking of the indigoid C=C bond under any experimental condition. In contrast, we identified 2-(2-amino-5-sulfophenyl)-2-oxoacetic acid (peak 2,
m/
z 243.9924), which easily forms from isatin-5-sulfonic acid by addition of H
2O [
44].
In addition to the sulfonated amines (peaks 1–3 in
Table 4) bearing only one phenyl ring, the structures proposed for two of the other products (
i.e., peaks 4 and 5 in
Figure 9) are given in
Table 4. The oxazine compound (peak 4), which has not been previously reported, was confirmed by MS/MS yielding the following product ions: 194 [258-SO2]
−, 178 [258-SO3]
−, 160 [258-H2SO4]
−, 150 [258-C6H4O2]
−, 133 [258-H3O5S]
−, 123 [258-CHO5S]
−, and 80 [258-C8H4O4N]
−.


