Profiling the Interaction Mechanism of Quinoline/Quinazoline Derivatives as MCHR1 Antagonists: An in Silico Method

Abstract
:1. Introduction
2. Results and Discussion
2.1. Three-Dimensional Quantitative Structure–Activity Relationship (3D-QSAR) Statistical Results

| PLS Statistics | CoMFA | CoMSIA |
|---|---|---|
| Q2 | 0.372 | 0.509 |
| R2ncv | 0.896 | 0.841 |
| SEE | 0.235 | 0.288 |
| F | 138.780 | 100.745 |
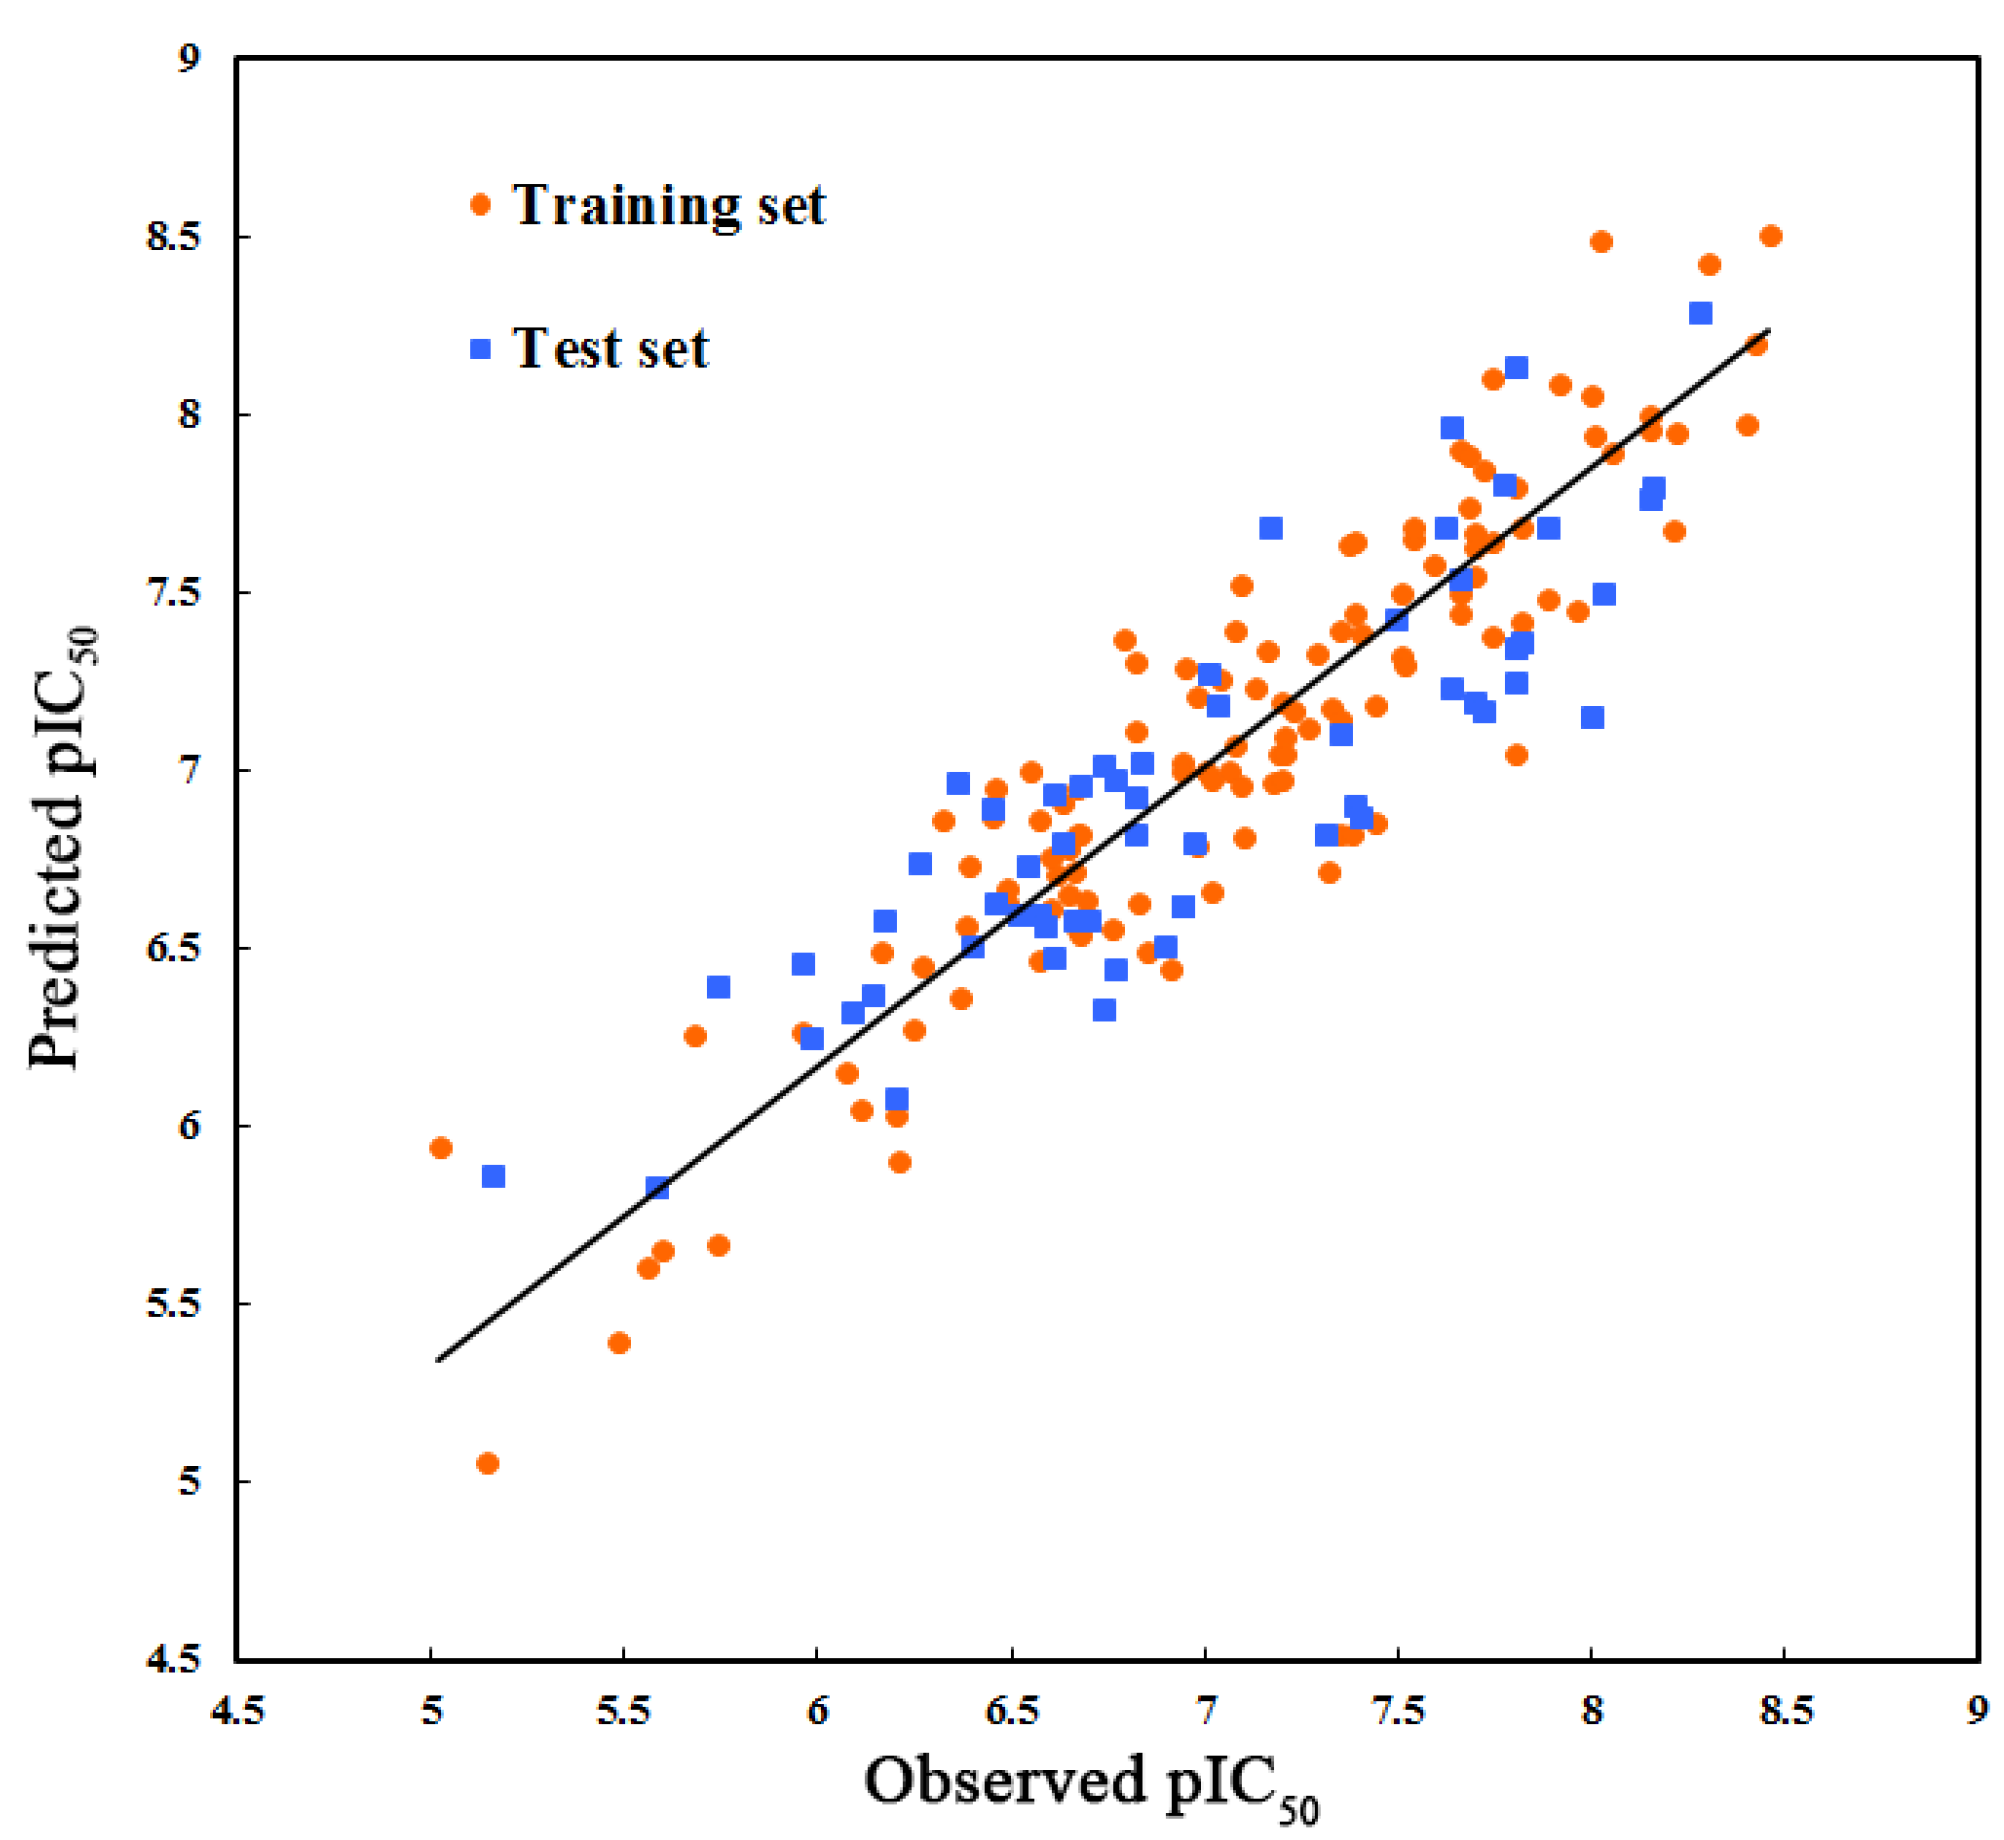
| R2pred | 0.544 | 0.745 |
| SEP | 0.576 | 0.507 |
| OPN | 7 | 6 |
| Contribution (%) | ||
| Steric | 54.8 | 14.8 |
| Electrostatic | 45.2 | – |
| Hydrophobic | – | 39.0 |
| H-bond donor | – | 23.1 |
| H-bond acceptor | – | 23.1 |
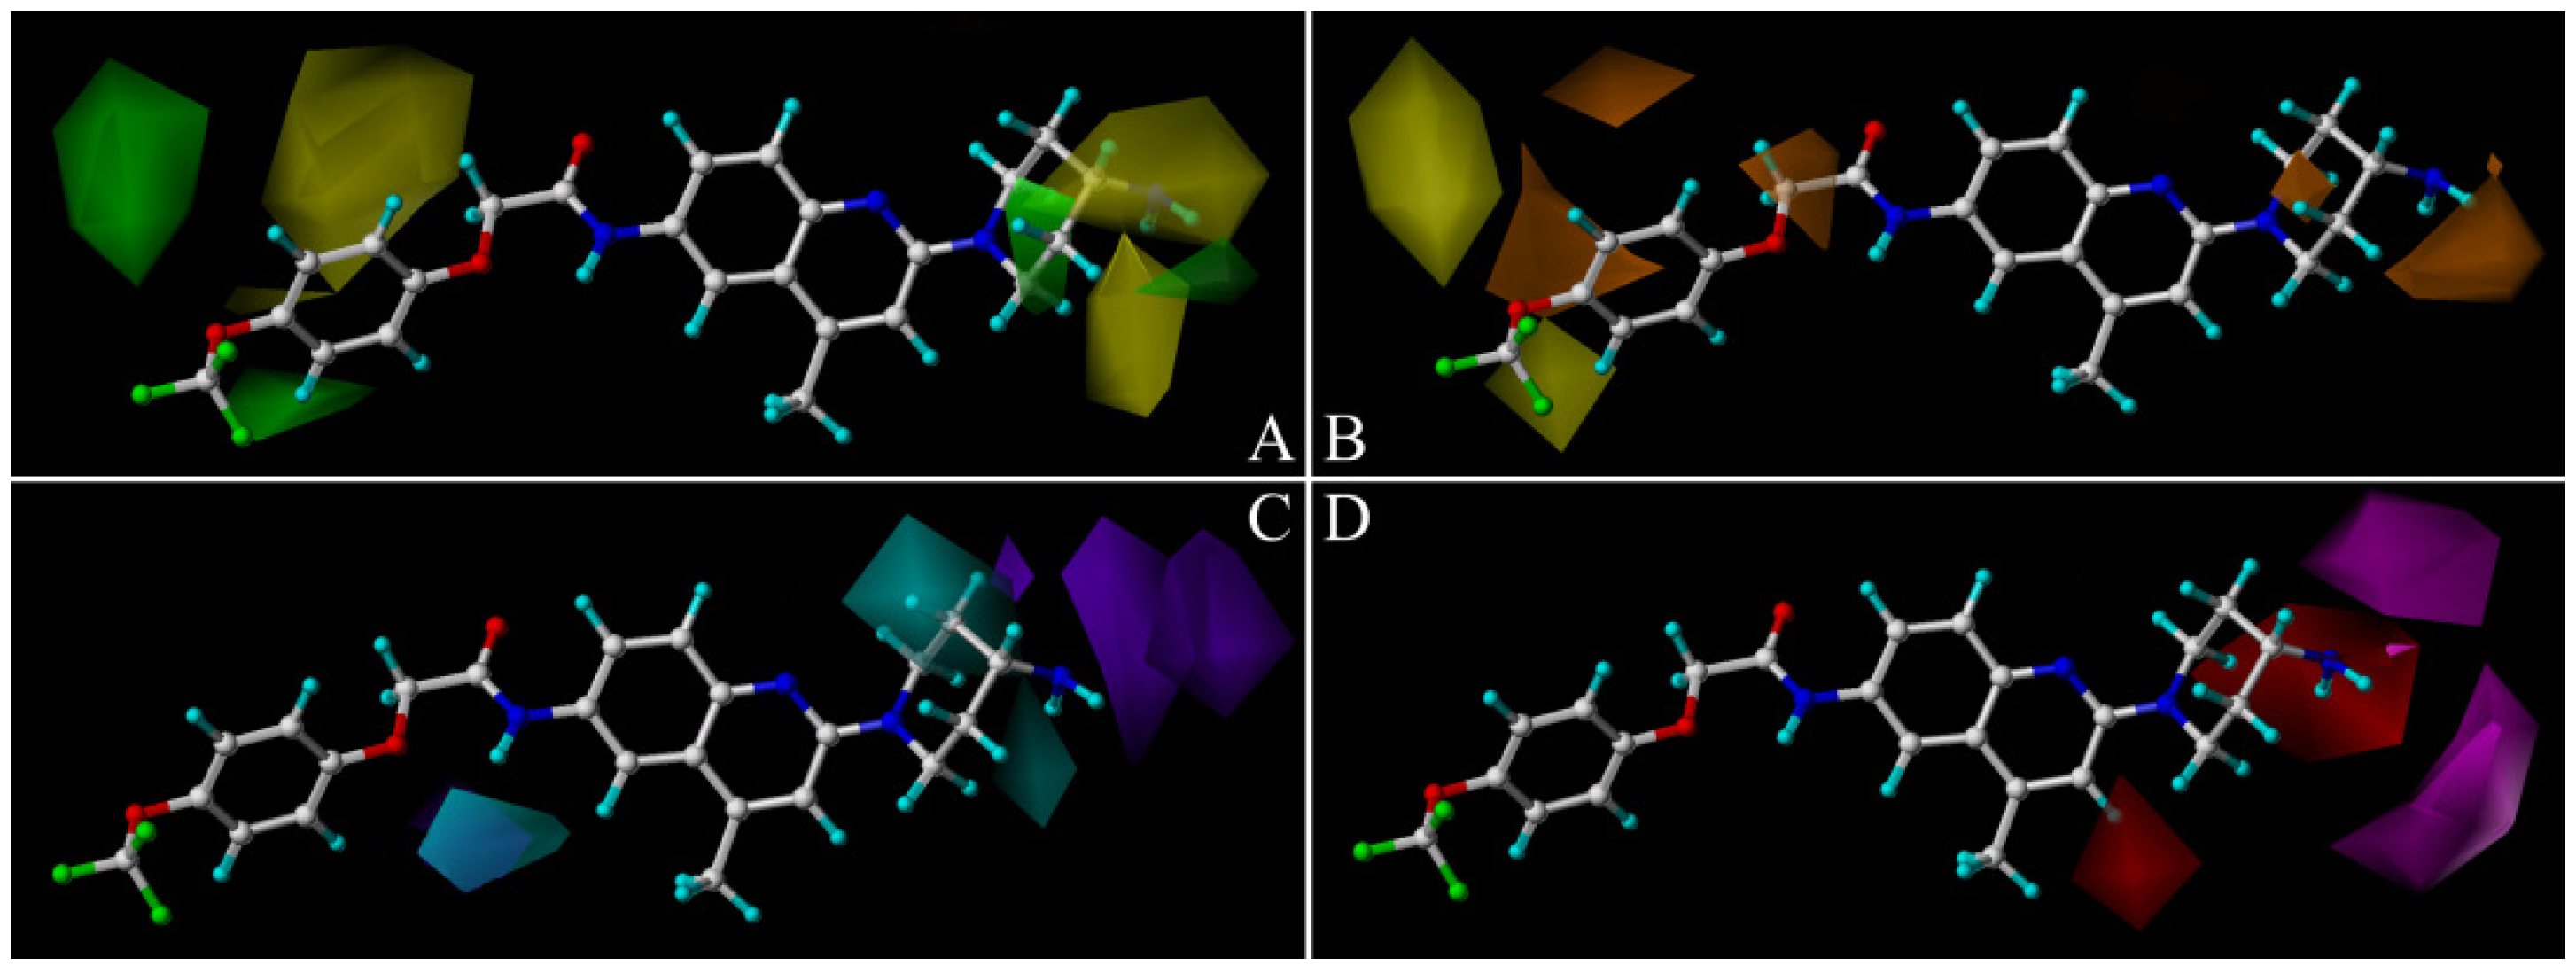
2.2. Comparative Molecular Similarity Index Analysis (CoMSIA) Contour Maps Analysis
2.3. Docking Study
2.4. Molecular Dynamics (MD) Analysis
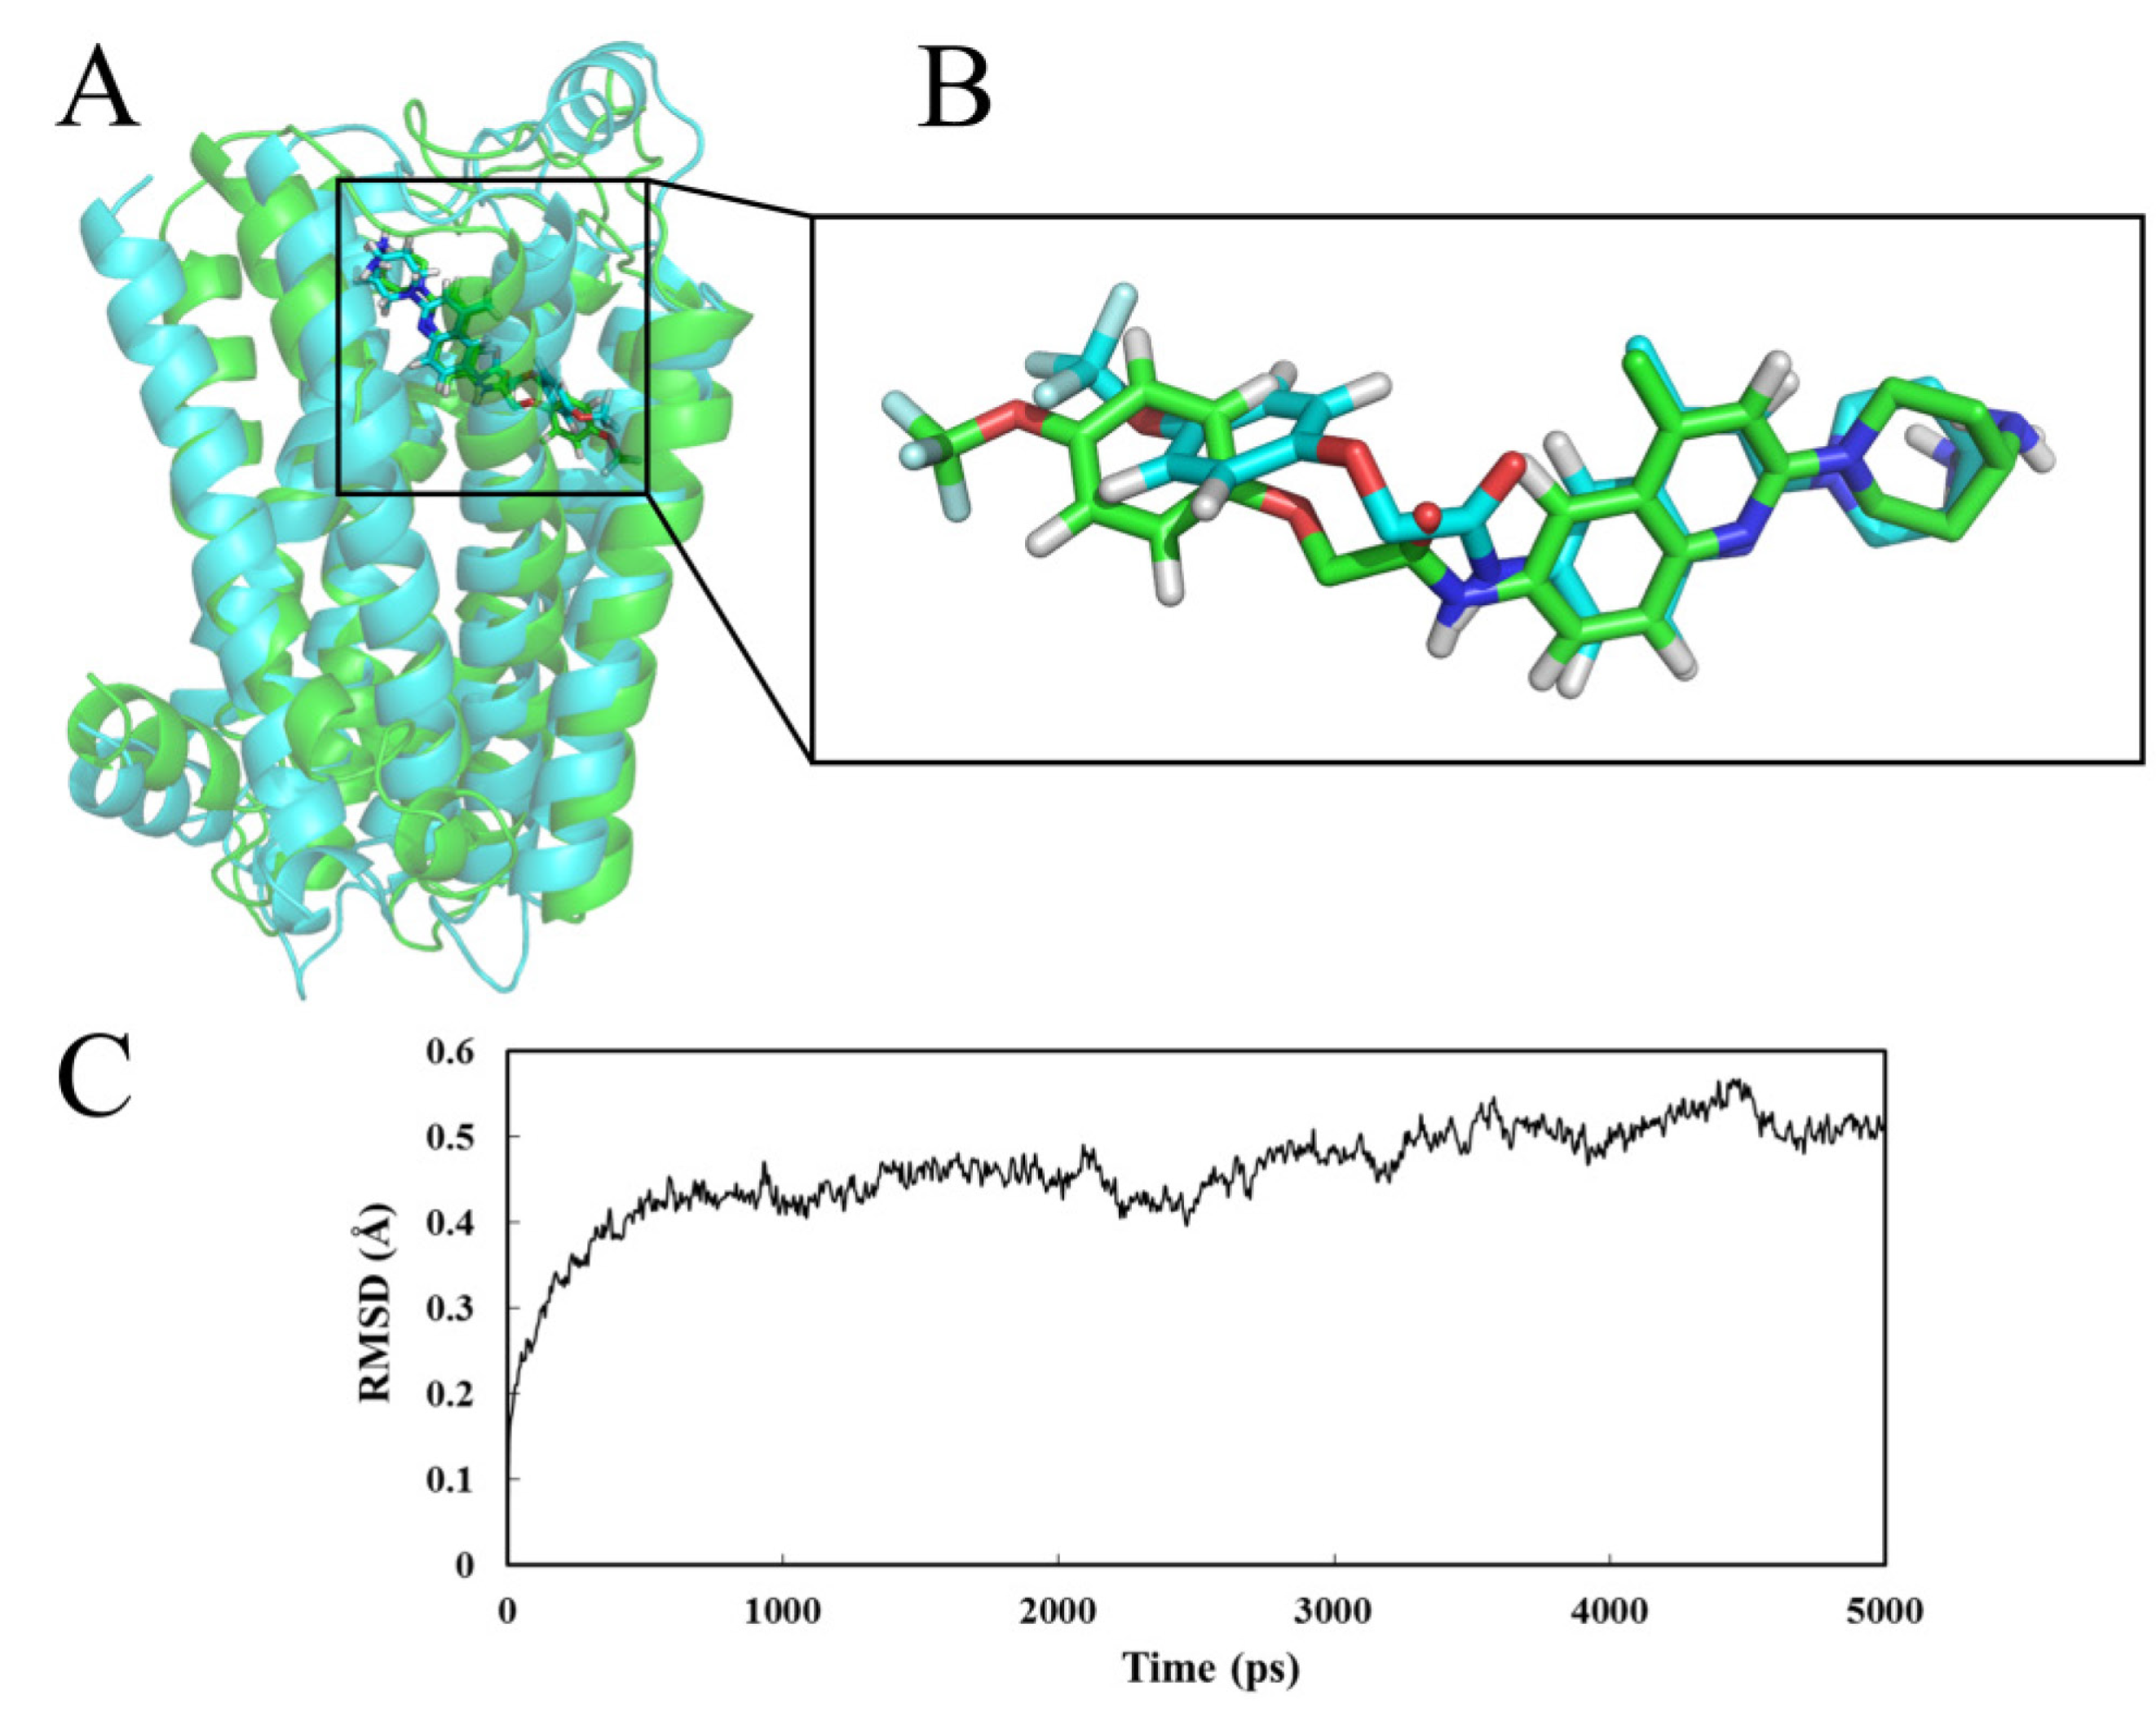
2.4.1. Receptor in Water

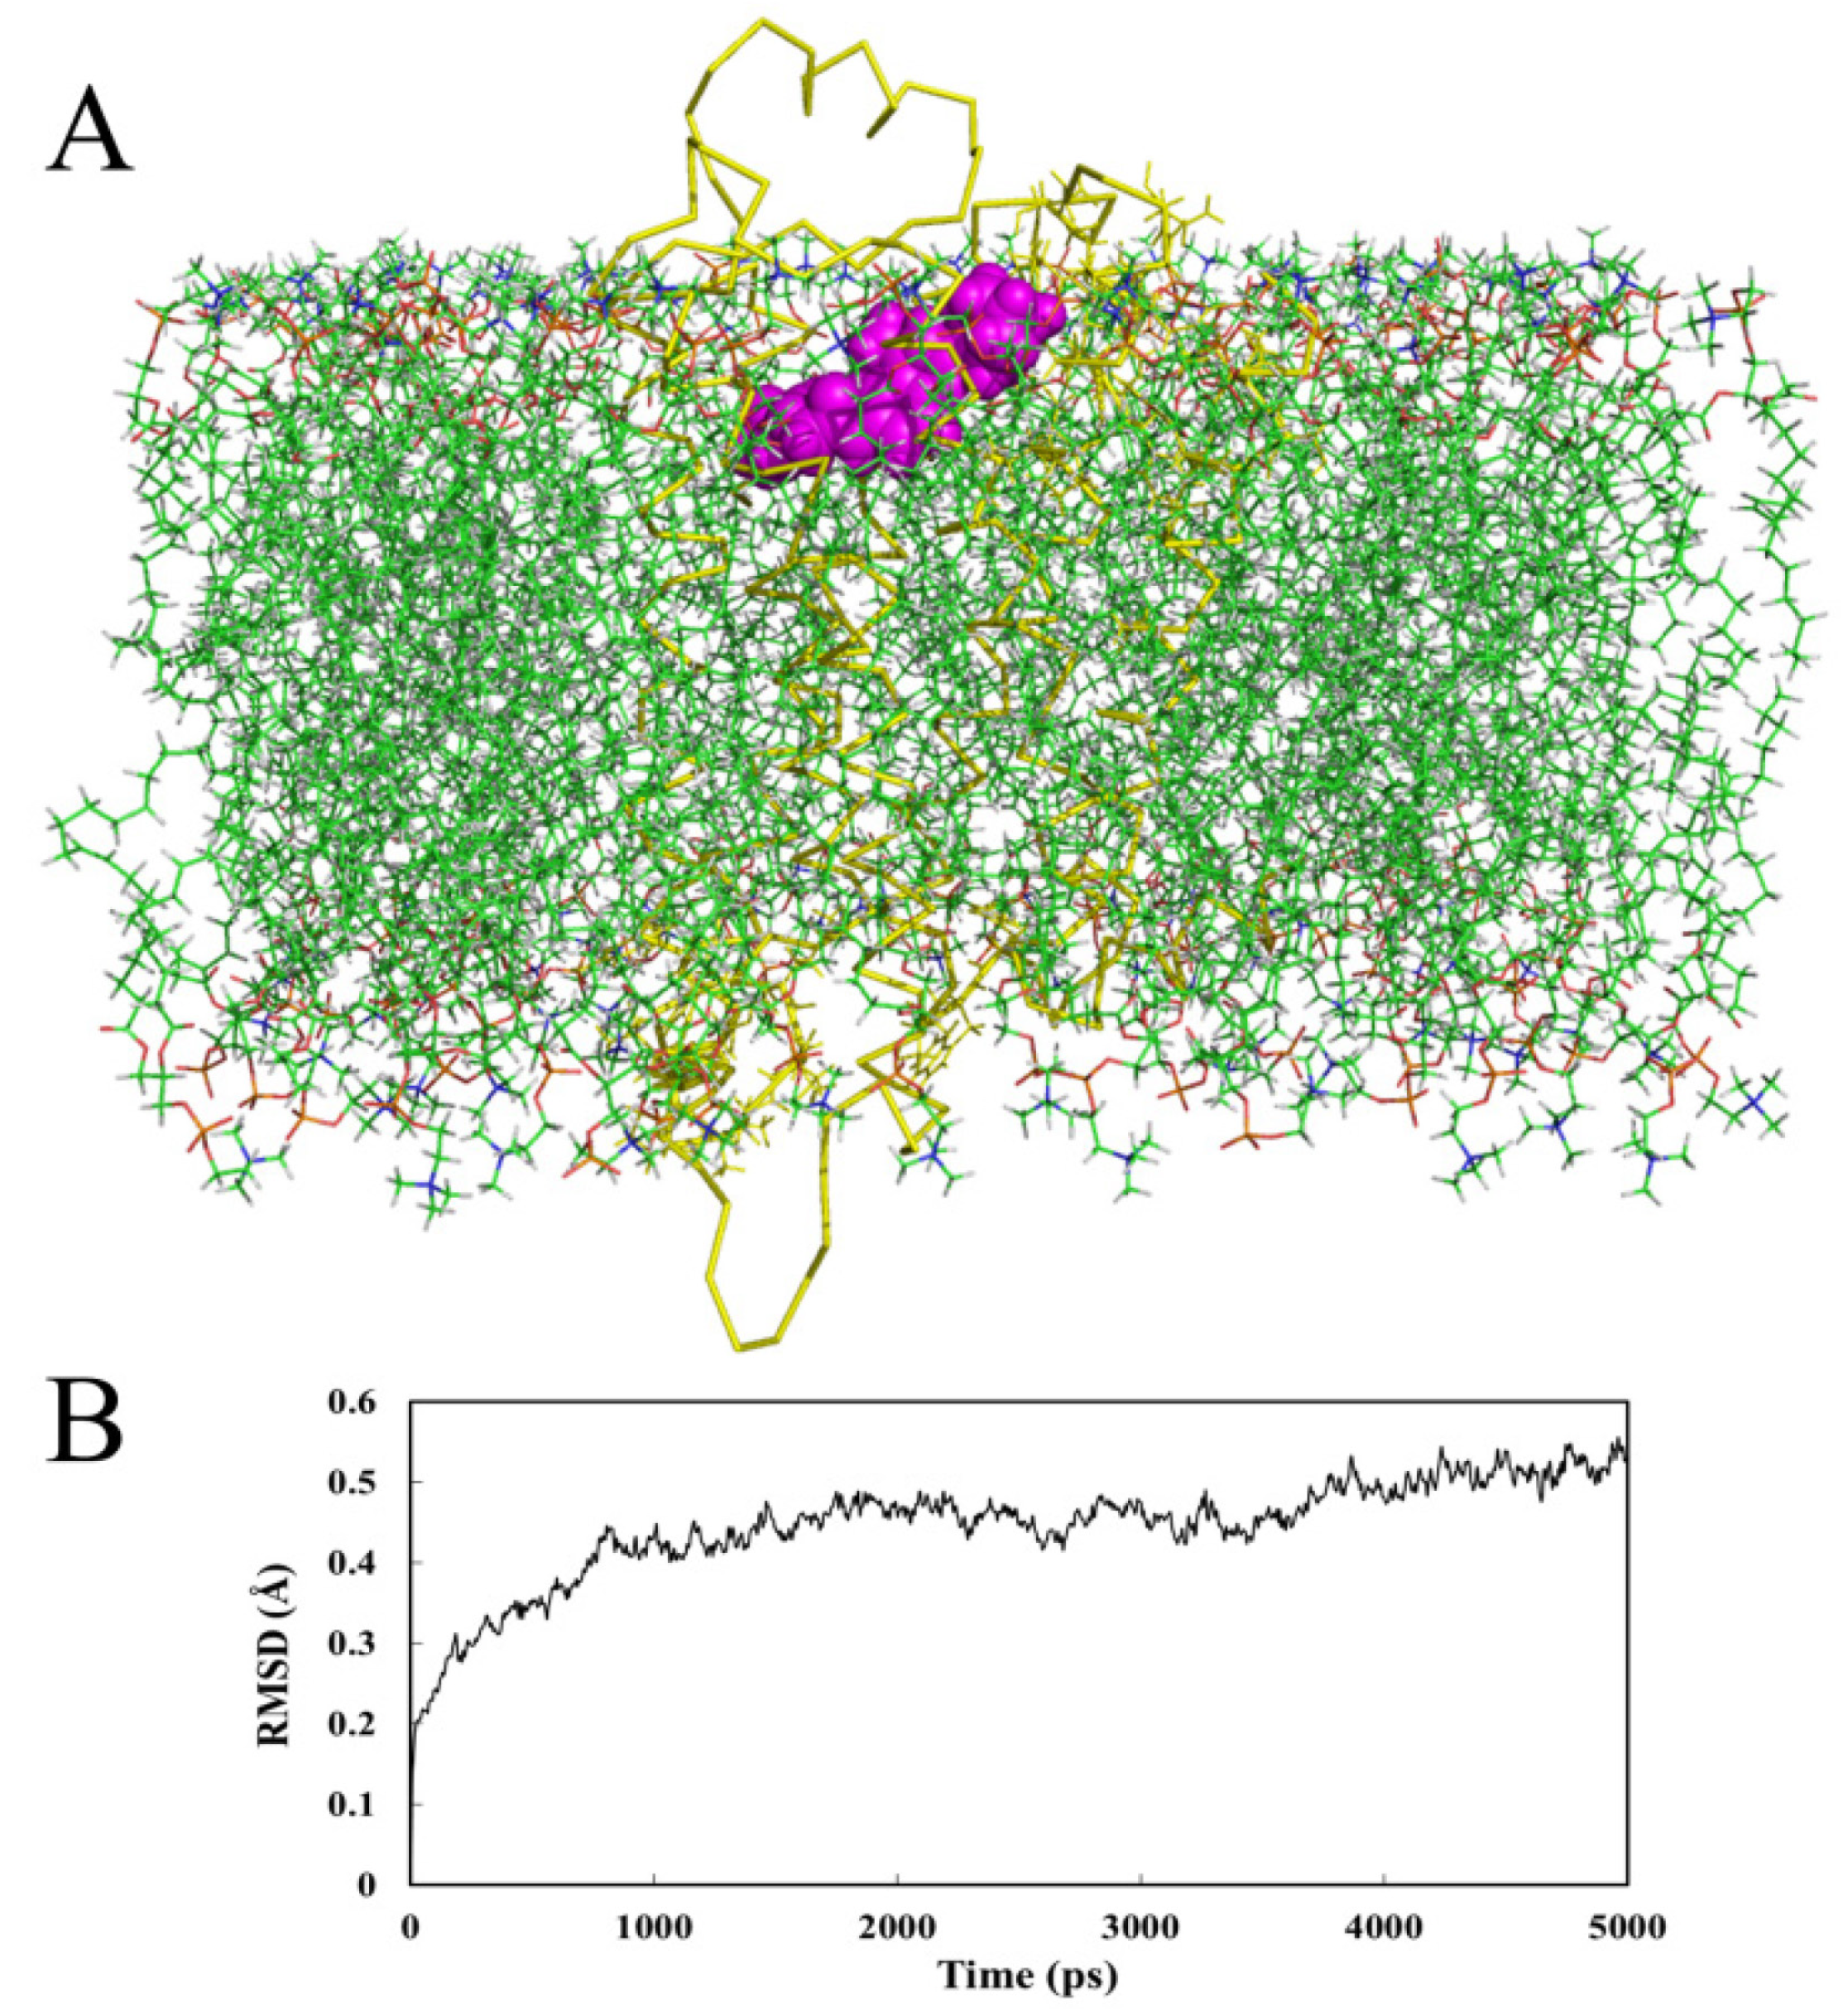
2.4.2. Receptor in Lipid Bilayer


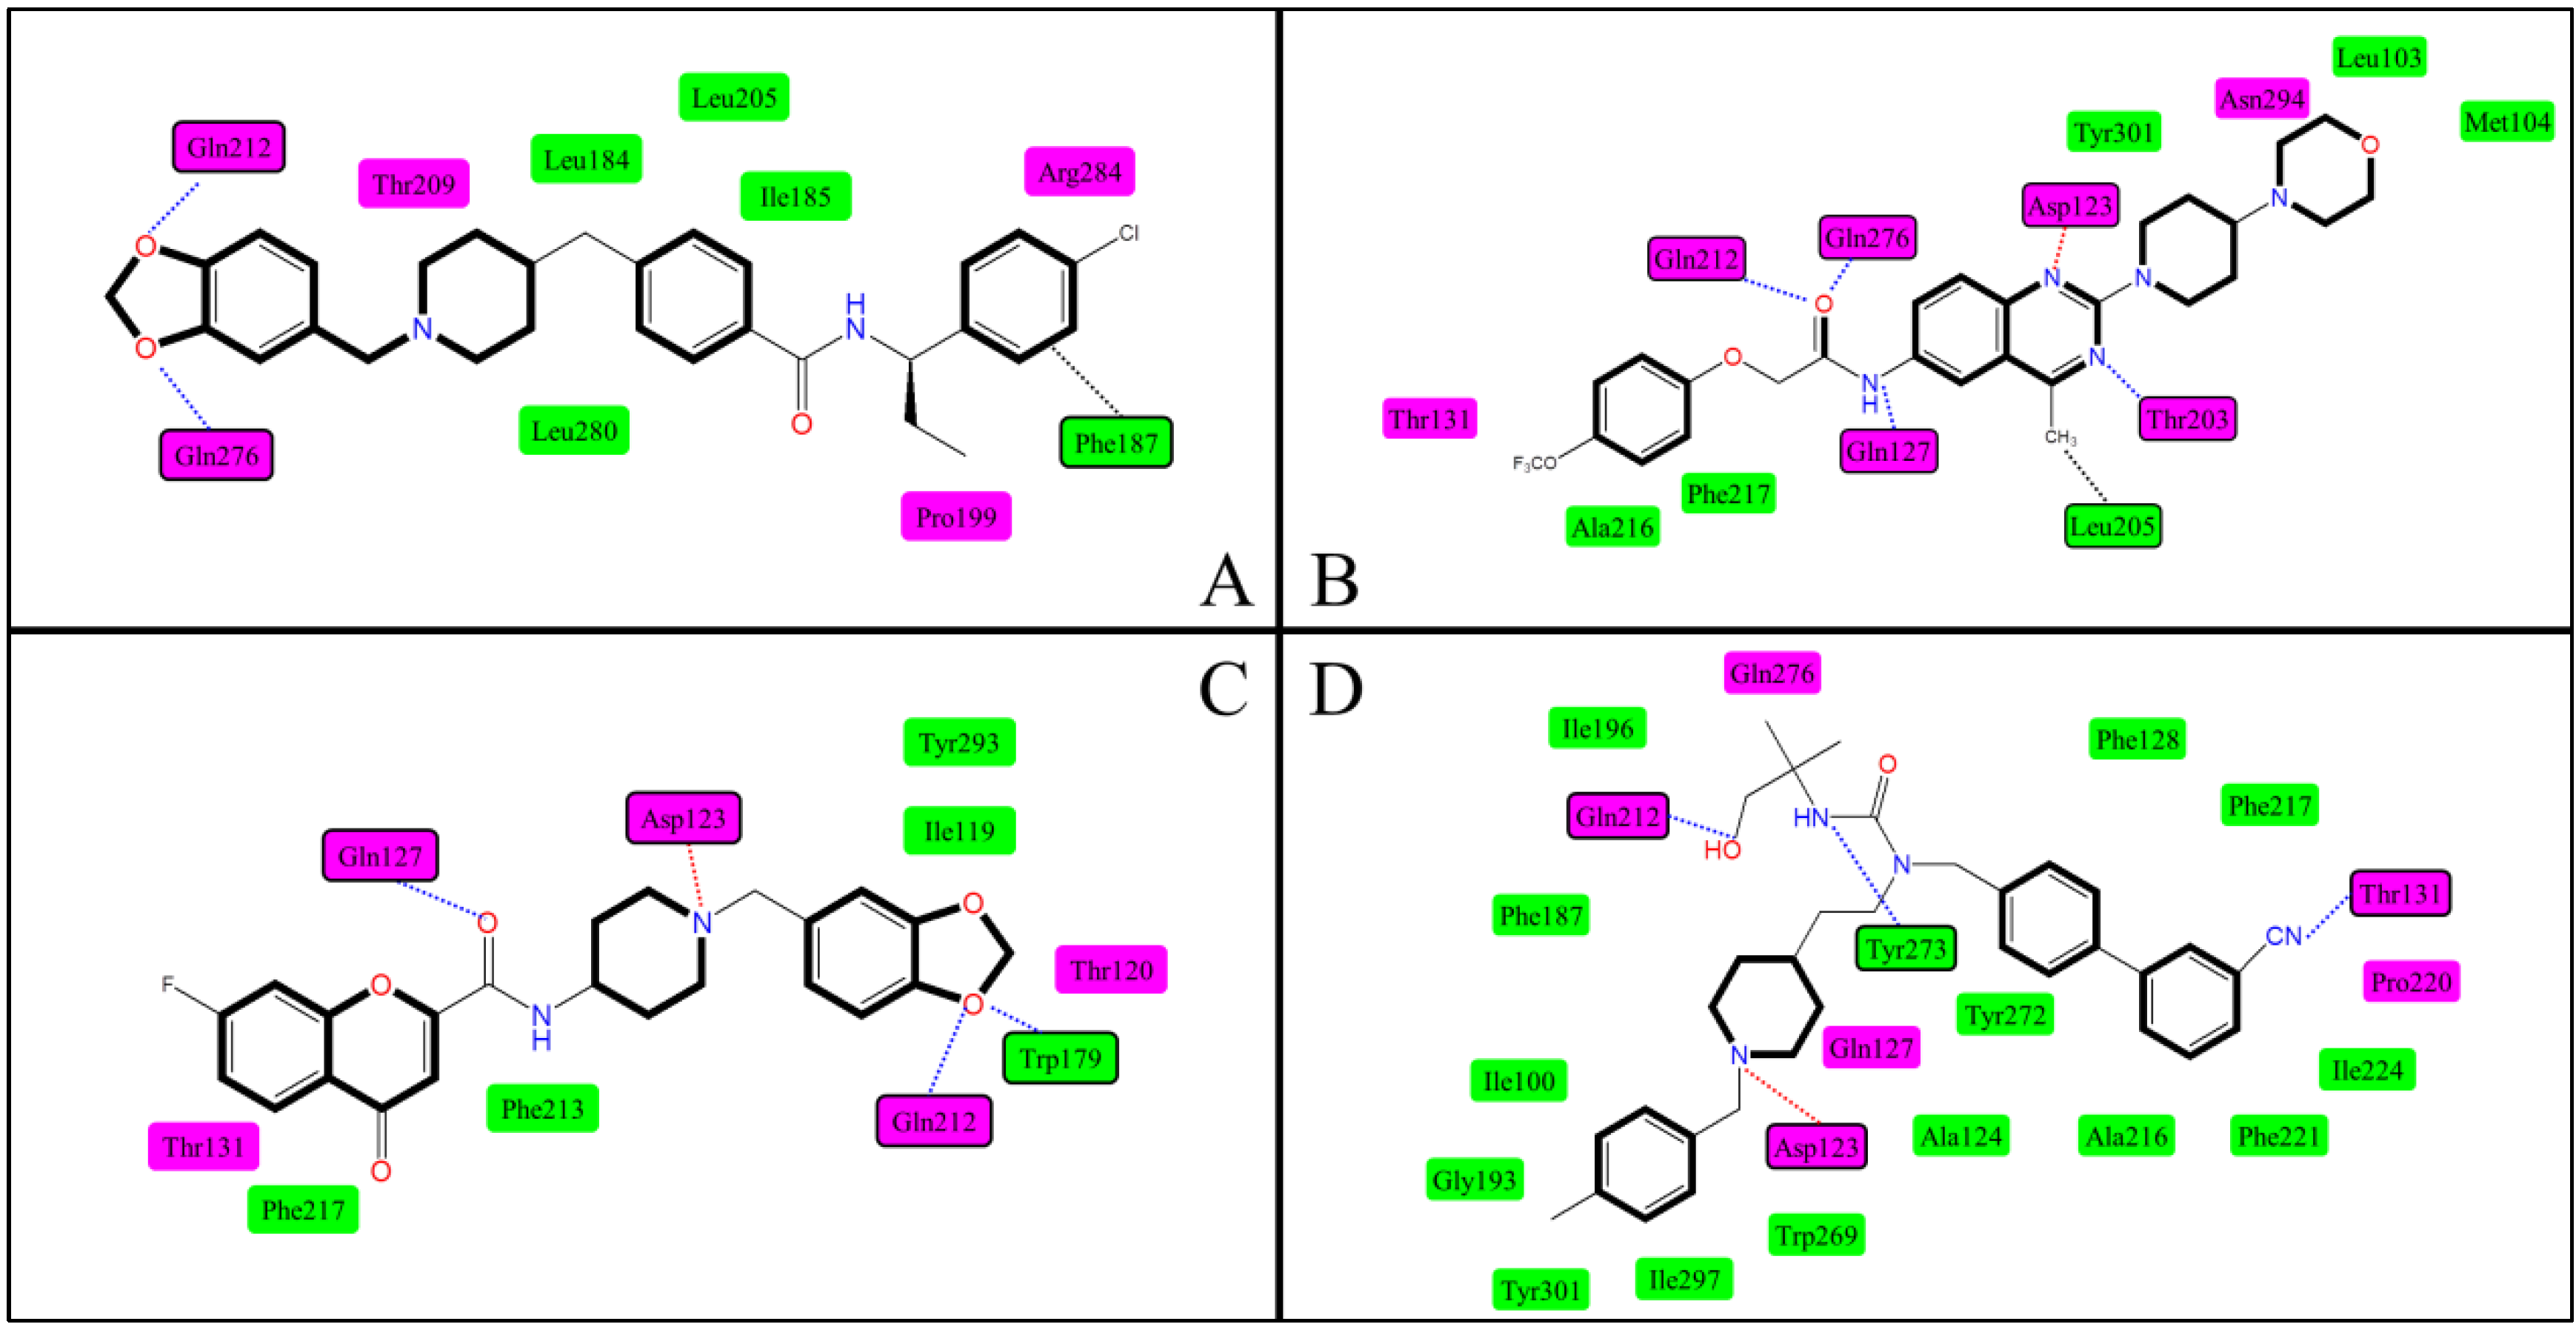
2.5. Docking Comparison
| No. | Researchers | Template | Binding Site | Binding Interactions | Crucial Residues |
|---|---|---|---|---|---|
| 1 | Clark et al. [42] | Bovine rhodopsin | P1 | Ionic interaction, H-bond, hydrophobic effect | Asp123, Gln276 |
| 2 | Tavares et al. [38] | Bovine rhodopsin | P1 | Ionic interaction, H-bond | Asp123, Tyr273 |
| 3 | Witty et al. [46] | Bovine rhodopsin | P1 | Unclear | Asp123 |
| 4 | Giordanetto et al. [47] | 1U19 a | P1 | Ionic interaction, H-bond | Asp123, Gln127 |
| 5 | Cavasatto et al. [48] | 1L9H a | P1 | π–π stacking, H-bond | Asp123, Gln127 Trp269, Ile297, Gly300, Tyr301 |
| 6 | Abu-Hammad et al. [49] | 1U19 a | P2 | Van der Waals stacking, H-bond, hydrophobic effect | Gln212, Gln276 Phe187 |
| 7 | Sasmal et al. [50] | 2RH1 a, 2VT4 a | P1 | Ionic interaction, H-bond, hydrophobic effect | Asp123, Gln127, Gln212, Gln268, Asn255 |
| 8 | Ulven et al. [32] | 1F88 a | P1 | Ionic interaction, H-bond, hydrophobic effect | Asp123, Gln212 |
| 9 | Sasmal et al. [29] | 2RH1 a | P1 | Ionic interaction, H-bond | Asp123, Gln127, Gln212, Gln276, Thr164 |
| 10 | Helal et al. [39] | 1U19 a | P1 | Ionic interaction, H-bond, hydrophobic effect | Asp123, Gln127, Gln212, Gln276, Trp179, Thr131 |
| 11 | Cirauqui et al. [43] | 1U19 a | P1 | Ionic interaction, H-bond, hydrophobic effect | Asp123, Gln212, Gln276,Tyr273, Thr131 |
| 12 | Kamata et al. [51] | 1F88 a | P1 | H-bond, hydrophobic effect | Gln127, Asn294 |

3. Experimental Section
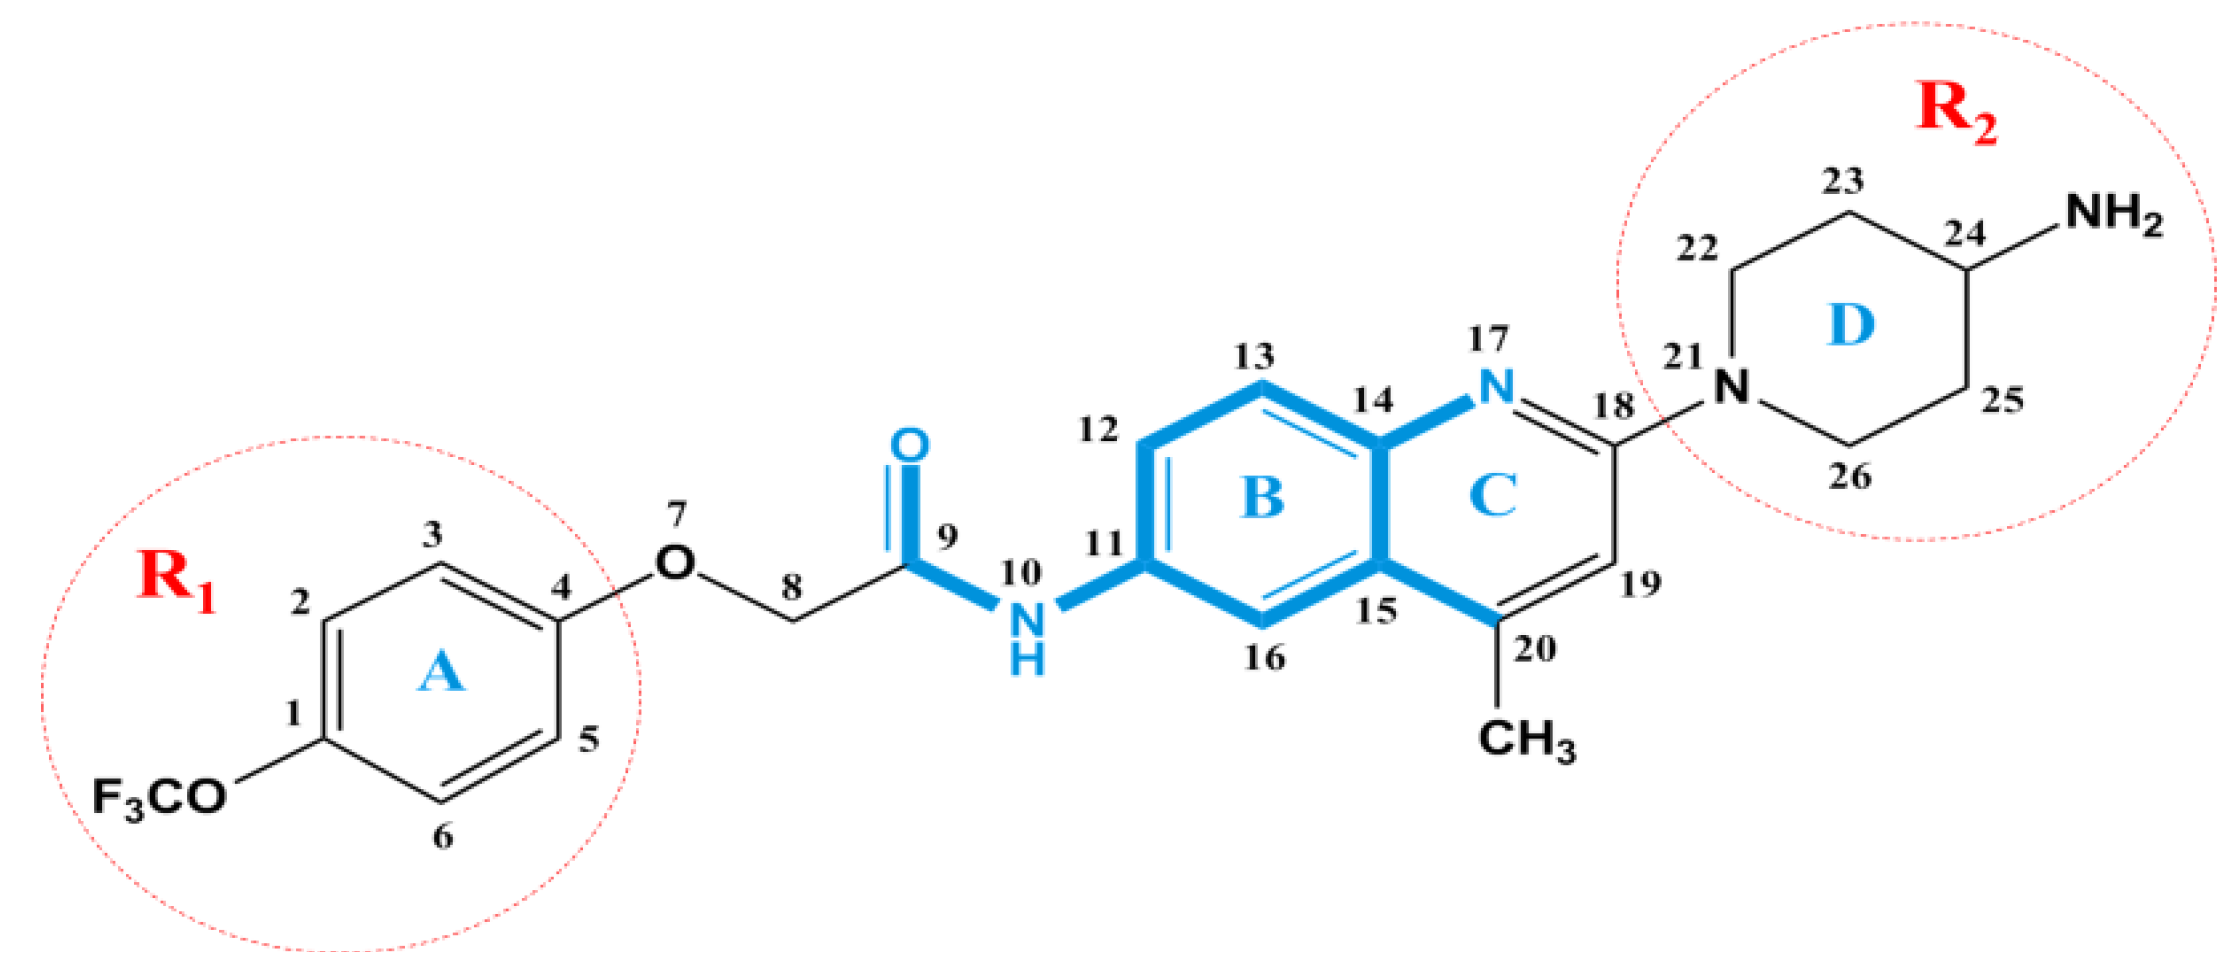
3.1. Biological Activities and Dataset Construction
3.2. Conformational Optimization and Alignment
3.3. Comparative Molecular Field Analysis (CoMFA) and CoMSIA Studies

3.4. Partial Least Squares (PLS) Analysis and Validation of Quantitative Structure–Activity (QSAR) Models

3.5. Homology Modeling
3.6. Docking Simulations
3.7. MD Simulations
4. Conclusions

- (1)
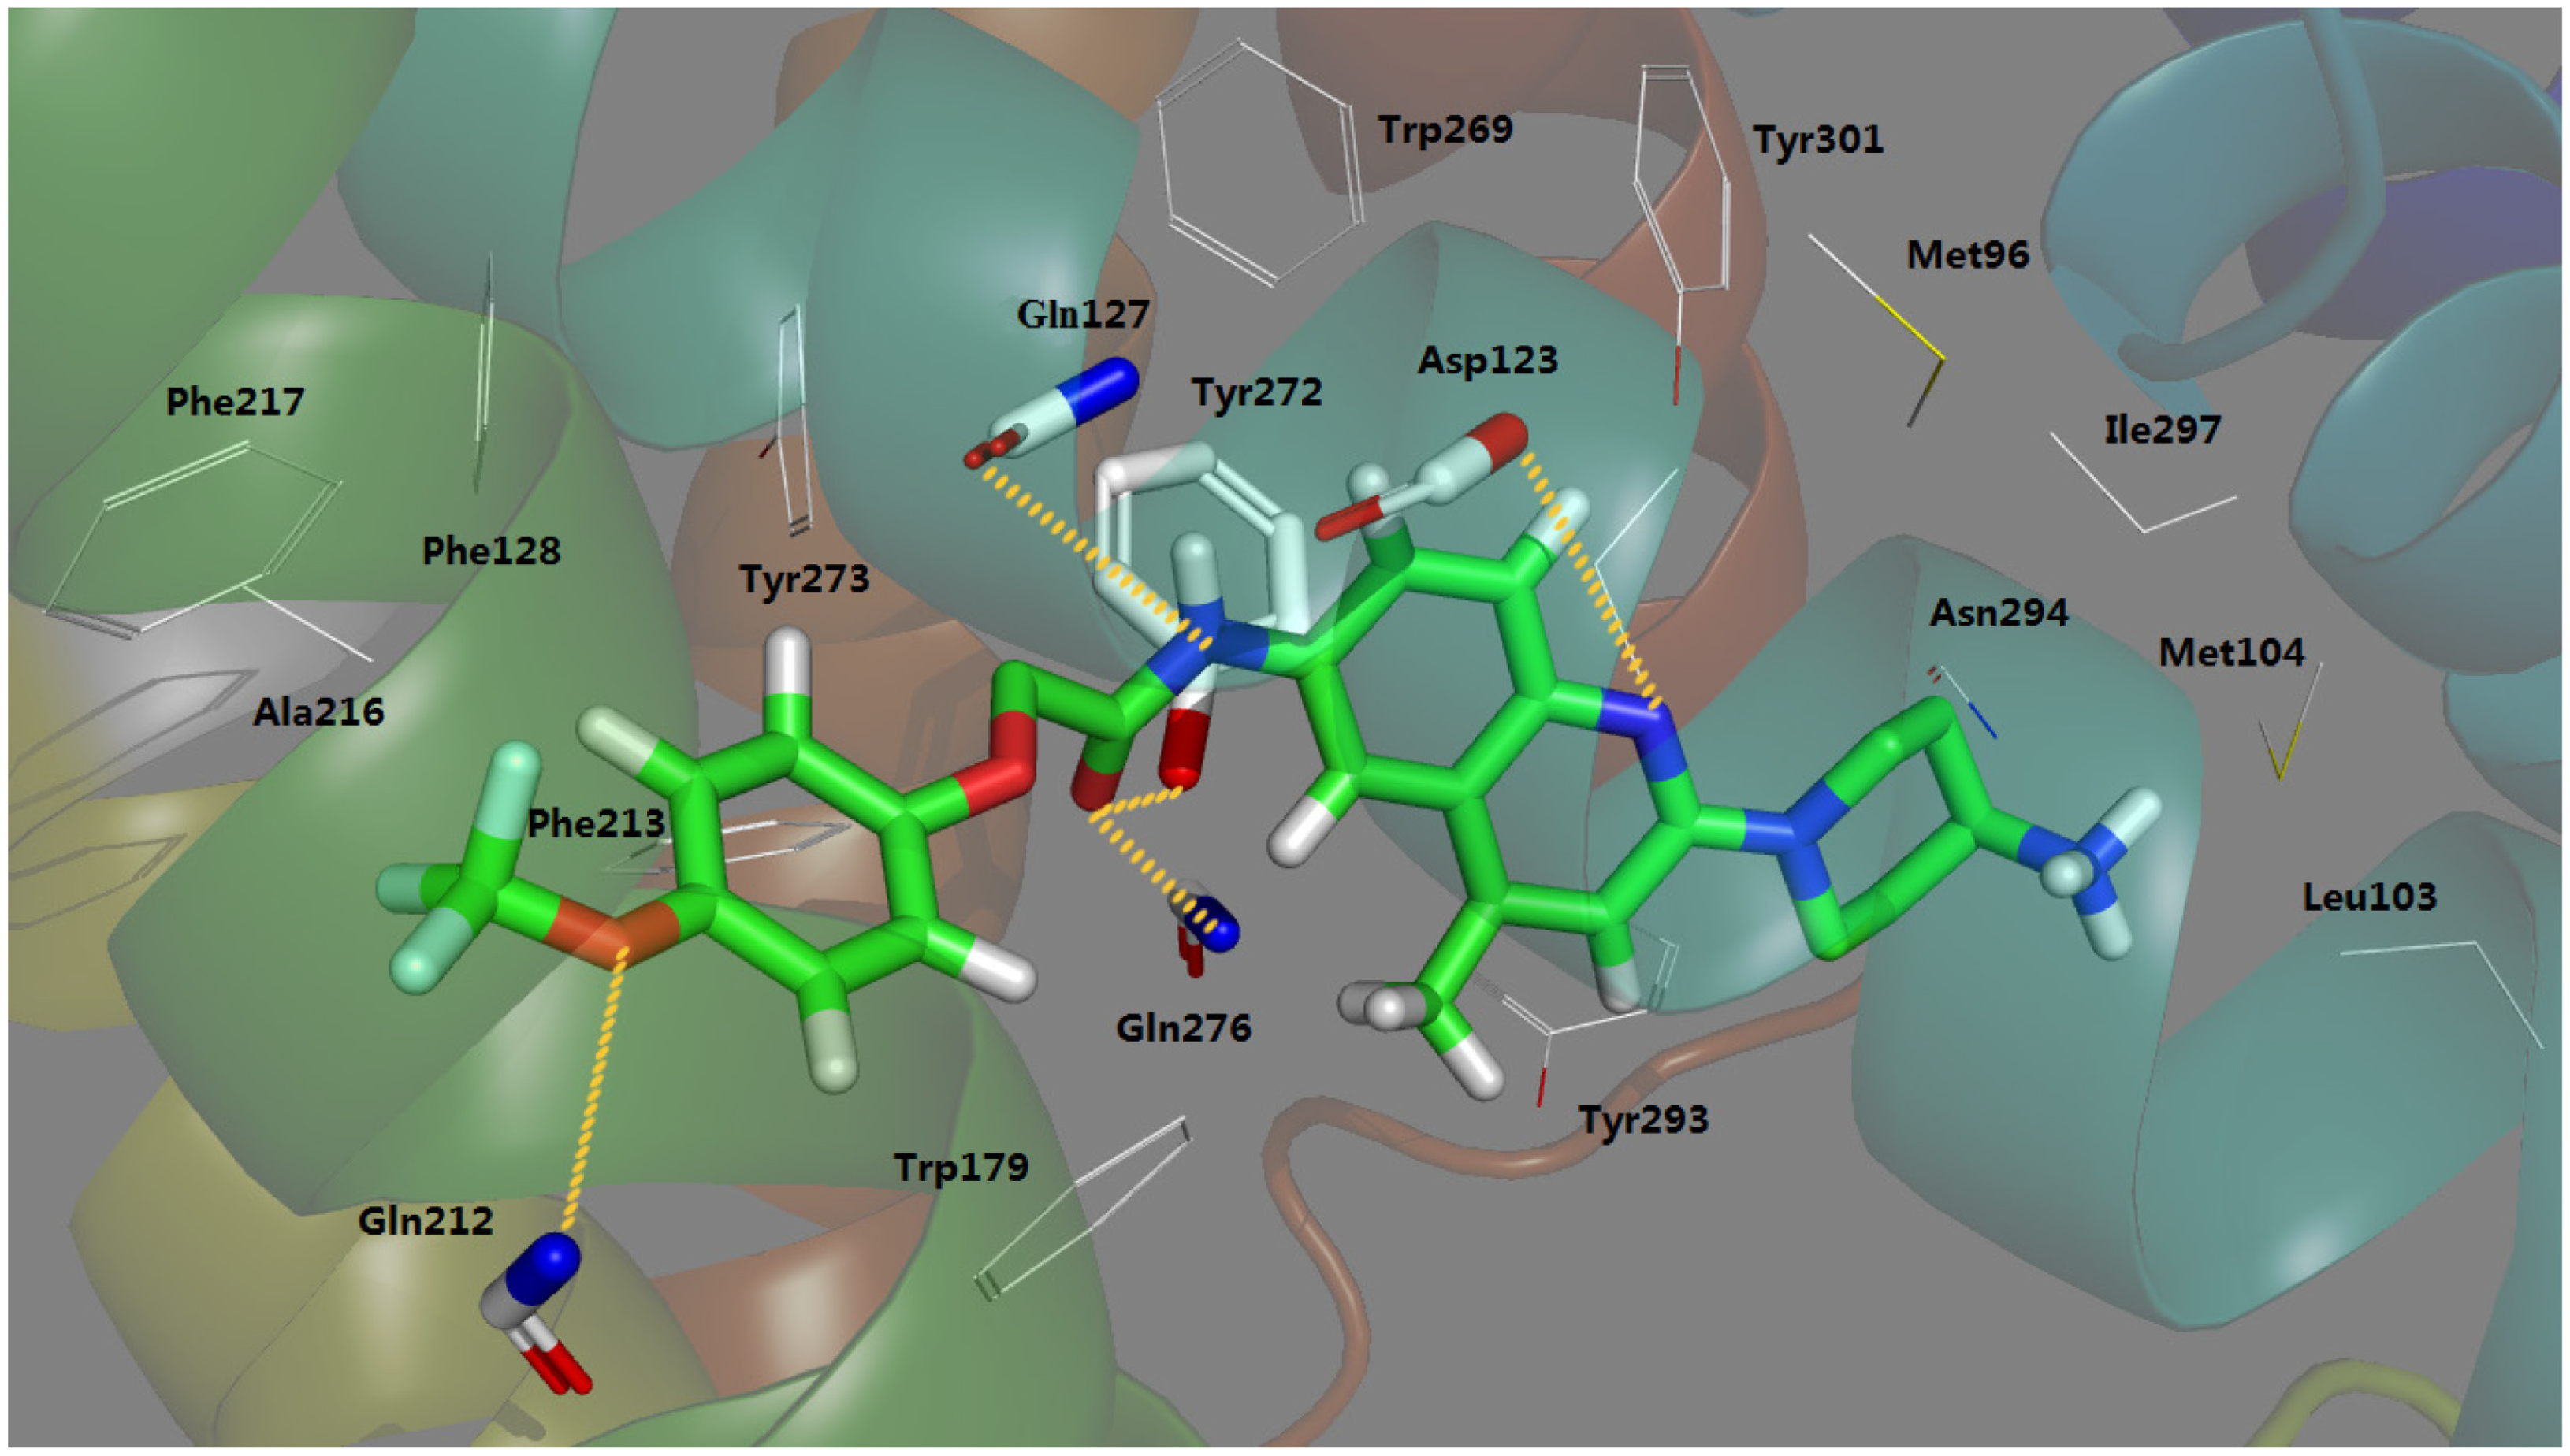
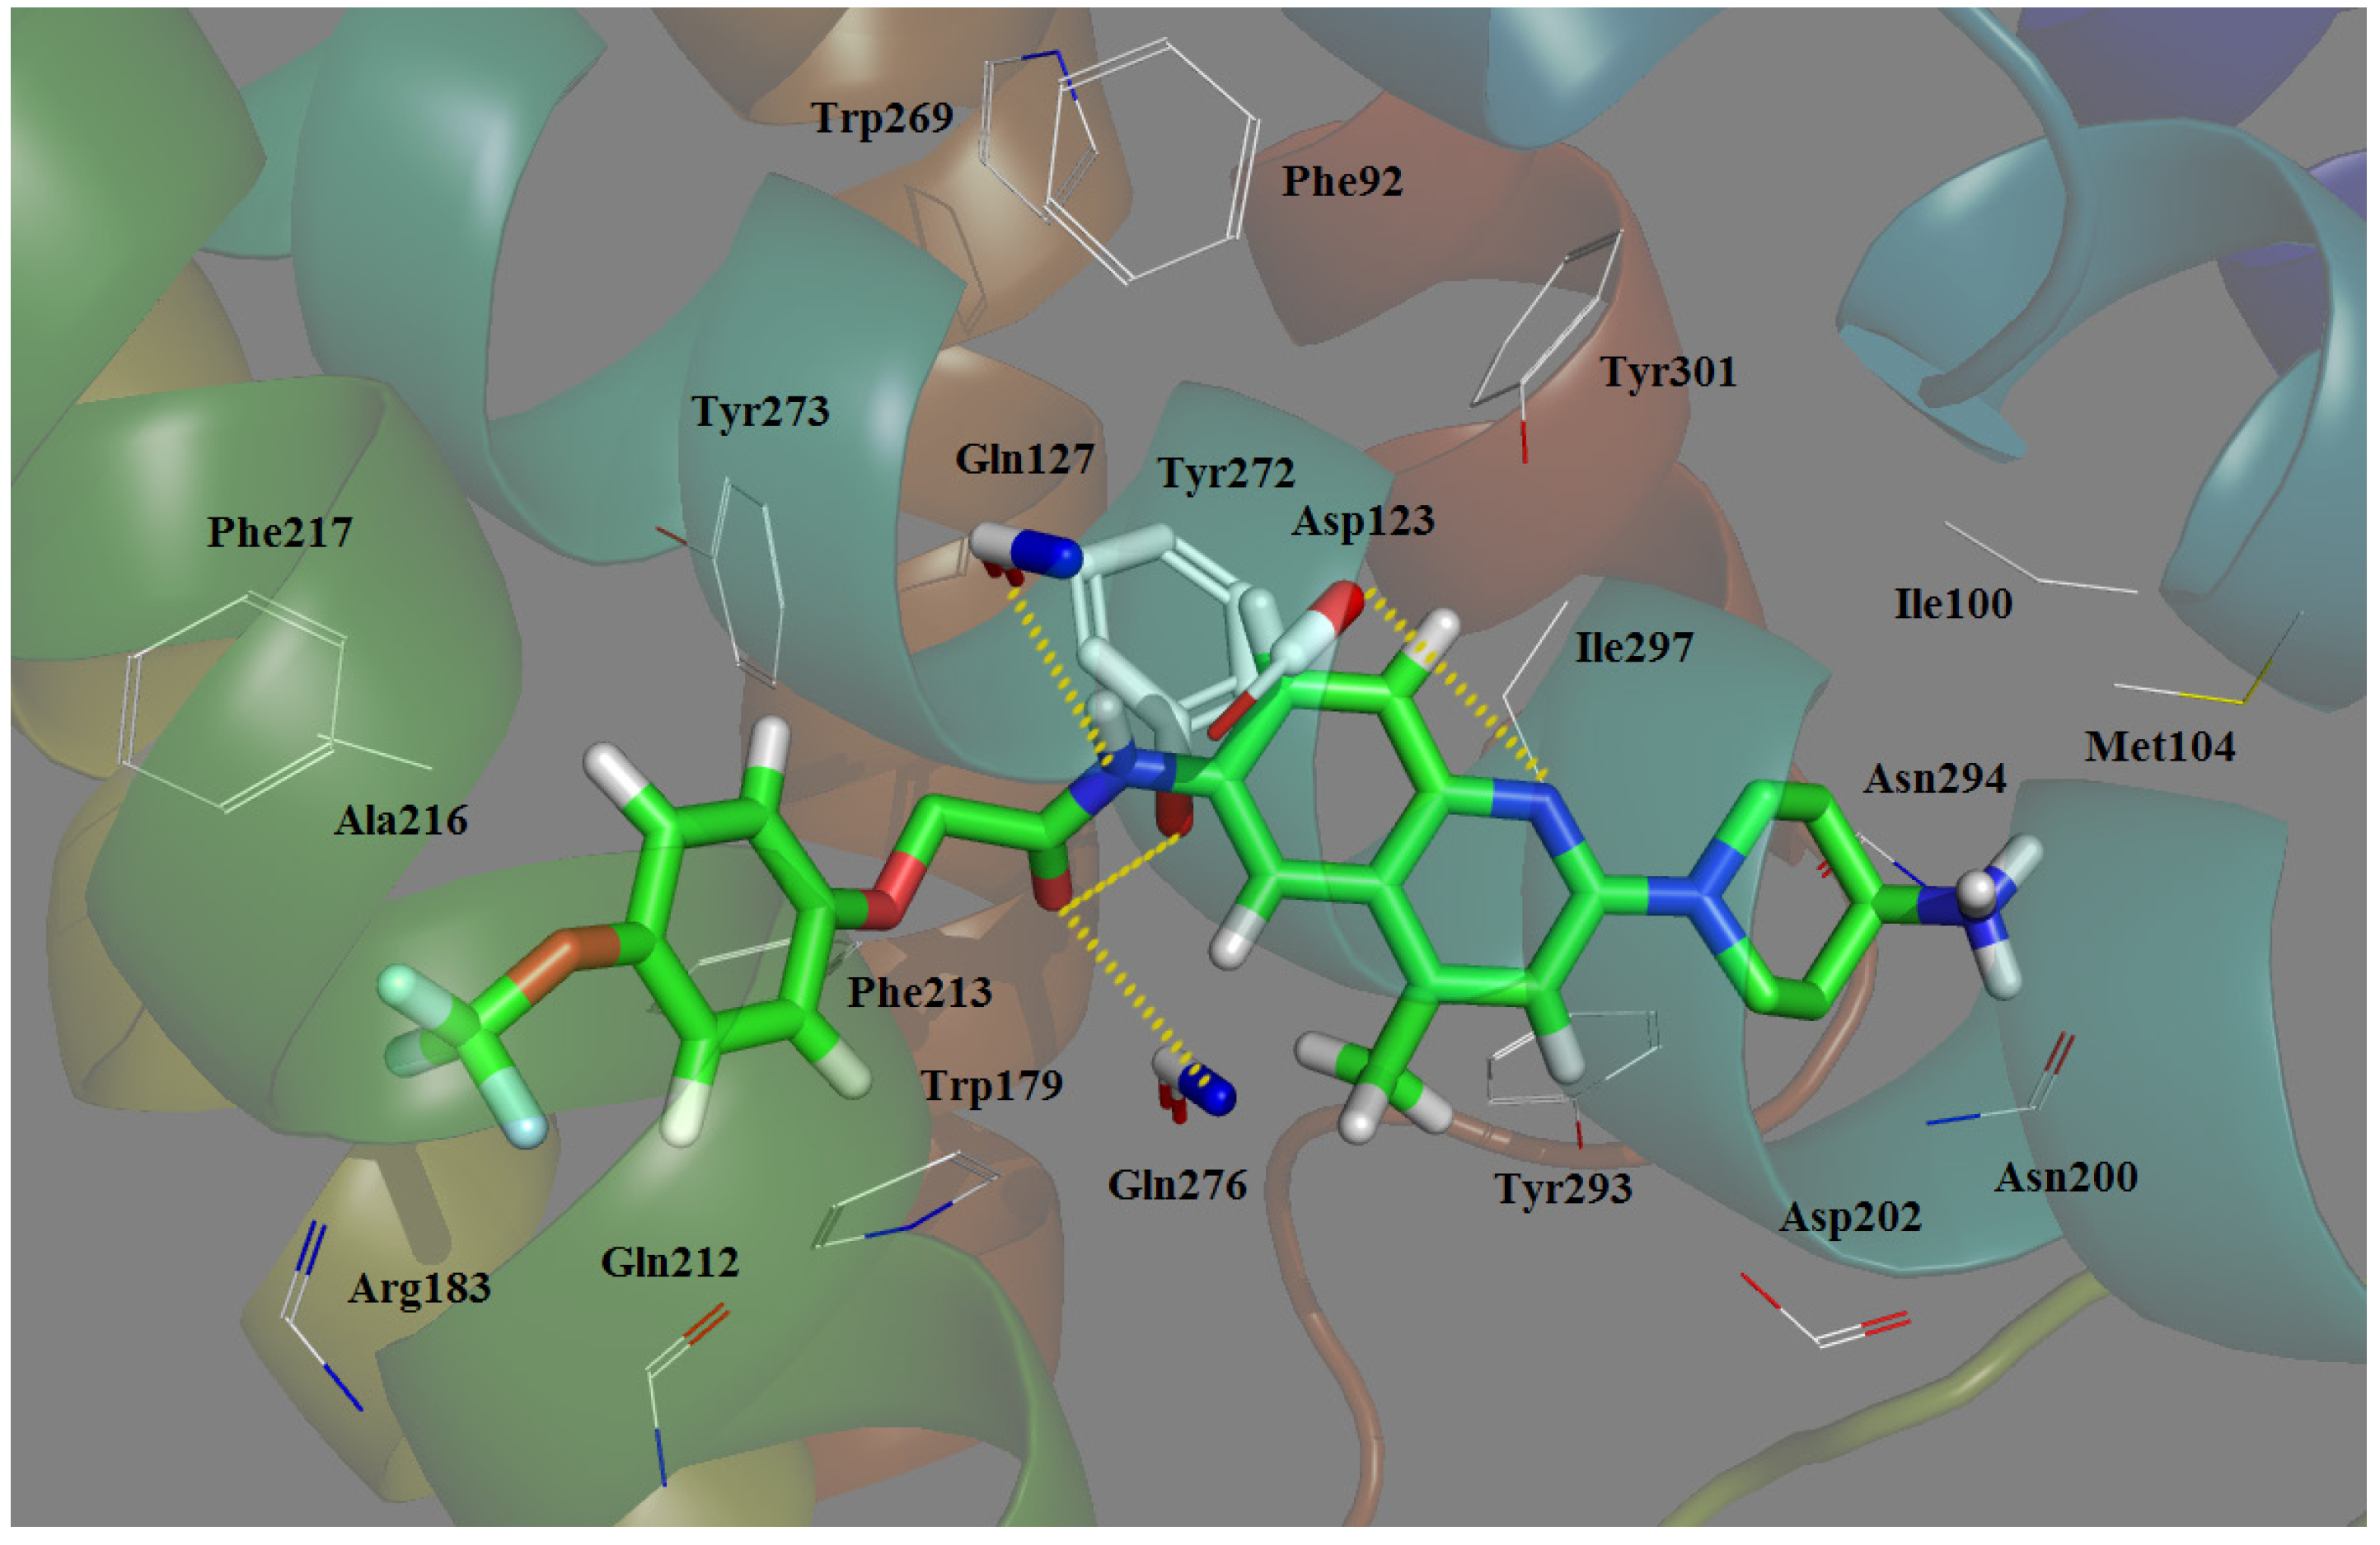
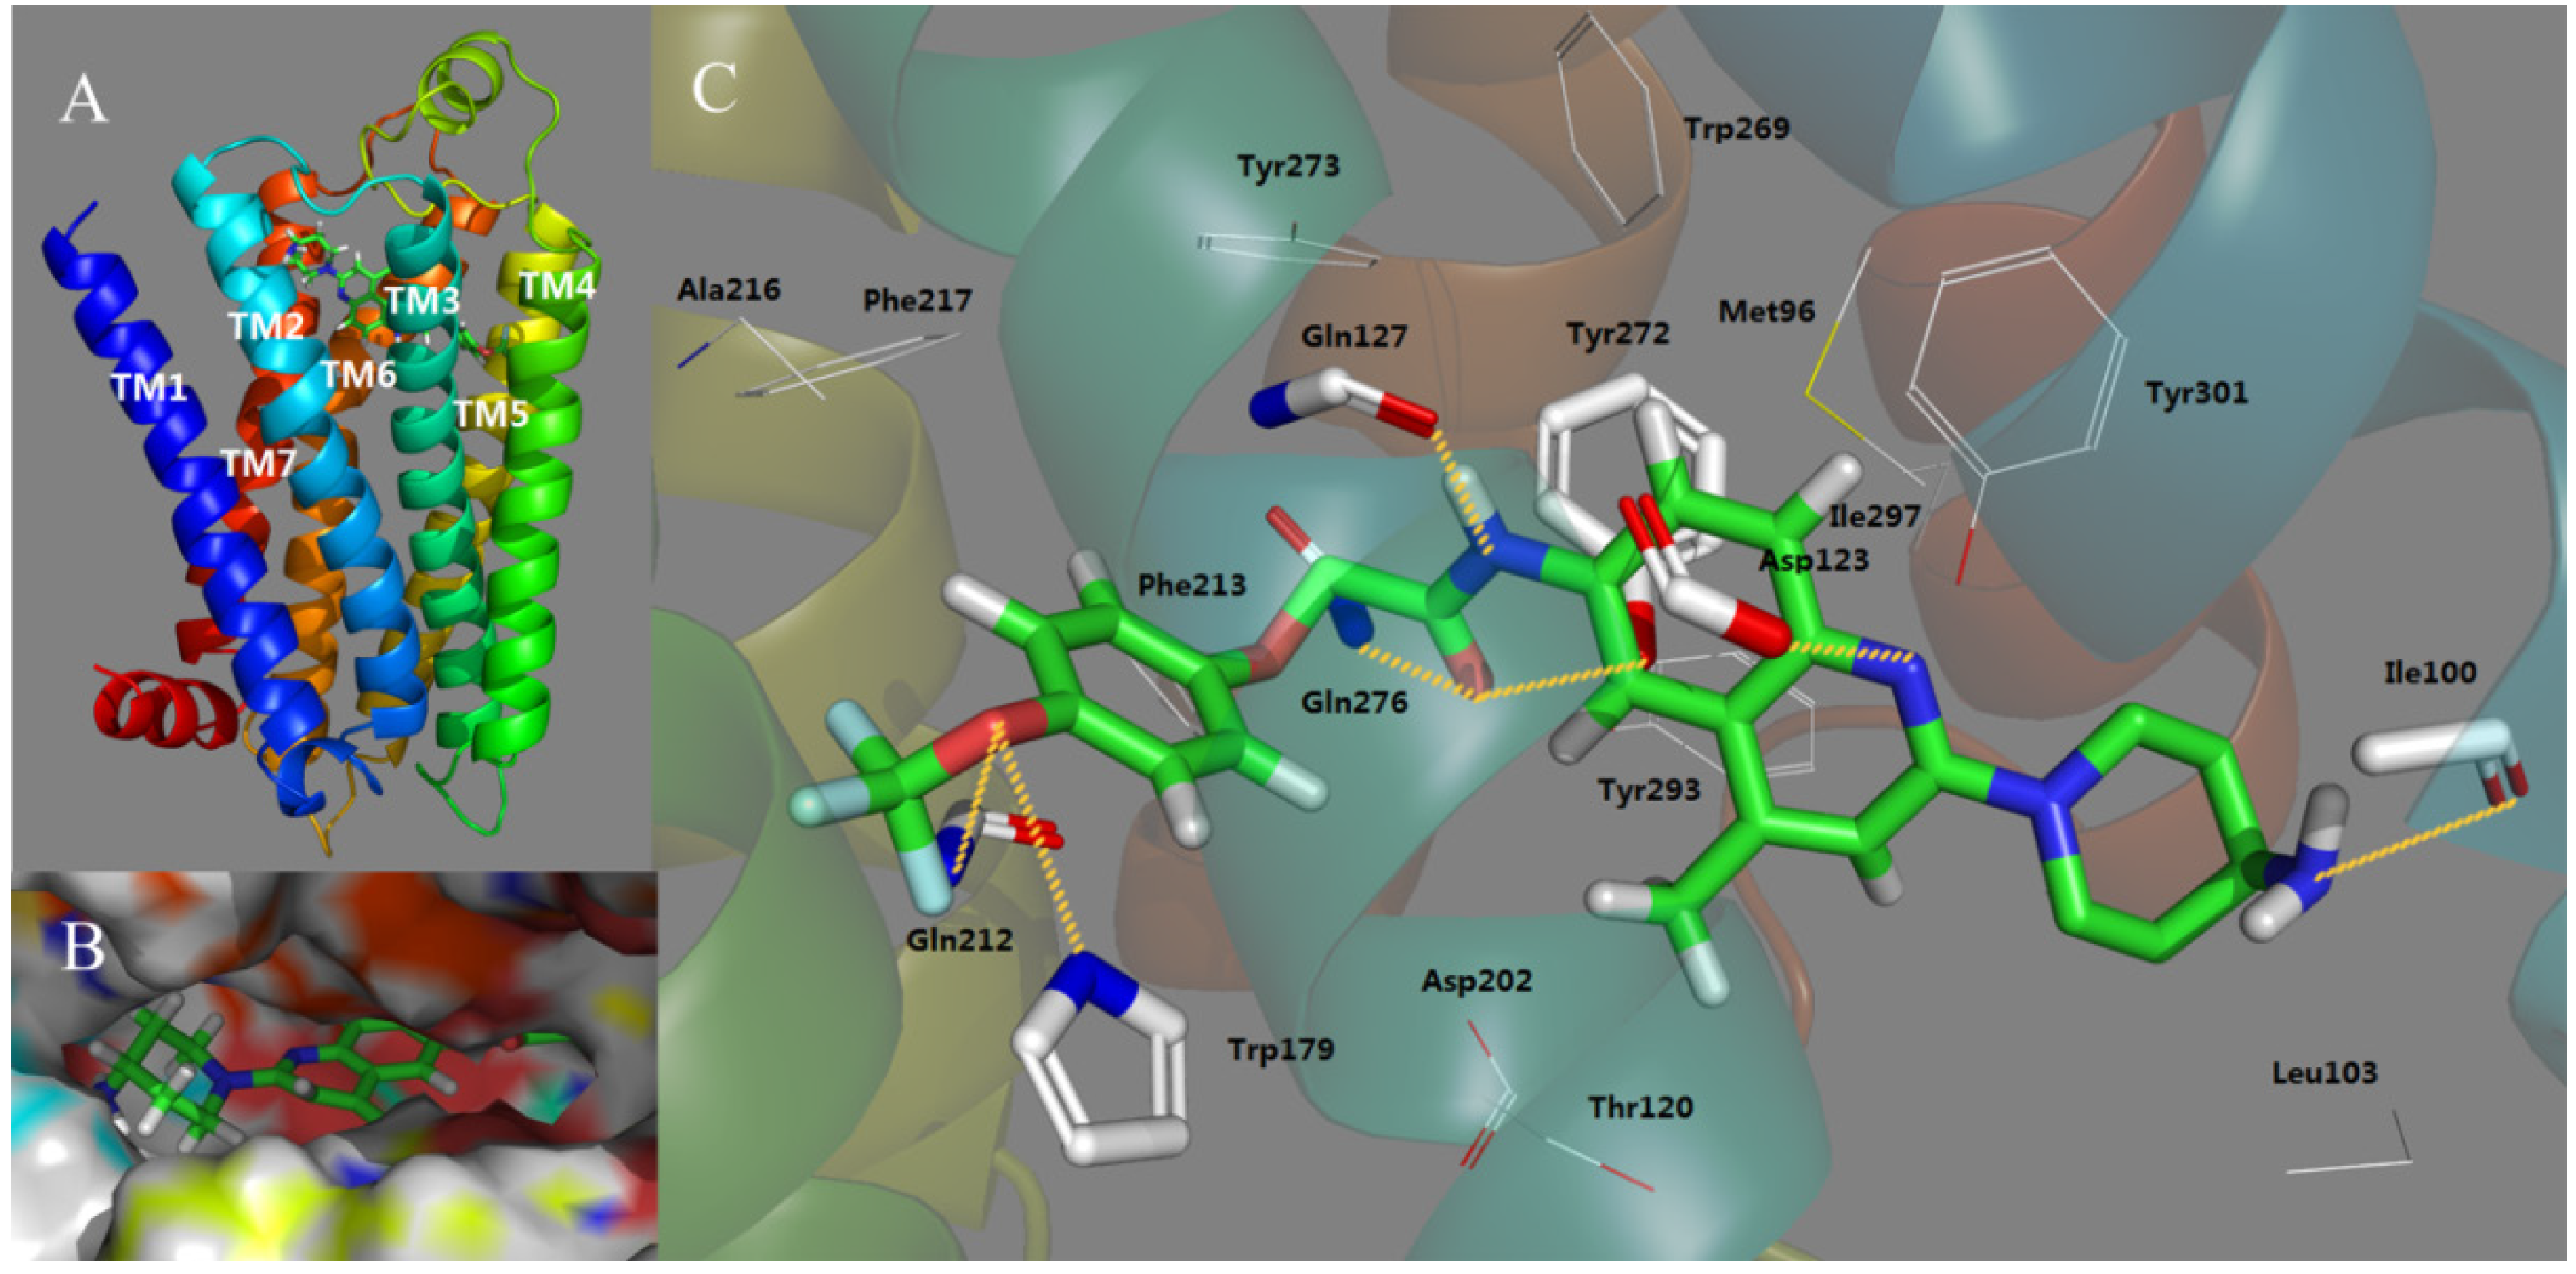
- The most potent Compound 169 fits into the conventional binding pocket P1 and follows the binding mode of Mode I with the ligand owning a central basic nitrogen taking an approximately linear configuration.
- (2)
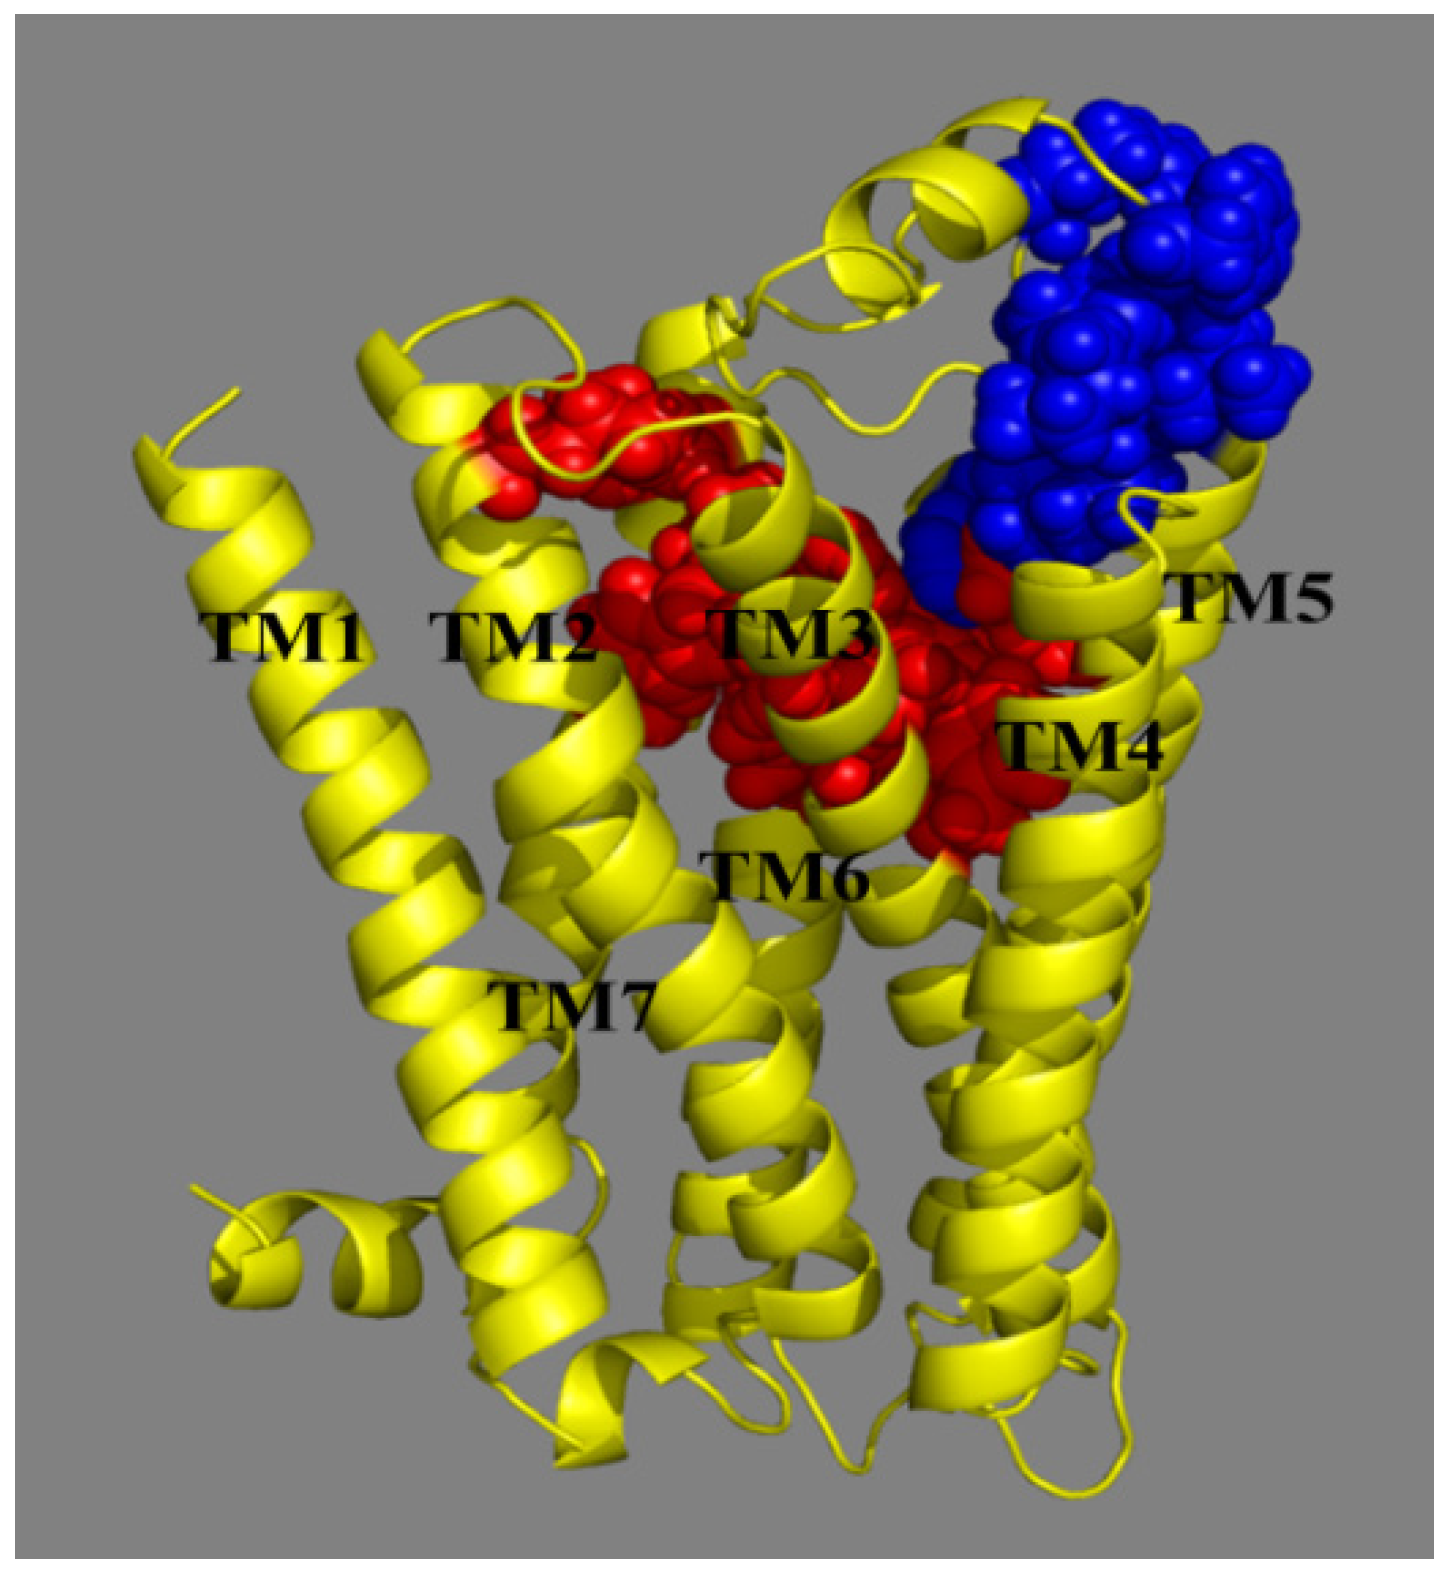
- Two hydrophobic subsites S1 and S2 are observed to compose P1 of MCHR1.
- (3)
- Antagonist 169 forms a conventional interaction of salt bridge with Asp123 and six H-bonds with Gln127, Gln212, Gln276, Tyr272, Trp179 and Ile100. To the best of our knowledge, this is the first time the role of Tyr272 and Ile100 in hydrogen bonds is noticed in the ligand–MCHR1 complex.
- (4)
- In general, a salt bridge with Asp123, several H-bonds with glutamine and at least one hydrophobic pocket are usually involved in the binding of MCHR1 antagonists.
- (5)
- MD analysis processed within a lipid bilayer environment shows similar results to those performed in water.
Supplementary Materials
Supplementary Files
Supplementary File 1Acknowledgments
Author Contributions
Conflicts of Interest
References
- Kopelman, P.G. Obesity as a medical problem. Nature 2002, 404, 635–643. [Google Scholar]
- Ogden, C.L.; Carroll, M.D.; Curtin, L.R.; McDowell, M.A.; Tabak, C.J.; Flegal, K.M. Prevalence of overweight and obesity in the United States, 1999–2004. J. Am. Med. Assoc. 2006, 295, 1549–1555. [Google Scholar]
- Bray, G.A.; Bellanger, T. Epidemiology, trends, and morbidities of obesity and the metabolic syndrome. Endocrine 2006, 29, 109–117. [Google Scholar] [CrossRef]
- Luthin, D.R. Anti-obesity effects of small molecule melanin-concentrating hormone receptor1 (MCHR1) antagonists. Life Sci. 2007, 81, 423–440. [Google Scholar] [CrossRef]
- Hofbauer, K.G.; Nicholson, J.R.; Boss, O. The obesity epidemic: Current and future pharmacological treatments. Annu. Rev. Pharmacol. Toxicol. 2007, 47, 565–592. [Google Scholar] [CrossRef]
- Kawauchi, H.; Kawazoe, I.; Tsubokawa, M.; Kishida, M.; Baker, B. Characterization of melanin-concentrating hormone in chum salmon pituitaries. Nature 1983, 305, 321–323. [Google Scholar]
- Vaughan, J.M.; Fischer, W.H.; Hoeger, C.; River, J.; Vale, W. Characterization of melanin-concentrating hormone from rat hypothalamus. Endocrinology 1989, 125, 1660–1665. [Google Scholar]
- Presse, F.; Nahon, J.L.; Fischer, W.H.; Vale, W. Structure of the human melanin concentrating hormone mRNA. Mol. Endocrinol. 1990, 4, 632–637. [Google Scholar] [CrossRef]
- Elias, C.F.; Saper, C.B.; Maratos-Flier, E.; Tritos, N.A.; Lee, C.; Kelly, J.; Tatro, J.B.; Hoffman, G.E.; Ollmann, M.M.; Barsh, G.S.; et al. Chemically defined projections linking the mediobasal hypothalamus and the lateral hypothalamic area. J. Comp. Neurol. 1998, 402, 442–459. [Google Scholar] [CrossRef]
- Rossi, M.; Beak, S.A.; Choi, S.-J.; Small, C.J.; Morgan, D.G.A.; Ghatei, M.A.; Smith, D.M.; Bloom, S.R. Investigation of the feeding effects of melanin concentrating hormone on food intake-action independent of galanin and the melanocortin receptors. Brain Res. 1999, 846, 164–170. [Google Scholar] [CrossRef]
- Gomori, A.; Ishihara, A.; Ito, M.; Mashiko, S.; Matsushita, H.; Yumoto, M.; Ito, M.; Tanaka, T.; Tokita, S.; Moriya, M.; et al. Chronic intracerebroventricular infusion of MCH causes obesity in mice. Am. J. Physiol. Endocrinol. Metab. 2003, 284, E583–E588. [Google Scholar]
- Shimazaki, T.; Yoshimizu, T.; Chaki, S. Melanin-concentrating hormone MCH1 receptor antagonists. CNS Drugs 2006, 20, 801–811. [Google Scholar] [CrossRef]
- Ludwig, D.S.; Mountjoy, K.G.; Tatro, J.B.; Gillette, J.A.; Frederich, R.C.; Flier, J.S.; Maratos-Flier, E. Melanin-concentrating hormone: A functional melanocortin antagonist in the hypothalamus. Am. J. Physiol. Endocrinol. Metab. 1998, 274, E627–E633. [Google Scholar]
- Ludwig, D.S.; Tritos, N.A.; Mastaitis, J.W.; Kulkarni, R.; Kokkotou, E.; Elmquist, J.; Lowell, B.; Flier, J.S.; Maratos-Flier, E.J. Melanin-concentrating hormone overexpression in transgenic mice leads to obesity and insulin resistance. J. Clin. Investig. 2001, 107, 379–386. [Google Scholar] [CrossRef]
- Shimada, M.; Tritos, N.A.; Lowell, B.B.; Flier, J.S.; Maratos-Flier, E. Mice lacking melanin-concentrating hormone are hypophagic and lean. Nature 1998, 396, 670–674. [Google Scholar] [CrossRef]
- Tana, C.P.; Sanob, H.; Iwaasab, H.; Pana, J.; Sailera, A.W.; Hreniuka, D.L.; Feighnera, S.D.; Palyhaa, O.C.; Ponga, S.-S.; Figueroac, D.J.; et al. Melanin-concentrating hormone receptor subtypes 1 and 2: Species-specific gene expression. Genomics 2002, 79, 785–792. [Google Scholar] [CrossRef]
- Chambers, J.; Ames, R.S.; Bergsma, D.; Muir, A.; Fitzgerald, L.R.; Hervieu, G.; Dytko, G.M.; Foley, J.J.; Martin, J.; Liu, W.-S.; et al. Melanin-concentrating hormone is the cognate ligand for the orphan G-protein-coupled receptor SLC-1. Nature 1999, 400, 261–265. [Google Scholar] [CrossRef]
- Chaki, S.; Funakoshi, T.; Hirota-Okuno, S.; Nishiguchi, M.; Shimazaki, T.; Iijima, M.; Grottick, A.J.; Kanuma, K.; Omodera, K.; Sekiguchi, Y.; et al. Anxiolytic- and antidepressant-like profile of ATC0065 and ATC0175: Nonpeptidic and orally active melanin-concentrating hormone receptor 1 antagonists. J. Pharmacol. Exp. Ther. 2005, 313, 831–839. [Google Scholar]
- Johansson, A. Recent progress in the discovery of melanin-concentrating hormone 1-receptor antagonists. Expert Opin. Ther. Pat. 2011, 21, 905–925. [Google Scholar] [CrossRef]
- Takekawaa, S.; Asamia, A.; Ishiharab, Y.; Terauchib, J.; Katob, K.; Shimomuraa, Y.; Moria, M.; Murakoshic, H.; Katoc, K.; Suzuki, N.; et al. T-226296: A novel, orally active and selective melanin-concentrating hormone receptor antagonist. Eur. J. Pharmacol. 2002, 438, 129–135. [Google Scholar]
- Borowsky, B.; Durkin, M.M.; Ogozalek, K.; Marzabadi, M.R.; DeLeon, J.; Heurich, R.; Lichtblau, H.; Shaposhnik, Z.; Daniewska, I.; Blackburn, T.P.; et al. Antidepressant, anxiolytic and anorectic effects of a melanin-concentrating hormone-1 receptor antagonist. Nat. Med. 2002, 8, 825–830. [Google Scholar]
- Högberg, T.; Frimurer, T.M.; Sasmal, P.K. Melanin concentrating hormone receptor 1 (MCHR1) antagonists—Still a viable approach for obesity treatment? Bioorg. Med. Chem. Lett. 2012, 22, 6039–6047. [Google Scholar] [CrossRef]
- Me´ndez-Andino, J.L.; Wos, J.A. MCH-R1 antagonists: What is keeping most research programs away from the clinic? Drug Discov. Today 2007, 12, 972–979. [Google Scholar] [CrossRef]
- Valentino, M.A.; Lin, J.E.; Waldman, S.A. Central and peripheral molecular targets for antiobesity pharmacotherapy. Clin. Pharm. Ther. 2010, 87, 652–662. [Google Scholar]
- MacNeil, N.J. The role of melanin-concentrating hormone and its receptors in energy homeostasis. Front. Endocrinol. 2013, 4, 1–14. [Google Scholar] [CrossRef]
- Liu, J.; Wang, F.; Ma, Z.; Wang, X.; Wang, Y. Structural determination of three different series of compounds as Hsp90 inhibitors using 3D-QSAR modeling, molecular docking and molecular dynamics methods. Int. J. Mol. Sci. 2011, 12, 946–970. [Google Scholar]
- Yang, H.; Roth, C.M.; Ierapetritou, M.G. A rational design approach for amino acid supplementation in hepatocyte culture. Biotechnol. Bioeng. 2009, 103, 1176–1191. [Google Scholar] [CrossRef]
- Liu, J.; Zhang, H.; Xiao, Z.; Wang, F.; Wang, X.; Wang, Y. Combined 3D-QSAR, molecular docking and molecular dynamics study on derivatives of peptide epoxyketone and tyropeptin-boronic acid as inhibitors against the β5 subunit of human 20S proteasome. Int. J. Mol. Sci. 2011, 12, 1807–1835. [Google Scholar] [CrossRef]
- Sasmal, S.; Balaji, G.; Reddy, H.R.K.; Balasubrahmanyam, D.; Srinivas, G.; Kyasa, S.; Sasmal, P.K.; Khanna, I.; Talwar, R.; Suresh, J.; et al. Design and optimization of quinazoline derivatives as melanin concentrating hormone receptor 1 (MCHR1) antagonists. Bioorg. Med. Chem. Lett. 2012, 22, 3157–3162. [Google Scholar] [CrossRef]
- Sasmal, S.; Balasubrahmanyam, D.; Reddy, H.R.K.; Balaji, G.; Srinivas, G.; Cheera, S.; Abbineni, C.; Sasmal, P.K.; Khanna, I.; Sebastian, V.J.; et al. Design and optimization of quinazoline derivatives as melanin concentrating hormone receptor 1 (MCHR1) antagonists. Bioorg. Med. Chem. Lett. 2012, 22, 3163–3167. [Google Scholar] [CrossRef]
- Ulven, T.; Little, P.B.; Receveur, J.-M.; Frimurer, F.M.; Rist, Ø.; Nørregaard, P.K.; Högberg, T. 6-Acylamino-2-amino-4-methylquinolines as potent melanin-concentrating hormone 1 receptor antagonists: Structure–activity exploration of eastern and western parts. Bioorg. Med. Chem. Lett. 2006, 16, 1070–1075. [Google Scholar] [CrossRef]
- Ulven, T.; Frimurer, T.M.; Receveur, J.-M.; Little, P.B.; Rist, Ø.; Nørregaard, P.K.; Högberg, T. 6-Acylamino-2-aminoquinolines as potent melanin-concentrating hormone 1 receptor antagonists. Identification, structure-activity relationship, and investigation of binding mode. J. Med. Chem. 2005, 48, 5684–5697. [Google Scholar] [CrossRef]
- Ke, Y.-Y.; Shiao, H.-Y.; Hsu, Y. C.; Chu, C.-Y.; Wang, W.-C.; Lee, Y.-C.; Lin, W.-H.; Chen, C.-H.; Hsu, J.T.A.; Chang, C.-W.; et al. 3D-QSAR-assisted drug design: Identification of a potent quinazoline-based aurora kinase inhibitor. Chem. Med. Chem. 2013, 8, 136–148. [Google Scholar]
- Bolden, S.; Boateng, C.A.; Zhu, X.Y.; Etukala, J.R.; Eyunni, S.K.; Jacobb, M.R.; Khan, S.I.; Ablordeppey, S.Y. CoMFA studies and in vitro evaluation of some 3-substituted benzylthio quinolinium salts as anticryptococcal agents. Bioorg. Med. Chem. 2013, 21, 7194–7201. [Google Scholar]
- Böhm, M.; Stürzebecher, J.; Klebe, G. Three-dimensional quantitative structure-activity relationship analyses using comparative molecular field analysis and comparative molecular similarity indices analysis to elucidate selectivity differences of inhibitors binding to trypsin, thrombin, and factor Xa. J. Med. Chem. 1999, 42, 458–477. [Google Scholar] [CrossRef]
- Bringmann, G.; Rummey, C. 3D QSAR investigations on antimalarial naphthylisoquinoline alkaloids by comparative molecular similarity indices analysis (CoMSIA), based on different alignment approaches. J. Chem. Inf. Comput. Sci. 2003, 43, 304–316. [Google Scholar]
- Da, C.; Mooberry, S.L.; Gupton, J.T.; Kellogg, G.E. How to deal with low-resolution target structures: Using SAR, ensemble docking, hydropathic analysis, and 3D-QSAR to definitively map the αβ-tubulin colchicine site. J. Med. Chem. 2013, 56, 7382–7395. [Google Scholar]
- Tavares, F.X.; Al-Barazanji, K.A.; Bigham, E.C.; Bishop, M.J.; Britt, C.S.; Carlton, D.L.; Feldman, P.L.; Goetz, A.S.; Grizzle, M.K.; Guo, Y.C.; et al. Potent, selective, and orally efficacious antagonists of melanin-concentrating hormone receptor 1. J. Med. Chem. 2006, 49, 7095–7107. [Google Scholar] [CrossRef]
- Helal, M.A.; Chittiboyina, A.G.; Avery, M.A. New insights into the binding mode of melanin concentrating hormone receptor-1 antagonists: Homology modeling and explicit membrane molecular dynamics simulation study. J. Chem. Inf. Model. 2011, 51, 635–646. [Google Scholar] [CrossRef]
- Dixon, R.A.F.; Sigal, I.S.; Strader, C.D. Structure-function analysis of the β-adrenergic receptor. Cold Spring Harb. Symp. Quant. Biol. 1988, 53, 487–497. [Google Scholar] [CrossRef]
- Macdonald, D.; Murgolo, N.; Zhang, R.; Durkin, J.P.; Yao, X.; Strader, C.D.; Graziano, M.P. Molecular characterization of the melanin concentrating hormone/receptor complex: Identification of critical residues involved in binding and activation. Mol. Pharmacol. 2000, 58, 217–225. [Google Scholar]
- Clark, D.E.; Higgs, C.; Wren, S.P.; Dyke, H.J.; Wong, M.; Norman, D.; Lockey, P.M.; Roach, A.G. A virtual screening approach to finding novel and potent antagonists at the melanin-concentrating hormone 1 receptor. J. Med. Chem. 2004, 47, 3962–3971. [Google Scholar] [CrossRef]
- Cirauqui, N.; Schrey, A.K.; Galiano, S.; Ceras, J.; Pérez-Silanes, S.; Aldana, I.; Monge, A.; Kühne, R. Building a MCHR1 homology model provides insight into the receptor-antagonist contacts that are important for the development of new anti-obesity agents. Bioorg. Med. Chem. 2010, 18, 7365–7379. [Google Scholar]
- Shahlaeia, M.; Madadkar-Sobhani, A.; Mahnam, K.; Fassihi, A.; Saghaie, L.; Mansourian, M. Homology modeling of human CCR5 and analysis of its binding properties through molecular docking and molecular dynamics simulation. Biochim. Biophys. Acta 2011, 1808, 802–817. [Google Scholar]
- Van Vlijmen, H.W.T.; Schaefer, M.; Karplus, M. Improving the accuracy of protein pKa calculations: Conformational averaging versus the average structure. Proteins 1998, 33, 145–158. [Google Scholar]
- Witty, D.R.; Bateson, J.H.; Hervieu, G.J.; Jeffrey, P.; Johnson, C.N.; Muir, A.I.; O’Hanlon, P.J.; Stemp, G.; Stevens, A.J.; Thewlis, K.M.; et al. SAR of biphenyl carboxamide ligands of the human melanin-concentrating hormone receptor 1 (MCHR1): Discovery of antagonist SB-568849. Bioorg. Med. Chem. Lett. 2006, 16, 4865–5871. [Google Scholar] [CrossRef]
- Giordanetto, F.; Karlsson, O.; Lindberg, J.; Larsson, L.-O.; Linusson, A.; Evertsson, E.; Morgan, D.G.A.; Inghardt, T. Discovery of cyclopentane- and cyclohexane-trans-1,3-diamines as potent melanin-concentrating hormone receptor 1 antagonists. Bioorg. Med. Chem. Lett. 2007, 17, 4232–4241. [Google Scholar] [CrossRef]
- Cavasotto, C.N.; Orry, A.J.W.; Murgolo, N.J.; Czarniecki, M.F.; Kocsi, S.A.; Hawes, B.E.; O’Neill, K.A.; Hine, H.; Burton, M.S.; Voigt, J.H.; et al. Discovery of novel chemotypes to a G-protein-coupled receptor through ligand-steered homology modeling and structure-based virtual screening. J. Med. Chem. 2008, 51, 581–588. [Google Scholar] [CrossRef]
- Abu-Hammad, A.; Zalloum, W.A.; Zalloum, H.; Abu-Sheikha, G.; Taha, M.O. Homology modeling of MCH1 receptor and validation by docking/scoring and protein-aligned CoMFA. Eur. J. Med. Chem. 2009, 44, 2583–2596. [Google Scholar] [CrossRef]
- Sasmal, P.K.; Sasmal, S.; Rao, P.T.; Venkatesham, B.; Roshaiah, M.; Abbineni, C.; Khanna, I.; Jadhav, V.P.; Suresh, J.; Talwar, R.; et al. Discovery of novel, orally available benzimidazoles as melanin concentrating hormone receptor 1 (MCHR1) antagonists. Bioorg. Med. Chem. Lett. 2010, 20, 5443–5448. [Google Scholar] [CrossRef]
- Kamata, M.; Yamashita, T.; Imaeda, T.; Tanaka, T.; Terauchi, J.; Miyamoto, M.; Ora, T.; Tawada, M.; Endo, S.; Takekawa, S.; et al. Discovery, synthesis, and structure–activity relationship of 6-aminomethyl-7,8-dihydronaphthalenes as human melanin-concentrating hormone receptor 1 antagonists. Bioorg. Med. Chem. 2011, 19, 5539–5552. [Google Scholar] [CrossRef]
- Clark, M.; Cramer, R.D.; Vanopdenbosch, N. Validation of the general purpose tripos 5.2 force field. J. Comput. Chem. 1989, 10, 982–1012. [Google Scholar]
- Gasteiger, J.; Marsili, M. Iterative partial equalization of orbital electronegativity-a rapid access to atomic charges. Tetrahedron 1980, 36, 3219–3228. [Google Scholar] [CrossRef]
- Wei, S.; Ji, Z.; Zhang, H.; Zhang, J.; Wang, Y.; Wu, W. Isolation, biological evaluation and 3D-QSAR studies of insecticidal/narcotic sesquiterpene polyol esters. J. Mol. Model. 2011, 17, 681–693. [Google Scholar]
- Chang, H.-W.; Chung, F.-S.; Yang, C.-N. Molecular modeling of p38αmitogen-activated protein kinase inhibitors through 3D-QSAR and molecular dynamics simulations. J. Chem. Inf. Model. 2013, 53, 1775–1786. [Google Scholar] [CrossRef]
- Lan, P.; Chen, W.-N.; Chen, W.-M. Molecular modeling studies on imidazo (4,5-b)pyridine derivatives as Aurora A kinase inhibitors using 3D-QSAR and docking approaches. Eur. J. Med. Chem. 2011, 46, 77–94. [Google Scholar]
- Pérez-Villanueva, J.; Medina-Franco, J.L.; Caulfield, T.R.; Hernández-Campos, A.; Hernández-Luis, F.; Yépez-Mulia, L.; Castillo, R. Comparative molecularfield analysis (CoMFA) and comparative molecular similarity indices analysis (CoMSIA) of some benzimidazole derivatives with trichomonicidal activity. Eur. J. Med. Chem. 2011, 46, 3499–3508. [Google Scholar] [CrossRef]
- Li, X.; Ye, L.; Wang, X.; Wang, X.; Liu, H.; Qian, X.; Zhu, Y.; Yu, H. Molecular docking, molecular dynamics simulation, and structure-based 3D-QSAR studies on estrogenic activity of hydroxylated polychlorinated biphenyls. Sci. Total Environ. 2012, 441, 230–238. [Google Scholar] [CrossRef]
- Mouchlis, V.D.; Melagraki, G.; Mavromoustakos, T.; Kollias, G.; Afantitis, A. Molecular modelingon pyrimidine-urea inhibitors of TNF-α production: An integrated approach using a combination of molecular docking, classification techniques, and 3D-QSAR CoMSIA. J. Chem. Inf. Model. 2012, 52, 711–723. [Google Scholar] [CrossRef]
- Jain, E.; Bairoch, A.; Duvaud, S.; Phan, I.; Redaschi, N.; Suzek, B.E.; Martin, M.J.; McGarvey, P.; Gasteiger, E. Infrastructure for the life sciences: design and implementation of the UniProt website. BMC Bioinform. 2009, 10, 1–19. [Google Scholar]
- Cherezov, V.; Rosenbaum, D.M.; Hanson, M.A.; Rasmussen, S.G.; Thian, F.S.; Kobilka, T.S.; Choi, H.J.; Kuhn, P.; Weis, W.I.; Kobilka, B.K.; et al. GPCR engineering yields high-resolution structural insights into β2-adrenergic receptor function. Science 2007, 318, 1266–1273. [Google Scholar]
- Bordoli, L.; Kiefer, F.; Arnold, K.; Benkert, P.; Battey, J.; Schwede, T. Protein structure homology modeling using SWISS-MODEL workspace. Nat. Protoc. 2009, 4, 1–13. [Google Scholar]
- Verdonk, M.L.; Cole, J.C.; Hartshorn, M.J.; Murray, C.W.; Taylor, R.D. Improved protein–ligand docking using GOLD. Proteins 2003, 52, 609–623. [Google Scholar]
- Tuccinardi, T.; Botta, M.; Giordano, A.; Martinelli, A. Protein kinases: Docking and homology modeling reliability. J. Chem. Inf. Model. 2010, 50, 1432–1441. [Google Scholar] [CrossRef]
- Arooj, M.; Sakkiah, S.; Kim, S.; Arulalapperumal, V.; Lee, K.W. A combination of receptor-based pharmacophore modeling & QM techniques for identification of human chymase inhibitors. PLoS One 2013, 8, e63030. [Google Scholar]
- Karplus, M.; McCammon, J.A. Molecular dynamics simulations of biomolecules. Nat. Struct. Biol. 2002, 9, 646–652. [Google Scholar] [CrossRef]
- Spoel, D.V.D.; Lindahl, E.; Hess, B.; Groenhof, G.; Mark, A.E.; Berendsen, H.J.C. GROMACS: Fast, flexible, and free. J. Comput. Chem. 2005, 26, 1701–1718. [Google Scholar] [CrossRef]
- Schüttelkopf, A.W.; van Aalten, D.M.F. PRODRG: A tool for high-throughput crystallography of protein-ligand complexes. Acta Crystallogr. 2004, D60, 1355–1363. [Google Scholar]
- Berendsen, H.J.C.; Postma, J.P.M.; Van Gunsteren, W.F.; Hermans, J. Interaction models for water in relation to protein hydration. In Intermolecular Forces; Springer Netherlands: Berlin, Germeny, 1981; Volume 14, pp. 331–342. [Google Scholar]
- Lindahl, E.; Hess, B.; Spoel, D.V.D. GROMACS 3.0: A package for molecular simulation and trajectory analysis. J. Mol. Model. 2001, 7, 306–317. [Google Scholar]
- Lin, J.-H.; Perryman, A. L.; Schames, J. R.; McCammon, J. A. Computational drug design accommodating receptor flexibility: The relaxed complex scheme. J. Am. Chem. Soc. 2002, 124, 5632–5633. [Google Scholar] [CrossRef]
- Ren, S.; Sato, R.; Hasegawa, K.; Ohta, H.; Masuda, S. A predicted structure for the PixD−PixE complex determined by homology modeling, docking simulations, and a mutagenesis study. Biochemistry 2013, 52, 1272–1279. [Google Scholar]
- Parrinello, M.; Rahman, A. Polymorphic transitions in single crystals: A new molecular dynamics method. J. Appl. Phys. 1981, 52, 7182–7190. [Google Scholar] [CrossRef]
- Skelton, A.A.; Maharaj, Y.R.; Soliman, M.E.S. Target-bound generated pharmacophore model to improve the pharmacophore-based virtual screening: Identification of G-protein coupled human CCR2 receptors inhibitors as anti-Inflammatory drugs. Cell. Mol. Bioeng. 2014, 7, 45–57. [Google Scholar] [CrossRef]
- Jo, S.; Kim, T.; Im, W. Automated builder and database of protein/membrane complexes for molecular dynamics simulations. PLoS One 2007, 9, e880. [Google Scholar]
© 2014 by the authors; licensee MDPI, Basel, Switzerland. This article is an open access article distributed under the terms and conditions of the Creative Commons Attribution license (http://creativecommons.org/licenses/by/3.0/).
Share and Cite
Wu, M.; Li, Y.; Fu, X.; Wang, J.; Zhang, S.; Yang, L. Profiling the Interaction Mechanism of Quinoline/Quinazoline Derivatives as MCHR1 Antagonists: An in Silico Method. Int. J. Mol. Sci. 2014, 15, 15475-15502. https://doi.org/10.3390/ijms150915475
Wu M, Li Y, Fu X, Wang J, Zhang S, Yang L. Profiling the Interaction Mechanism of Quinoline/Quinazoline Derivatives as MCHR1 Antagonists: An in Silico Method. International Journal of Molecular Sciences. 2014; 15(9):15475-15502. https://doi.org/10.3390/ijms150915475
Chicago/Turabian StyleWu, Mingwei, Yan Li, Xinmei Fu, Jinghui Wang, Shuwei Zhang, and Ling Yang. 2014. "Profiling the Interaction Mechanism of Quinoline/Quinazoline Derivatives as MCHR1 Antagonists: An in Silico Method" International Journal of Molecular Sciences 15, no. 9: 15475-15502. https://doi.org/10.3390/ijms150915475
APA StyleWu, M., Li, Y., Fu, X., Wang, J., Zhang, S., & Yang, L. (2014). Profiling the Interaction Mechanism of Quinoline/Quinazoline Derivatives as MCHR1 Antagonists: An in Silico Method. International Journal of Molecular Sciences, 15(9), 15475-15502. https://doi.org/10.3390/ijms150915475