Polymorphism of the Flap Endonuclease 1 Gene in Keratoconus and Fuchs Endothelial Corneal Dystrophy


Abstract
:1. Introduction
2. Results
2.1. Characteristics of Study Subjects

| Feature | Controls (n = 322) | KC (n = 279) | p | FECD (n = 225) | p | |||
|---|---|---|---|---|---|---|---|---|
| Number | Frequency | Number | Frequency | Number | Frequency | |||
| Sex | ||||||||
| Females | 205 | 0.64 | 84 | 0.30 | <0.001 | 172 | 0.76 | 0.002 |
| Males | 117 | 0.36 | 195 | 0.70 | 53 | 0.24 | ||
| Age | ||||||||
| Mean ± SD | 63.78 ± 18.82 | 36.33 ± 12.08 | <0.001 * | 70.52 ± 9.81 | <0.001 * | |||
| Range | 19–100 | 14–68 | 37–91 | |||||
| Smoking | ||||||||
| Yes (current/former) | 107 | 0.33 | 88 | 0.32 | 0.724 | 78 | 0.35 | 0.797 |
| Never | 215 | 0.67 | 191 | 0.68 | 147 | 0.65 | ||
| KC/FECD in family | ||||||||
| Yes | 9 | 0.03 | 31 | 0.11 | 0.001 | 36 | 0.16 | <0.001 |
| No | 313 | 0.97 | 248 | 0.89 | 189 | 0.84 | ||
| BMI | ||||||||
| ≤25 | 130 | 0.41 | 127 | 0.45 | 0.469 | 93 | 0.41 | 0.939 |
| 25–30 | 114 | 0.35 | 91 | 0.33 | 77 | 0.34 | ||
| ≥30 | 78 | 0.24 | 61 | 0.22 | 55 | 0.25 | ||
| Visual impairment | ||||||||
| Yes | 103 | 0.32 | 195 | 0.70 | <0.001 | 123 | 0.55 | <0.001 |
| No | 219 | 0.68 | 84 | 0.30 | 102 | 0.44 | ||
| Allergies | ||||||||
| Yes | 40 | 0.12 | 77 | 0.28 | <0.001 | 40 | 0.18 | 0.105 |
| No | 282 | 0.88 | 202 | 0.72 | 185 | 0.82 | ||
| Heart and vascular diseases | ||||||||
| Yes | 177 | 0.55 | 58 | 0.21 | <0.001 | 130 | 0.58 | 0.573 |
| No | 145 | 0.45 | 221 | 0.79 | 95 | 0.42 | ||
2.2. Relationship between Age, Sex, Tobacco Smoking, Co-Occurrence of Visual Disturbances, BMI, Heart and Vascular Diseases, Allergies and KC/FECD in Family and the Risk of KC/FECD Independent of Genotype
| Characteristics | Controls | KC | OR (95% CI) | p | ||
|---|---|---|---|---|---|---|
| Number | Frequency | Number | Frequency | |||
| Sex | ||||||
| Females | 205 | 0.64 | 84 | 0.30 | 0.25 (0.17–0.35) | <0.001 |
| Males | 117 | 0.36 | 195 | 0.70 | 4.07 (2.89–5.72) | <0.001 |
| Age | 63.78 ± 18.82 | 36.33 ± 12.08 | 0.91 (0.90–0.93) | <0.001 | ||
| Smoking | ||||||
| Yes (current/former) | 107 | 0.33 | 88 | 0.32 | 0.94 (0.66–1.32) | 0.710 |
| Never | 215 | 0.67 | 191 | 0.68 | 1.07 (0.76–1.50) | 0.710 |
| KC in family | ||||||
| Yes | 6 | 0.02 | 31 | 0.11 | 6.52 (2.68–15.89) | <0.001 |
| No | 316 | 0.98 | 248 | 0.89 | 0.15 (0.06–0.37) | <0.001 |
| BMI | ||||||
| ≤25 | 130 | 0.41 | 127 | 0.45 | 1.23 (0.89–1.70) | 0.219 |
| 25–30 | 114 | 0.35 | 91 | 0.33 | 0.88 (0.63–1.24) | 0.470 |
| ≥30 | 78 | 0.24 | 61 | 0.22 | 0.88 (0.60–1.30) | 0.529 |
| Visual impairment | ||||||
| Yes | 103 | 0.32 | 195 | 0.70 | 4.87 (3.43–6.91) | <0.001 |
| No | 219 | 0.68 | 84 | 0.30 | 0.20 (0.14–0.29) | <0.001 |
| Allergies | ||||||
| Yes | 40 | 0.12 | 77 | 0.28 | 2.62 (1.72–3.99) | <0.001 |
| No | 282 | 0.88 | 202 | 0.72 | 0.38 (0.25–0.58) | <0.001 |
| Heart and vascular diseases | ||||||
| Yes | 177 | 0.55 | 58 | 0.21 | 0.22 (0.15–0.31) | <0.001 |
| No | 145 | 0.45 | 221 | 0.79 | 4.63 (3.22–6.66) | <0.001 |
| Characteristics | Controls | FECD | OR (95% CI) | p | ||
|---|---|---|---|---|---|---|
| Number | Frequency | Number | Frequency | |||
| Sex | ||||||
| Females | 205 | 0.64 | 172 | 0.76 | 1.85 (1.26–2.71) | 0.002 |
| Males | 117 | 0.36 | 53 | 0.24 | 0.54 (0.37–0.79) | 0.002 |
| Age | 63.78 ± 18.82 | 70.52 ± 9.81 | 1.03 (1.01–1.04) | <0.001 | ||
| Smoking | ||||||
| Yes (current/former) | 107 | 0.33 | 78 | 0.35 | 1.08 (0.75–1.55) | 0.682 |
| Never | 215 | 0.67 | 147 | 0.65 | 0.93 (0.65–1.33) | 0.682 |
| FECD in family | ||||||
| Yes | 3 | 0.01 | 36 | 0.16 | 20.54 (6.24–67.65) | <0.001 |
| No | 319 | 0.99 | 189 | 0.84 | 0.04 (0.01–0.16) | <0.001 |
| BMI | ||||||
| ≤25 | 130 | 0.41 | 93 | 0.41 | 1.04 (0.73–1.47) | 0.827 |
| 25–30 | 114 | 0.35 | 77 | 0.34 | 0.94 (0.65–1.34) | 0.724 |
| ≥30 | 78 | 0.24 | 55 | 0.25 | 1.03 (0.69–1.53) | 0.886 |
| Visual impairment | ||||||
| Yes | 103 | 0.32 | 123 | 0.55 | 3.16 (2.21–4.53) | <0.001 |
| No | 219 | 0.68 | 102 | 0.44 | 0.32 (0.22–0.45) | <0.001 |
| Allergies | ||||||
| Yes | 40 | 0.12 | 40 | 0.18 | 1.56 (0.97–2.51) | 0.068 |
| No | 282 | 0.88 | 185 | 0.82 | 0.64 (0.40–1.03) | 0.068 |
| Heart and vascular diseases | ||||||
| Yes | 177 | 0.55 | 130 | 0.58 | 1.14 (0.81–1.62) | 0.441 |
| No | 145 | 0.45 | 95 | 0.42 | 0.87 (0.62–1.23) | 0.441 |
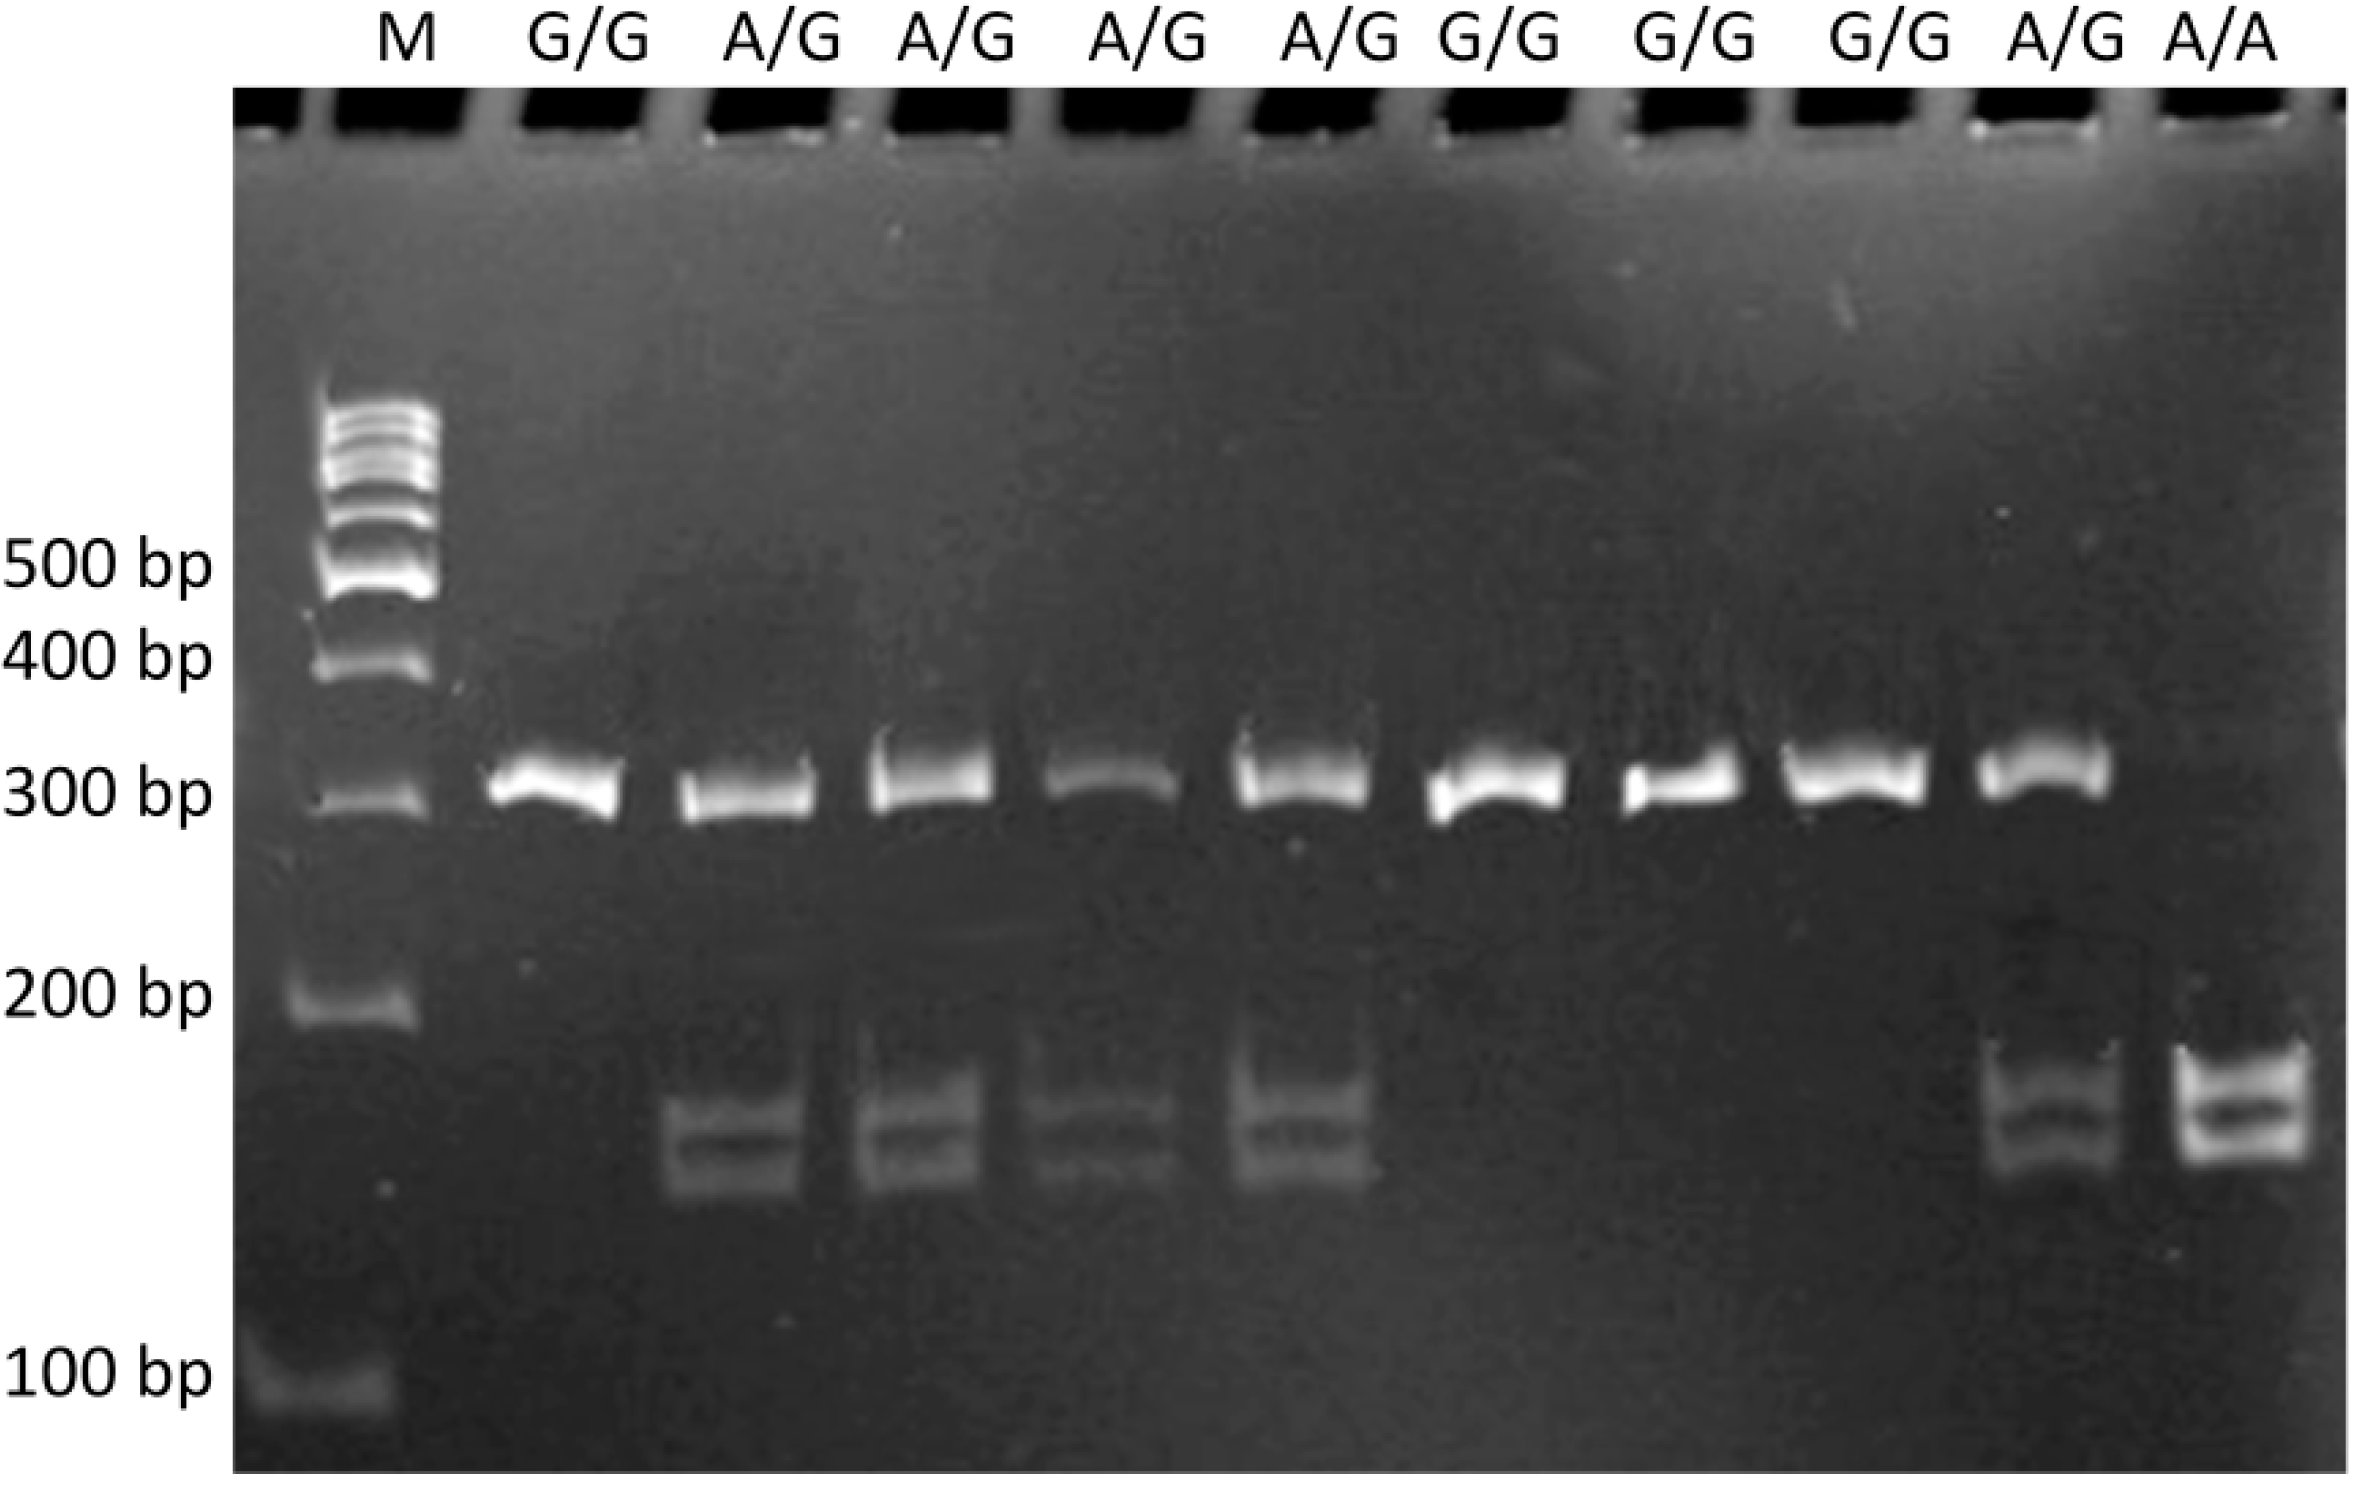
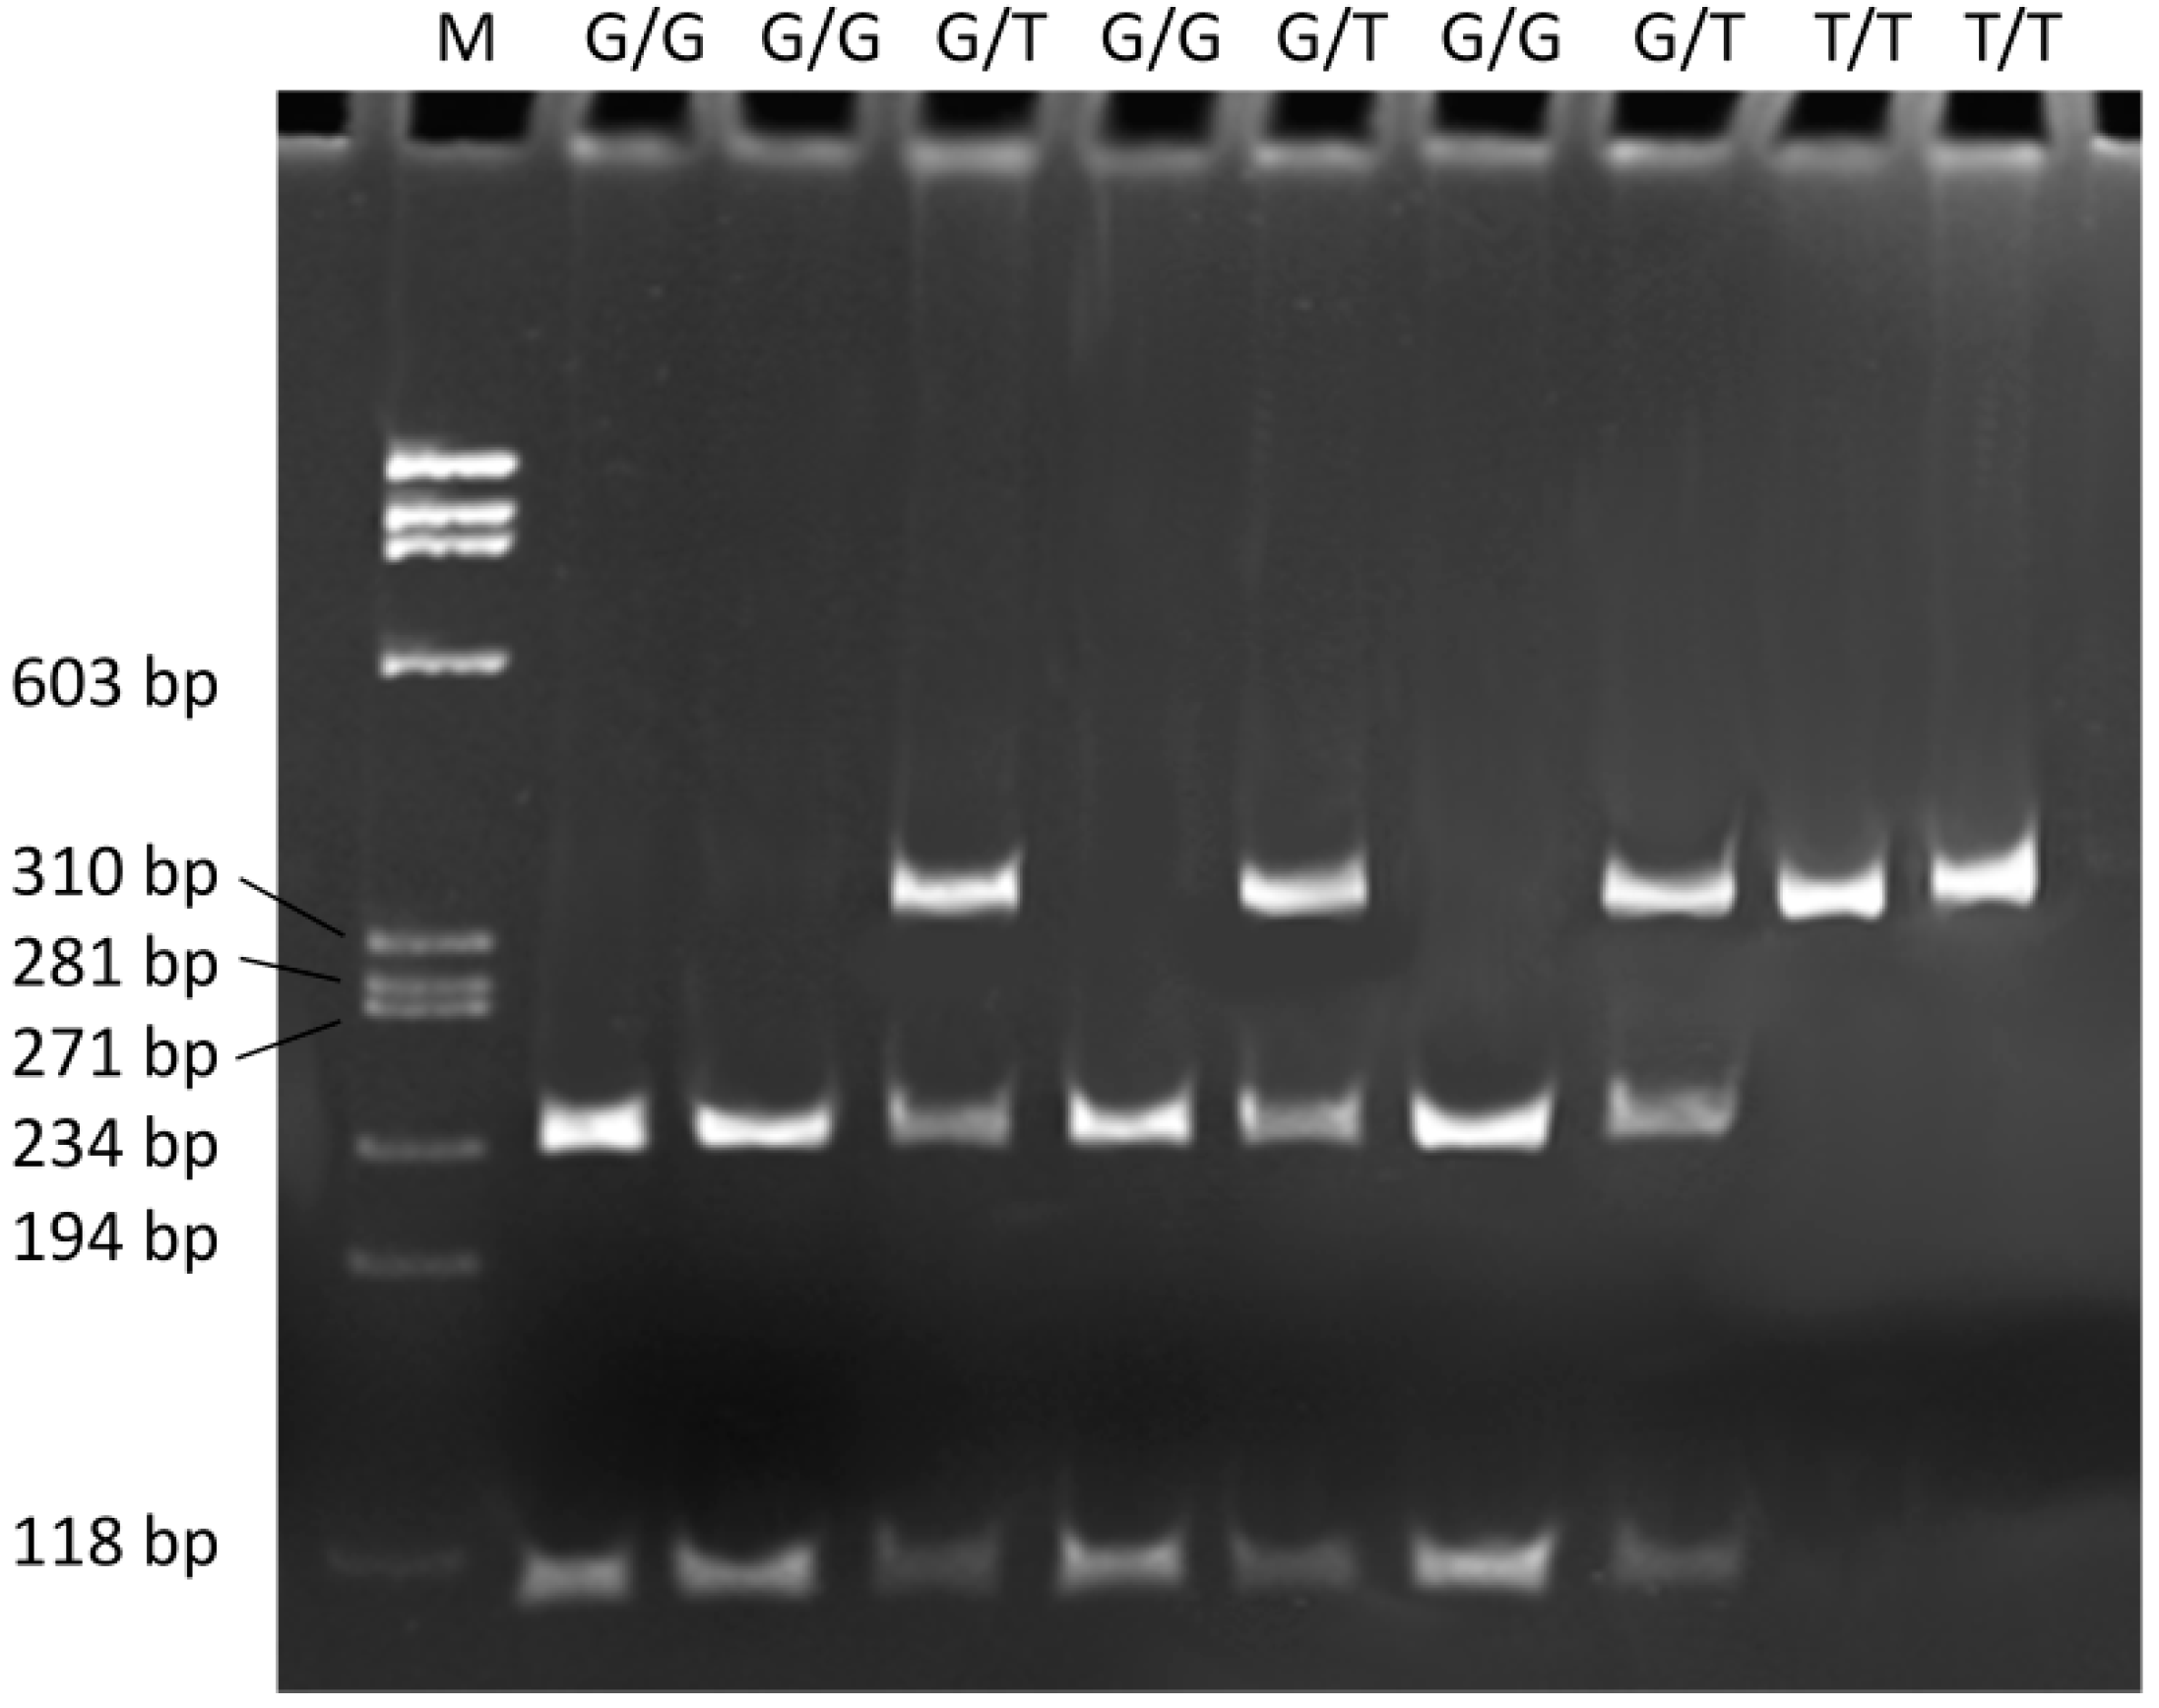
2.3. The c.–441G>A and the g.61564299G>T Polymorphisms of the FEN1 Gene and KC/FECD Occurrence
| Polymorphism Genotype/Allele | Controls (n = 322) | KC (n = 279) | Crude OR (95% CI) | p | Adjusted OR a (95% CI) | p | ||
|---|---|---|---|---|---|---|---|---|
| Number | Frequency | Number | Frequency | |||||
| c.-441G>A | ||||||||
| A/A | 17 | 0.05 | 17 | 0.06 | 1.16 (0.58–2.33) | 0.667 | 1.28 (0.38–4.25) | 0.689 |
| A/G | 178 | 0.55 | 161 | 0.58 | 1.10 (0.80–1.52) | 0.550 | 0.64 (0.40–1.05) | 0.079 |
| G/G | 127 | 0.39 | 101 | 0.36 | 0.87 (0.63–1.21) | 0.414 | 1.52 (0.92–2.51) | 0.104 |
| χ2 = 0.745; p = 0.6891 | ||||||||
| A | 212 | 0.33 | 195 | 0.35 | 1.13 (0.85–1.49) | 0.390 | 0.75 (0.49–1.16) | 0.200 |
| G | 432 | 0.67 | 363 | 0.65 | 0.88 (0.67–1.17) | 0.390 | 1.33 (0.86–2.06) | 0.200 |
| g.61564299G>T | ||||||||
| G/G | 149 | 0.46 | 106 | 0.38 | 0.71 (0.51–0.99) | 0.042 | 0.96 (0.59–1.55) | 0.860 |
| G/T | 157 | 0.49 | 141 | 0.51 | 1.07 (0.78–1.48) | 0.663 | 0.74 (0.46–1.20) | 0.219 |
| T/T | 16 | 0.05 | 32 | 0.11 | 2.48 (1.33–4.62) | 0.004 | 5.15 (1.69–15.67) | 0.004 |
| χ2 = 10.420; p = 0.0055 | ||||||||
| G | 455 | 0.71 | 353 | 0.63 | 0.68 (0.52–0.88) | 0.004 | 0.76 (0.51–1.14) | 0.185 |
| T | 189 | 0.29 | 205 | 0.37 | 1.47 (1.13–1.91) | 0.004 | 1.31 (0.88–1.96) | 0.185 |
| Polymorphism Genotype/Allele | Controls (n = 322) | FECD (n = 225) | Crude OR (95% CI) | p | Adjusted OR a (95% CI) | p | ||
|---|---|---|---|---|---|---|---|---|
| Number | Frequency | Number | Frequency | |||||
| c.-441G>A | ||||||||
| A/A | 17 | 0.05 | 12 | 0.05 | 1.01 (0.47–2.16) | 0.978 | 1.20 (0.47–3.07) | 0.706 |
| A/G | 178 | 0.55 | 101 | 0.45 | 0.66 (0.47–0.93) | 0.017 | 0.73 (0.48–1.10) | 0.134 |
| G/G | 127 | 0.39 | 112 | 0.50 | 1.52 (1.08–2.15) | 0.017 | 1.33 (0.88–2.00) | 0.179 |
| χ2 = 6.043; p = 0.0487 | ||||||||
| A | 212 | 0.33 | 125 | 0.28 | 0.74 (0.55–0.99) | 0.044 | 0.83 (0.58–1.19) | 0.312 |
| G | 432 | 0.67 | 325 | 0.72 | 1.35 (1.01–1.82) | 0.044 | 1.20 (0.84–1.71) | 0.312 |
| g.61564299G>T | ||||||||
| G/G | 149 | 0.46 | 106 | 0.47 | 1.03 (0.73–1.45) | 0.847 | 0.96 (0.64–1.45) | 0.859 |
| G/T | 157 | 0.49 | 98 | 0.44 | 0.81 (0.57–1.14) | 0.230 | 0.84 (0.55–1.26) | 0.349 |
| T/T | 16 | 0.05 | 21 | 0.09 | 1.97 (1.01–3.86) | 0.049 | 2.25 (1.01–5.00) | 0.047 |
| χ2 = 4.519; p = 0.1040 | ||||||||
| G | 455 | 0.71 | 310 | 0.69 | 0.91 (0.69–1.20) | 0.508 | 0.85 (0.61–1.18) | 0.329 |
| T | 189 | 0.29 | 140 | 0.31 | 1.10 (0.83–1.45) | 0.508 | 1.18 (0.85–1.64) | 0.329 |
| 17 | 0.05 | |||||||
2.4. Haplotypes and KC/FECD Occurrence
| Haplotype | Controls (n = 322) | KC (n = 279) | OR (95% CI) | p | FECD (n = 225) | OR (95% CI) | p | |||
|---|---|---|---|---|---|---|---|---|---|---|
| Number | Frequency | Number | Frequency | Number | Frequency | |||||
| AG | 221 | 0.17 | 178 | 0.16 | 1.09 (0.88–1.35) | 0.427 | 110 | 0.12 | 1.49 (1.16–1.90) | 0.002 |
| AT | 203 | 0.16 | 212 | 0.19 | 0.79 (0.65–0.99) | 0.036 | 140 | 0.16 | 1.02 (0.80–1.28) | 0.897 |
| GG | 689 | 0.53 | 528 | 0.47 | 1.28 (1.10–1.50) | 0.002 | 510 | 0.57 | 0.88 (0.74–1.04) | 0.142 |
| GT | 175 | 0.14 | 198 | 0.18 | 0.73 (0.58–0.91) | 0.051 | 140 | 0.16 | 0.85 (0.67–1.09) | 0.197 |
3. Discussion
4. Experimental Section
4.1. Study Population
4.2. Selection of SNPs and Primer Design
4.3. Genotyping
4.4. Statistical Analysis
5. Conclusions
Acknowledgments
Author Contributions
Conflicts of Interest
References
- Shoham, A.; Hadziahmetovic, M.; Dunaief, J.L.; Mydlarski, M.B.; Schipper, H.M. Oxidative stress in diseases of the human cornea. Free Radic. Biol. Med. 2008, 45, 1047–1055. [Google Scholar] [CrossRef] [PubMed]
- Chwa, M.; Atilano, S.R.; Hertzog, D.; Zheng, H.; Langberg, J.; Kim, D.W.; Kenney, M.C. Hypersensitive response to oxidative stress in keratoconus corneal fibroblasts. Investig. Ophthalmol. Vis. Sci. 2008, 49, 4361–4369. [Google Scholar] [CrossRef]
- Jurkunas, U.V.; Bitar, M.S.; Funaki, T.; Azizi, B. Evidence of oxidative stress in the pathogenesis of Fuchs endothelial corneal dystrophy. Am. J. Pathol. 2010, 177, 2278–2289. [Google Scholar] [CrossRef] [PubMed]
- Rabinowitz, Y.S. Keratoconus. Surv. Ophthalmol. 1998, 42, 297–319. [Google Scholar] [CrossRef] [PubMed]
- Sherwin, T.; Brookes, N.H. Morphological changes in keratoconus: Pathology or pathogenesis. Clin. Exp. Ophthalmol. 2004, 32, 211–217. [Google Scholar] [CrossRef]
- Zadnik, K.; Steger-May, K.; Fink, B.A.; Joslin, C.E.; Nichols, J.J.; Rosenstiel, C.E.; Tyler, J.A.; Yu, J.A.; Raasch, T.W.; Schechtman, K.B.; et al. Collaborative Longitudinal Evaluation of Keratoconus—Between-eye asymmetry in keratoconus. Cornea 2002, 21, 671–679. [Google Scholar] [CrossRef] [PubMed]
- Nichols, J.J.; Steger-May, K.; Edrington, T.B.; Zadnik, K. The relation between disease asymmetry and severity in keratoconus. Br. J. Ophthalmol. 2004, 88, 788–791. [Google Scholar] [CrossRef] [PubMed]
- Kennedy, R.H.; Bourne, W.M.; Dyer, J.A. A 48-year clinical and epidemiologic study of keratoconus. Am. J. Ophthalmol. 1986, 101, 267–273. [Google Scholar] [PubMed]
- Wang, Y.; Rabinowitz, Y.S.; Rotter, J.I.; Yang, H. Genetic epidemiological study of keratoconus: Evidence for major gene determination. Am. J. Med. Genet. 2000, 93, 403–409. [Google Scholar] [CrossRef] [PubMed]
- Romero-Jiménez, M.; Santodomingo-Rubido, J.; Wolffsohn, J.S. Keratoconus: A review. Contact Lens Anterior Eye 2010, 33, 157–166. [Google Scholar]
- Bechara, S.J.; Waring, G.O., III.; Insler, M.S. Keratoconus in two pairs of identical twins. Cornea 1996, 15, 90–93. [Google Scholar] [CrossRef] [PubMed]
- McMahon, T.T.; Shin, J.A.; Newlin, A.; Edrington, T.B.; Sugar, J.; Zadnik, K. Discordance for keratoconus in two pairs of monozygotic twins. Cornea 1999, 18, 444–451. [Google Scholar] [CrossRef] [PubMed]
- Paliwal, P.; Tandon, R.; Dube, D.; Kaur, P.; Sharma, A. Familial segregation of a VSX1 mutation adds a new dimension to its role in the causation of keratoconus. Mol. Vis. 2011, 17, 481–485. [Google Scholar] [PubMed]
- Udar, N.; Atilano, S.R.; Brown, D.J.; Holguin, B.; Small, K.; Nesburn, A.B.; Kenney, M.C. SOD1: A candidate gene for keratoconus. Investig. Ophthalmol. Vis. Sci. 2006, 47, 3345–3351. [Google Scholar] [CrossRef]
- Stabuc-Silih, M.; Ravnik-Glavac, M.; Glavac, D.; Hawlina, M.; Strazisar, M. Polymorphisms in COL4A3 and COL4A4 genes associated with keratoconus. Mol. Vis. 2009, 15, 2848–2860. [Google Scholar]
- Hutchings, H.; Ginisty, H.; le Gallo, M.; Levy, D.; Stoësser, F.; Rouland, J.F.; Arné, J.L.; Lalaux, M.H.; Calvas, P.; Roth, M.P.; et al. Identification of a new locus for isolated familial keratoconus at 2p24. J. Med. Genet. 2005, 42, 88–94. [Google Scholar] [CrossRef] [PubMed]
- Brancati, F.; Valente, E.M.; Sarkozy, A.; Fehèr, J.; Castori, M.; del Duca, P.; Mingarelli, R.; Pizzuti, A.; Dallapiccola, B. A locus for autosomal dominant keratoconus maps to human chromosome 3p14-q13. J. Med. Genet. 2004, 41, 188–192. [Google Scholar] [CrossRef] [PubMed]
- Tang, Y.G.; Rabinowitz, Y.S.; Taylor, K.D.; Li, X.; Hu, M.; Picornell, Y.; Yang, H. Genomewide linkage scan in a multigeneration Caucasian pedigree identifies a novel locus for keratoconus on chromosome 5q14.3-q21.1. Genet. Med. 2005, 7, 397–405. [Google Scholar]
- Tyynismaa, H.; Sistonen, P.; Tuupanen, S.; Tervo, T.; Dammert, A.; Latvala, T.; Alitalo, T. A locus for autosomal dominant keratoconus: Linkage to 16q22.3-q23.1 in Finnish families. Investig. Ophthalmol. Vis. Sci. 2002, 43, 3160–3164. [Google Scholar]
- Burdon, K.P.; Coster, D.J.; Charlesworth, J.C.; Mills, R.A.; Laurie, K.J.; Giunta, C.; Hewitt, A.W.; Latimer, P.; Craig, J.E. Apparent autosomal dominant keratoconus in a large Australian pedigree accounted for by digenic inheritance of two novel loci. Hum. Genet. 2008, 124, 379–386. [Google Scholar] [CrossRef] [PubMed]
- Hughes, A.E.; Dash, D.P.; Jackson, A.J.; Frazer, D.G.; Silvestri, G. Familial keratoconus with cataract: Linkage to the long arm of chromosome 15 and exclusion of candidate genes. Investig. Ophthalmol. Vis. Sci. 2003, 44, 5063–5066. [Google Scholar] [CrossRef]
- Gajecka, M.; Radhakrishna, U.; Winters, D.; Nath, S.K.; Rydzanicz, M.; Ratnamala, U.; Ewing, K.; Molinari, A.; Pitarque, J.A.; Lee, K.; et al. Localization of a gene for keratoconus to a 5.6-Mb interval on 13q32. Investig. Ophthalmol. Vis. Sci. 2009, 50, 1531–1539. [Google Scholar]
- Fullerton, J.; Paprocki, P.; Foote, S.; Mackey, D.A.; Williamson, R.; Forrest, S. Identity-by-descent approach to gene localisation in eight individuals affected by keratoconus from north-west Tasmania, Australia. Hum. Genet . 2002, 110, 462–470. [Google Scholar] [CrossRef] [PubMed]
- Yuen, H.K.; Rassier, C.E.; Jardeleza, M.S.; Green, W.R.; de la Cruz, Z.; Stark, W.J.; Gottsch, J.D. A morphologic study of Fuchs dystrophy and bullous keratopathy. Cornea 2005, 24, 319–327. [Google Scholar] [CrossRef] [PubMed]
- Klintworth, G.K. Corneal dystrophies. Orphanet. J. Rare. Dis. 2009, 4, 7. [Google Scholar]
- Elhalis, H.; Azizi, B.; Jurkunas, U.V. Fuchs endothelial corneal dystrophy. Ocul. Surf. 2010, 8, 173–184. [Google Scholar] [CrossRef] [PubMed]
- Krachmer, J.H.; Purcell, J.J., Jr.; Young, C.W.; Bucher, K.D. Corneal endothelial dystrophy—A study of 64 families. Arch. Ophthalmol. 1978, 96, 2036–2039. [Google Scholar] [CrossRef] [PubMed]
- Schmedt, T.; Silva, M.M.; Ziaei, A.; Jurkunas, U. Molecular bases of corneal endothelial dystrophies. Exp. Eye Res. 2012, 95, 24–34. [Google Scholar] [CrossRef] [PubMed]
- Darlington, J.K.; Adrean, S.D.; Schwab, I.R. Trends of penetrating keratoplasty in the United States from 1980 to 2004. Ophthalmology 2006, 113, 2171–2175. [Google Scholar] [CrossRef] [PubMed]
- Eghrari, A.O.; Gottsch, J.D. Fuchs’ corneal dystrophy. Expert Rev. Ophthalmol. 2010, 5, 147–159. [Google Scholar] [CrossRef] [PubMed]
- Gottsch, J.D.; Sundin, O.H.; Liu, S.H.; Jun, A.S.; Broman, K.W.; Stark, W.J.; Vito, E.C.; Narang, A.K.; Thompson, J.M.; Magovern, M. Inheritance of a novel COL8A2 mutation defines a distinct early-onset subtype of Fuchs corneal dystrophy. Investig. Ophthalmol. Vis. Sci. 2005, 46, 1934–1939. [Google Scholar] [CrossRef]
- Gottsch, J.D.; Zhang, C.; Sundin, O.H.; Bell, W.R.; Stark, W.J.; Green, W.R. Fuchs corneal dystrophy: Aberrant collagen distribution in an L450W mutant of the COL8A2 gene. Investig. Ophthalmol. Vis. Sci. 2005, 46, 4504–4511. [Google Scholar] [CrossRef]
- Riazuddin, S.A.; McGlumphy, E.J.; Yeo, W.S.; Wang, J.; Katsanis, N.; Gottsch, J.D. Replication of the TCF4 intronic variant in late-onset Fuchs corneal dystrophy and evidence of independence from the FCD2 locus. Investig. Ophthalmol. Vis. Sci. 2011, 52, 2825–2829. [Google Scholar] [CrossRef]
- Riazuddin, S.A.; Zaghloul, N.A.; Al-Saif, A.; Davey, L.; Diplas, B.H.; Meadows, D.N.; Eghrari, A.O.; Minear, M.A.; Li, Y.J.; Klintworth, G.K.; et al. Missense mutations in TCF8 cause late-onset Fuchs corneal dystrophy and interact with FCD4 on chromosome 9p. Am. J. Hum. Genet. 2010, 86, 45–53. [Google Scholar]
- Vithana, E.N.; Morgan, P.E.; Ramprasad, V.; Tan, D.T.; Yong, V.H.; Venkataraman, D.; Venkatraman, A.; Yam, G.H.; Nagasamy, S.; Law, R.W.; et al. SLC4A11 mutations in Fuchs endothelial corneal dystrophy. Hum. Mol. Genet. 2008, 17, 656–666. [Google Scholar] [CrossRef] [PubMed]
- Sundin, O.H.; Broman, K.W.; Chang, H.H.; Vito, E.C.; Stark, W.J.; Gottsch, J.D. A common locus for late-onset Fuchs corneal dystrophy maps to 18q21.2-q21.32. Investig. Ophthalmol. Vis. Sci. 2006, 47, 3919–3926. [Google Scholar]
- Sundin, O.H.; Jun, A.S.; Broman, K.W.; Liu, S.H.; Sheehan, S.E.; Vito, E.C.; Stark, W.J.; Gottsch, J.D. Linkage of late-onset Fuchs corneal dystrophy to a novel locus at 13pTel-13q12.13. Investig. Ophthalmol. Vis. Sci. 2006, 47, 140–145. [Google Scholar] [CrossRef]
- Afshari, N.A.; Li, Y.J.; Pericak-Vance, M.A.; Gregory, S.; Klintworth, G.K. Genome-wide linkage scan in Fuchs endothelial corneal dystrophy. Investig. Ophthalmol. Vis. Sci. 2009, 50, 1093–1097. [Google Scholar] [CrossRef]
- Riazuddin, S.A.; Eghrari, A.O.; Al Saif, A.; Davey, L.; Meadows, D.N.; Katsanis, N.; Gottsch, J.D. Linkage of a mild late-onset phenotype of Fuchs corneal dystrophy to a novel locus at 5q33.1-q35.2. Investig. Ophthalmol. Vis. Sci. 2009, 50, 5667–5671. [Google Scholar]
- Lu, J.; Zhang, S.; Chen, D.; Wang, H.; Wu, W.; Wang, X.; Lei, Y.; Wang, J.; Qian, J.; Fan, W.; et al. Functional characterization of a promoter polymorphism in APE1/Ref-1 that contributes to reduced lung cancer susceptibility. FASEB J. 2009, 23, 3459–3469. [Google Scholar] [CrossRef] [PubMed]
- Iliff, B.W.; Riazuddin, S.A.; Gottsch, J.D. The genetics of Fuchs’ corneal dystrophy. Expert Rev. Ophthalmol. 2012, 7, 363–375. [Google Scholar] [CrossRef] [PubMed]
- Riazuddin, S.A.; Parker, D.S.; McGlumphy, E.J.; Oh, E.C.; Iliff, B.W.; Schmedt, T.; Jurkunas, U.; Schleif, R.; Katsanis, N.; Gottsch, J.D. Mutations in LOXHD1, a recessive-deafness locus, cause dominant late-onset Fuchs corneal dystrophy. Am. J. Hum. Genet. 2012, 90, 533–559. [Google Scholar] [CrossRef] [PubMed]
- Bawazeer, A.M.; Hodge, W.G.; Lorimer, B. Atopy and keratoconus: A multivariate analysis. Br. J. Ophthalmol. 2000, 84, 834–836. [Google Scholar] [CrossRef] [PubMed]
- Rosenblum, P.; Stark, W.J.; Maumenee, I.H.; Hirst, L.W.; Maumenee, A.E. Hereditary Fuchs’ dystrophy. Am. J. Ophthalmol. 1980, 90, 455–462. [Google Scholar] [PubMed]
- Edwards, M.; McGhee, C.N.; Dean, S. The genetics of keratoconus. Clin. Exp. Ophthalmol. 2001, 29, 345–351. [Google Scholar] [CrossRef]
- Rahi, A.; Davies, P.; Ruben, M.; Lobascher, D.; Menon, J. Keratoconus and coexisting atopic disease. Br. J. Ophthalmol. 1977, 61, 761–764. [Google Scholar] [CrossRef] [PubMed]
- Nagarsheth, M.; Singh, A.; Schmotzer, B.; Babineau, D.C.; Sugar, J.; Lee, W.B.; Iyengar, S.K.; Lass, J.H.; Fuchs’ Genetics Multi-Center Study Group. Relationship between Fuchs endothelial corneal dystrophy severity and glaucoma and/or ocular hypertension. Arch. Ophthalmol. 2012, 9, 1–5. [Google Scholar]
- Gondhowiardjo, T.D.; van Haeringen, N.J. Corneal aldehyde dehydrogenase, glutathione reductase, and glutathione S-transferase in pathologic corneas. Cornea 1993, 12, 310–314. [Google Scholar] [CrossRef] [PubMed]
- Buddi, R.; Lin, B.; Atilano, S.R.; Zorapapel, N.C.; Kenney, M.C.; Brown, D.J. Evidence of oxidative stress in human corneal diseases. J. Histochem. Cytochem. 2002, 50, 341–351. [Google Scholar] [CrossRef] [PubMed]
- Kenney, M.C.; Chwa, M.; Atilano, S.R.; Tran, A.; Carballo, M.; Saghizadeh, M.; Vasiliou, V.; Adachi, W.; Brown, D.J. Increased levels of catalase and cathepsin V/L2 but decreased TIMP-1 in keratoconus corneas: Evidence that oxidative stress plays a role in this disorder. Investig. Ophthalmol. Vis. Sci. 2005, 46, 823–832. [Google Scholar] [CrossRef]
- Arnal, E.; Peris-Martínez, C.; Menezo, J.L.; Johnsen-Soriano, S.; Romero, F.J. Oxidative stress in keratoconus? Investig. Ophthalmol. Vis. Sci. 2011, 52, 8592–8597. [Google Scholar] [CrossRef]
- Jurkunas, U.V.; Rawe, I.; Bitar, M.S.; Zhu, C.; Harris, D.L.; Colby, K.; Joyce, N.C. Decreased expression of peroxiredoxins in Fuchs’ endothelial dystrophy. Investig. Ophthalmol. Vis. Sci. 2008, 49, 2956–2963. [Google Scholar] [CrossRef]
- Atilano, S.R.; Coskun, P.; Chwa, M.; Jordan, N.; Reddy, V.; Le, K.; Wallace, D.C.; Kenney, M.C. Accumulation of mitochondrial DNA damage in keratoconus corneas. Investig. Ophthalmol. Vis. Sci. 2005, 46, 1256–1263. [Google Scholar] [CrossRef]
- Hegde, M.L.; Hazra, T.K.; Mitra, S. Early steps in the DNA base excision/single-strand interruption repair pathway in mammalian cells. Cell Res. 2008, 18, 27–47. [Google Scholar]
- Qian, L.; Yuan, F.; Rodriguez-Tello, P.; Padgaonkar, S.; Zhang, Y. Human fanconi anemia complementation group a protein stimulates the 5’ flap endonuclease activity of FEN1. PLoS One 2013, 8, e82666. [Google Scholar] [CrossRef] [PubMed]
- Zheng, L.; Jia, J.; Finger, L.D.; Guo, Z.; Zer, C.; Shen, B. Functional regulation of FEN1 nuclease and its link to cancer. Nucleic Acids Res. 2011, 39, 781–794. [Google Scholar] [CrossRef] [PubMed]
- Craggs, T.D.; Hutton, R.D.; Brenlla, A.; White, M.F.; Penedo, J.C. Single-molecule characterization of Fen1 and Fen1/PCNA complexes acting on flap substrates. Nucleic Acids Res. 2014, 42, 1857–1872. [Google Scholar] [CrossRef] [PubMed]
- Yang, M.; Guo, H.; Wu, C.; He, Y.; Yu, D.; Zhou, L.; Wang, F.; Xu, J.; Tan, W.; Wang, G.; et al. Functional FEN1 polymorphisms are associated with DNA damage levels and lung cancer risk. Hum. Mutat. 2009, 30, 1320–1328. [Google Scholar] [CrossRef] [PubMed]
- Holladay, J.T. Keratoconus detection using corneal topography. J. Refract. Surg. 2009, 25, S958–S962. [Google Scholar] [CrossRef] [PubMed]
- Pflugfelder, S.C.; Liu, Z.; Feuer, W.; Verm, A. Corneal thickness indices discriminate between keratoconus and contact lens-induced corneal thinning. Ophthalmology 2002, 109, 2336–2341. [Google Scholar] [CrossRef] [PubMed]
- Szaflik, J.P. Comparison of in vivo confocal microscopy of human cornea by white light scanning slit and laser scanning systems. Cornea 2007, 26, 438–445. [Google Scholar] [CrossRef] [PubMed]
- Weiss, J.S.; Møller, H.U.; Lisch, W.; Kinoshita, S.; Aldave, A.J.; Belin, M.W.; Kivelä, T.; Busin, M.; Munier, F.L.; Seitz, B.; et al. The IC3D classification of the corneal dystrophies. Cornea 2008, 27, S1–S83. [Google Scholar] [PubMed]
© 2014 by the authors; licensee MDPI, Basel, Switzerland. This article is an open access article distributed under the terms and conditions of the Creative Commons Attribution license (http://creativecommons.org/licenses/by/3.0/).
Share and Cite
Wojcik, K.A.; Synowiec, E.; Polakowski, P.; Głowacki, S.; Izdebska, J.; Lloyd, S.; Galea, D.; Blasiak, J.; Szaflik, J.; Szaflik, J.P. Polymorphism of the Flap Endonuclease 1 Gene in Keratoconus and Fuchs Endothelial Corneal Dystrophy. Int. J. Mol. Sci. 2014, 15, 14786-14802. https://doi.org/10.3390/ijms150814786
Wojcik KA, Synowiec E, Polakowski P, Głowacki S, Izdebska J, Lloyd S, Galea D, Blasiak J, Szaflik J, Szaflik JP. Polymorphism of the Flap Endonuclease 1 Gene in Keratoconus and Fuchs Endothelial Corneal Dystrophy. International Journal of Molecular Sciences. 2014; 15(8):14786-14802. https://doi.org/10.3390/ijms150814786
Chicago/Turabian StyleWojcik, Katarzyna A., Ewelina Synowiec, Piotr Polakowski, Sylwester Głowacki, Justyna Izdebska, Sophie Lloyd, Dieter Galea, Janusz Blasiak, Jerzy Szaflik, and Jacek P. Szaflik. 2014. "Polymorphism of the Flap Endonuclease 1 Gene in Keratoconus and Fuchs Endothelial Corneal Dystrophy" International Journal of Molecular Sciences 15, no. 8: 14786-14802. https://doi.org/10.3390/ijms150814786
APA StyleWojcik, K. A., Synowiec, E., Polakowski, P., Głowacki, S., Izdebska, J., Lloyd, S., Galea, D., Blasiak, J., Szaflik, J., & Szaflik, J. P. (2014). Polymorphism of the Flap Endonuclease 1 Gene in Keratoconus and Fuchs Endothelial Corneal Dystrophy. International Journal of Molecular Sciences, 15(8), 14786-14802. https://doi.org/10.3390/ijms150814786