Article

Effect of Ion Concentration Changes in the Limited Extracellular Spaces on Sarcolemmal Ion Transport and Ca2+ Turnover in a Model of Human Ventricular Cardiomyocyte

1
Department of Physiology, Faculty of Medicine, Masaryk University, Kamenice 5, Brno 62500, Czech Republic
2
Institute of Thermomechanics—Branch Brno, Academy of Science of the Czech Republic, Technická 2, Brno 61669, Czech Republic
3
EA4612 Neurocardiology, University Claude Bernard Lyon 1, 8 Ave Rockefeller, Lyon 69373 Cedex 08, France
*
Author to whom correspondence should be addressed.
Int. J. Mol. Sci. 2013, 14(12), 24271-24292; https://doi.org/10.3390/ijms141224271
Submission received: 27 September 2013 / Revised: 12 November 2013 / Accepted: 19 November 2013 / Published: 13 December 2013
(This article belongs to the Special Issue Computational Modelling of Biological Membranes)

Abstract

:
We have developed a computer model of human cardiac ventricular myocyte (CVM), including t-tubular and cleft spaces with the aim of evaluating the impact of accumulation-depletion of ions in restricted extracellular spaces on transmembrane ion transport and ionic homeostasis in human CVM. The model was based on available data from human CVMs. Under steady state, the effect of ion concentration changes in extracellular spaces on [Ca2+]i-transient was explored as a function of critical fractions of ion transporters in t-tubular membrane (not documented for human CVM). Depletion of Ca2+ and accumulation of K+ occurring in extracellular spaces slightly affected the transmembrane Ca2+ flux, but not the action potential duration (APD90). The [Ca2+]i-transient was reduced (by 2%–9%), depending on the stimulation frequency, the rate of ion exchange between t-tubules and clefts and fractions of ion-transfer proteins in the t-tubular membrane. Under non-steady state, the responses of the model to changes of stimulation frequency were analyzed. A sudden increase of frequency (1–2.5 Hz) caused a temporal decrease of [Ca2+] in both extracellular spaces, a reduction of [Ca2+]i-transient (by 15%) and APD90 (by 13 ms). The results reveal different effects of activity-related ion concentration changes in human cardiac t-tubules (steady-state effects) and intercellular clefts (transient effects) in the modulation of membrane ion transport and Ca2+ turnover.

Graphical Abstract

1. Introduction

The increased availability of experimental data obtained from human isolated cardiomyocytes in recent years provided sufficient material to mathematically describe the transmembrane ion transport and electrical activity in human atrial [1,2] and ventricular cells [38]. None of these models, however, included a description of the effects of simultaneous changes of ion concentrations in the intercellular cleft space and t-tubular system as functional compartments that may affect cellular activity. The present work is the first attempting at filling this blank.
The first model of cardiac cells that included changes of Ca2+ concentration in the intercellular clefts was developed by Hilgemann and Noble [9]. Focused on the description of Ca2+ movements and excitation-contraction (EC) coupling in rabbit atrial cells, the model accurately reproduced the variations of extracellular Ca2+ concentration measured in rabbit atrium [10,11]. Later, intercellular cleft space was also introduced into a model of human atrial cell by Nygren et al. [2].
In 2003, we published a pioneering work [12] indicating that activity-induced ion concentration changes in t-tubules of cardiac ventricular cells may be sufficiently high to modulate membrane currents and cellular electrical activity. Later, works on species-specific models for rat [13] and guinea-pig [14] demonstrated that, during a single beat at steady-state stimulation, the transient Ca2+ depletion in t-tubules may range between 7% and 20%, while transient K+ accumulation may reach 4%. This depended on the characteristics of the ion transporters, on their distribution between the surface and the t-tubular membrane, on the rate of ion diffusion between the t-tubular lumen and the extracellular space and on stimulation frequency. The resulting effect was a decrease of transmembrane Ca2+ influx and a reduction of sarcoplasmic reticulum (SR) Ca2+ load and intracellular Ca2+-transient. The frequency-dependent profiles of ion concentration transients during a cycle were different between these two models, stressing the need for a dedicated human ventricular cell model.
The present model of human ventricular myocyte has been formulated to take into account the up-to-date knowledge of membrane ionic currents and intracellular homeostasis in human cells. The description of the t-tubular system is based on current knowledge of morphological features in human cardiomyocytes [15]. To increase the accuracy of the model, the concentration changes in the layer adjacent to the tubular membrane were introduced similarly as in our latest work [16]. The t-tubular space was partitioned into concentric subspaces to describe the radial concentration gradients within the t-tubular lumen. In addition, to be consistent with the presence of the limited size of the pericellular interstitial space, a cleft space has been formulated, as done by Nygren et al. [2].
The aim of this study was to explore the functional significance of the presence of these extracellular spaces. Because the values of some parameters that are related to the features of t-tubules in human ventricular myocytes are still unknown (fractions of ionic currents in the t-tubular membrane, the rate of ion exchange between the t-tubular and extracellular space), we explored the physiological consequences of their various combinations, in particular those related to cellular electro-mechanical activity.

2. Results

2.1. Basic Behavior of the Model

Figure 1 illustrates the APs, three dominant ionic currents involved in membrane repolarization (ICaL, IKto and IK1) and currents controlling intracellular ionic homeostasis (INaCa, INaK) at 1 and 2.5 Hz steady-state stimulation. While the differences between APs at surface and t-tubular membranes are minimal [17], the differences between surface and tubular components of ionic currents are marked. They are caused by uneven distribution of corresponding ion transporters between both membrane systems (see Table S1 in the Supplementary Information), but also partly by differences in extracellular ion concentrations, to which both membranes are exposed during the stimulation cycle (Figure 2).
The depletion of t-tubular Ca2+ is predominantly induced by the activation of tubular ICaL (ICaL,t). The two peaks in the tubular K+ accumulation result from the activation of tubular IKto (IKto,t) at the beginning of the AP and from the increase of tubular IK1 (IK1,t) during the course of AP repolarization. The traces of tubular [Ca2+] and [K+] in Figure 2 show how activity-induced depletion of tubular Ca2+ and accumulation of tubular K+ decrease from the layer adjacent to the t-tubular membrane (first segment; [Ca2+]t1, [K+]t1) to the central part of the t-tubule lumen. Their differences demonstrate luminal ion concentration gradients in the radial direction. The alterations of [Ca2+] in clefts ([Ca2+]c) were induced by the activation of the main Ca2+ currents in the surface membrane (ICaL,s, IpCa,s, INaCa,s) and by Ca2+ diffusion between t-tubules and clefts. Small changes of [K+]c were induced by activation of IKto,s, IK1,s and INaK,s and by K+ diffusion between t-tubules and clefts. In addition, concentrations of all ions in the cleft space were affected by diffusion of ions between the cleft space and the external bulk space.

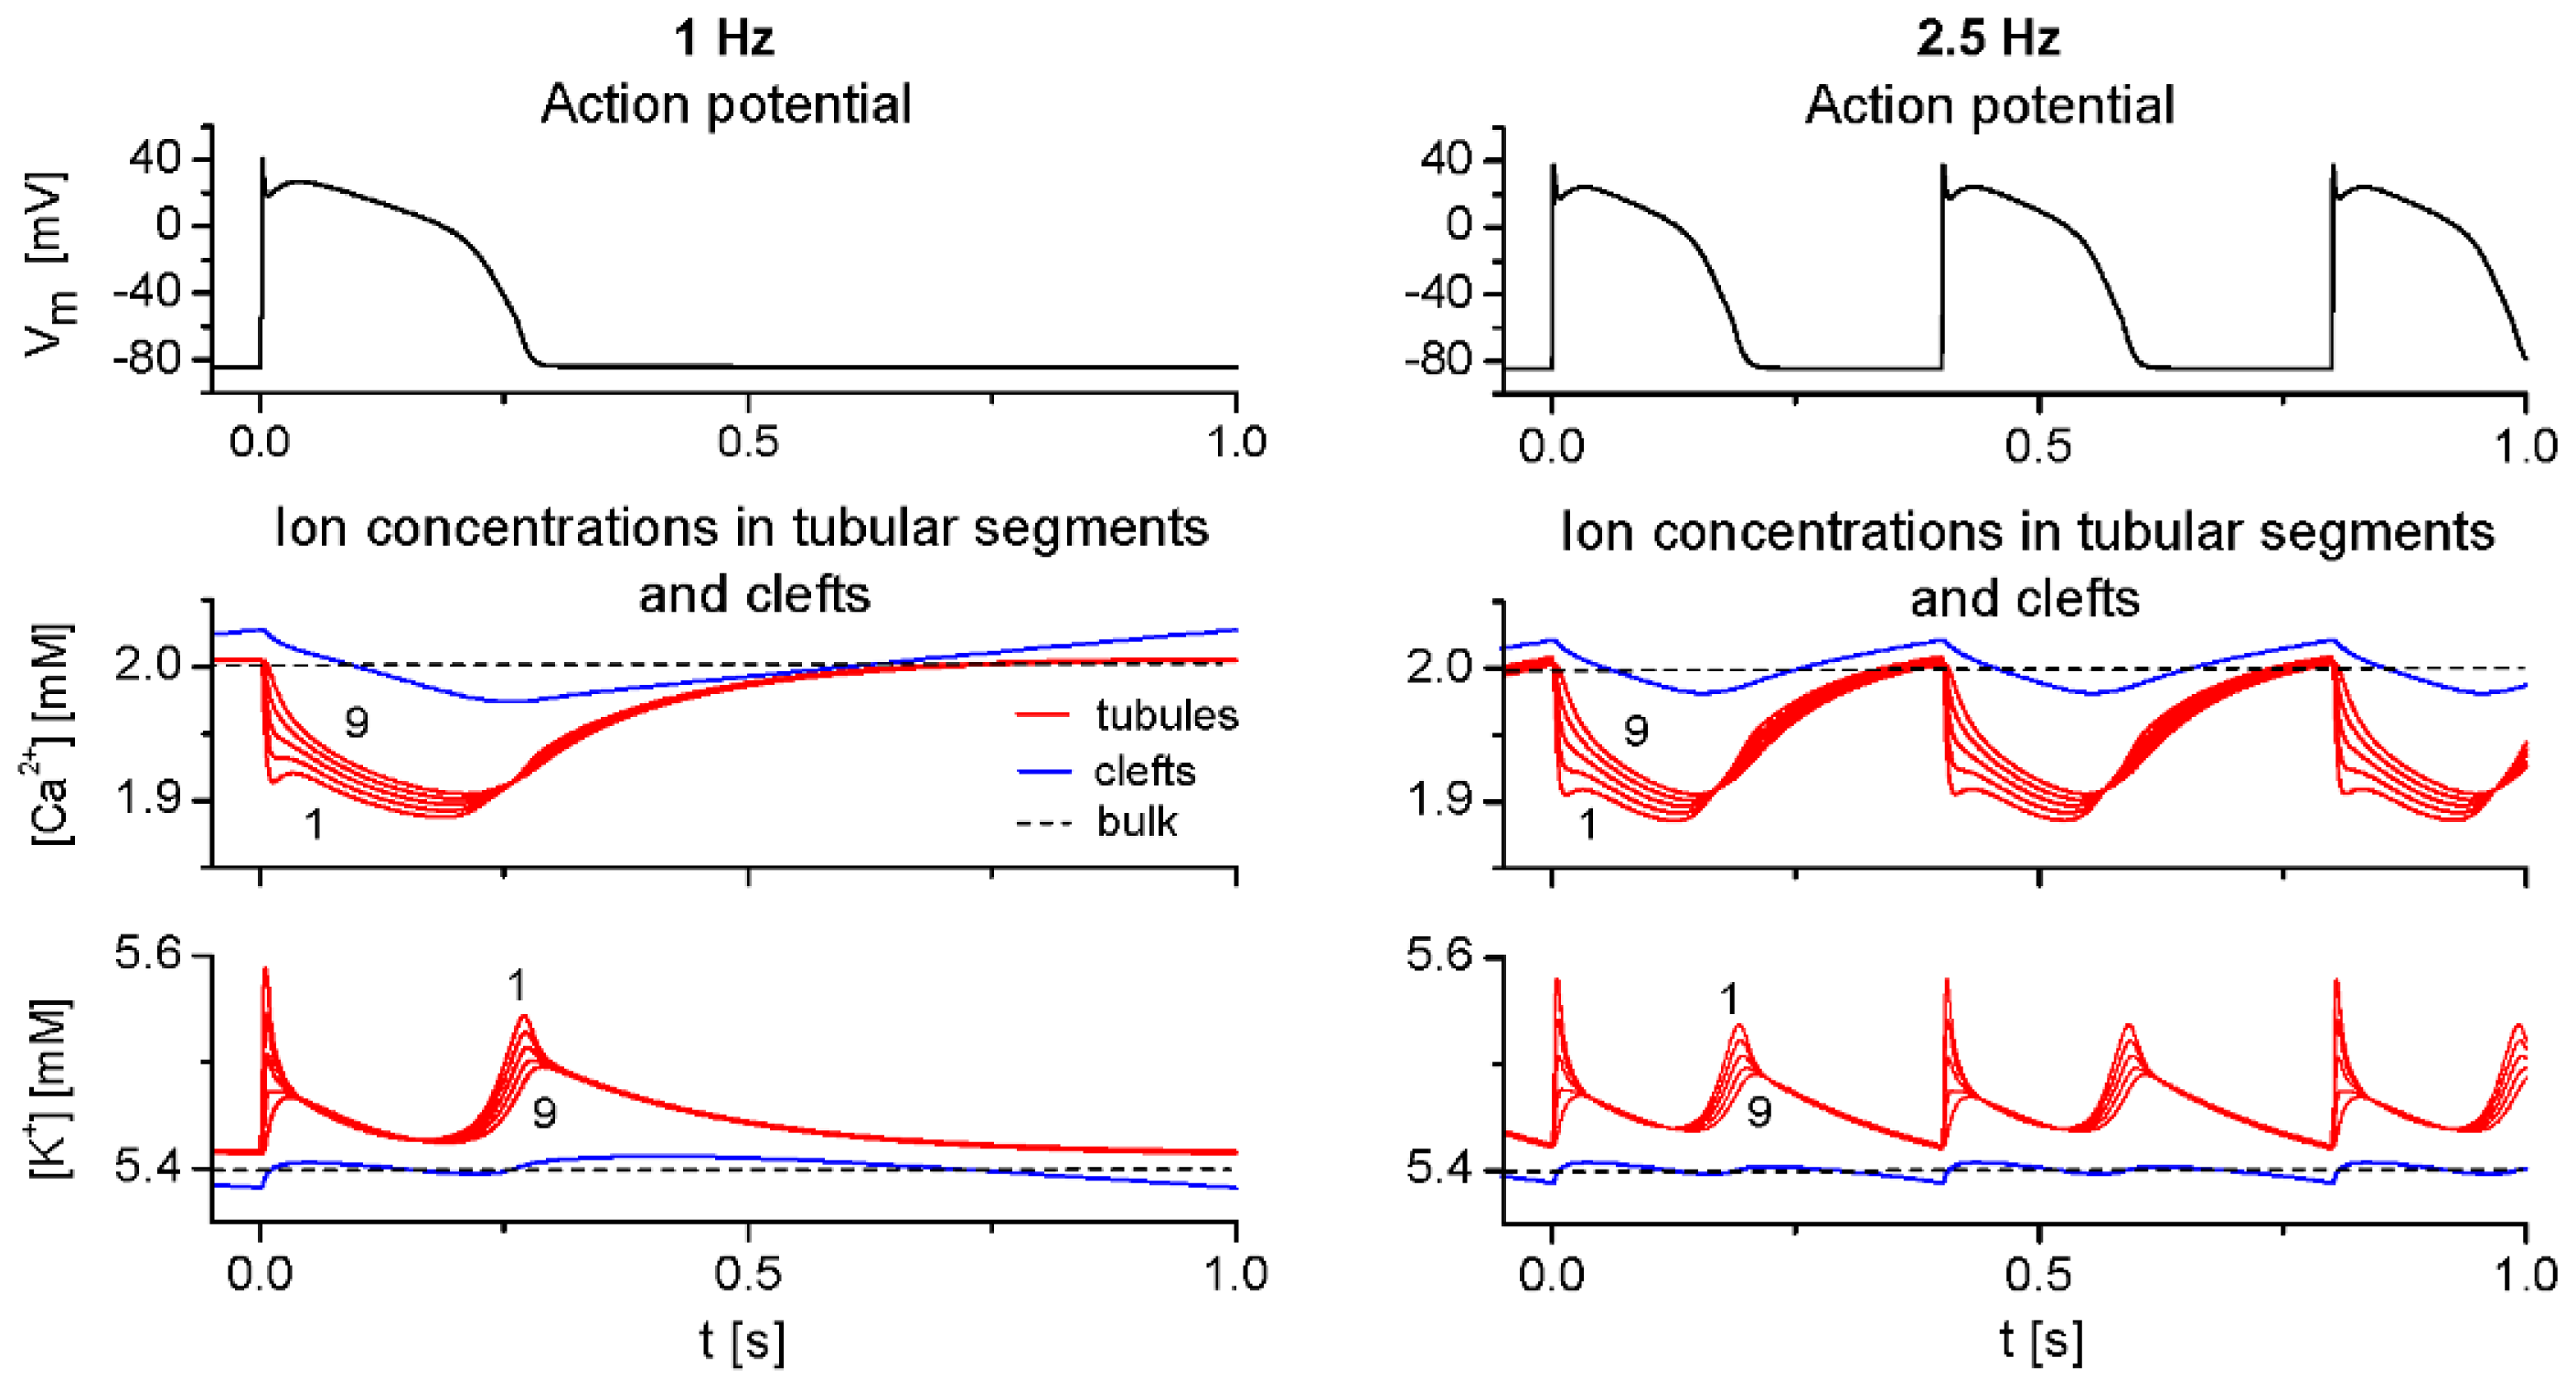
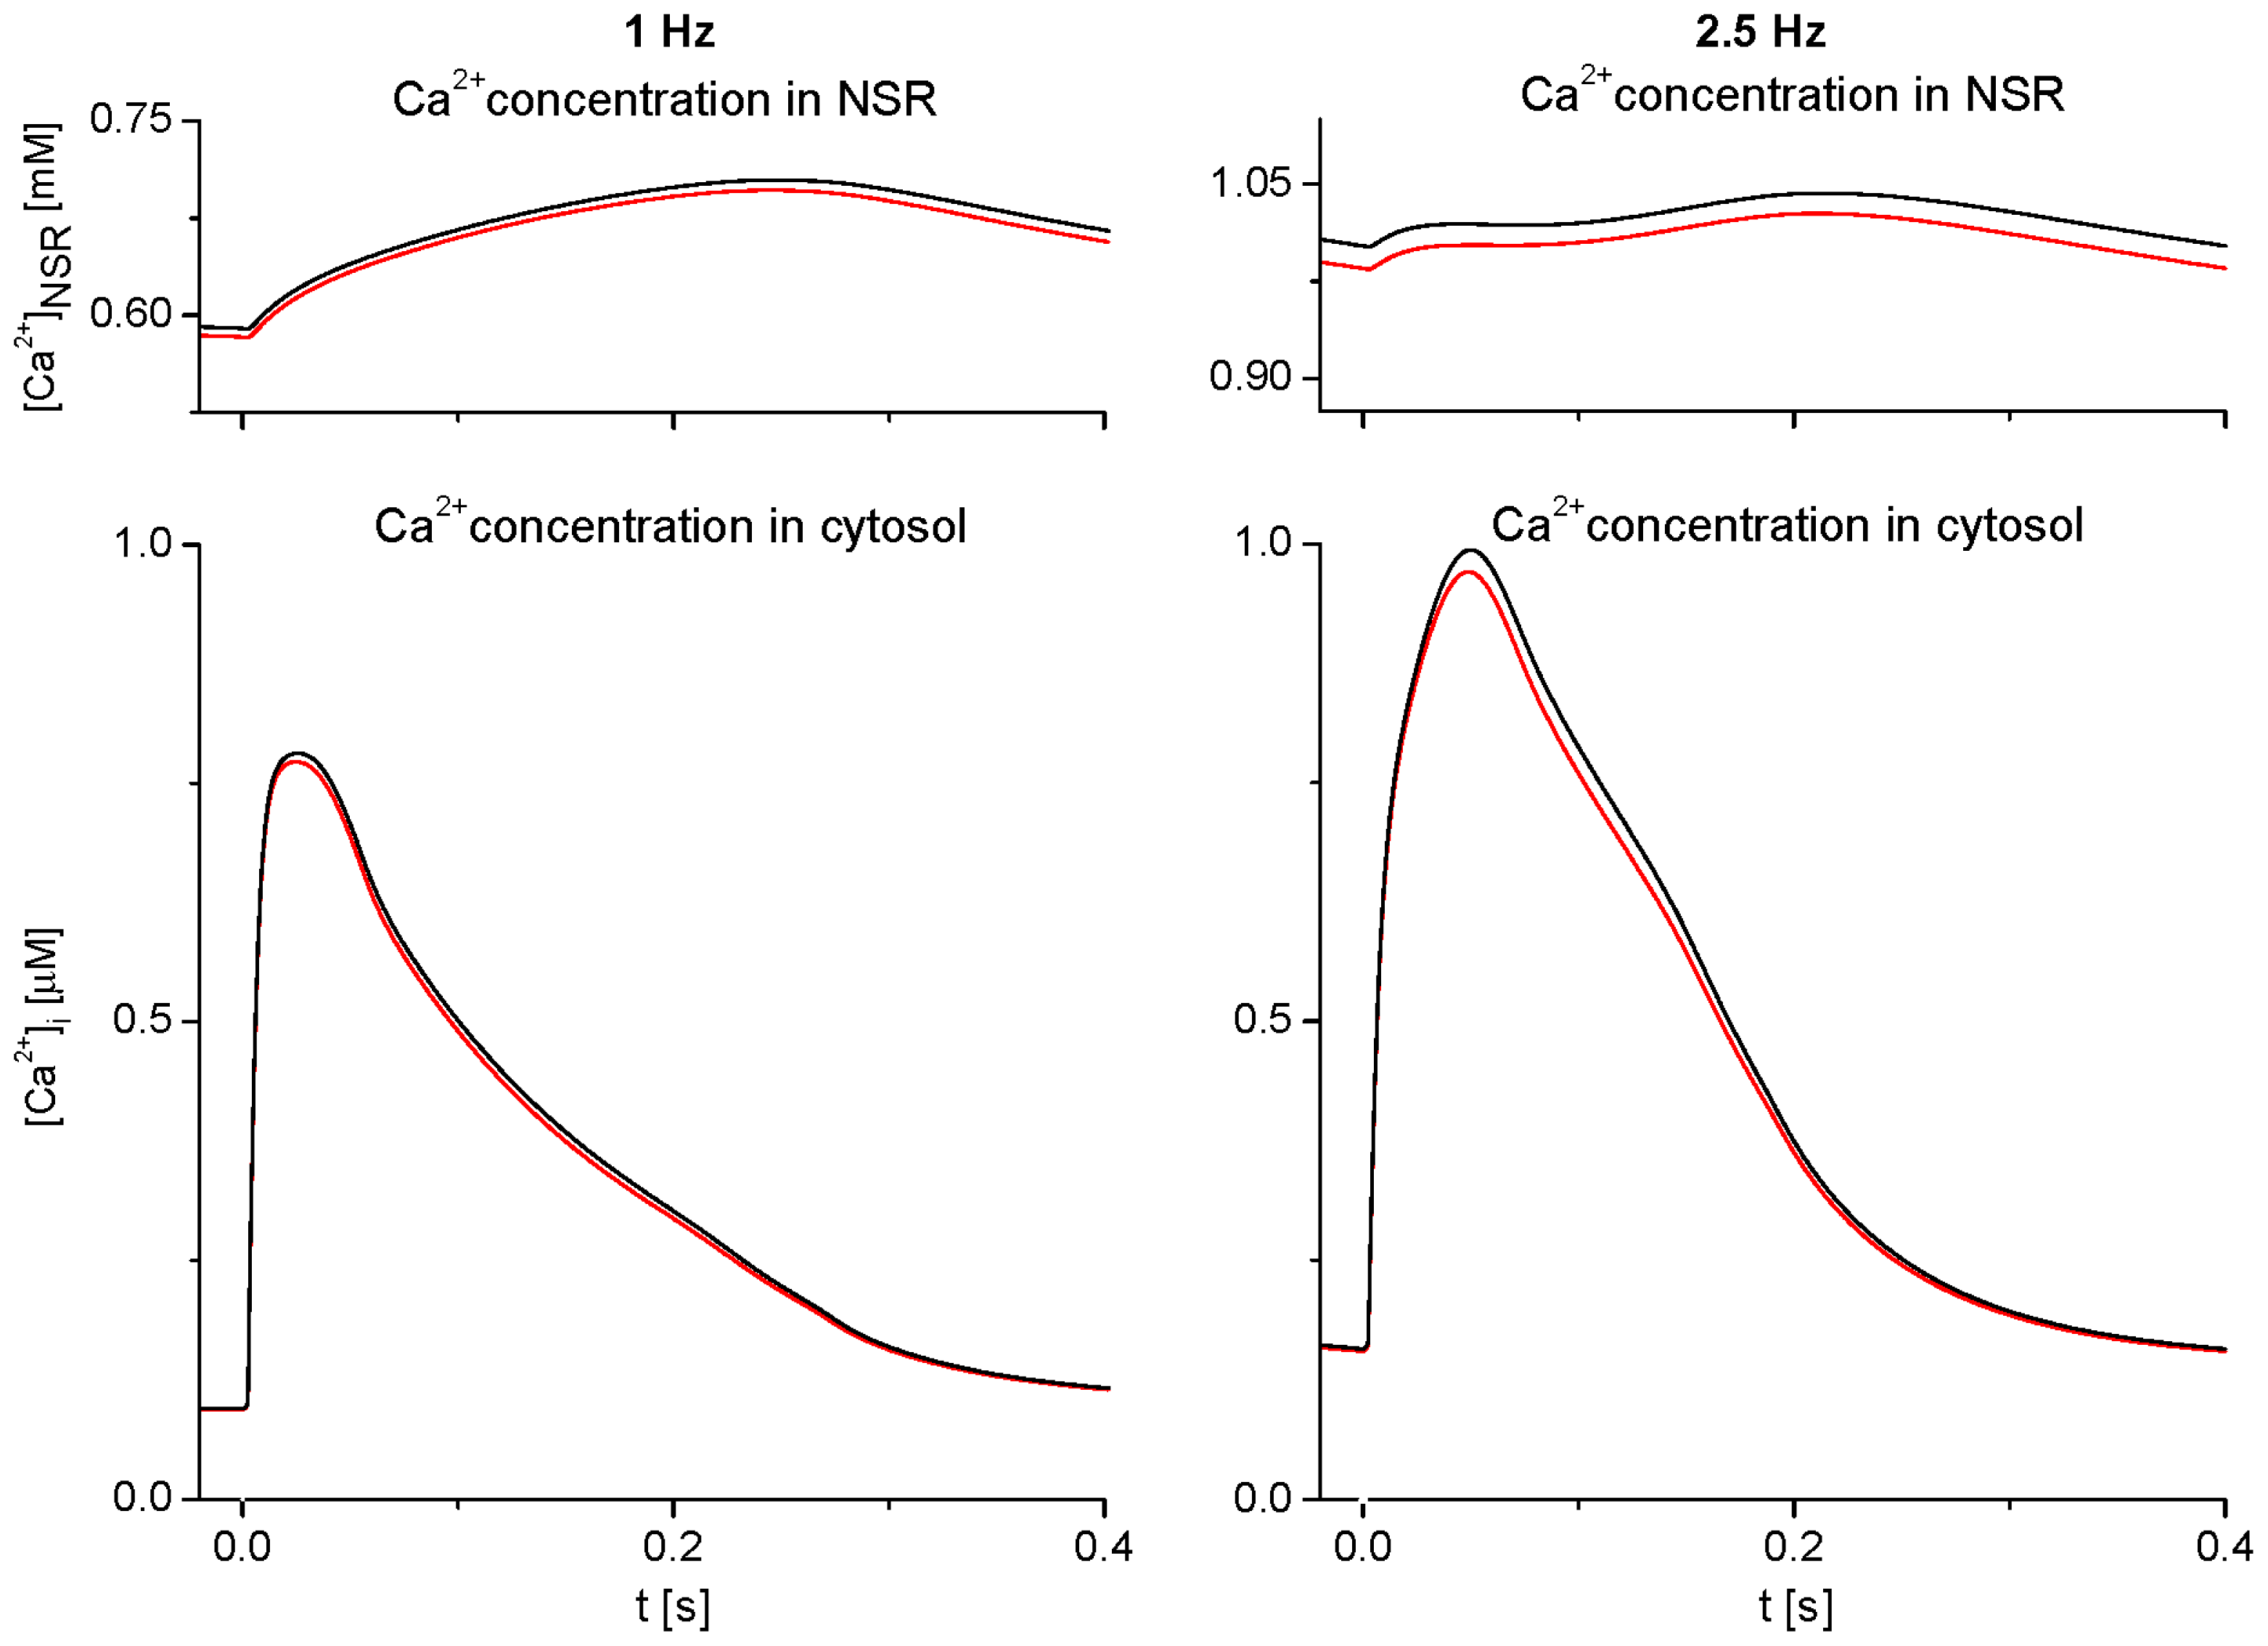
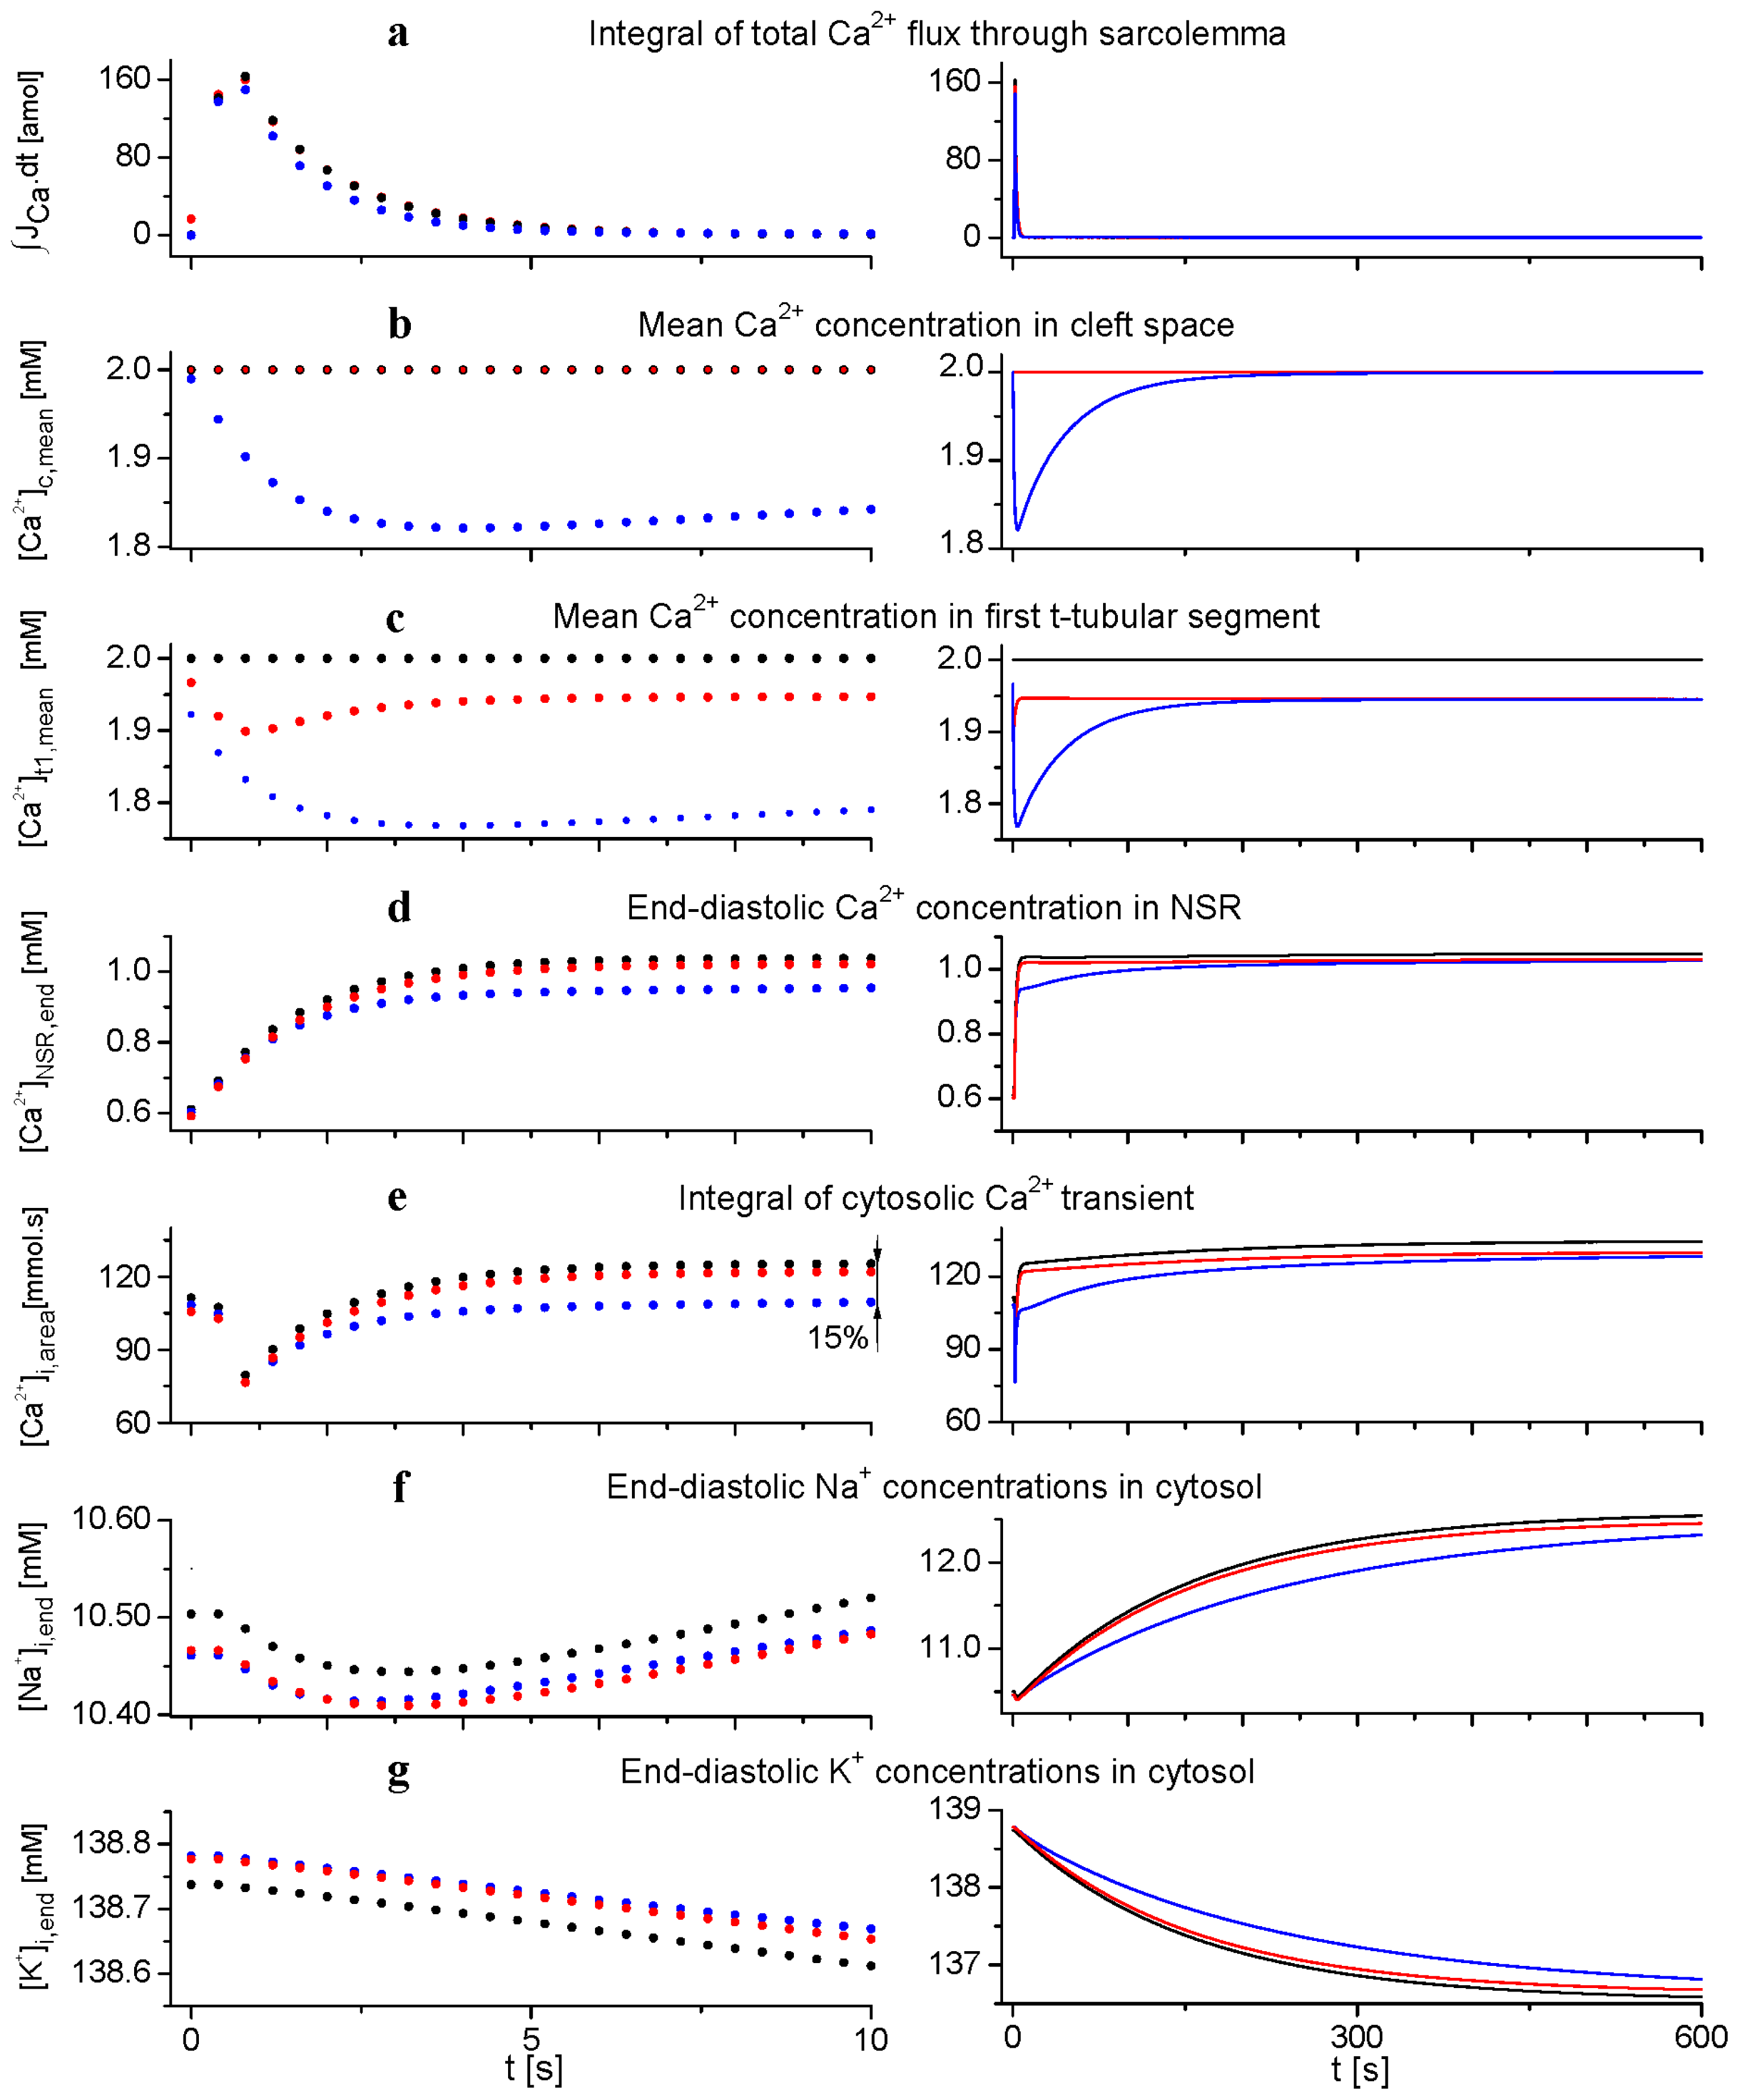
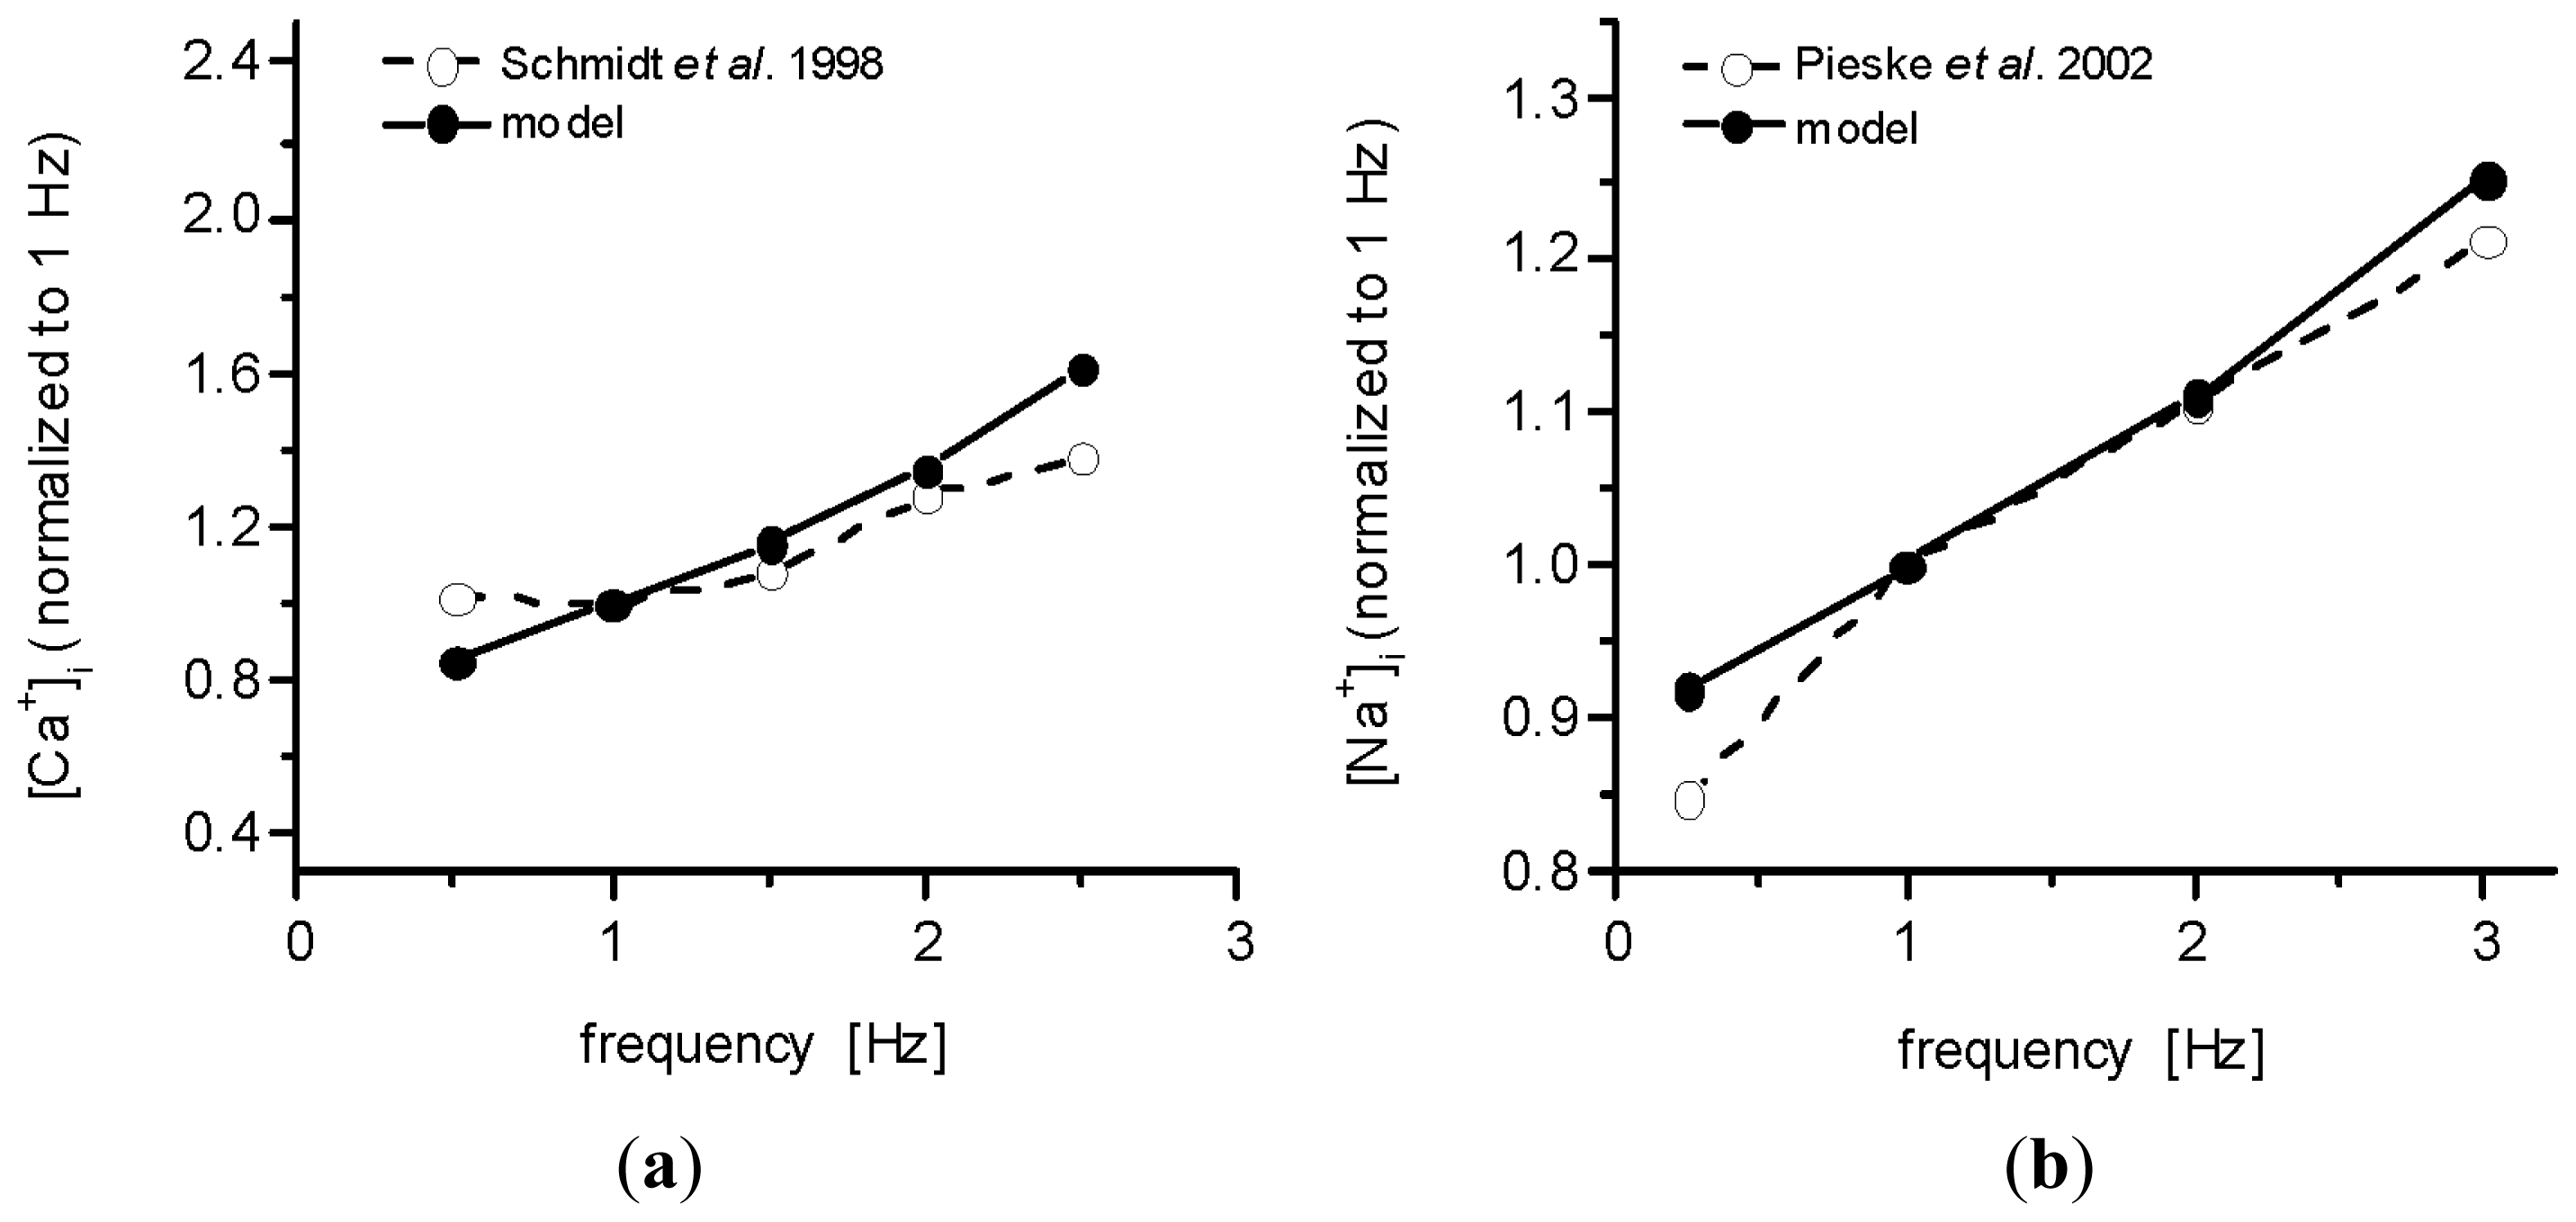
2.2. Effect of Ion Concentration Changes in Extracellular Spaces on Intracellular Ca2+ SR Load and Ca2+-Transient at Steady-State Stimulation

Figure 3 shows the effect of ion concentration changes in extracellular tubular and cleft spaces ([Ca2+]t1, [Ca2+]c, [K+]t1, [K+]c) described in Figure 2 on the level of Ca2+ load in NSR ([Ca2+]NSR) and on the intracellular Ca2+-transient during a steady-state stimulation cycle at 1 and 2.5 Hz. The differences between traces representing NSR Ca2+ load and cytosolic [Ca2+]-transient in the basic model before (red lines) and after fixing all extracellular ionic concentrations at external bulk values (black lines) reflect a cumulative effect of small changes in sarcolemmal Ca2+ transport [a decrease of Ca2+ entry through ICaL and the positive part of INaCa by 4.7 amol/cycle (2.1%) and by 6.6 amol/cycle (2.2%) at 1 and 2.5 Hz, respectively] that are induced by variations of extracellular ion concentrations.
Though small, this effect shows a potential of these variations to slightly affect the Ca2+ turnover in cardiac cells at steady state. The time integral of intracellular Ca2+-transients was reduced by 2.5% and 3.4% at 1 and 2.5 Hz, respectively. A deeper analysis also showed that this effect is predominantly induced by depletions of Ca2+ concentration in the vicinity of the t-tubular membrane ([Ca2+]t1); the relative contribution of changes of [Ca2+]c, [K+]c and [K+]t1 in total was below 0.3%.
To explore the effect of Ca2+ concentration changes in t-tubules on cytosolic Ca2+-transient for potentially different combinations of critical fractions fCaL,t, fNaCa,t and fpCa,t in human ventricular cells, we performed a series of simulations enabling us to construct these relations in 3D graphs (Figure 4). The results displayed for t-tubular fraction of L-type Ca2+ channels of 0.64 {based on data from guinea-pig [18] (basic setting)} showed that, if the fraction, fpCa,t, was small (<0.2), the repeated depletions of Ca2+ in human t-tubules might result in a reduction of Ca2+-transient by 3% at resting heart rate (1 Hz) and by 4% during exercise (2.5 Hz) (Figure 4, left panel). However, increasing the t-tubular fraction of L-type Ca2+ channels to 0.8 (consistent with data from rat cardiomyocytes [19]) would lead to a reduction of Ca2+-transient by more than 4% and 5.4%, respectively, under the same conditions (Figure 4, right panel). If, in addition, the rate of Ca2+ diffusion between human t-tubules and the cleft space was made slower (τCa,ct increased from the basic value of 240 to 480 ms), this effect would further increase to more than 9% at 2.5 Hz (not illustrated). While the dependency of this effect on the value of fNaCa,t appeared to be small, high values of fpCa,t would even reverse it, as they would lead to accumulation of Ca2+ in the tubular space and, consequently, to a slight increase of the Ca2+-transient.

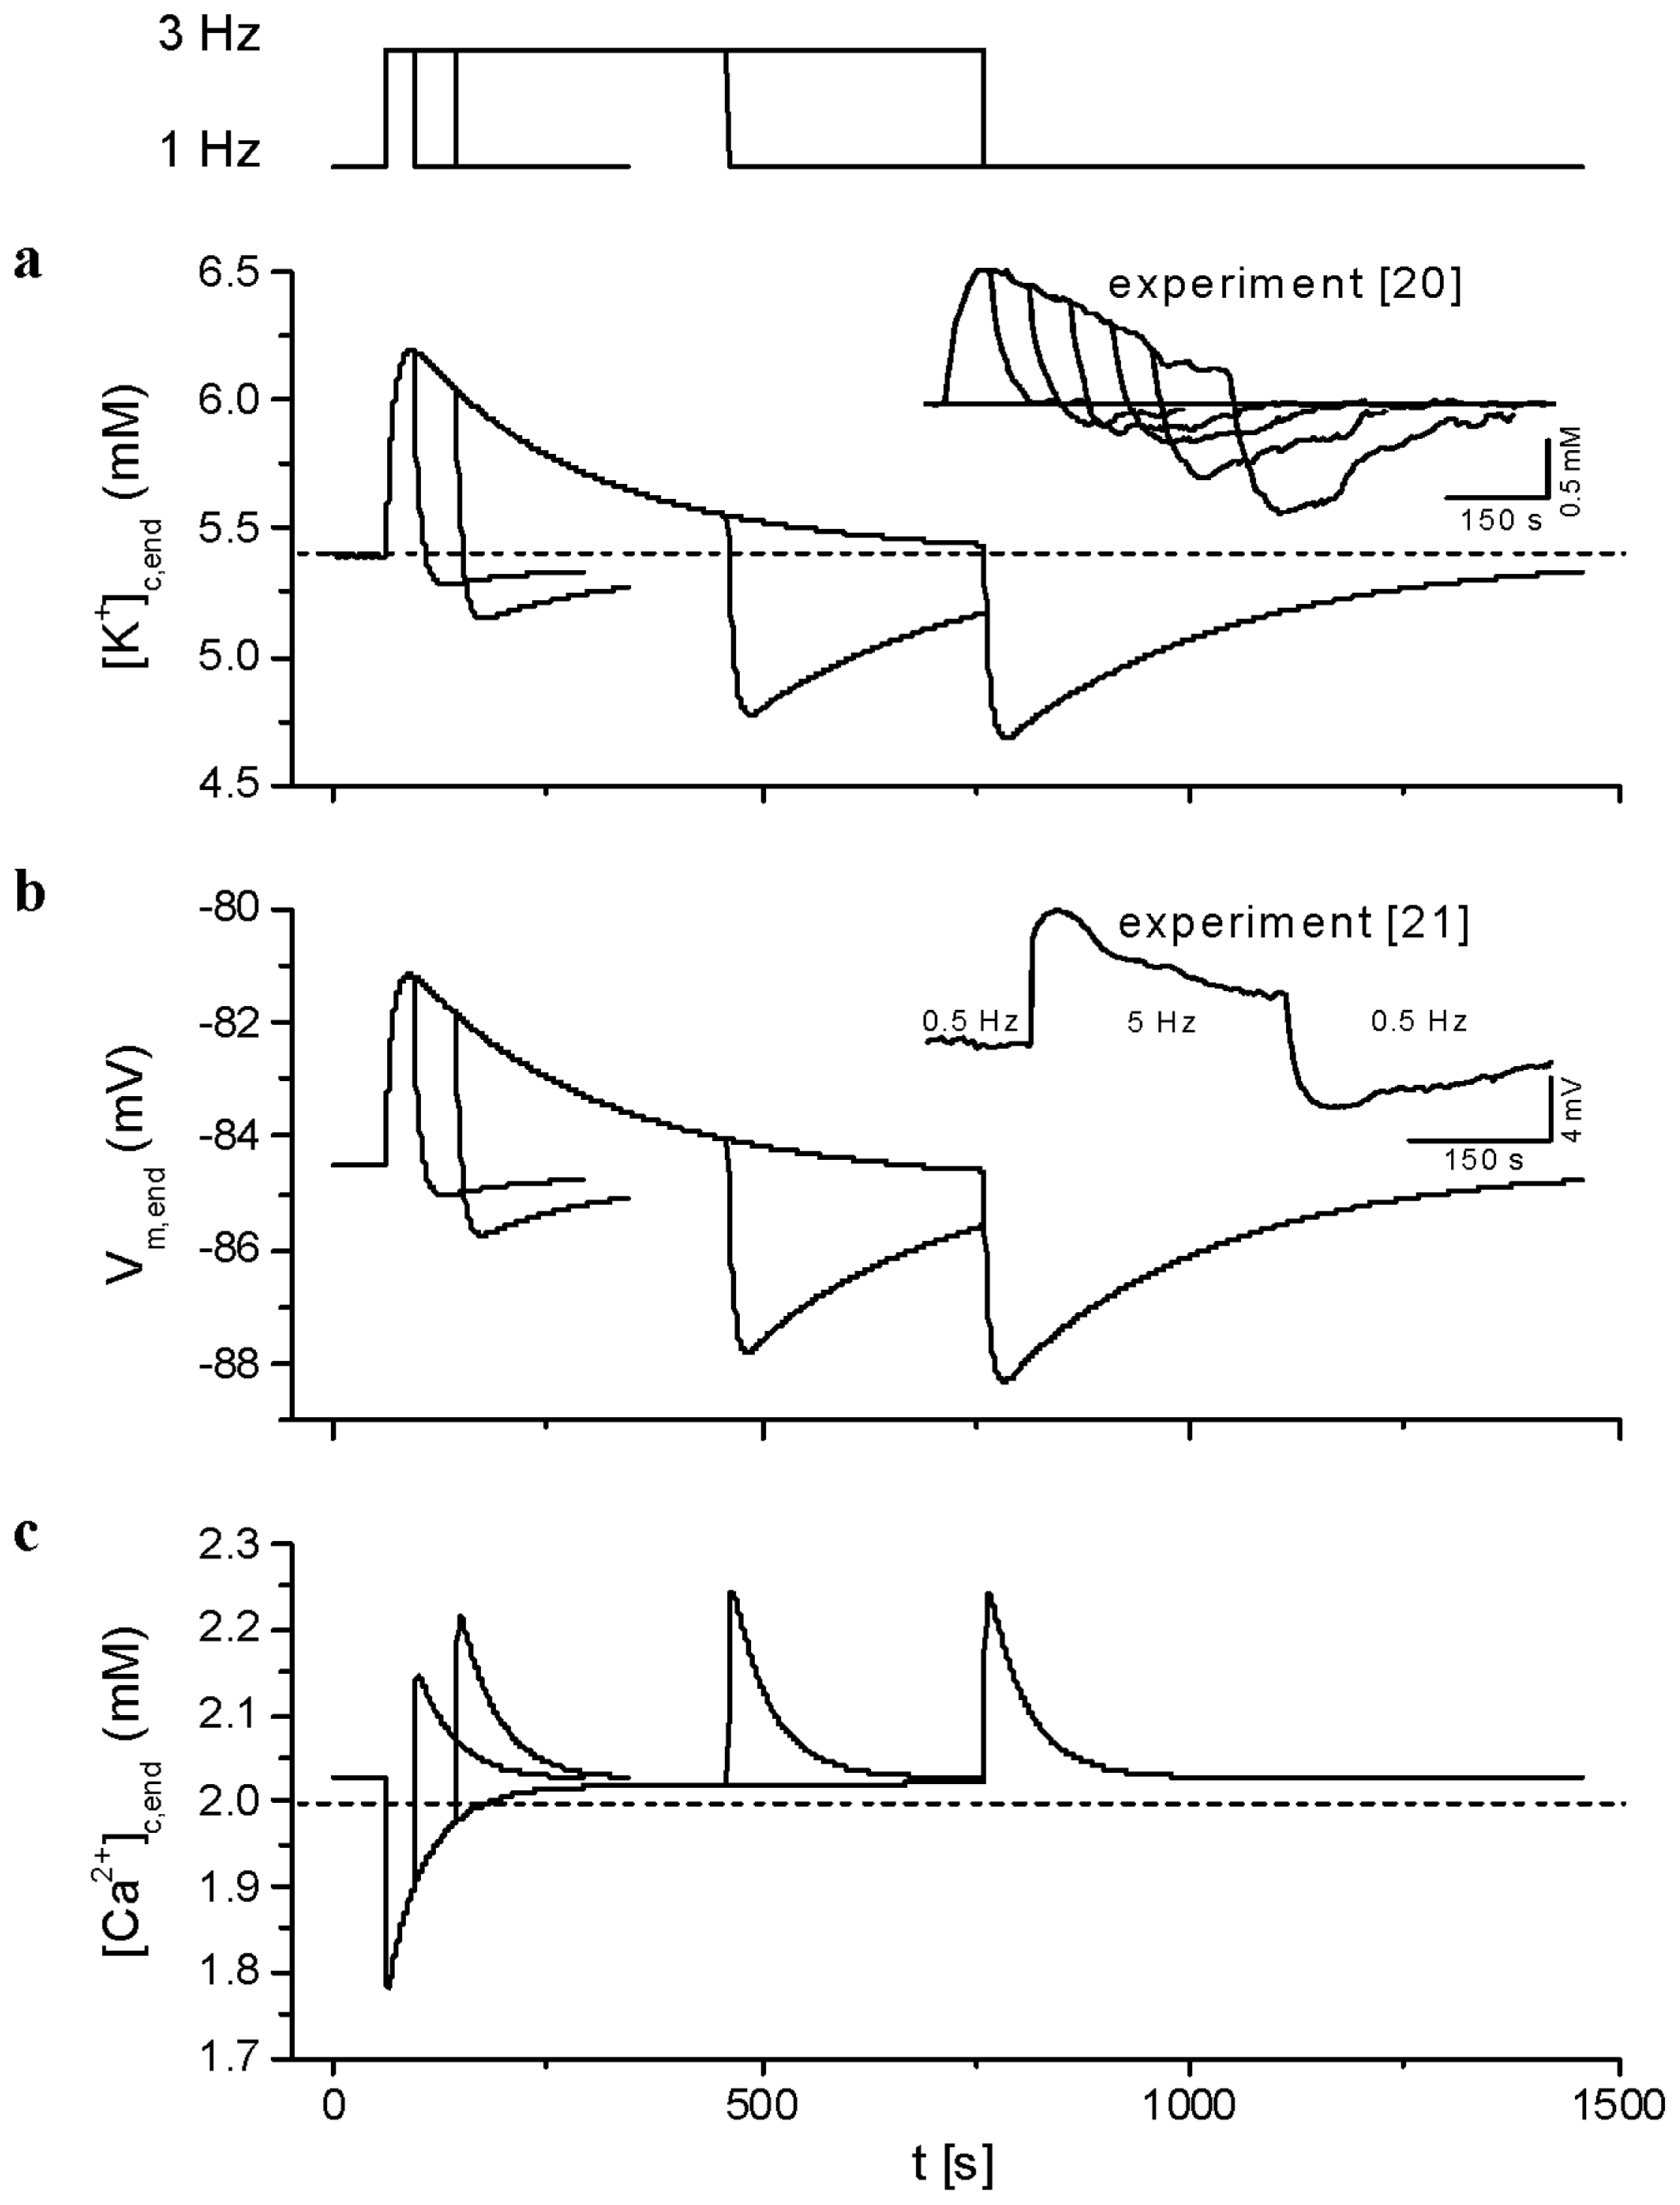
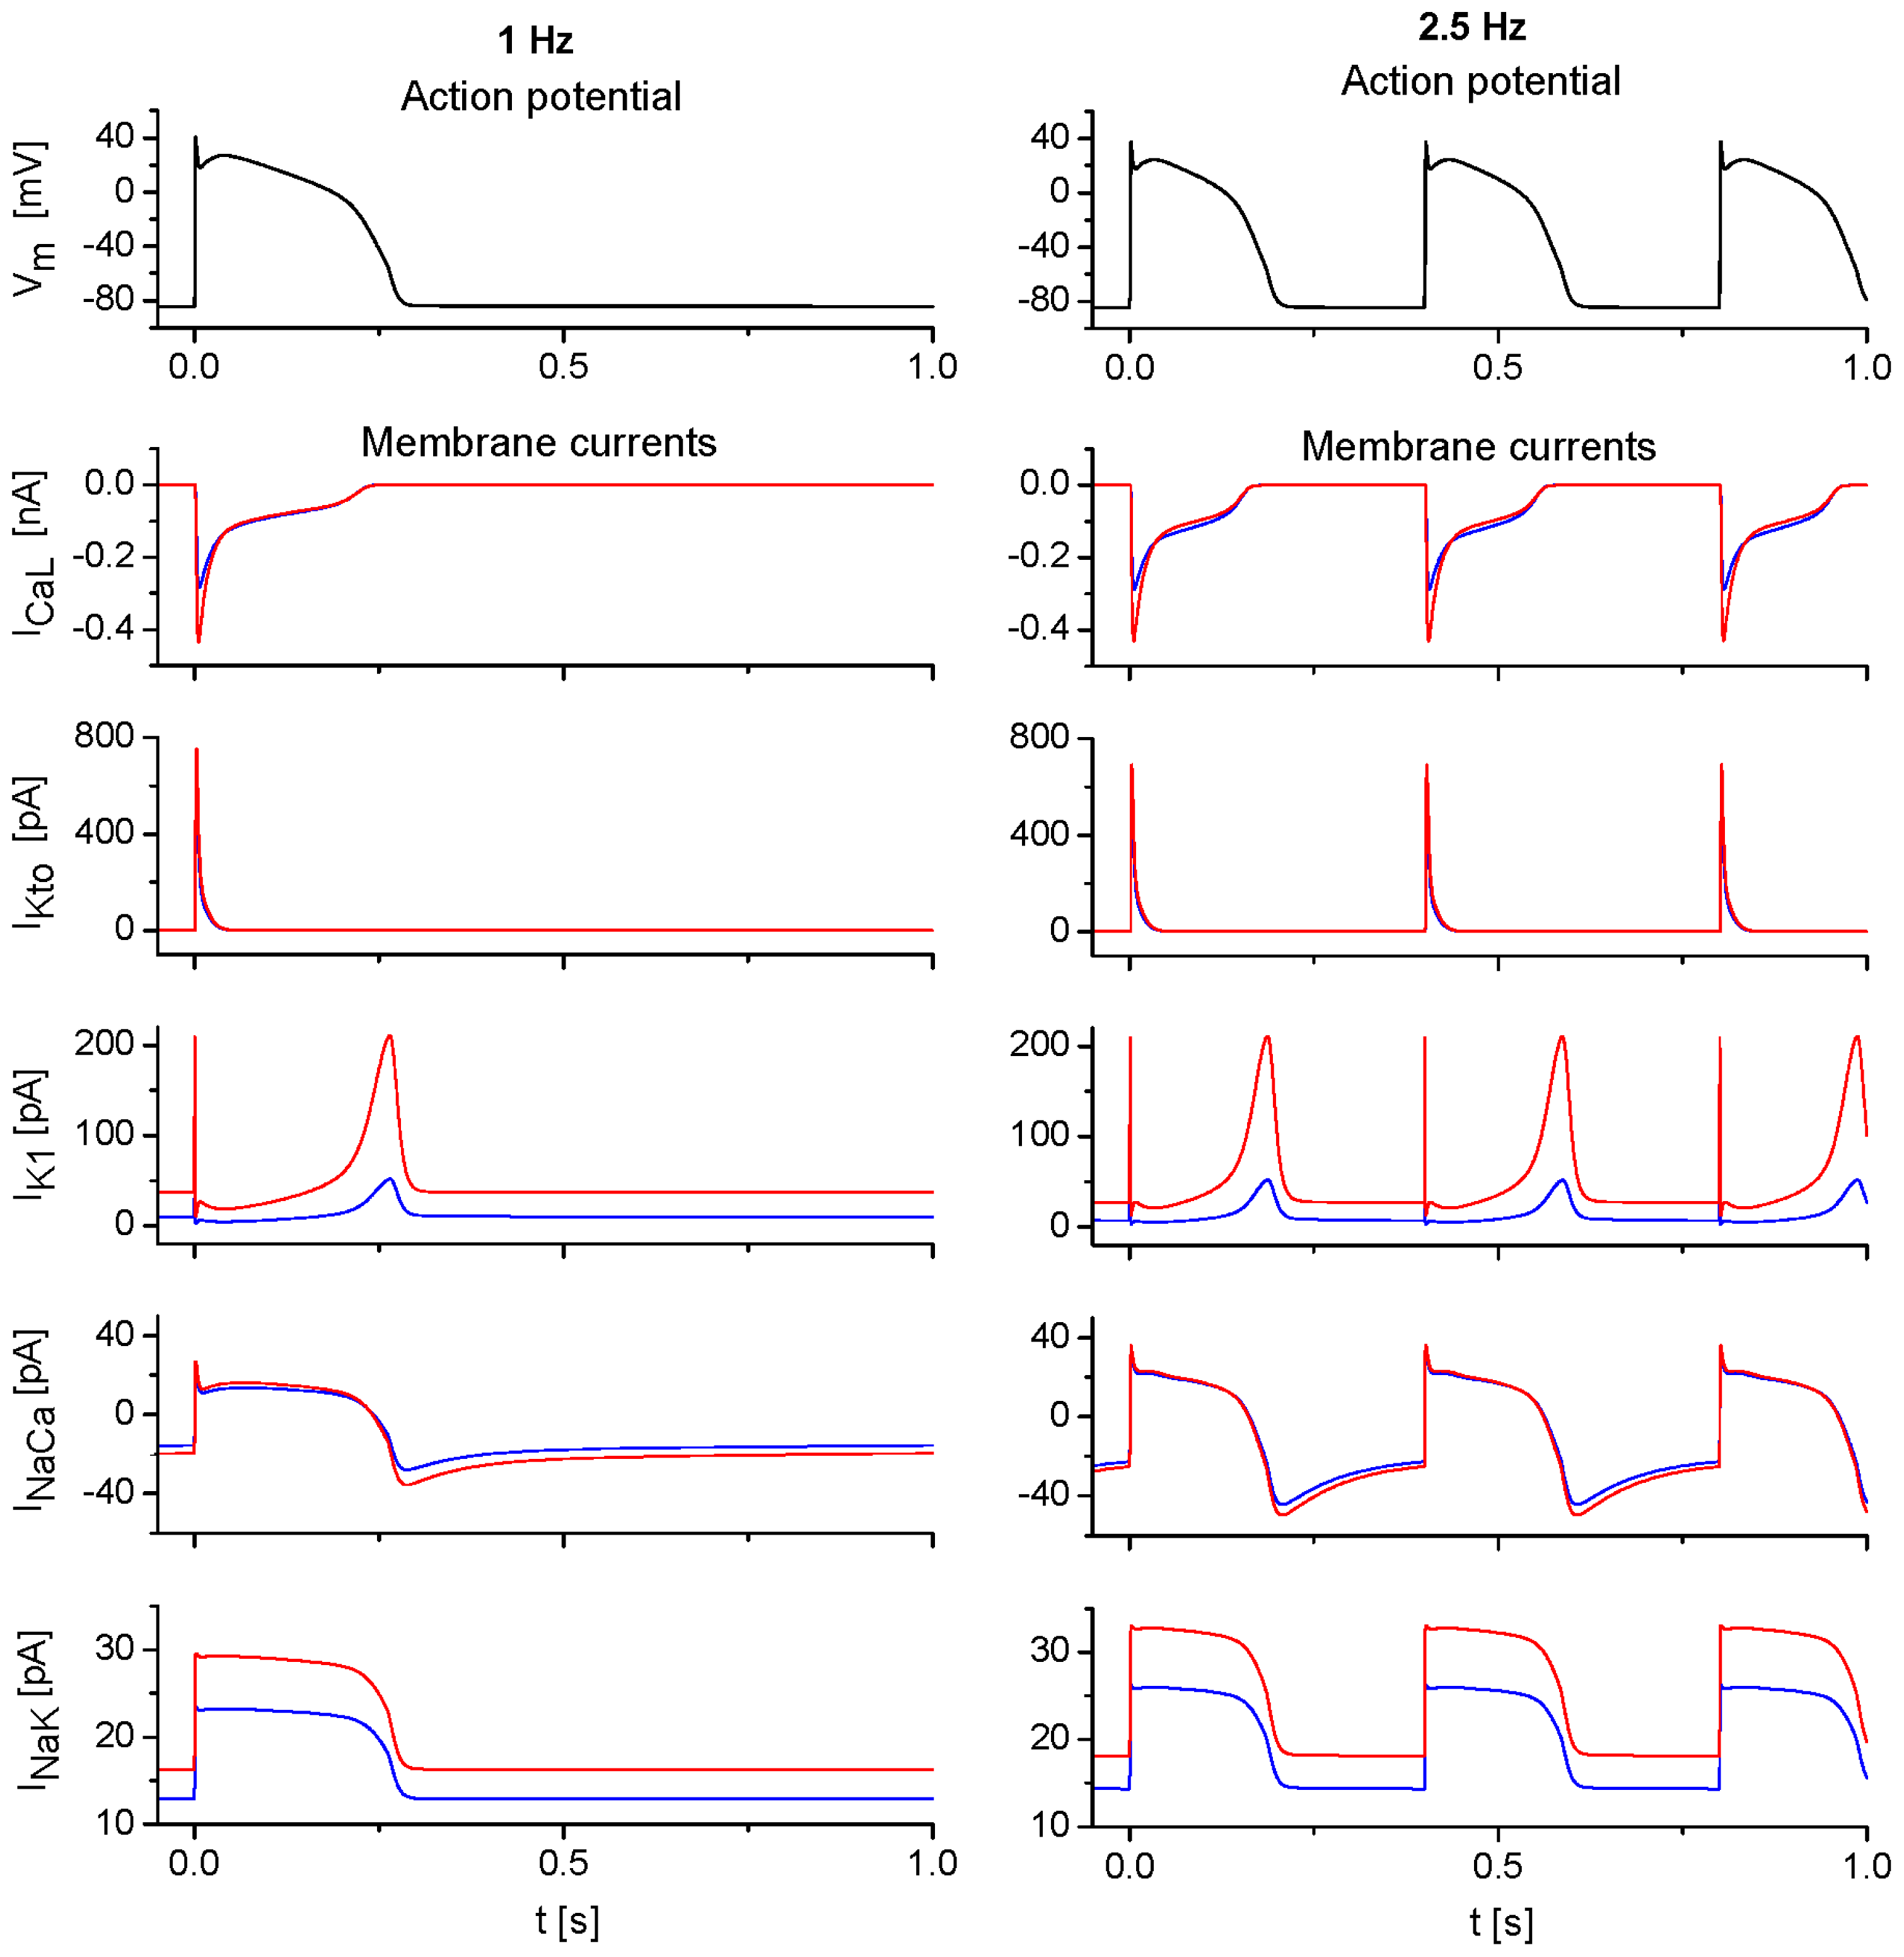
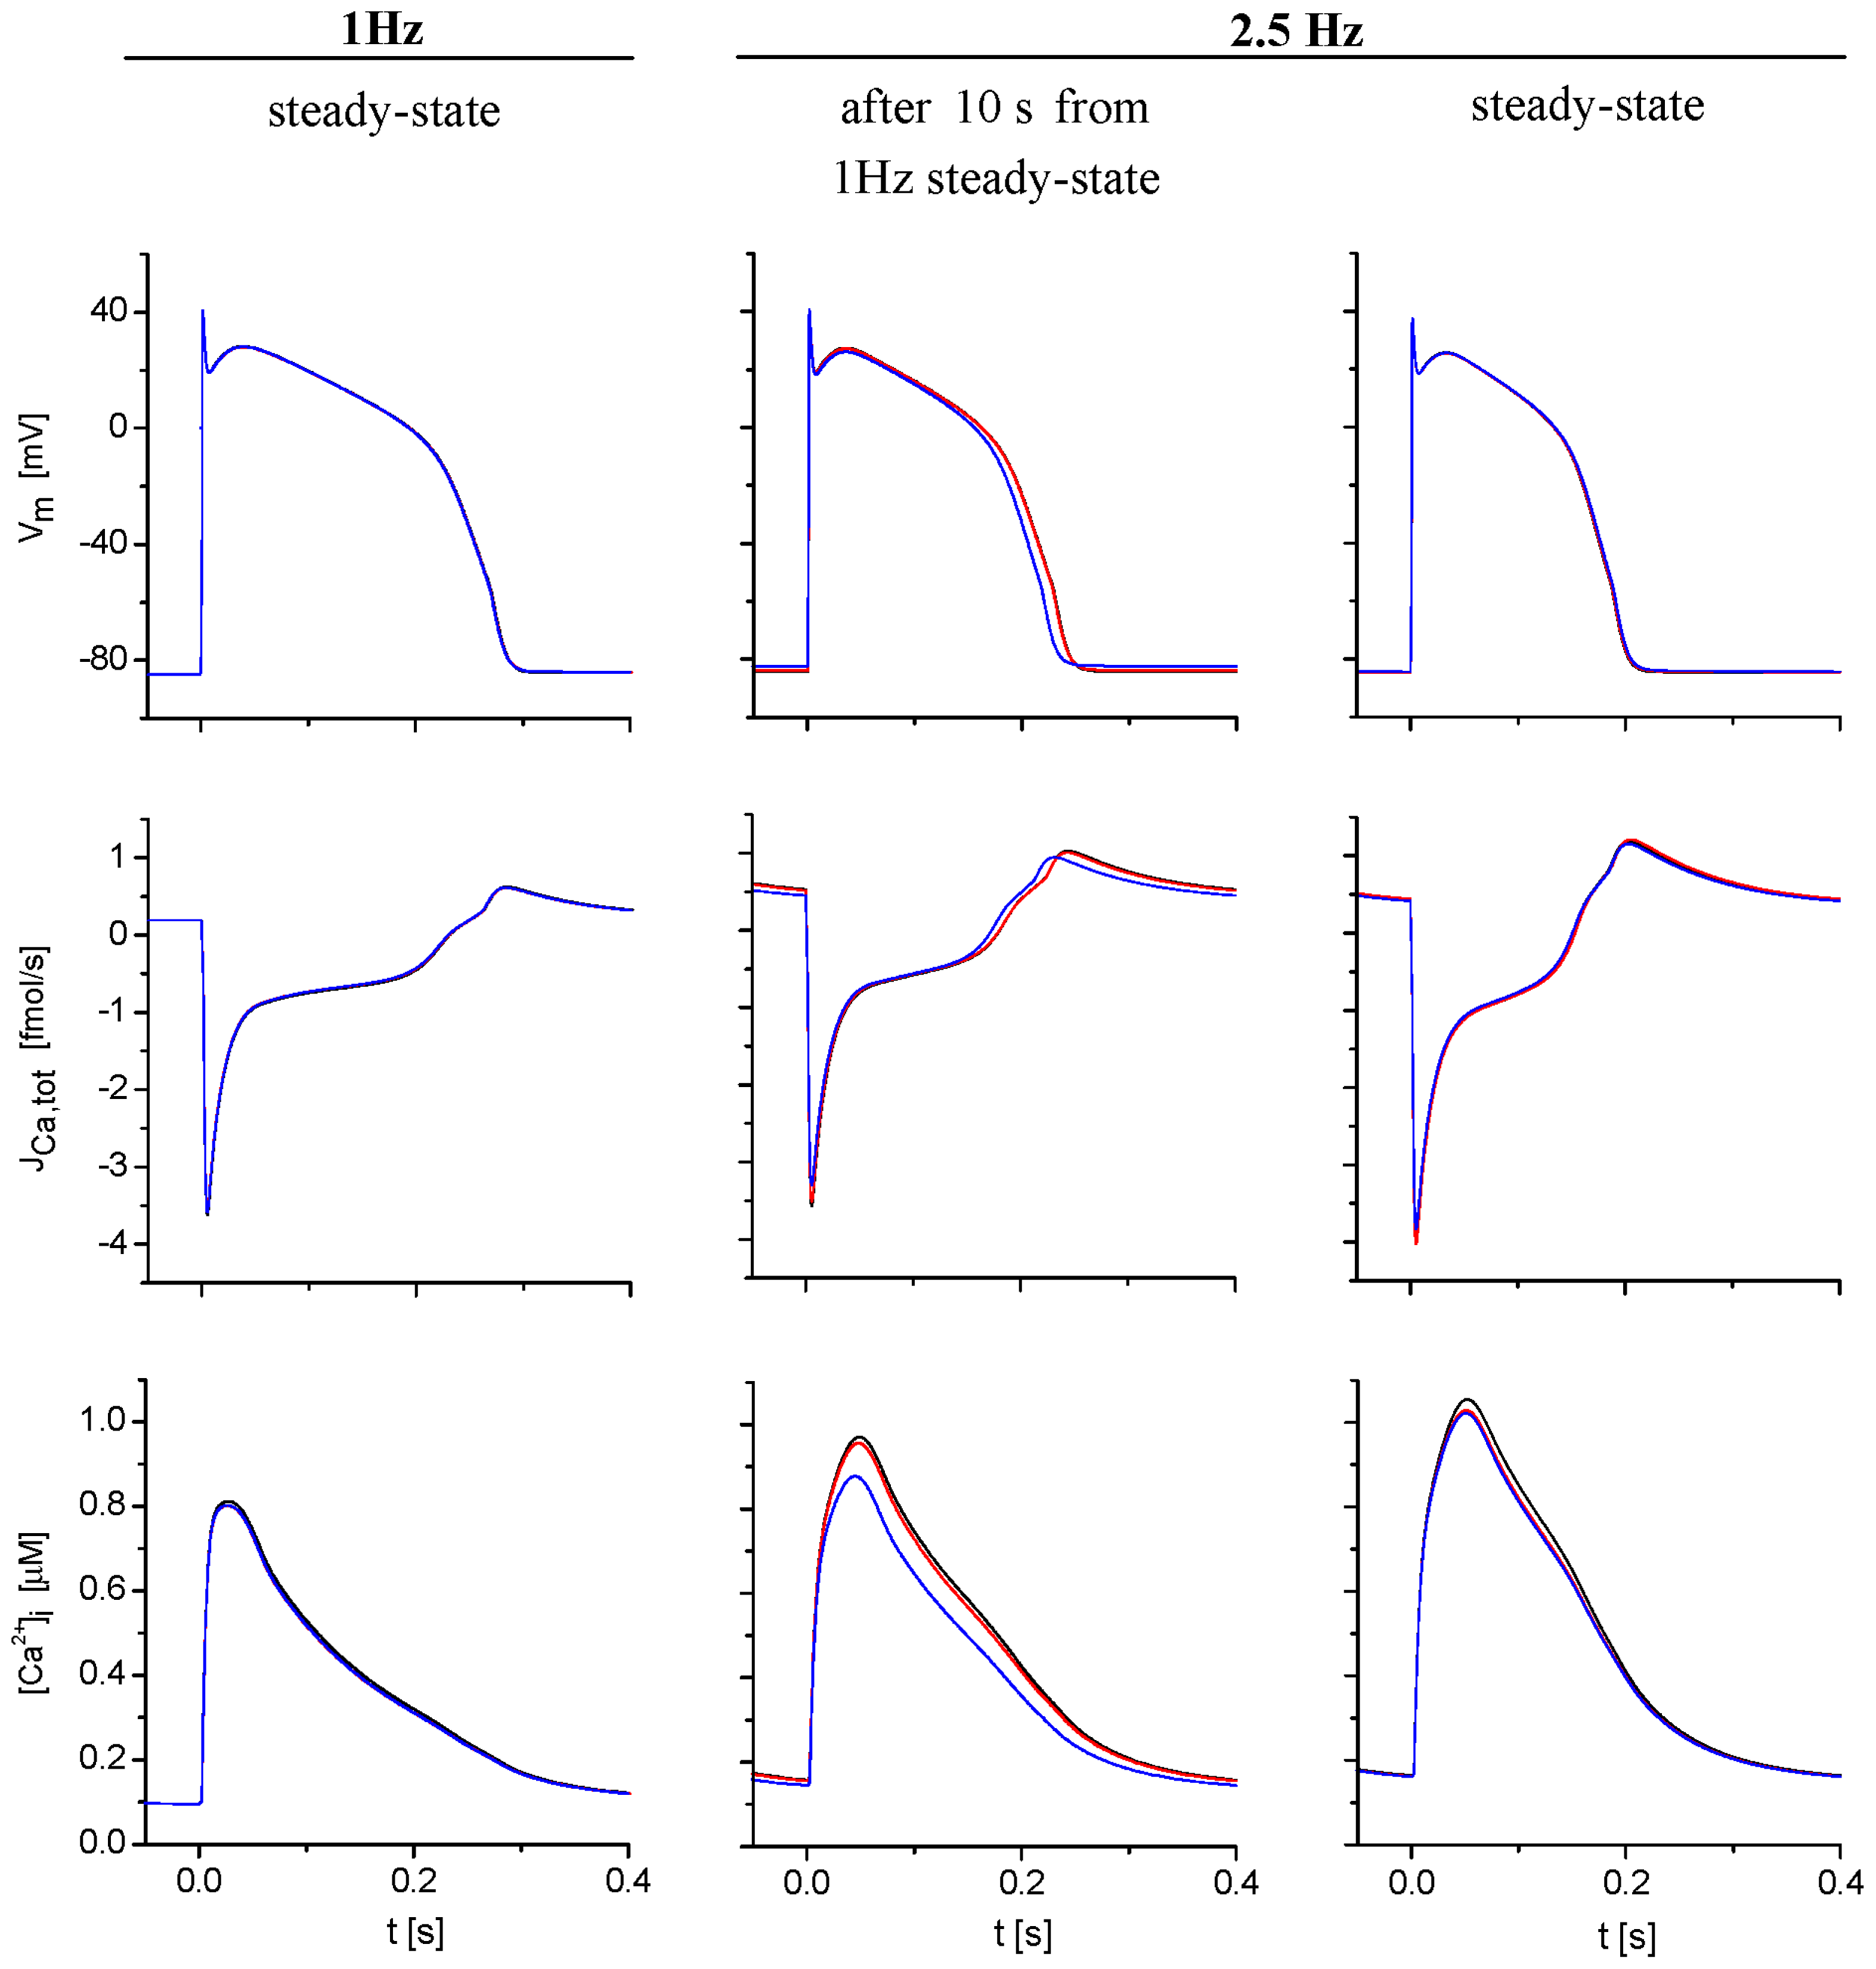
2.3. Model Responses to Sudden Changes of Stimulation Rate

Figure 5 shows the responses of the model to a sudden change of stimulation frequency from 1 to 2.5 Hz followed during 10 s (left panels) and 600 s (right panels). It demonstrates the potency of ion concentration changes in both extracellular spaces to modulate NSR Ca2+ load and intracellular [Ca2+], [Na+] and [K+] during transient events after a sudden change of stimulation frequency. The results from the basic model (blue dots) are compared with the results after fixing ion concentrations in the cleft space (red dots) or in both t-tubular and cleft spaces (black dots) at external bulk levels. The right panels illustrate progression toward the steady state in an expanded time scale.
The fast transient increase of Ca2+ flux into the cell decaying within several seconds (integral of total trans-sarcolemmal Ca2+ flux during a cycle; panel a, left) induced a marked transient reduction of mean Ca2+ concentration in the cleft space (panel b, left) that was also reflected by a similar change in the mean Ca2+ concentration in the first tubular segment (panel c, left). Note that this reduction of [Ca2+] in both extracellular spaces was substantially larger (blue dots) than the reduction of [Ca2+]t1 in the model after fixing ion concentrations in clefts space (red dots). This initial rapid reduction in extracellular [Ca2+] decays with a time constant of approximately 50 s due to equilibration between the clefts and bulk space (panels b, right, and c, right).
The consequence of such a profound transient depletion of Ca2+ in both cleft and t-tubular spaces was a parallel decrease of Ca2+ concentration in NSR and a significant reduction of cytosolic Ca2+-transient by 15% at 10 s after the onset of faster stimulation (panels d, left, and e, left). This deflection decays towards steady-state values in parallel with [Ca2+] in cleft space (panels d, right, and e, right). The slow cumulative changes in [Na+]i and [K+]i (time constant of about 250 s) related to sodium and potassium currents, Na/Ca exchange and Na/K ATPase activity are also affected by changes in extracellular Ca2+ concentrations (panels f and g). The underlying processes lead to the final steady state in which the net total transmembrane Ca2+ transport (across the surface and tubular membrane) equals zero in the course of each stimulation period [see Condition (1) in the Discussion].
These results suggest that, while the role of ion concentration changes in cleft spaces in modulating cellular electrical activity and the Ca2+-transient is relatively small at steady state, it becomes important during perturbations, due to a change in stimulation frequency. This is illustrated in Figure 6 showing APs, Ca2+ flow through sarcolemma and [Ca2+]i-transient at a stimulation frequency of 1 and 2.5 Hz under conditions of free running and fixed extracellular concentrations. Steady-state differences in the course of AP were negligible, and changes in [Ca2+]i-transient were small at any frequency. In contrast, both quantities were markedly affected 10 s after a sudden change of stimulation rate from 1 to 2.5 Hz. APD90 (the duration of the action potential at 90% repolarization) was reduced by 13 ms in accordance with a decreased influx of Ca2+ ions in the course of AP. [Ca2+]i-transient dropped by 15%. If the stimulation frequency returned from 2.5 to 1 Hz, the opposite deviations in AP and [Ca2+]i-transient appeared (not shown).
To verify the ability of our model to reproduce the changes in [K+] and [Ca2+] in the clefts that were documented in the literature, we simulated, from steady-state stimulation at 1 Hz, the application of a train of stimuli at 3 Hz for durations from 34 up to 700 s and a subsequent return to 1 Hz for 700 s.
Figure 7 shows the end-diastolic values of K+ and Ca2+ concentrations in the cleft space ([K+]c,end and [Ca2+]c,end) and the end-diastolic values of resting transmembrane voltage (Vm,end) at the peripheral membrane. During the train of stimuli applied at 3 Hz, K+ accumulation was taking place initially with a time constant of 10 s and peaked at 0.8 mM above the initial level of 5.41 mM at 1 Hz. While the stimulation train was continued, it thereafter decayed with a time constant of 214 s toward the initial level at 1 Hz. A similar time course was observed for the K+ depletion upon returning to 1 Hz stimulation. In addition, the peak level of [K+]c,end during the depletion depended on the duration of the stimulation train at high frequency.
These features compare well with the measurements of interstitial [K+] done with a K+-selective microelectrode by Kunze [20]. Another feature of Kunze’s data that was well reproduced in our model is that the peak magnitude of the K+ depletion upon returning to 1 Hz depended on the duration of the stimulation at 3 Hz.
Changes in the membrane voltage closely paralleled the kinetics of [K+] changes in the clefts: the membrane was depolarized during K+ accumulation and hyperpolarized during K+ depletion, by about 4 mV. The onset of the depolarization at the application of 3 Hz stimulation and that of the hyperpolarization upon returning to 1 Hz stimulation were as fast as from the microelectrode recordings of Attwell et al. [21]. After the peak, the time courses of the subsequent decay of the depolarization or of the hyperpolarization were comparable to those of the membrane voltage signal in [21] and of the [K+] signal in [20]. Thus, the cumulative K+ accumulation and membrane depolarization measured at the end of diastole in the model during a high frequency stimulation train are comparable to published data, given the differences with our modelling: (i) unlike Kunze’s and Attwell et al.’s data, which were recorded in the atrial tissues of rabbit and guinea-pig, respectively, our model is designed for human ventricular cells; and (ii) the tissues were not perfused, whereas our model assumes an infinite volume of the bulk solution, which is equivalent to a perfect perfusion.
In our simulations, the reduction of [Ca2+]c,end at the beginning of the 3 Hz stimulation train was fast and amounted to 0.25 mM (Figure 7). Subsequently, cleft [Ca2+] decayed with a time constant of 46 s, while the model cell was still stimulated at 3 Hz. In addition, our simulations show that, upon returning to 1 Hz, a transient accumulation of Ca2+ took place in the cleft space with a very similar time course as the former depletion. This compares well with Ca2+ depletion measured in the perfused right ventricular tissue of rabbits (amounting to 0.3 to 0.5 mM) reported by Hilgemann and Langer [22] in a train of eight stimulations at 0.5-s intervals applied from rest.

3. Discussion

This study demonstrates that ion concentration changes in the t-system of human cardiomyocytes, though small compared to those observed in skeletal muscle [23,24], are not negligible and should be considered in a detailed description of a human ventricular myocyte as a factor contributing to the control of Ca2+ turnover and cardiac contraction. This confirms our previous results from simulations in models of animal cardiac ventricular myocytes of guinea-pig [14] and rat [16]. In addition, [Ca2+] changes occurring in the limited space of t-tubules are potentiated by [Ca2+] changes in the intercellular clefts, primarily during transients caused by changes in stimulation frequency.

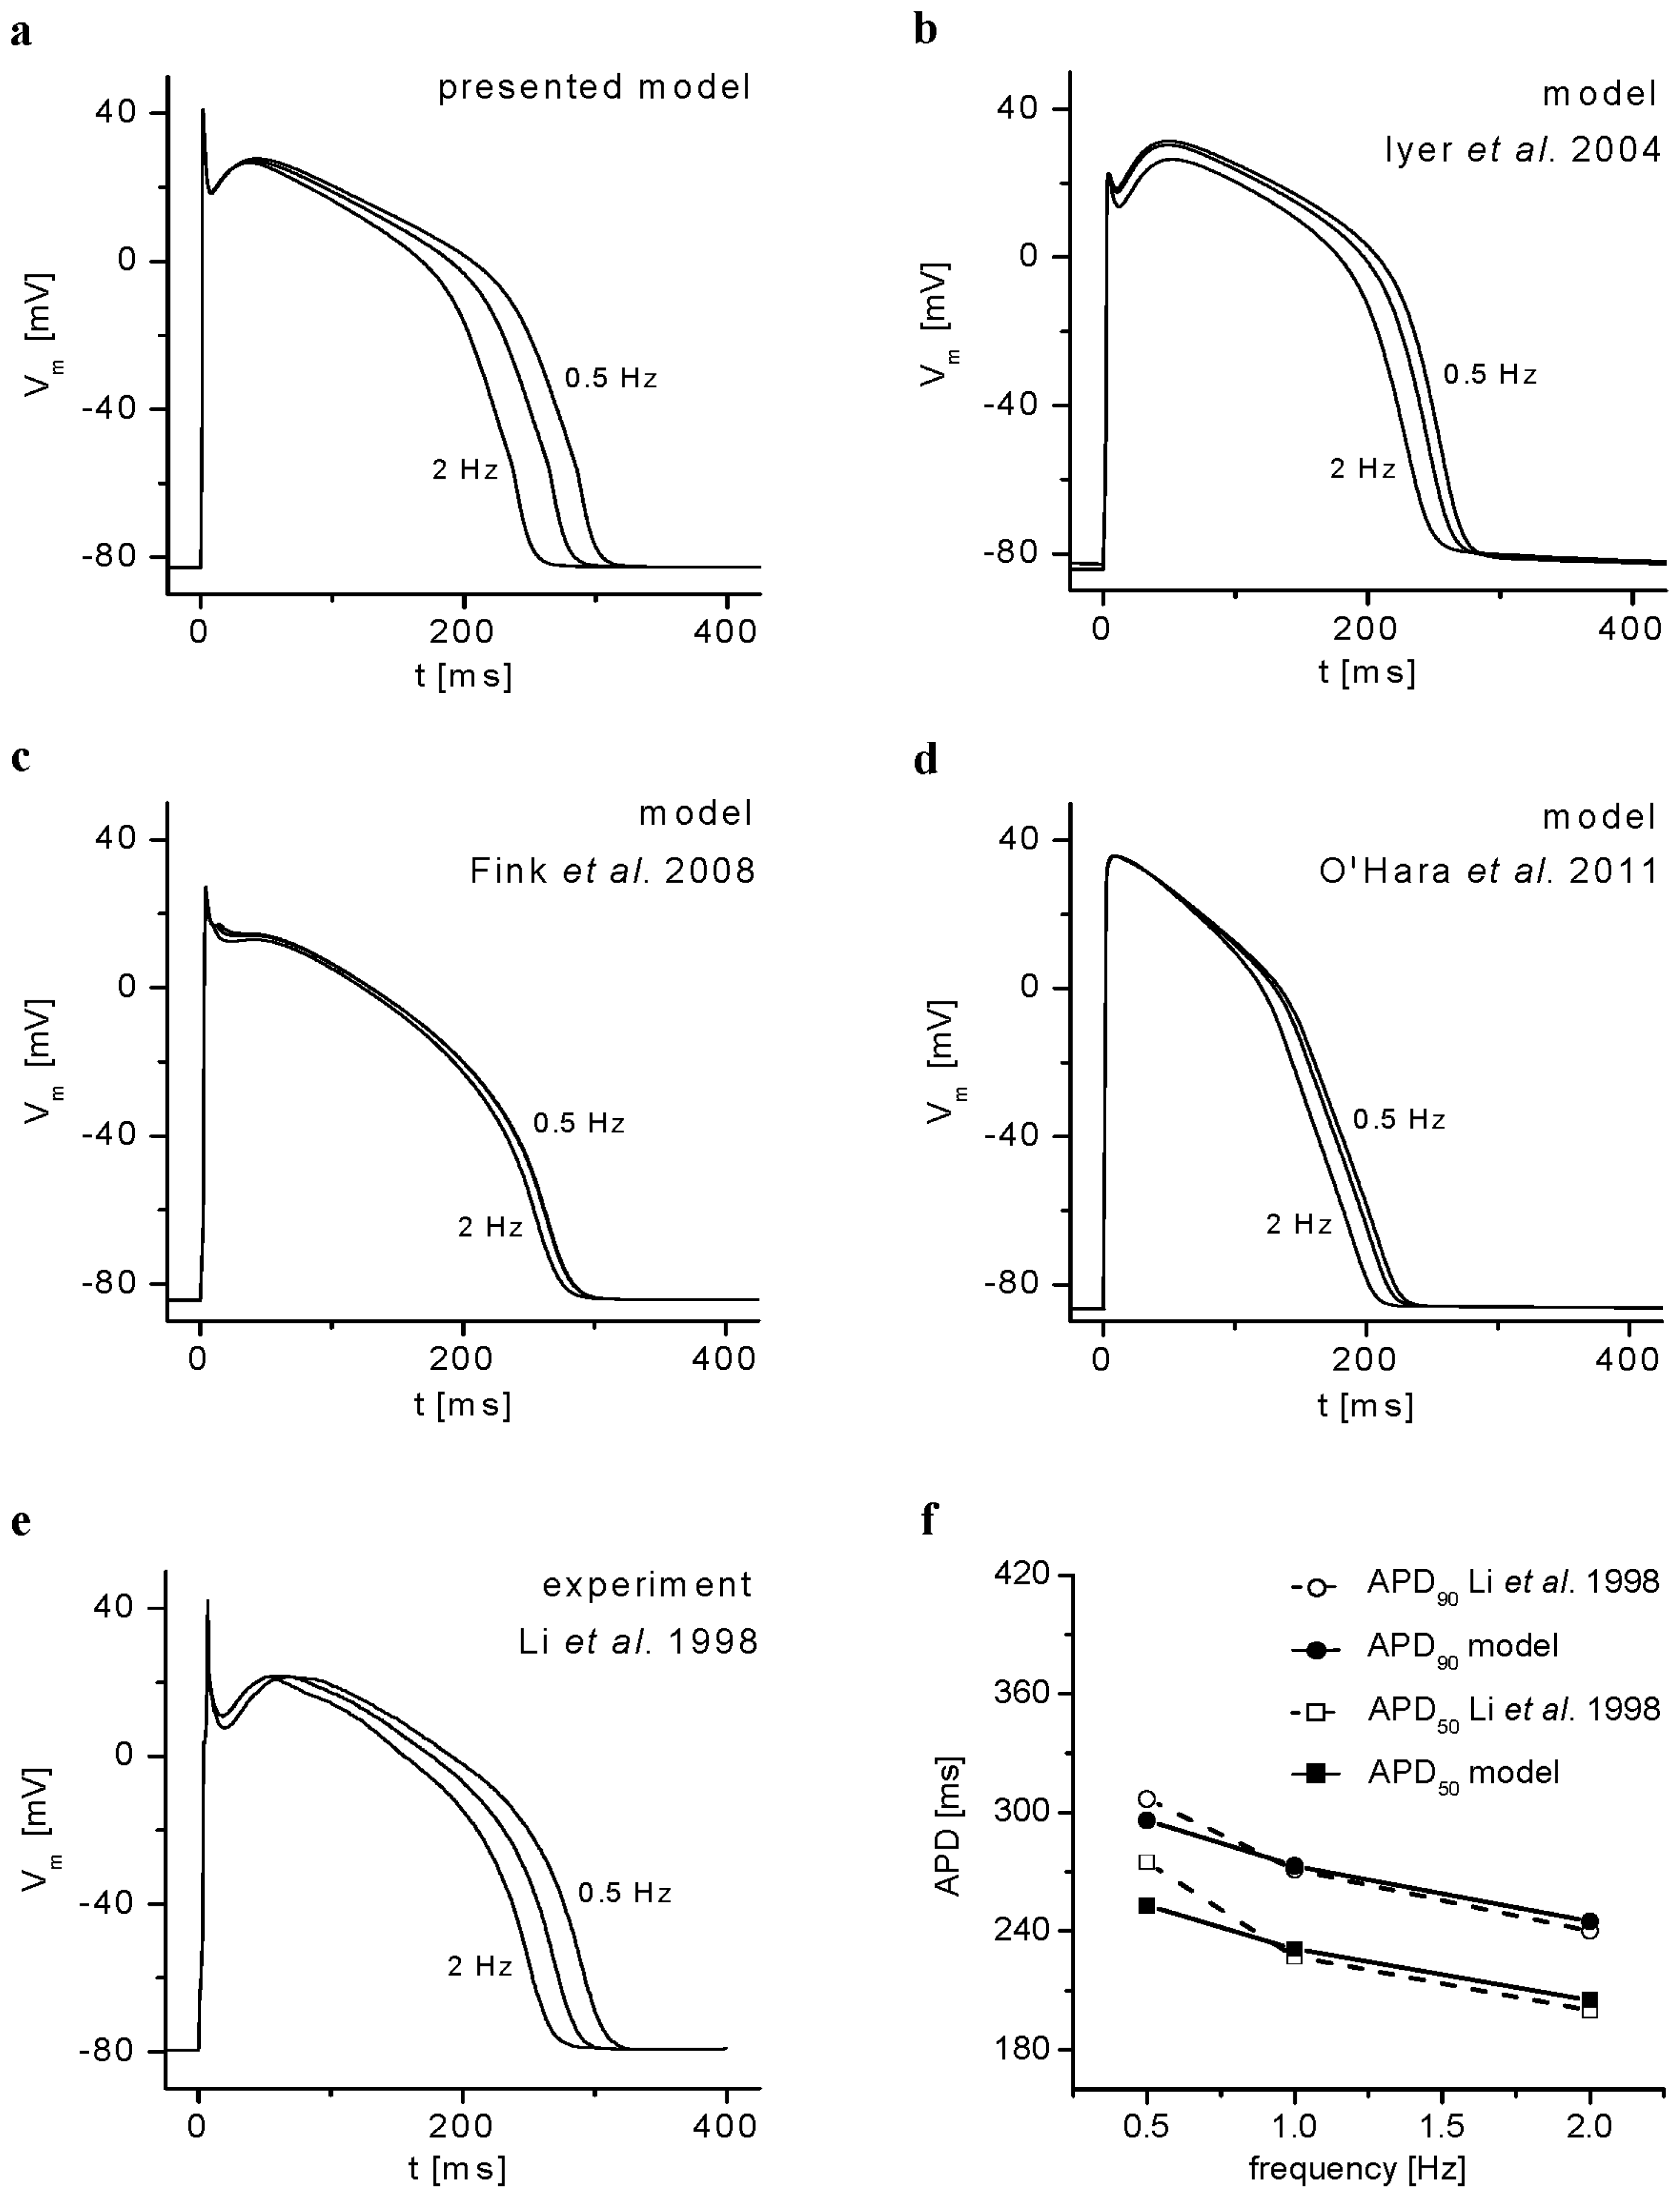
3.1. Validation of the Model

The ability of the present model to simulate changes of APs recorded in experiments in human cardiomyocytes at different stimulation frequencies [25] is demonstrated in Figure 8. This frequency dependence of APD was shown to be associated primarily with modulation of ICaL[26]. For the sake of comparison, we reconstructed the frequency dependence of AP configuration also by using three other models of human ventricular myocytes recently published by Iyer et al. [5], Fink et al. [6] and O’Hara et al. [8]. To strictly meet the experimental conditions specified in [25], we applied only 15 stimulation pulses, and [Na+]i and [K+]i were fixed at 10 and 130 mM, respectively (ion concentrations used in the pipette solution). Surprisingly, the frequency-dependent changes of AP duration in the models ([6] and [8]) were quite small. Larger changes in AP duration could be observed in these two models only when a substantially higher number of stimulation pulses were applied (e.g., 300 pulses) and when the simulations were done without fixation of [Na+]i and [K+]i.
The ability of our model to simulate the frequency-dependent changes of intracellular ion concentrations measured in human preparations by Schmidt et al. [27] ([Ca2+]i) and Pieske et al. [28] ([Na+]i) is illustrated in Figure 9. The data are normalized to the values at 1 Hz. The resting value of [Ca2+]i in our model (63.6 nM) agrees well with the experimental data of Beuckelmann et al. [29], and that of [Na+]i (9.3 mM) is in the range of the experimentally observed values of Pieske et al. [30].

3.2. Conditions of Model Stability

The model showed long-term stability, as demonstrated in Figure 11. For all types of ions, the conditions of stability required that, at steady state, the net amount of substance transferred across the cell membrane during one period (T) at any frequency equaled zero. Particularly for calcium ions, this condition can be expressed as:
n Ca , net , s + n Ca , net , t = 0
where nCa,net,s and nCa,net,t denote net amounts of Ca2+ ions transferred during each stimulation period, T, across the surface and the t-tubular membrane, respectively. They can be expressed as the time integrals of fluxes JCa,net,s and JCa,net,t over the stimulation period (T) or as a sum of integrals of all ionic currents taking a share in transmembrane Ca2+ transport through each membrane pool.
n Ca , net , t = T J Ca , net , t = 1 2 F T ( I CaL , t - 2 I NaCa , t + I Cab , t + I pCa , t ) d t n Ca , net , s = T J Ca , net , s = 1 2 F T ( I CaL , s - 2 I NaCa , s + I Cab , s + I pCa , s ) d t
All currents transporting Ca2+ across both membrane systems are modulated primarily by changes in [Ca2+]i, but, to a certain degree, also by changes in [Ca2+]t and [Ca2+]c. Those modulations represent a complex feedback system maintaining SR Ca2+ load and, hence, the magnitude of the [Ca2+]i-transient, at a level that guarantees steady-state Condition (1) at any frequency. During a transient (evoked, e.g., by a stepwise change in stimulation frequency), Condition (1) is disturbed, until a new steady state is attained.

3.3. The Effects of Extracellular Ion Concentration Changes Under Steady-State and Non-Steady-State Conditions

Under steady state at any frequency, the mean ion concentrations in the intercellular clefts are equilibrated with concentrations in the bulk. Not surprisingly, inclusion of the clefts into the model only minutely affected the simulated results of intracellular Ca2+ concentration changes ([Ca2+]i and [Ca2+]NSR) at steady state (Figure 3). When exploring steady-state effects in the model, ionic currents and the quantities describing Ca2+ turnover remained practically unaltered when ionic concentrations in the intercellular clefts were fixed at bulk concentrations (not illustrated). In contrast, in the t-tubules, the mean Ca2+ concentration differs from the bulk concentration as a consequence of the sustained flux, JCa,net,t (cycling between the tubular and surface membrane [16]). In addition, activity-induced steady-state oscillations in the clefts are relatively small as compared to those in the t-tubular lumen (Figure 2), due to the larger volume of the intercellular cleft and the smaller Ca2+ channel density at the surface membrane. Thus, the currents mediating transmembrane Ca2+ movements in the course of each cycle at steady state are more affected by a depletion of extracellular Ca2+ (which reaches a maximum within one cycle during activation of ICaL) at the t-tubular membrane than at the surface membrane.
Although the fractions of the main ion transporting proteins localized in the tubular membrane have been quantified in some experimental animals (for reviews, see [31,32]), similar data related to human cardiomyocytes are still missing. Therefore, we investigated a possible influence of varying the fractions of Ca2+ transporters in the t-tubular membrane on the modulation of intracellular Ca2+-transient (represented by Δ[Ca2+]i,area,rel). The graphs in Figure 4 demonstrate the steady-state effect for two values of fCaL,t assessed in guinea-pig (0.64) and rat (0.8) cardiomyocytes. As ICaL,t causes Ca2+ depletion in the t-tubules, it is not surprising that a higher fCaL,t corresponds to a lower amount of Ca2+ in the intracellular compartments reflected by Δ[Ca2+]i,area,rel. Conversely, raising fractions fNaCa,t and fpCa,t attenuates changes in Cai-transient, because INaCa,t and IpCa,t tend to enhance the mean value of [Ca2+]t. The simulations suggest that the changes in intracellular Ca2+-transient may be significant if, simultaneously, fCaL,t was high (≥0.6) and fpCa,t low (≤0.2).
In contrast, under non-steady-state conditions, when sudden changes in heart rate were simulated, the intercellular cleft space significantly affected Ca2+ handling and APs (Figures 5 and 6). This was caused by a significant transient depletion of extracellular Ca2+ concentrations in the cleft space and, consequently, in t-tubules. This process resulted from the initial fast increase of Ca2+ input into the cell (within several stimuli), since, during each shortened stimulation period after transition to 2.5 Hz, Ca2+ input via ICaL transiently exceeded Ca2+ output via INaCa and IpCa. Restoration of equilibrium between the clefts and the bulk space required tens of seconds.
Transient accumulation of extracellular K+ in response to sudden changes of stimulation frequency (Figure 7) was evidenced as parallel changes in resting membrane voltage in agreement with experimental results [21]. It also played a role in the reduction of Ca2+-transient (not shown), but its effect was substantially smaller than the effect of Ca2+ depletions. The effects of minute relative variations of [Na+]i were negligible.

3.4. Cardiomyopathies Alter the Function and Structure of Tubular System

As documented by numerous studies, cardiac diseases, like ischemic or dilated heart failure, affect the structure and function of the t-tubular system, both in animal [3335] and human cardiomyocytes [3638] (for a review, see [39]). The myocardial remodeling includes a reduced number of t-tubule openings [38,40], altered geometry (diameter and length) [36,41] and redistribution of ion transporting proteins between the surface and tubular membrane, namely L-type Ca-channels and Na/Ca-exchange proteins [42]. As a consequence, alteration in Ca2+ turnover and EC coupling can be expected. Intercellular clefts can also be modified by, e.g., hypertrophic cardiomyopathy [43].
The purpose of the present model study was to estimate the impact of ionic changes in extracellular spaces on APs, ionic currents and intracellular Ca2+ handling in normal human cardiomyocytes at different frequencies. Our aim in a future work will be to utilize the present model to investigate the consequences of the above-mentioned changes of ion concentrations in extracellular spaces occurring under pathological conditions.

3.5. Limitations of the Study

3.5.1. Inhomogeneities Along the T-Tubules

The distribution of ion channels along the t-tubules is considered uniform in our model. However, the tubular system comprises both transverse and longitudinal extensions, and ion channels are probably unevenly distributed among these two membrane pools [17]. Further, channels are likely clustered in specialized regions [44]. The concentration of Ca2+ channels, at the limited region of the t-tubules that contribute to the dyads, would result in larger local depletions in luminal Ca2+, as modeled using partial differential equations [45].

3.5.2. Deformation of the T-Tubules

Deformation of the t-tubules during activity [46] is likely to modulate the magnitude of ionic currents through mechano-sensitivity. In addition, the t-tubules’ diameter is narrowed under high blood pressure or under contracture [47]. Such a change in volume during a cardiac cycle would cause fluid exchange between the t-tubule lumen and the interstitial space and help in damping concentration changes. The magnitude of this effect still remains to be evaluated for human ventricular myocytes.

3.5.3. Cellular Subtypes and Regional Variations
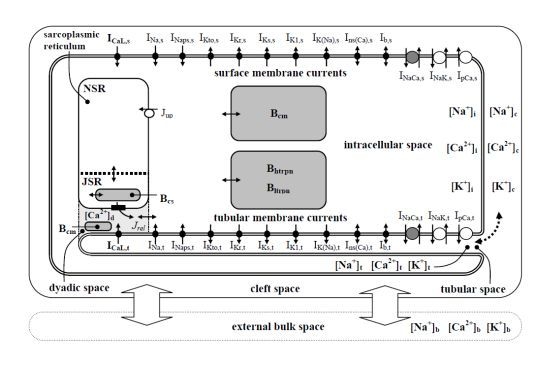
Subtypes of ventricular cardiac myocytes (epicardial, mid-myocardial or endocardial) with different ion channel densities were not considered in our study, as their description in human cardiac ventricular myocytes is not fully documented. It was also shown that the amount of t-tubules-SR junctions (but not the volume fraction of t-tubules) varied among different regions of rabbit ventricular myocardium that displayed a difference in AP configuration [48,49]. For these reasons, this study did not aim to provide a precise quantitative view of the behavior of human cardiac cells, but rather, an average representation that will be refined when a more detailed description of human ventricular cells and tissue becomes available.

4. Methods

The structure of the model (Figure 10) is similar to that of our recent models incorporating t-tubules. From the two existing species-specific models including t-tubular spaces (rat [16] and guinea pig [14]), the properties of guinea pig cardiomyocytes are nearer to the human one. Therefore, we started with our guinea pig model that we then modified, with respect to the recently published morphological data [5,15], the known properties of ion transfer mechanisms [4,5], the configuration of action potentials (APs) [25] and the changes of intracellular ion concentrations in human ventricular cardiomyocytes [27,28].
The principal modifications include: (i) replacement of the description of INa, ICaL and IK1 by the formulations used by Iyer et al. [5] and those of IKr, IKs and IKto by the simpler formulations of Ten Tusscher et al. [4]; (ii) reformulation of intracellular Ca2+ handling mainly on the basis of its description in [5]; (iii) partitioning of t-tubular space along its radius into nine concentric cylindrical segments [16] and readjustment of geometrical parameters of t-tubules to meet the recent experimental data from human hearts [15]; and (iv) formulation of a single-layer cleft space and ion exchange with an external bulk space on the basis of the data in [2].
Because of the paucity of experimental data from human ventricular myocytes, the time constants describing ion exchange between t-tubular and cleft spaces and also t-tubular fractions of ion transporters related to INa, ICaL, IK1 and IpCa were preliminarily set to be consistent with data obtained from guinea-pig [14]. The t-tubular fractions of other transporters were set to 0.56 (the fraction of membrane area in t-tubules) on the assumption of their uniform density over the whole cell membrane. The model using these settings is referred to as the “basic model” in the text. Some parameters, so far undefined for human ventricular myocytes, such as tubular fractions of L type Ca2+-channels (fCaL,t), Na+-Ca2+ exchangers (fNaCa,t) and the sarcolemmal SR Ca2+ pump (fpCa,t), were, however, considered as variable in some simulations to evaluate their importance. All details related to the development of the model and its full mathematical description are given in the Supplementary Information (model parameters are summarized in Figure S1 and Tables S2–S10).
The model was implemented in MATLAB 7.2 (MathWorks, Natick, MA, USA), and the numerical computation of the system of 98 nonlinear differential equations was performed using the solver for stiff system ODE-15s. The stability of the model with time is demonstrated in Figure 11. To achieve steady states in Figures 14, the model was run for 1200 s at each stimulation rate.
To compare the model results with the behavior of other models of human ventricular cells published so far [5,6,8], we used the computational environment for cellular modelling, COR v. 0.9.31.1409 (Dr. Alan Garny), and the available CellML codes of the models.

5. Conclusions

The available data related to human cardiac ventricular cells were used to design the first mathematical model of human ventricular cardiomyocyte incorporating t-tubular and intercellular cleft spaces. The model was used to study the physiological consequences of activity-related ion concentration changes in these extracellular spaces. Some of them (particularly, the changes of the intracellular Ca2+-transient) were explored as a function of a few crucial parameters, still not quantified in human cardiac cells. In the present state, the model visualizes the activity-related accumulation-depletion of Ca2+ and K+ ions in t-tubular and interstitial extracellular spaces. The results suggest that cumulative calcium depletion in the limited extracellular spaces can affect transmembrane Ca2+ currents, the duration of AP and the cytosolic calcium-transients that govern cellular contraction. Further experimental work is needed to evaluate the missing values describing the distribution of ion transporters in the cell membrane and the rate of ion exchanges between the extracellular compartments of human cardiomyocytes.

Supplementary Information

ijms-14-24271-s001.pdf

Acknowledgments

This study was realized with institutional support RVO: 61388998, with support of the university project MUNI/A/0951/2012 and project NT14301-3/2013 from the Ministry of Health of the Czech Republic. Georges Christé’s work was supported by Université Lyon 1 research allowances to the EA4612 Neurocardiology Unit. We thank M. Šimurdová for reading the manuscript and for valuable comments.

Appendix

SymbolDefinition
Abbreviations used in the text
APAction potential
APDAction potential duration
ECExcitation-contraction
SRSarcoplasmic reticulum
NSRNetwork compartment of SR
JSRJunctional compartment of SR
Variables used in the text
VmMembrane voltage
INaFast Na+ current
ICaLL-type Ca2+ current
INapsPersistent Na+ current
IKtoTransient outward K+ current
IKrRapid delayed rectifier K+ current
IKsSlow delayed rectifier K+ current
IK1Inward rectifying K+ current
IK(Na)Sodium-activated K+ current
Ins(Ca)Calcium-activated non-specific current
IbBackground current
INaCaNa+-Ca2+ exchange current
INaKNa+-K+ pump current
IpCaCa2+ pump current
Ix,sSurface membrane component of current x
Ix,tTubular membrane component of current x
JupCa2+ flow via SR Ca2+ pump
Jx,net,tNet flux of ion x through t-tubular membrane
Jx,net,sNet flux of ion x through surface membrane
nx,net,tNet amount of ion x transferred via t-tubular membrane during a cycle
nx,net,sNet amount of ion x transferred via surface membrane during a cycle
[x]bFree concentration of substance x in external bulk space
[x]cFree concentration of substance x in cleft space
[x]tFree concentration of substance x in t-tubular space
[x]dFree concentration of substance x in dyadic space
[x]iFree concentration of substance x in cytosol
[x]endFree concentration of substance x at the end of cycle
[x]meanMean free concentration of substance x during a cycle
[x]NSRFree concentration of substance x in NSR
[x]JSRFree concentration of substance x in JSR
Parameters/constants used in the text
fi,tFraction of ion transporters i in t-tubular membrane
τx,ctTime constant of exchange of ion x between intercellular clefts and t-tubules

Conflicts of Interest

The authors declare no conflict of interest.

References

  1. Courtemanche, M.; Ramirez, R.J.; Nattel, S. Ionic mechanisms underlying human atrial action potential properties: Insight from a mathematical model. Am. J. Physiol 1998, 275, 301–321. [Google Scholar]
  2. Nygren, A.; Fiset, C.; Firek, L.; Clark, J.W.; Lindblad, D.S.; Clark, R.B.; Giles, W.R. Mathematical model of an adult human atrial cell: the role of K+ currents in repolarization. Circ. Res 1998, 82, 63–81. [Google Scholar]
  3. Priebe, L.; Beuckelmann, D.J. Simulation study of cellular electric properties in heart failure. Circ. Res 1998, 82, 1206–1223. [Google Scholar]
  4. Ten Tusscher, K.H.W.J.; Noble, D.; Noble, P.J.; Panfilov, A.V. A model for human ventricular tissue. Am. J. Physiol 2004, 286, 1573–1589. [Google Scholar]
  5. Iyer, V.; Mazhari, R.; Winslow, R.L. A computational model of the human left-ventricular epicardial myocyte. Biophys. J 2004, 87, 1507–1525. [Google Scholar]
  6. Fink, M.; Noble, D.; Virag, L.; Varro, A.; Giles, W.R. Contributions of HERG K+ current to repolarization of the human ventricular action potential. Prog. Biophys. Mol. Biol 2008, 96, 357–376. [Google Scholar]
  7. Grandi, E.; Pasqualini, F.S.; Bers, D.M. A novel computational model of the human ventricular action potential and Ca transient. J. Mol. Cell. Cardiol 2010, 48, 112–121. [Google Scholar]
  8. O’Hara, T.; Virág, L.; Varró, A.; Rudy, Y. Simulation of the undiseased human cardiac ventricular action potential: Model formulation and experimental validation. PLoS Comput. Biol 2011, 7, e1002061. [Google Scholar]
  9. Hilgemann, D.W.; Noble, D. Excitation-contraction coupling and extracellular calcium transients in rabbit atrium: Reconstruction of basic cellular mechanisms. Proc. R. Soc. Lond 1987, 230, 163–205. [Google Scholar]
  10. Hilgemann, D.W. Extracellular calcium transients and action potential configuration changes related to post-stimulatory potentiation in rabbit atrium. J. Gen. Physiol 1986, 87, 675–706. [Google Scholar]
  11. Hilgemann, D.W. Extracellular calcium transients at single excitations in rabbit atrium measured with tetramethylmurexide. J. Gen. Physiol 1986, 87, 707–735. [Google Scholar]
  12. Pásek, M.; Christé, G.; Šimurda, J. A quantitative model of the cardiac ventricular cell incorporating the transverse-axial tubular system. Gen. Physiol. Biophys 2003, 22, 355–368. [Google Scholar]
  13. Pásek, M.; Šimurda, J.; Christé, G. The functional role of cardiac T-tubules explored in a model of rat ventricular myocytes. Philos. Trans. R. Soc. A 2006, 364, 1187–1206. [Google Scholar]
  14. Pásek, M.; Šimurda, J.; Orchard, C.H.; Christé, G. A model of the guinea-pig ventricular cardiomyocyte incorporating a transverse-axial tubular system. Prog. Biophys. Mol. Biol 2008, 96, 258–280. [Google Scholar]
  15. Ohler, A.; Weisser-Thomas, J.; Piacentino, V.; Houser, S.R.; Tomaselli, G.F.; O’Rourke, B. Two-photon laser scanning microscopy of the transverse-axial tubule system in ventricular cardiomyocytes from failing and non-failing human hearts. Cardiol. Res. Pract 2009. [Google Scholar] [CrossRef]
  16. Pásek, M.; Šimurda, J.; Orchard, C.H. Role of t-tubules in the control of trans-sarcolemmal ion flux and intracellular Ca2+ in a model of the rat cardiac ventricular myocyte. Eur. Biophys. J 2012, 41, 491–503. [Google Scholar]
  17. Pásek, M.; Šimurda, J.; Christé, G.; Orchard, C.H. Modelling the cardiac transverse–axial tubular system. Prog. Biophys. Mol. Biol 2008, 96, 226–243. [Google Scholar]
  18. Shepherd, N.; McDonough, H.B. Ionic diffusion in transverse tubules of cardiac ventricular myocytes. Am. J. Physiol 1998, 275, 852–860. [Google Scholar]
  19. Brette, F.; Salle, L.; Orchard, C.H. Differential modulation of L-type Ca2+ current by SR Ca2+ release at the T-tubules and surface membrane of rat ventricular myocytes. Circ. Res 2004, 95, 1–7. [Google Scholar]
  20. Kunze, D.L. Rate-dependent changes in extracellular potassium in the rabbit atrium. Circ. Res 1977, 41, 122–127. [Google Scholar]
  21. Attwell, D.; Cohen, I.; Eisner, D.A. The effects of heart rate on the action potential of guinea-pig and human ventricular muscle. J. Physiol 1981, 313, 439–461. [Google Scholar]
  22. Hilgemann, D.W.; Langer, G.A. Transsarcolemmal calcium movements in arterially perfused rabbit right ventricle measured with extracellular calcium-sensitive dyes. Circ. Res 1984, 54, 461–467. [Google Scholar]
  23. Almers, W. Potassium concentration changes in the transverse tubules of vertebrate skeletal muscle. Fed. Proc 1980, 39, 1527–1532. [Google Scholar]
  24. Almers, W.; Fink, R.; Palade, P.T. Calcium depletion in frog muscle tubules: The decline of calcium current under maintained depolarization. J. Physiol 1981, 312, 177–207. [Google Scholar]
  25. Li, G.R.; Feng, J.; Yue, L.; Carrier, M. Transmural heterogeneity of action potentials and Ito1 in myocytes isolated from the human right ventricle. Am. J. Physiol 1998, 275, 369–377. [Google Scholar]
  26. Li, G.R.; Yang, B.; Feng, J.; Bosch, R.F.; Carrier, M.; Nattel, S. Transmembrane ICa contributes to rate-dependent changes of action potentials in human ventricular myocytes. Am. J. Physiol 1999, 276, 98–106. [Google Scholar]
  27. Schmidt, U.; Hajjar, R.J.; Helm, P.A.; Kim, C.S.; Doye, A.A.; Gwathmey, J.A. Contribution of abnormal sarcoplasmic reticulum ATPase activity to systolic and diastolic dysfunction in human heart failure. J. Mol. Cell. Cardiol 1998, 30, 1929–1937. [Google Scholar]
  28. Pieske, B.; Maier, L.S.; Piacentino, V.; Weisser, J.; Hasenfuss, G.; Houser, S. Rate dependence of [Na+]i and contractility in nonfailing and failing human myocardium. Circulation 2002, 106, 447–453. [Google Scholar]
  29. Beuckelmann, D.J.; Näbauer, M.; Erdmann, E. Intracellular calcium handling in isolated ventricular myocytes from patients with terminal heart failure. Circulation 1992, 88, 1046–1055. [Google Scholar]
  30. Pieske, B.; Houser, S.R. [Na+]i handling in the failing human heart. Cardiovasc. Res 2003, 57, 874–886. [Google Scholar]
  31. Brette, F.; Orchard, C.H. T-tubule function in mammalian cardiac myocytes. Circ. Res 2003, 92, 1182–1192. [Google Scholar]
  32. Orchard, C.H.; Pásek, M.; Brette, F. The role of mammalian cardiac t-tubules in excitation-contraction coupling: Experimental and computational approaches. Exp. Physiol 2009, 94, 509–519. [Google Scholar]
  33. Wei, S.; Guo, A.; Chen, B.; Kutschke, W.; Xie, Y.P.; Zimmerman, K.; Weiss, R.M.; Anderson, M.E.; Cheng, H.; Song, L.S. T-tubule remodeling during transition from hypertrophy to heart failure. Circ. Res 2010, 107, 520–531. [Google Scholar]
  34. He, J.; Conklin, M.W.; Foell, J.D.; Wolff, M.R.; Haworth, R.A.; Coronado, R.; Kamp, T.J. Reduction in density of transverse tubules and L-type Ca2+ channels in canine tachycardia induced heart failure. Cardiovasc. Res 2001, 49, 298–307. [Google Scholar]
  35. Louch, W.E.; Bito, V.; Heinzel, F.R.; Macianskiene, R.; Vanhaecke, J.; Flameng, W.; Mubagwa, K.; Sipido, K.R. Reduced synchrony of Ca2+ release with loss of T-tubules—A comparison to Ca2+ release in human failing cardiomyocytes. Cardiovasc. Res 2004, 62, 63–73. [Google Scholar]
  36. Kaprielian, R.R.; Stevenson, S.; Rothery, S.M.; Cullen, M.J.; Severs, N.J. Distinct patterns of dystrophin organization in myocyte sarcolemma and transverse tubules of normal and diseased human myocardium. Circulation 2000, 101, 2586–2594. [Google Scholar]
  37. Wong, C.; Soeller, C.; Burton, L.; Cannell, M. Changes in transverse-tubular system architecture in myocytes from diseased human ventricles. Biophys. J 2001, 80, 588A. [Google Scholar]
  38. Lyon, A.R.; MacLeod, K.T.; Zhang, Y.; Garcia, E.; Kanda, G.K.; Lab, M.J.; Korchev, Y.E.; Harding, S.E.; Gorelik, J. Loss of T-tubules and other changes to surface topography in ventricular myocytes from failing human and rat heart. Proc. Natl. Acad. Sci. USA 2009, 106, 6854–6859. [Google Scholar]
  39. Ferrantini, C.; Crocini, C.; Coppini, R.; Vanzi, F.; Tesi, C.; Cerbai, E.; Poggesi, C.; Pavone, F.S.; Sacconi, L. The transverse-axial tubular system of cardiomyocytes. Cell. Mol. Life Sci 2013, 70, 4695–4710. [Google Scholar]
  40. Cannell, M.B.; Crossman, D.J.; Soeller, C. Effect of changes in action potential spike configuration, junctional sarcoplasmic reticulum micro-architecture and altered t-tubule structure in human heart failure. J. Muscle Res. Cell. Motil 2006, 27, 297–306. [Google Scholar]
  41. Maron, B.J.; Ferrans, V.J.; Roberts, W.C. Ultrastructural features of degenerated cardiac muscle cells in patients with cardiac hypertrophy. Am. J. Pathol 1975, 79, 387–434. [Google Scholar]
  42. Balijepalli, R.C.; Lokuta, A.J.; Maertz, N.A.; Buck, J.M.; Haworth, R.A.; Valdivia, H.H.; Kamp, T.J. Depletion of T-tubules and specific subcellular changes in sarcolemmal proteins in tachycardia-induced heart failure. Cardiovasc. Res 2003, 59, 67–77. [Google Scholar]
  43. Prinz, C.; Farr, M.; Laser, K.T.; Esdorn, H.; Piper, C.; Horstkotte, D.; Faber, L. Determining the role of fibrosis in hypertrophic cardiomyopathy. Expert Rev. Cardiovasc Ther 2013, 11, 495–504. [Google Scholar]
  44. Franzini–Armstrong, C.; Protasi, F.; Tijskens, P. The assembly of calcium release units in cardiac muscle. Ann. N.Y. Acad. Sci 2005, 1047, 76–85. [Google Scholar]
  45. Šimurda, J.; Pásek, M.; Christé, G.; Šimurdova, M. Modelling the distribution of [Ca2+] within the cardiac T–tubule—Effects of Ca2+ current distribution and changes in extracellular [Ca2+] (Abstract). J. Physiol 2004, 561, PC5. [Google Scholar]
  46. Dyachenko, V.; Christ, A.; Gubanov, R.; Isenberg, G. Bending of z–lines by mechanical stimuli: An input signal for integrin dependent modulation of ion channels? Prog. Biophys. Mol. Biol 2008, 97, 196–216. [Google Scholar]
  47. McNary, T.G.; Spitzer, K.W.; Holloway, H.; Bridge, J.H.; Kohl, P.; Sachse, F.B. Mechanical modulation of the transverse tubular system of ventricular cardiomyocytes. Prog. Biophys. Mol. Biol 2012, 110, 218–225. [Google Scholar]
  48. Tidball, J.G.; Smith, R.; Shattock, M.J.; Bers, D.M. Differences in action potential configuration in ventricular trabeculae correlate with differences in density of transverse tubule–sarcoplasmic reticulum couplings. J. Mol. Cell. Cardiol 1988, 20, 539–546. [Google Scholar]
  49. Tidball, J.G.; Cederdahl, J.E.; Bers, D.M. Quantitative analysis of regional variability in the distribution of transverse tubules in rabbit myocardium. Cell Tissue Res 1991, 264, 293–298. [Google Scholar]
  50. Fowler, M.R.; Dobson, R.S.; Orchard, C.H.; Harrison, S.M. Functional consequences of detubulation of isolated rat ventricular myocytes. Cardiovasc. Res 2004, 62, 529–537. [Google Scholar]
Figure 1. Action potentials (Vm) and selected membrane currents (ICaL, IKto, IK1, INaCa, INaK) at steady-state under 1 Hz (left panel) and 2.5 Hz (right panel) stimulation. Blue and red continuous lines refer to surface and t-tubular membrane, respectively.
Ijms 14 24271f1
Figure 2. Action potentials (Vm) and ion concentrations ([Ca2+], [K+]) in the first, third, fifth, seventh and ninth segments of tubular lumen (red lines) and in cleft space (blue lines) at 1 Hz (left panel) and 2.5 Hz (right panel) steady-state stimulation. Horizontal dashed lines show the levels of ion concentrations in the external bulk space.
Ijms 14 24271f2
Figure 3. Effect of Ca2+ and K+ concentration changes in the first t-tubular segment and cleft space on Ca2+ concentration in the network compartment of SR ([Ca2+]NSR) and Ca2+-transient in the cytosol ([Ca2+]i) during a steady-state stimulation at 1 Hz (left panel) and 2.5 Hz (right panel). The results hold for basic adjustment of tubular fractions of Ca2+ transporters in the model cell (fCaL,t = 0.64, fNaCa,t = 0.56, and fpCa,t = 0.2). The model was run when ion concentration changes in extracellular spaces were either allowed to change (red lines) or fixed at external bulk levels (black lines).
Ijms 14 24271f3
Figure 4. Effect of values of fpCa,t and fNaCa,t on intracellular Ca2+-transient during a steady-state cycle at fCaL,t of 0.64 (left panels) and 0.8 (right panels). The upper and bottom panels, respectively, show the results obtained at stimulation frequency of 1 and 2.5 Hz. The values in the yellow bubble indicate the percentage of the reduction of the cytosolic Ca2+-transient for basic adjustment of fNaCa,t and fpCa,t (0.56 and 0.2, respectively). Δ[Ca2+]i,area,rel represents the percentage change of the area delimited by cytosolic Ca2+-transient during a whole cycle relative to the area of steady-state Ca2+-transient in the model with extracellular ion concentrations fixed at external bulk levels.
Ijms 14 24271f4
Figure 5. Effect of ion concentration changes in the cleft space (b) and in the first segment of t-tubular space (c) on intracellular end-diastolic ion concentrations (d,f,g) and on cytosolic Ca2+-transient (e, integral of cytosolic Ca2+-transient during a cycle) after a sudden increase of stimulation frequency from 1 (steady state, t = 0 s) to 2.5 Hz. The upper panel (a) shows the integral of total trans-sarcolemmal Ca2+ flux during a cycle. The left and right columns show the responses of the model during 10 and 600 s, respectively, after the change of stimulation rate. The model was run when t-tubular, and cleft ion concentrations were allowed to change (blue), when ion concentrations in the cleft space were fixed (red) and when both t-tubular and cleft ion concentrations were fixed at external bulk levels (black).
Ijms 14 24271f5
Figure 6. The effect of ion concentration changes in extracellular spaces on the action potential (AP) (Vm), total sarcolemmal Ca2+ flux (JCa,tot) and cytosolic Ca2+-transient after a sudden increase of stimulation frequency from 1 to 2.5 Hz. The left, middle and right columns show the results obtained, respectively, at 1 Hz steady-state stimulation, at 10 and at 600 s (steady state) after a sudden increase of simulation rate to 2.5 Hz. The model was run when t-tubular and cleft ion concentrations were allowed to change (blue lines), when ion concentrations in the cleft space were fixed (red lines) and when both t-tubular and cleft ion concentrations were fixed at external bulk levels (black, practically identical to red traces).
Ijms 14 24271f6
Figure 7. Accumulation-depletion phenomena during and after a high frequency train of stimulations. From a period of stimulation at 1 Hz, a train of stimuli at 3 Hz has been applied for four different durations: 34, 144, 400 and 700 s. From up to down are plotted superimposed outputs of the model for the four durations: the timing of changes in the frequency of stimulation, the time course of changes in the end-diastolic values of cleft K+ concentration (a), membrane voltage (b) and cleft Ca2+ concentration (c). The horizontal dashed lines show the levels of corresponding ion concentrations in external bulk solution. The insets show the corresponding experimental records digitized from Kunze [20] and Attwell et al. [21].
Ijms 14 24271f7
Figure 8. Comparison of model reconstructions of steady-state AP waveforms recorded at 0.5, 1 and 2 Hz stimulation in a human subepicardial cell by Li et al. [25]. The following models were used: (a) the present model; (b) the model of Iyer et al. [5]; (c) the model of Fink et al. [6] and (d) the model of O’Hara et al. [8]; (e) Representative AP waveforms digitized from Li et al. [25]; and (f) Comparison of values of APD50 and APD90 (action potential duration at 50% and 90% repolarization, respectively) at 0.5, 1 and 2 Hz obtained from the experimental data of Li et al. [25] and the present model. In the models, 15 APs were elicited at each stimulation rate, as done in [25].
Ijms 14 24271f8
Figure 9. Comparison of normalized data showing the frequency-dependent increase of intracellular diastolic ion concentrations in the present model and in the experimental studies. (a) [Ca2+]i (100 APs elicited at each stimulation rate); data published by Schmidt et al. [27]; and (b) [Na2+]i (600 APs elicited at each stimulation rate); data published by Pieske et al. [28].
Ijms 14 24271f9
Figure 10. Schematic diagram of the human ventricular cell model used in the present study. The description of the electrical activity of surface (s) and t-tubular (t) membranes comprises formulations of the following ion currents: fast sodium current (INa), persistent sodium current (INaps), L-type calcium current (ICaL), transient outward potassium current (IKto), rapid and slow components of delayed rectifier potassium current (IKr and IKs), inward rectifying potassium current (IK1), background currents (Ib), sodium-activated potassium current (IK(Na)), calcium-activated non-specific current (Ins(Ca)), sodium-calcium exchange current (INaCa), sodium-potassium pump current (INaK) and calcium pump current (IpCa). The intracellular space contains the cytosol (i), the dyadic space (d), network and junctional compartments of sarcoplasmic reticulum (NSR, JSR) and endogenous Ca2+ buffers [calmodulin (Bcm), troponin (Bhtrpn, Bltrpn) and calsequestrin (Bcs)]. The t-tubular space is partitioned into nine concentric cylindrical segments (details are given in the Supplementary Information). Jup represents Ca2+ flow via SR Ca2+ pump and the small filled rectangles in JSR membrane ryanodine receptors. The small bi-directional arrows denote Ca2+ diffusion. Ion diffusion between the t-tubular and cleft spaces is represented by the dashed arrow and between cleft and external bulk spaces by thick arrows.
Ijms 14 24271f10
Figure 11. The stability of the model showing cytoplasmic end-diastolic [Ca2+] (top), [Na+] (middle) and [K+] (bottom) during a 5-h cell lifetime run during which the model cell was initially at rest and then stimulated at 1, 2 and 3 Hz and returned to rest for one hour, as indicated on the top of the panel.
Ijms 14 24271f11

