Article

Several Lipid-Related Gene Polymorphisms Interact with Overweight/Obesity to Modulate Blood Pressure Levels

1
Department of Cardiology, Institute of Cardiovascular Diseases, The First Affiliated Hospital, Guangxi Medical University, Nanning 530021, Guangxi, China
2
Department of Cardiology, The Fourth Affiliated Hospital, Guangxi Medical University, Liuzhou 545005, Guangxi, China
3
Department of Cardiology, The Third Affiliated Hospital, Guangxi Medical University, Nanning 530000, Guangxi, China
4
Department of Cardiology, The People’s Hospital of Guilin, Guilin 541001, Guangxi, China
5
Department of Internal Medicine, Worker’s Hospital of Guangxi Liuzhou Iron and Steel (Group) Company, Liuzhou 545002, Guangxi, China
*
Author to whom correspondence should be addressed.
Int. J. Mol. Sci. 2012, 13(9), 12062-12081; https://doi.org/10.3390/ijms130912062
Submission received: 17 August 2012 / Revised: 12 September 2012 / Accepted: 13 September 2012 / Published: 24 September 2012
(This article belongs to the Section Biochemistry)

Abstract

:
Little is known about the interactions of single nucleotide polymorphisms (SNPs) and overweight/obesity on blood pressure levels. The present study was undertaken to detect 10 lipid-related gene SNPs and their interactions with overweight/obesity on blood pressure levels. Genotyping of ATP-binding cassette transporter A1 (ABCA-1) V825I, acyl-CoA:cholesterol acyltransferase-1 (ACAT-1) rs1044925, low density lipoprotein receptor (LDL-R) AvaII hepatic lipase gene (LIPC) −250G > A, endothelial lipase gene (LIPG) 584C > T, methylenetetrahydrofolate reductase (MTHFR) 677C > T, the E3 ubiquitin ligase myosin regulatory light chain-interacting protein (MYLIP) rs3757354, proprotein convertase subtilisin-like kexin type 9 (PCSK9) E670G, peroxisome proliferator-activated receptor delta (PPARD) +294T > C, and Scavenger receptor class B type 1 (SCARB1) rs5888 was performed in 978 normal weight and 751 overweight/obese subjects. The interactions were detected by factorial regression analysis. The genotypes of ACAT-1 AC, LIPC GA and AA, and SCARB1 TT; LDL-R A-A- and LIPC GA; and SCARB1 TT were interacted with overweight/obesity to increase systolic, diastolic blood pressure (SBP, DBP) and pulse pressure (PP) levels; respectively. The genotypes of ACAT-1 CC; ACAT-1 AA and CC were interacted with overweight/obesity to decrease SBP, PP levels (p < 0.01–0.001); respectively. The differences in blood pressure levels between normal weight and overweight/obese subjects might partly result from different interactions of several SNPs and overweight/obesity.

1. Introduction

Hypertension is an emerging risk factor that causes more than 7.1 million premature deaths a year worldwide [1], and that is becoming more prevalent in developing nations [2]. Hypertension can lead to coronary heart disease (CHD), stroke, congestive heart failure, renal insufficiency, and peripheral vascular disease. It is well known that blood pressure levels are regulated by multiple environmental and genetic factors and their interactions [36]. Recent genome-wide association studies in different populations have explored more than 160 candidate genes associated with blood pressure and hypertension, but the results of these association studies conducted with blood pressure traits are inconsistent [710]. A major reason for inconsistency among these studies may be different environmental modifiers that interact with genes to influence blood pressure and hypertension.
Obesity, the presence of excess body fat, has been clearly associated with cardiovascular disease, type 2 diabetes mellitus, gallbladder disease, cancers at several sites, osteoarthritis, and total mortality [11]. The prevalence of obesity has dramatically increased during recent years in all parts of the world [12]. According to the World Health Organization (WHO), more than 400 million adults were obese in 2005, and it is estimated that more than 700 million adults will be obese by 2015 [13]. Moreover, the rates of increase and the overall prevalence of obesity vary greatly across ethnic groups [14]. Among Americans, data from the National Health and Nutrition Examination Survey (NHANES) conducted in 2007–2008 showed that adults of 32.8% of non-Hispanic whites, 44.1% of non-Hispanic blacks, and 39.3% of Mexican-Americans were either overweight or obese [15]. The prevalence of overweight and obesity in Chinese was 24.1% and 2.8% in men and 26.1% and 5.0% in women; respectively [16]. Obesity has become a major clinical and public health problem that threatens to overwhelm already extended healthcare services in many countries. The link between overweight/obesity and blood pressure and hypertension has been well documented [1726]. However, the interactions of single nucleotide polymorphisms (SNPs) and overweight/obesity on blood pressure levels are limited.
There are 56 ethnic groups in China. Han nationality is the largest ethnic group, and Yao nationality is the eleventh largest minority among the 55 minority groups according to the population size. Bai Ku Yao (White-trouser Yao), an isolated subgroup of the Yao minority, is named so because all men wear white knee-length knickerbockers. The population size is about 30,000. Because of isolation from the other ethnic groups, the special customs and cultures including their clothing, intra-ethnic marriages, dietary patterns, and corn wine and rum intakes are still completely preserved to the present day. Thus, Bai Ku Yao is thought to share the same ethnic ancestry and to possess a homogeneous genetic background, and is a useful subgroup for population genetic studies. In several previous epidemiological studies, we found that blood pressure levels and the prevalence of hypertension were lower in normal weight than in overweight/obese subjects [3,4]. We hypothesized that the differences in blood pressure levels between normal weight and overweight/obese subjects might partly result from different interactions of some SNPs and overweight/obesity in this population. Therefore, the aim of the present study was to detect 10 SNPs in different lipid-related genes and evaluate their interactions with overweight/obesity on blood pressure levels in the Guangxi Bai Ku Yao population. The SNPs were selected according to the previous findings of genome-wide association studies [710] and bioinformatics functional assessment. Computational analysis of 10 SNPs ascribed potential functional characteristics to each variant allele [27]. In addition, the 10 SNPs selected for genotyping also based on the frequency of Beijing Han population from the Human Genome Project Database. The heterozygosity values were higher than 10% for the minor allele frequency.

2. Results

2.1. General Characteristics

Table 1 shows the general characteristics and blood pressure levels of the participants. The levels of education, weight, body mass index (BMI), waist circumference, systolic blood pressure (SBP), diastolic blood pressure (DBP), serum total cholesterol (TC), triglyceride (TG), low-density lipoprotein cholesterol (LDL-C), apolipoprotein (Apo) A1, ApoB, and the percentages of subjects who consumed alcohol were higher in overweight/obese than in normal weight subjects (p < 0.05–0.001), whereas the levels of serum high-density lipoprotein cholesterol (HDL-C), the ratio of ApoA1 to ApoB, and the percentages of subjects who smoked cigarettes were lower in overweight/obese than in normal weight subjects (p < 0.01 for all). There were no significant differences in the levels of mean age, height, pulse pressure (PP), and the ratio of male to female between the overweight/obese and normal weight subjects (p > 0.05 for all).

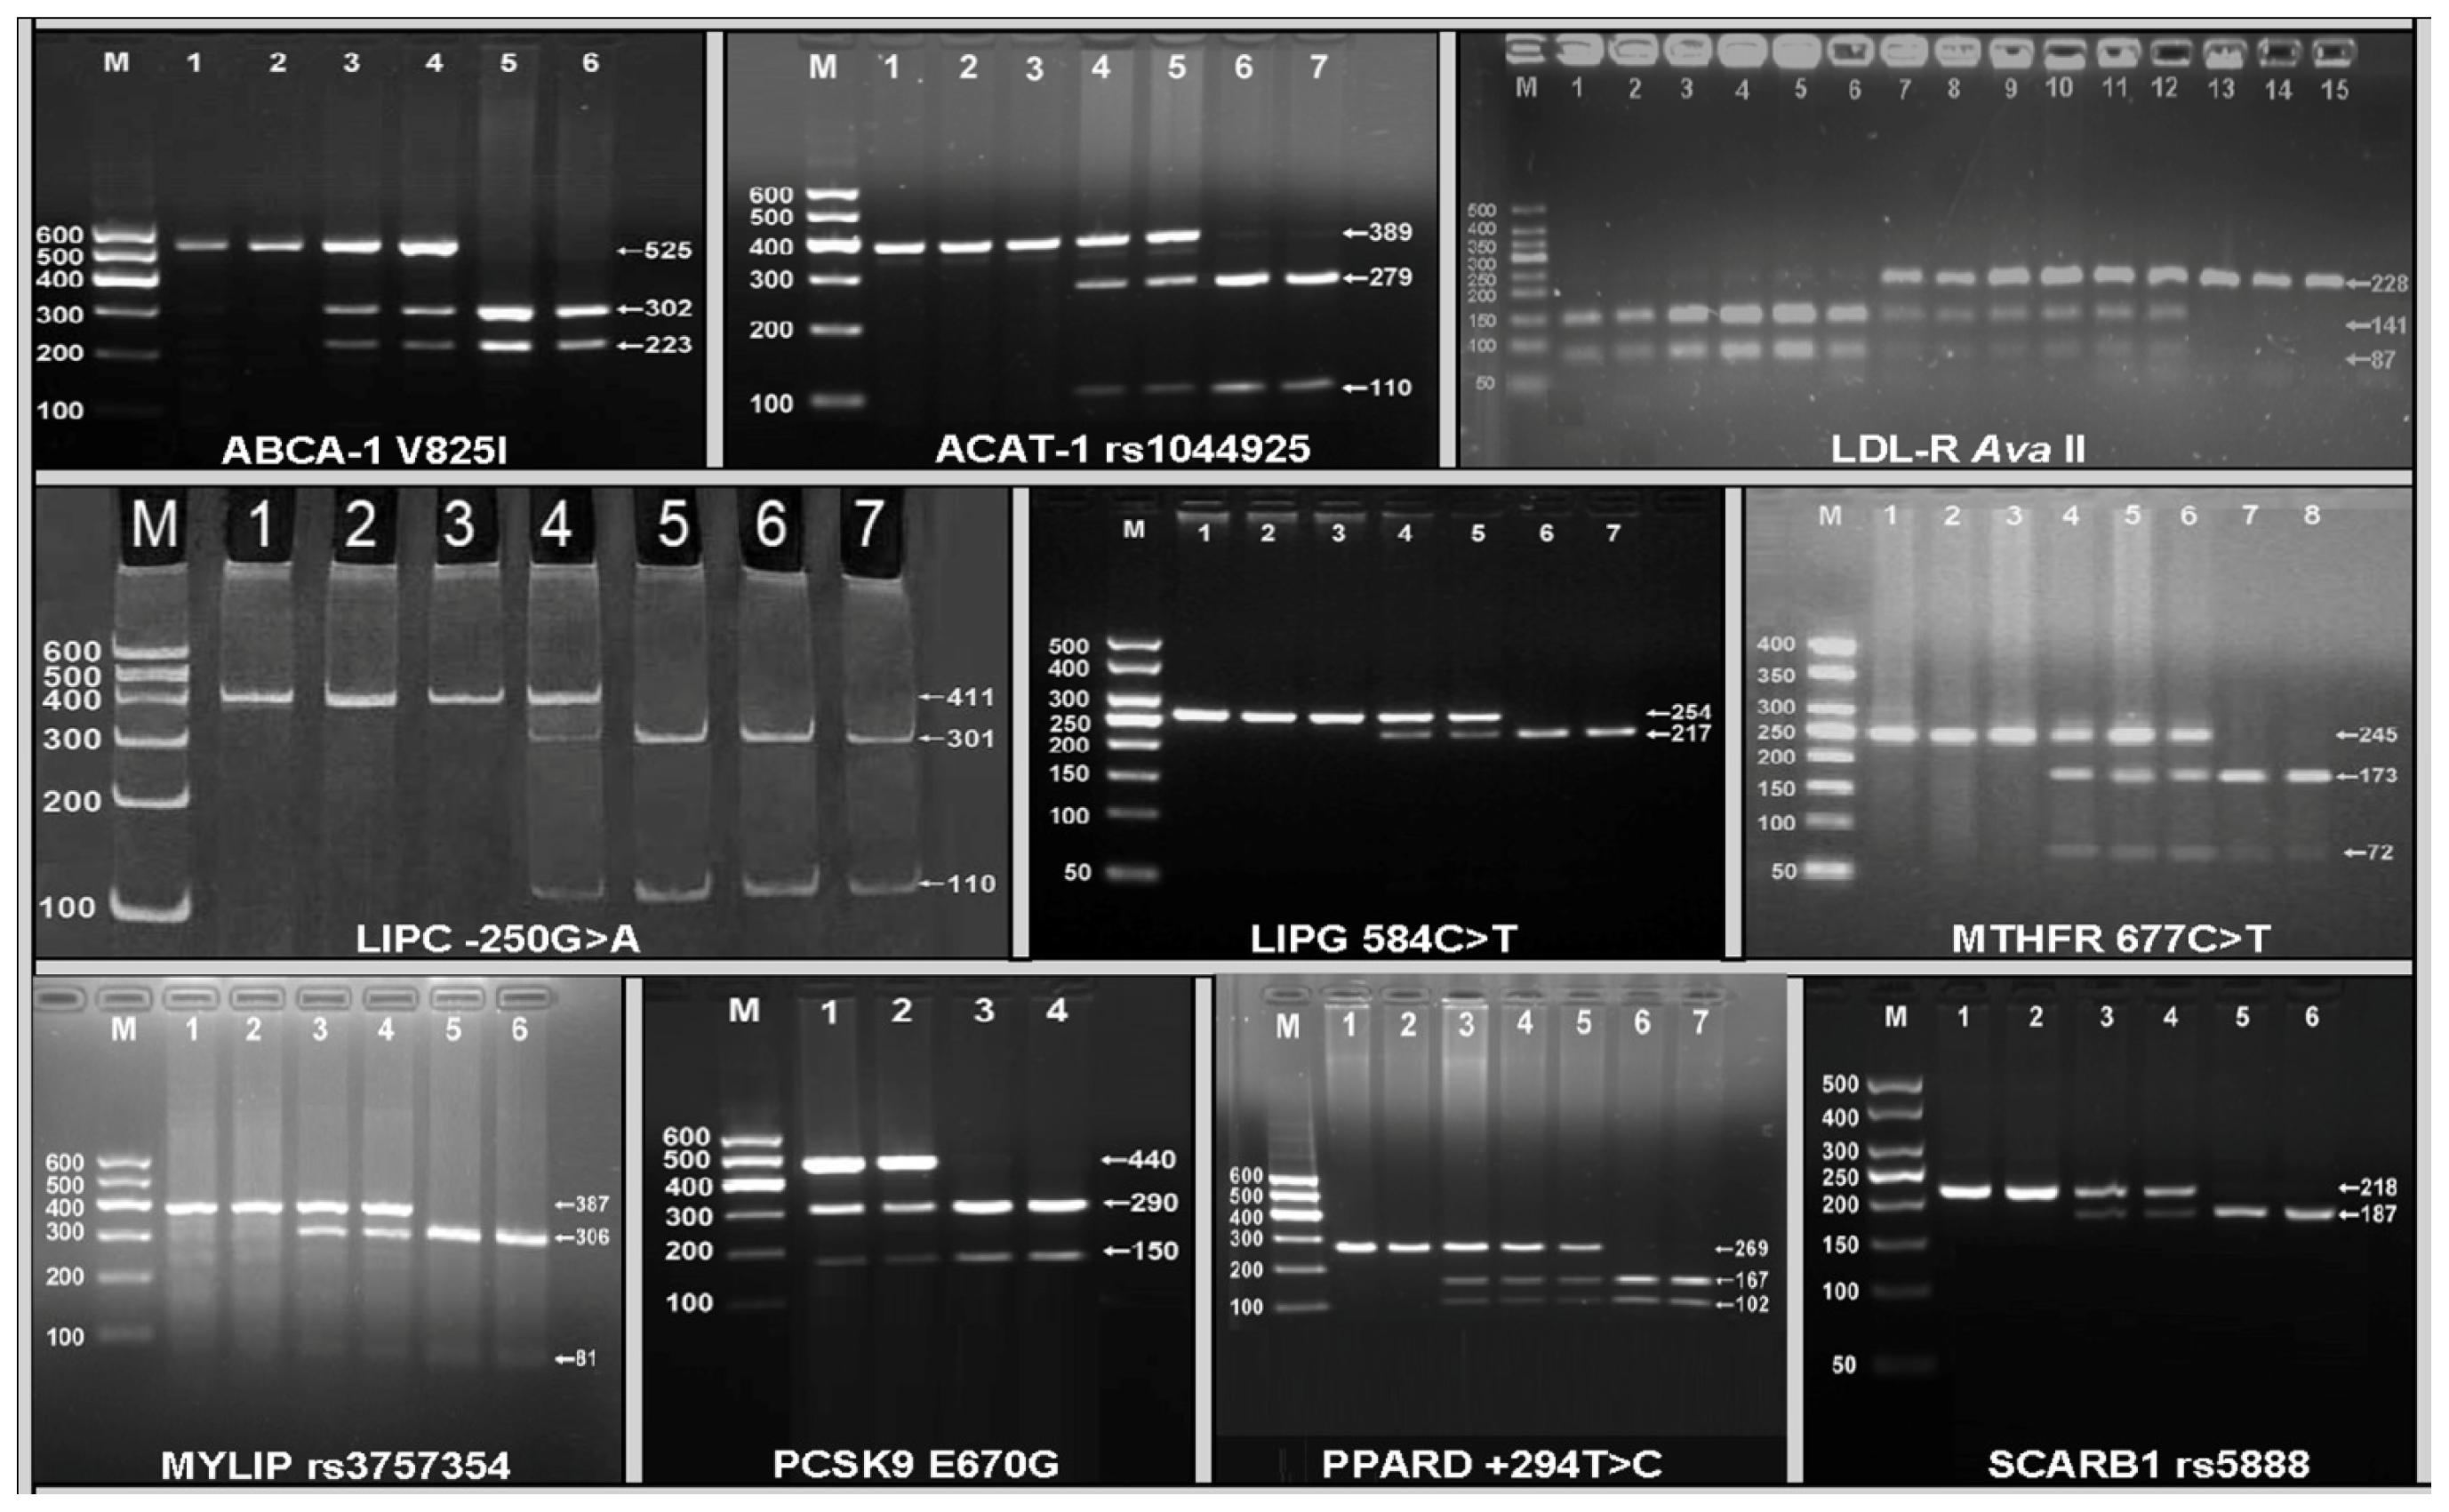
2.2. Electrophoresis and Genotypes

The polymerase chain reaction (PCR) products of ATP-binding cassette transporter A1 (ABCA-1) V825I (rs2066715), acyl-CoA:cholesterol acyltransferase-1 (ACAT-1) rs1044925, low density lipoprotein receptor (LDL-R) AvaII, hepatic lipase gene (LIPC) −250G > A (rs2070895), endothelial lipase gene (LIPG) 584C > T (rs2000813), methylenetetrahydrofolate reductase (MTHFR) 677C > T (rs1801133), the E3 ubiquitin ligase myosin regulatory light chain-interacting protein (MYLIP, also known as IDOL) rs3757354, proprotein convertase subtilisin-like kexin type 9 (PCSK9) E670G (rs505151), peroxisome proliferator-activated receptor delta (PPARD) +294T > C (rs2016520) and Scavenger receptor class B type 1 (SCARB1) rs5888 were 525-, 389-, 228-, 411-, 254-, 254-, 387-, 440-, 269- and 218-bp nucleotide sequences; respectively. The genotypes of the 10 SNPs were shown in Figure 1.

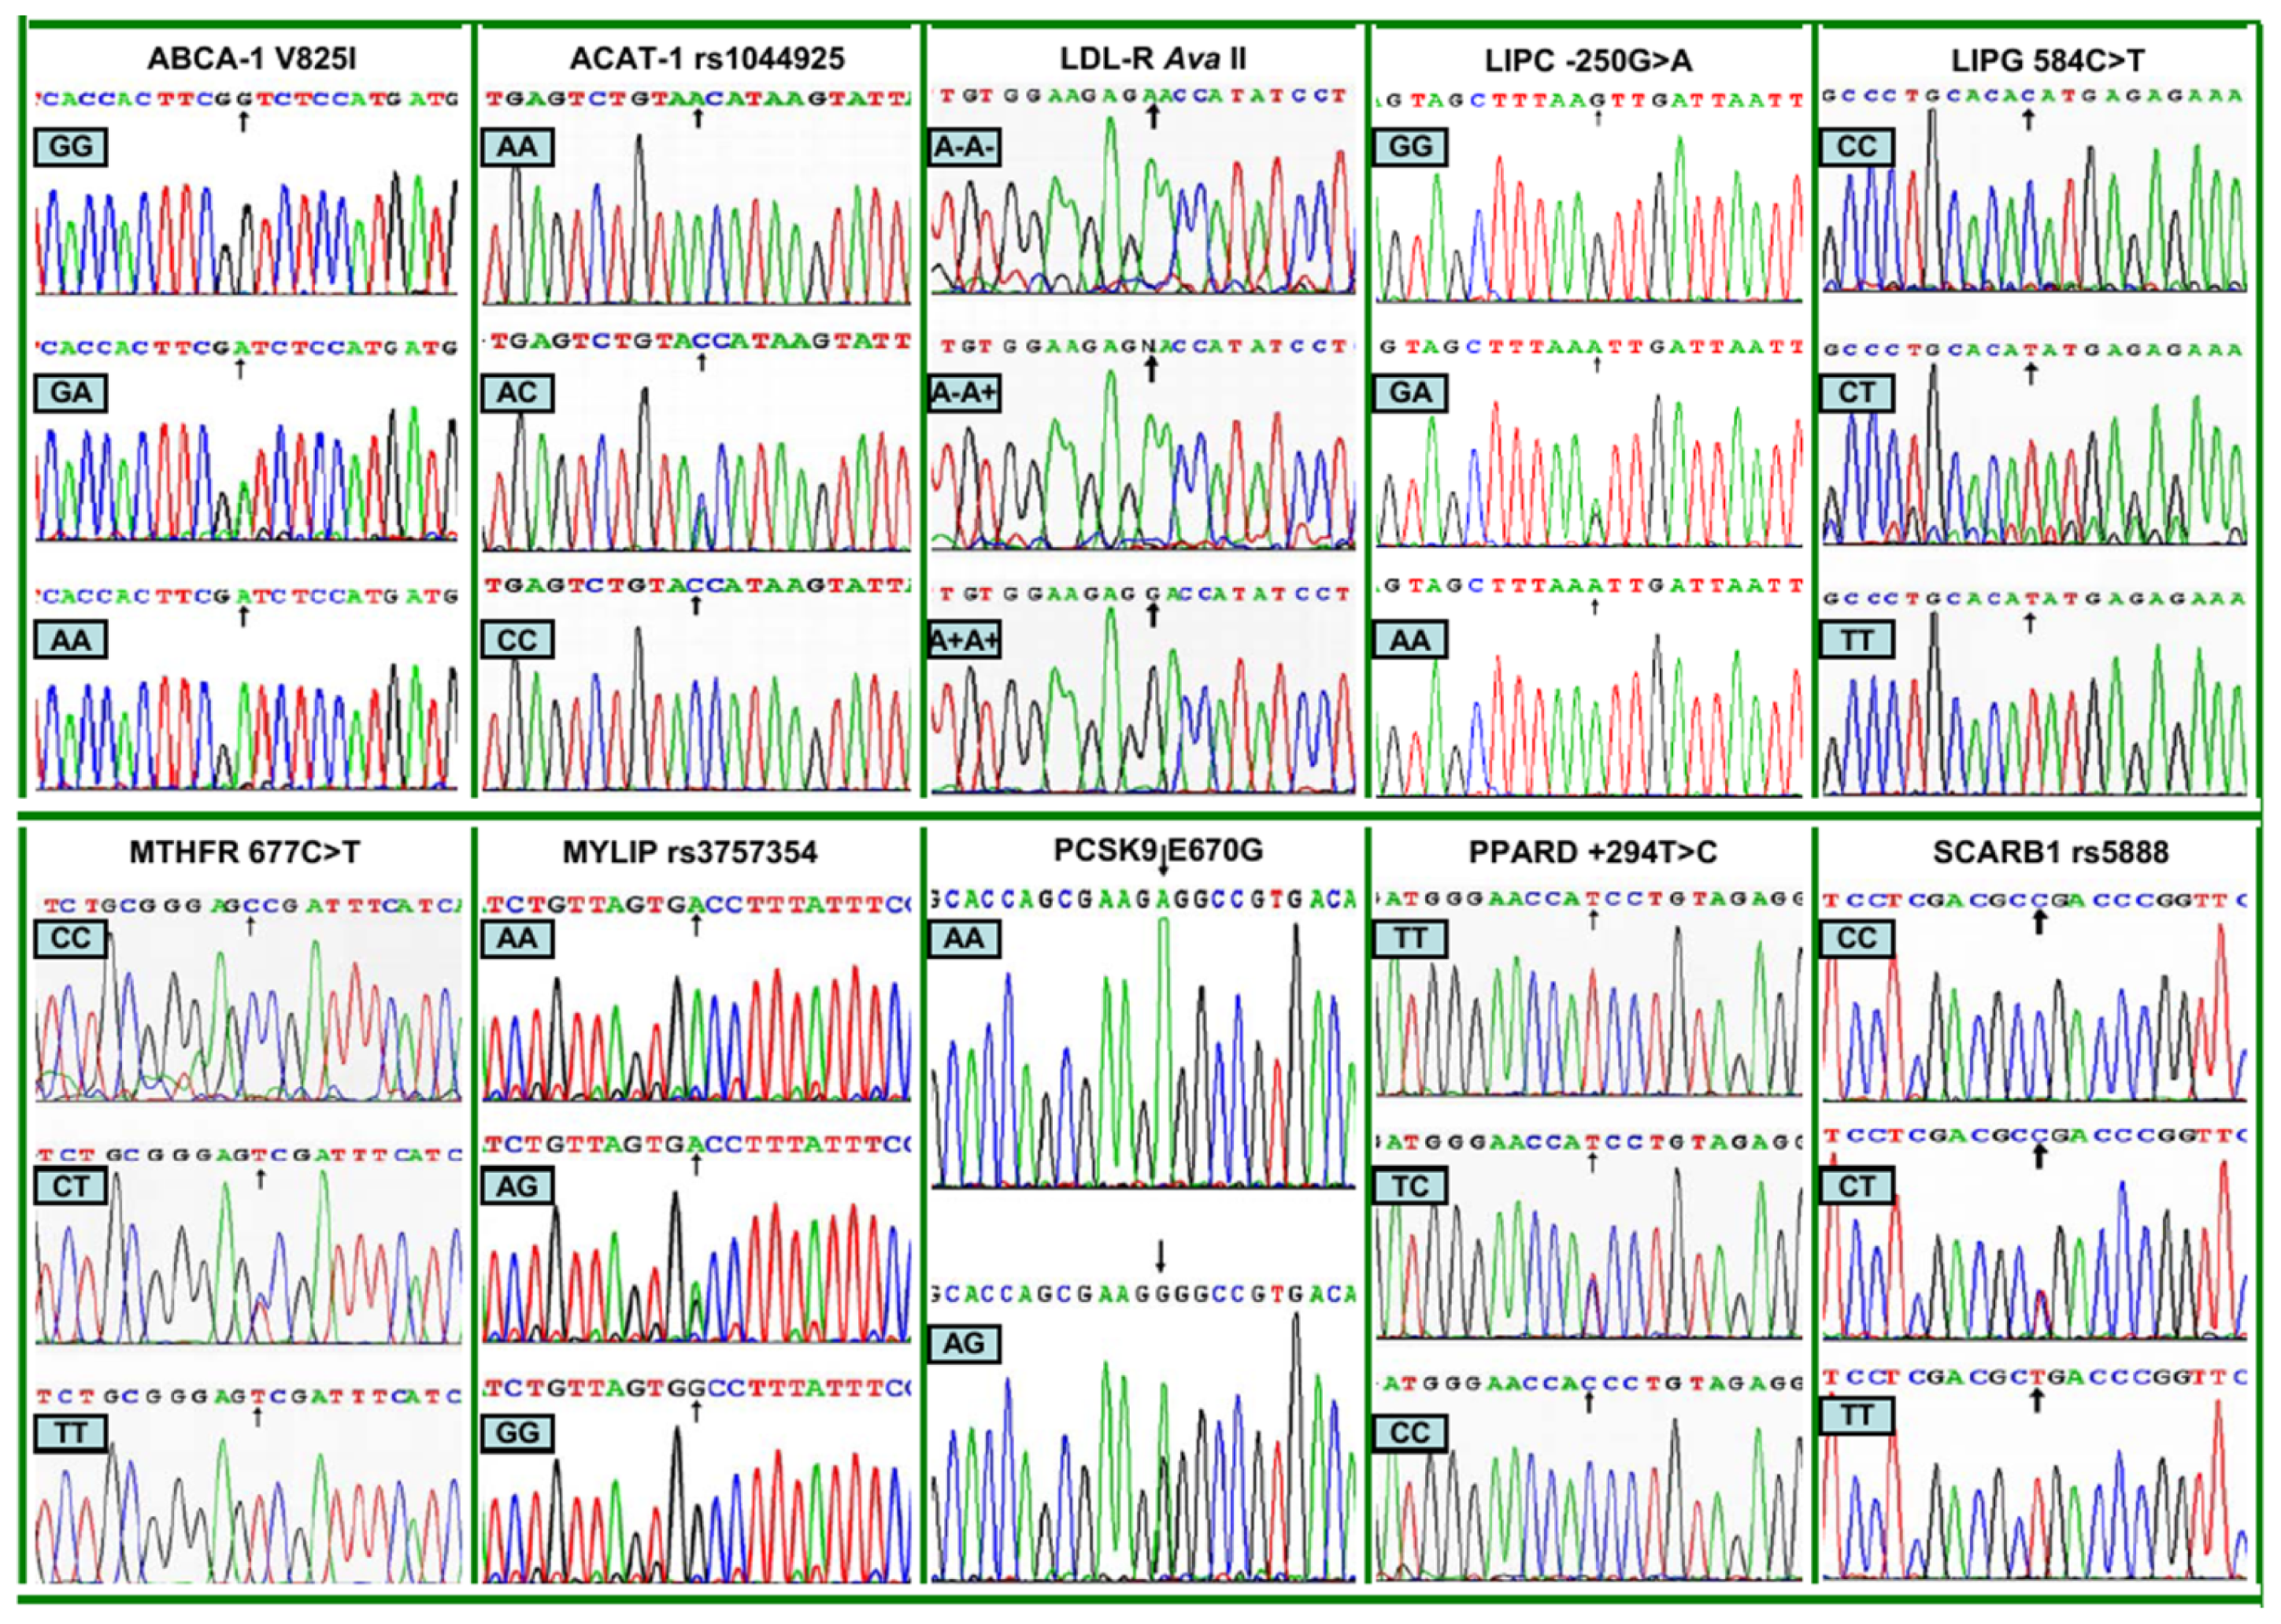
2.3. Nucleotide Sequences

The genotypes detected by PCR-RFLP were also confirmed by direct sequencing (Figure 2).

2.4. Genotypic and Allelic Frequencies

The genotypic and allelic frequencies of the SNPs between normal weight and overweight/obese subjects are summarized in Table 2. The genotypic distribution of 10 SNPs fitted the Hardy-Weinberg equilibrium (p > 0.05 for all). The genotypic and allelic frequencies of LIPC and PCSK9 were different between normal weight and overweight/obese subjects, the overweight/obese subjects had higher LIPC −250A and PCSK9 670A allele frequencies than normal weight subjects (p < 0.05–0.001). The genotypic frequency of LIPG and allelic frequency of MYLIP were also different between normal weight and overweight/obese subjects (p < 0.05 for each). There were no significant differences in the genotypic and allelic frequencies of the remaining SNPs between normal weight and overweight/obese subjects (p > 0.05 for all). The GG homozygous of the PCSK9 E670G was not detected in our study population.

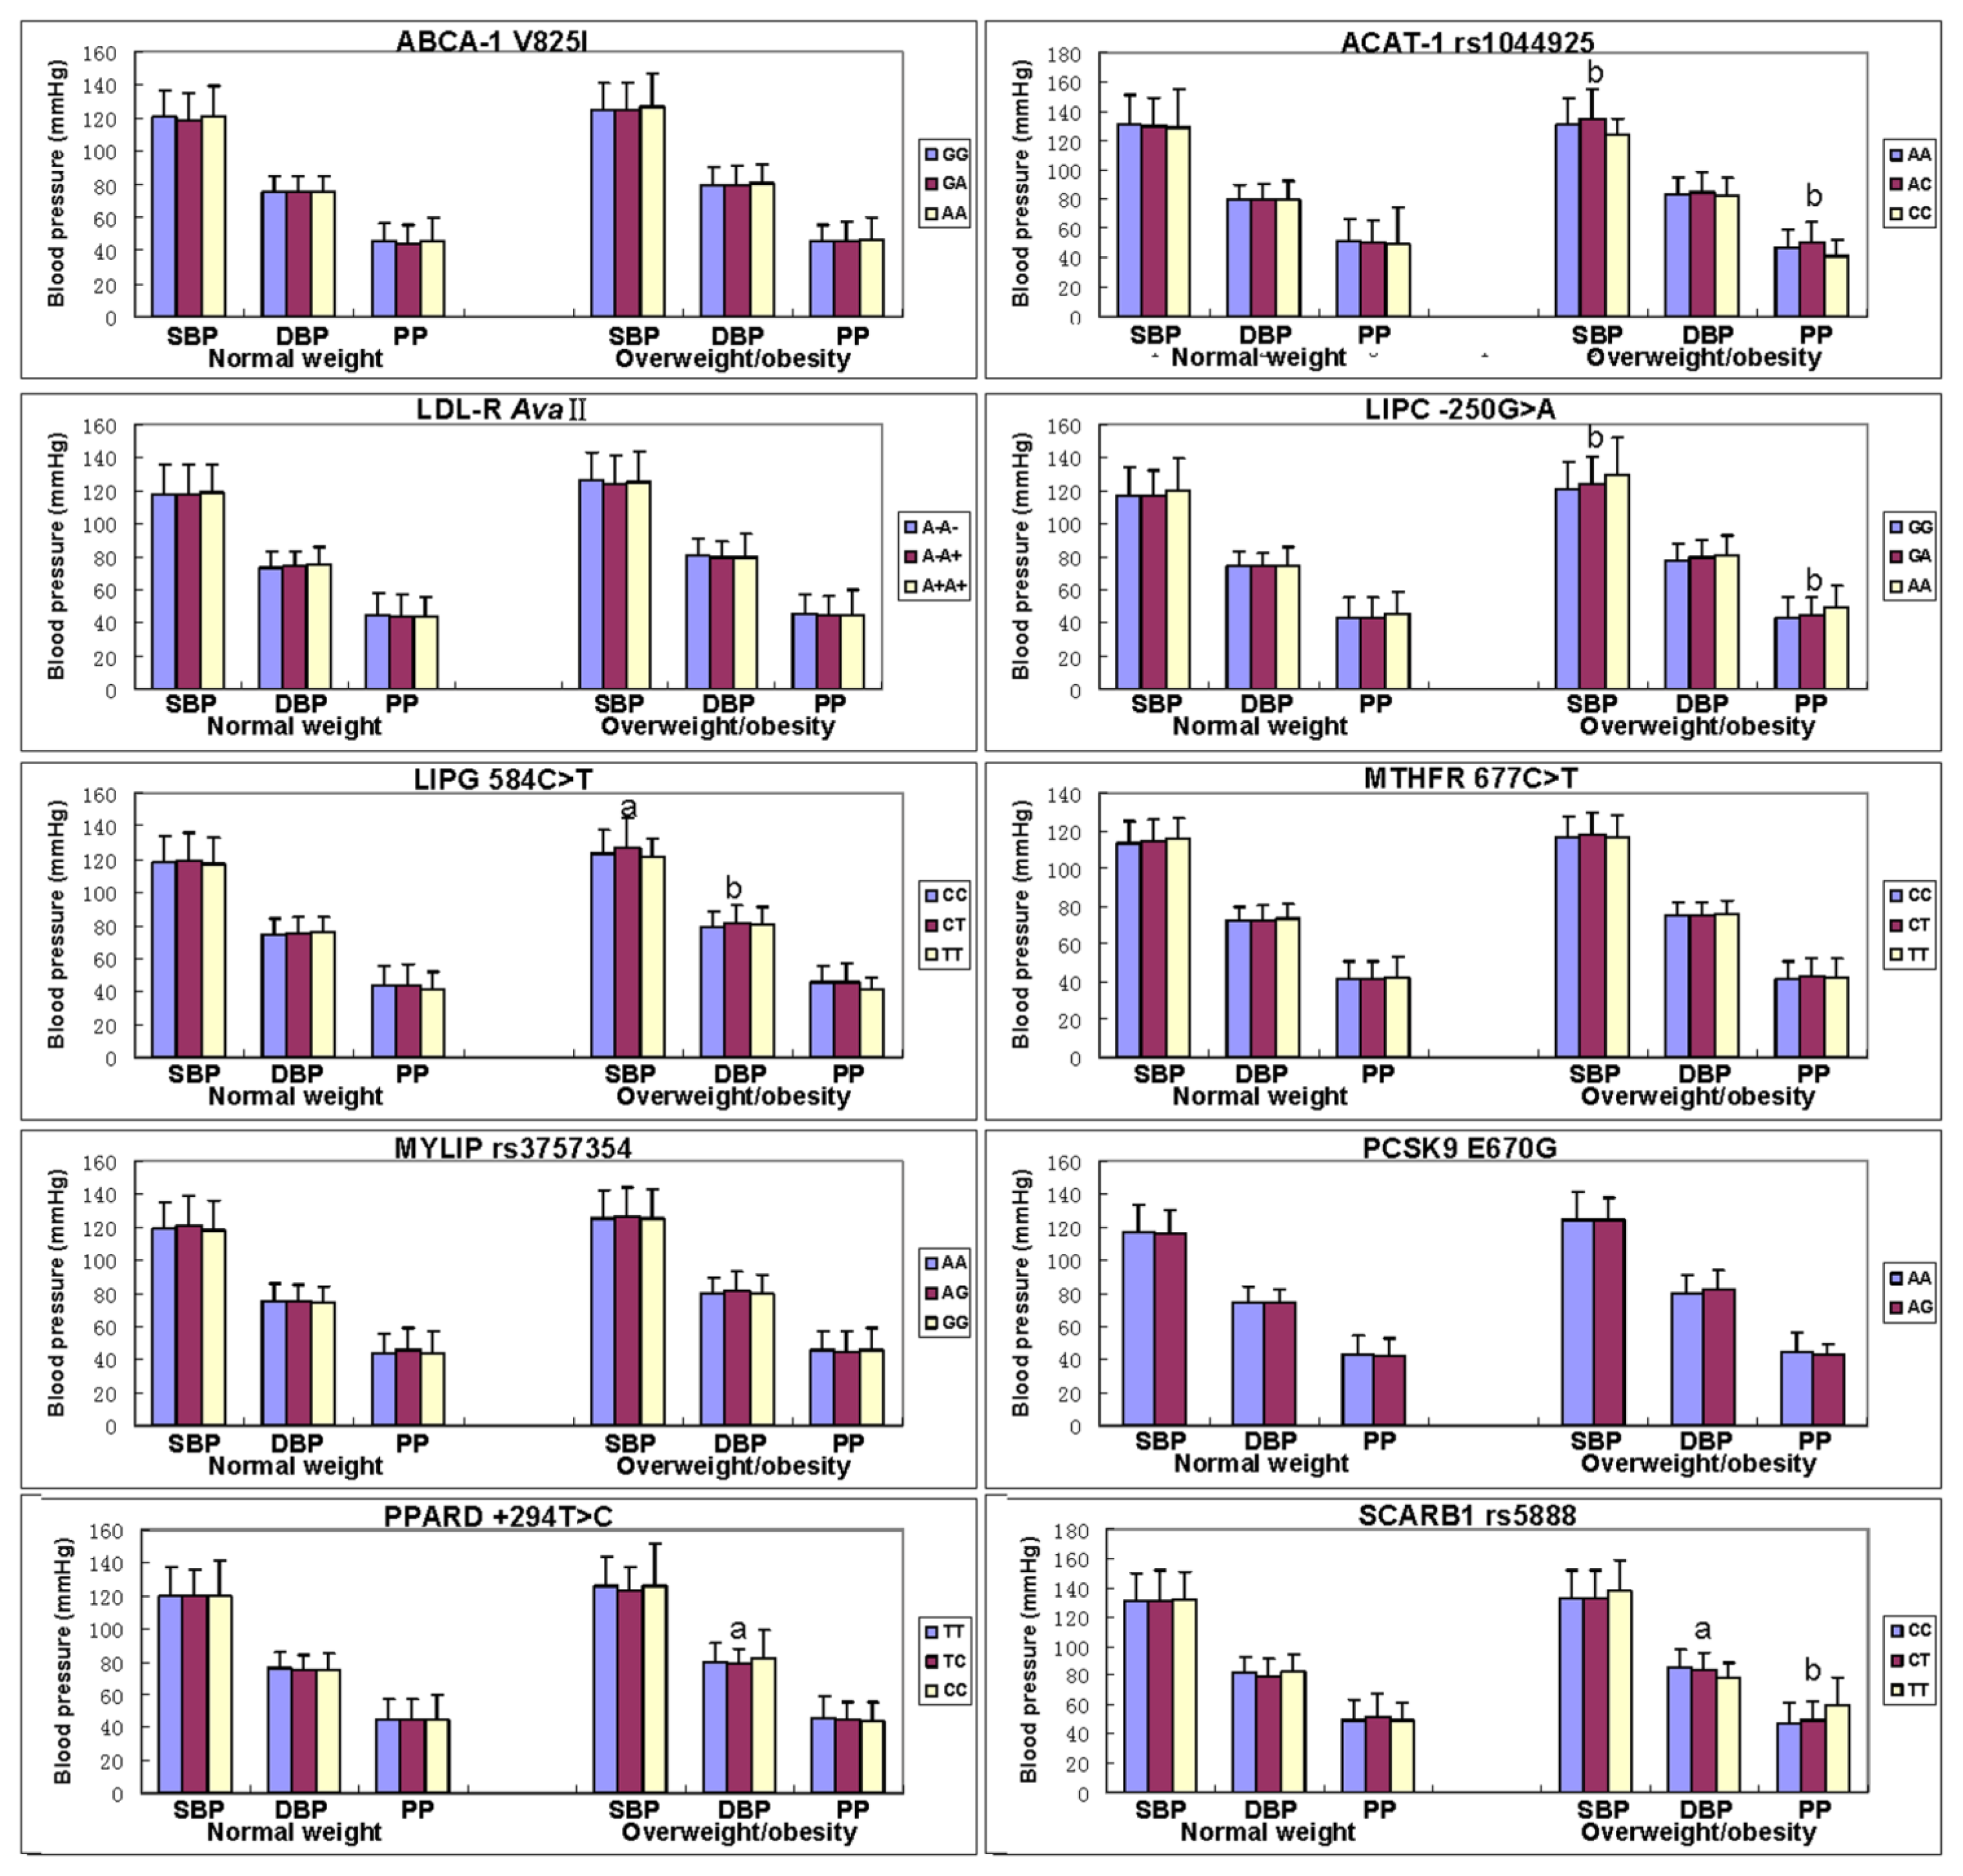
2.5. Genotypes and Blood Pressure Levels

The association of genotypes and blood pressure parameters between normal weight and overweight/obese subjects is shown in Figure 3. The levels of SBP, DBP and PP in normal weight subjects were not different among the genotypes of all SNPs (p > 0.05 for all).
The levels of SBP (ACAT-1, LIPC and LIPG), DBP (LIPG, PPARD and SCARB1), and PP (ACAT-1, LIPC and SCARB1) in overweight/obese subjects were different among the genotypes (p < 0.01–0.001).

2.6. Interactions of the SNPs and Overweight/Obesity on Blood Pressure Levels

The interactions of 10 SNPs and overweight/obesity on blood pressure levels are given in Table 3. The SNPs of ABCA-1 (SBP and PP), LDL-R (DBP), LIPC (SBP and DBP), and SCARB1 (PP) were shown interactions with overweight/obesity to influence blood pressure levels (p < 0.01–0.001). ACAT-1 AA genotype interacted with overweight/obesity to decrease PP, AC genotype interacted with overweight/obesity to increase SBP, and CC genotype interacted with overweight/obesity to decrease SBP and PP. LDL-R A-A- genotype interacted with overweight/obesity to increase DBP. LIPC GA genotype interacted with overweight/obesity to increase SBP and DBP, and AA genotype interacted with overweight/obesity to increase SBP. SCARB1 TT genotype interacted with overweight/obesity to increase PP.

2.7. Correlation between Genotypes or Alleles and Blood Pressure Parameters

The results of multiple linear regression analysis between genotypes or alleles and blood pressure parameters are shown in Table 4. Blood pressure levels were also associated with the genotypes or alleles of several SNPs in the combined population of normal weight and overweight/obese subjects, and overweight/obese subjects; respectively (p < 0.05–0.001).

3. Experimental Section

3.1. Study Population

A total of 1729 unrelated participants of Bai Ku Yao who reside in Lihu and Baxu villages in Nandan County, Guangxi, China were randomly selected from our previous stratified randomized cluster samples [3,4]. The age of the subjects ranged from 15 to 86 years, with an average age of 41.38 ± 14.71 years. There were 978 normal weight (490 males and 488 females) and 751 overweight/obese subjects (378 men and 373 women). All of the subjects were rural agricultural workers. The subjects had no evidence of diseases related to atherosclerosis, CHD and diabetes. None of them had been treated with antihypertensive drugs (such as nifedipine and/or captopril, beta-blockers, and diuretics), lipid-lowering drugs, hormones, or contraceptive drugs. The protocol was approved by the Ethics Committee of the First Affiliated Hospital, Guangxi Medical University. Informed consent was obtained from each participant.

3.2. Epidemiological Survey

The survey was carried out using internationally standardized methods [3,4]. Trained interviewers administered questionnaires to gather information on each participant’s demographic characteristics, socioeconomic status, lifestyle factors, and medical and medication history. Blood pressure was measured three times by a well-trained physician with the use of a standard mercury sphygmomanometer after the subjects had been seated for more than 5 min, and the average of three measurements was used for the analysis. SBP was determined by the first Korotkoff sound, and DBP by the fifth Korotkoff sound. PP was calculated as the SBP minus the DBP. Height was measured to the nearest 0.1 cm on a portable stadiometer. Weight was measured to the nearest 0.1 kg with the subjects standing motionless on the scale. BMI was calculated as weight in kilograms divided by the square of height in meters. Waist circumference was measured with a nonstretchable measuring tape, at the level of the smallest area of the waist, to the nearest 0.1 cm.

3.3. Biochemical Measurements

Fasting venous blood samples of 5 mL were obtained from all subjects. A part of the sample (2 mL) was collected into glass tubes and used to determine serum lipid levels. Another part of the sample (3 mL) was transferred to tubes with anticoagulate solution (4.80 g/L citric acid, 14.70 g/L glucose, and 13.20 g/L tri-sodium citrate) and used to extract deoxyribonucleic acid (DNA). The levels of TC, TG, HDL-C, and LDL-C in samples were determined by enzymatic methods. Serum ApoA1 and ApoB levels were detected by the immunoturbidimetric immunoassay. All determinations were performed with an autoanalyzer (Type 7170A; Hitachi Ltd., Tokyo, Japan) in our Clinical Science Experiment Center [3,4].

3.4. Genetic Analyses

Genomic DNA was extracted from the peripheral blood leukocytes by the phenol-chloroform method [5]. Genotyping of ABCA-1, ACAT-1, LDL-R, LIPC, LIPG, MTHFR, MYLIP, PCSK9, PPARD, and SCARB1 SNPs was performed using PCR-RFLP. The sequences of the forward and backward primers and restriction enzyme used for the genotyping of 10 SNPs, the thermocycling protocol, the approach to electrophoresis, and the procedures for quality control have been described previously [5]. Genotypes were scored by an experienced reader blinded to epidemiological data and blood pressure levels.

3.5. DNA Sequencing

Fifty-eight samples (each genotype in two; respectively) detected by the PCR-RFLP were also confirmed by direct sequencing. The PCR products were purified by low melting point gel electrophoresis and phenol extraction, and then the DNA sequences were analyzed in Shanghai Sangon Biological Engineering Technology & Services Co., Ltd., China.

3.6. Diagnostic Criteria

Hypertension was defined as an average SBP of 140 mmHg or greater and/or an average DBP of 90 mmHg or greater [3,4]. The normal values of serum TC, TG, HDL-C, LDL-C, ApoA1 and ApoB levels, and the ratio of ApoA1 to ApoB in our Clinical Science Experiment Center were 3.10–5.17, 0.56–1.70, 0.91–1.81, 2.70–3.20 mmol/L, 1.00–1.78, 0.63–1.14 g/L, and 1.00–2.50; respectively. The individuals with TC > 5.17 mmol/L and/or TG > 1.70 mmol/L were defined as hyperlipidemic [3,4]. The diagnostic criteria of overweight and obesity were according to the Cooperative Meta-analysis Group of China Obesity Task Force. Normal weight, overweight and obesity were defined as a BMI < 24, 24–28, and > 28 kg/m2; respectively [3,4].

3.7. Statistical Analysis

Data are presented as means ± SD for continuous variables and as frequencies or percentages for categorical variables. Chi square tests were used to compare the differences in percentages and to assess Hardy-Weinberg expectations. Differences in mean values were assessed using analysis of covariance (ANCOVA) and unpaired t tests. Potential confounding factors were sex, age, education level, physical activity, alcohol consumption, cigarette smoking, and hyperlipidemia. All significant associations were further corrected for multiple tests by a permutation test. The permutation test was conducted by changing the orders of dependent variable randomly against the genotypes (under the null hypothesis—no association between dependent variable and haplotypes). This process was repeated 1000 times. The p values of 1000 permutations were sorted in a descending manner. If the observed p value is less than or equal to the 950th p value, the association was considered statistically significant. The allelic and genotypic frequencies were calculated from the observed genotypic counts. The interactions of 10 SNPs and overweight/obesity on blood pressure levels were assessed by using a factorial regression analysis after controlling for potential confounders. Multiple linear regression was used to ascertain the correlation between genotypes (ABCA-1: GG = 1, GA = 2, AA = 3; ACAT-1: AA = 1, AC = 2, CC = 3; LDL-R: A−A− = 1, A−A+ = 2, A+A+ = 3; LIPC: GG = 1, GA = 2, AA = 3; LIPG: CC = 1, CT = 2, TT = 3; MTHFR: CC = 1, CT = 2, TT = 3; MYLIP: AA = 1, AG = 2, GG = 3; PCSK9: AA = 1, AG = 2; PPARD: TT = 1, TC = 2, CC = 3; and SCARB1: CC = 1, CT = 2, TT = 3) or alleles (the minor allele noncarrier = 1, the minor allele carrier = 2) and blood pressure parameters in the combined population of normal weight and overweight/obese subjects, normal weight subjects, and overweight/obese subjects; respectively.

4. Discussion

In the present study, we showed that the genotypic and allelic frequencies of LIPC and PCSK9 were different between normal weight and overweight/obese subjects, the overweight/obese subjects had higher LIPC-250A and PCSK9 670A allele frequencies than normal weight subjects. The genotypic frequency of LIPG and allelic frequency of MYLIP were also different between normal weight and overweight/obese subjects. These results indicate that several lipid-related gene SNPs may involve in the regulation of blood pressure. Both dyslipidemia and hypertension are the components of the metabolic syndrome. Blood pressure and serum lipid levels have been found to be consistently related in several previous studies [28,29]. Some studies have prospectively examined the relationship between serum lipid levels and the future development of hypertension, finding that there is an association between serum lipid levels and the development of hypertension [30,31]. Higher levels of serum TC, non-HDL-C, and the TC/HDL-C ratio were independently associated with a subsequent increased risk of incident hypertension in apparently healthy men. Elevated serum lipid levels appeared to predate the onset of hypertension by years [31,32]. In recent years, a number of studies such as genetic linkage analyses and/or genome-wide association studies have been performed to elucidate the contribution of genetic factors to both conditions [710,33,34]. These genetic observations indicate that multiple genetic factors exist that may affect both blood pressure and serum lipid levels. Some genes involved in lipid metabolism may be involved in the genetic component of the development of hypertension.
The relationship between obesity and hypertension is well recognized. Overweight and obesity increase the risk of elevated blood pressure. The prevalence of hypertension was 2- to 6-fold higher in obesity than in normal weight crowd [1719]. An increase in BMI and a decrease in BMI were significantly associated with increased and decreased SBP and DBP, respectively, compared to a stable BMI in both genders and all age groups [17,18]. In the Nurses’ Health Study [19], women with a BMI of 32 or greater had approximately six times higher risk of developing hypertension compared with women whose BMIs were less than 23. The mechanisms for the relation between obesity and blood pressure have not been fully elucidated. Insulin resistance and peripheral hyperinsulinemia resulting from overweight and obesity may play a critical role in the development of hypertension [20,21]. Other postulated factors include excessive caloric intake, enhanced sympathetic activity [22], and even the greater lean mass present in obese subjects. In addition, enhanced salt sensitivity [19], activated renin-angiotensin-aldosterone system [23], potentiated procoagulatory activity [24], and induced endothelial dysfunction [25,26] among obese individuals may be also responsible for the development of hypertension.
Several previous studies have evaluated the association between several SNPs and blood pressure variation [3549]. However, the findings are inconsistent. Liu et al. [35] found that there was no difference in the genotypic and allelic frequencies of LDL-R AvaII between normotensives and essential hypertensives. Rodríguez-Esparragón et al. [36] reported that TT genotype of MTHFR C677T was associated with an increased risk of hypertension in males. A meta-analysis showed that the MTHFR C677T was consistently associated with severe diastolic hypertension during pregnancy [37]. The MTHFR C667T modulated baseline DBP and DBP responsiveness by short-term treatment of benazapril [38,39]. A significant association between MTHFR C677T polymorphism and hypertension/hypertension-in-pregnancy in both Caucasian and Asian populations was also observed in a recent meta-analysis [40]. The patients carrying MTHFR 677T allele were at increased risk of hypertension. The frequency of co-occurrence of MTHFR 677CT/1298CC genotypes was significantly higher in patients compared to controls (p < 0.05) and was associated with increased risk of hypertension [41]. Marinho et al. [42] showed that genotype distributions of MTHFR differ significantly between control and hypertensives with a greater prevalence of CT genotype. The MTHFR 677C allele was significantly more frequent in controls compared with patients with essential hypertension (p < 0.05), and CC genotype was more frequent in controls compared to patients with essential hypertension [43]. However, several studies showed that there was no association of MTHFR C677T and the prevalence of hypertension or blood pressure levels [4446]. Gao et al. [47] reported that PPAR-gamma2 is associated with hypertension in the Han population of Inner Mongolia. The frequency of Ala allele was lower in patients with hypertension (1.3%) than in controls (3.6%, p = 0.018). The Pro12Ala polymorphism in PPAR-gamma is associated with blood pressure in subjects with type 2 diabetes. The subjects with Pro/Ala (24%) or Ala/Ala (2%) had lower DBP when adjusted for age and gender compared with Pro/Pro subjects (74%). This association was restricted to men, who also had a borderline significant difference in SBP [48]. However, Yan et al. [49] reported that the frequencies of the PPARD +294T > C genotypes were not different among the groups of metabolic syndrome, essential hypertension, and type 2 diabetes mellitus. In the current study, we showed that the levels of SBP (ACAT-1, LIPC and LIPG), DBP (LIPG, PPARD and SCARB1), and PP (ACAT-1, LIPC and SCARB1) in overweight/obese subjects but not in normal weight participants were different among the genotypes. To the best of our knowledge, the association between these SNPs and blood pressure variation in overweight/obese subjects has not been previously reported.
The interactions of 10 SNPs and overweight/obesity on blood pressure levels are not fully known. In the present study, we showed that the genotypes of ACAT-1 AC, LIPC GA and AA, and SCARB1 TT interacted with overweight/obesity to increase SBP levels, whereas the genotype of ACAT-1 CC interacted with overweight/obesity to decrease SBP levels. The genotypes of LDL-R A-A- and LIPC GA interacted with overweight/obesity to increase DBP levels. The genotype of SCARB1 TT interacted with overweight/obesity to increase PP levels, whereas the genotypes of ACAT-1 AA and CC interacted with overweight/obesity to decrease PP levels. These findings suggest that some blood pressure parameters in our study subjects were partly influenced by the interactions of several lipid-related SNPs and overweight/obesity. Lose weight and other healthy lifestyles are necessary for maintaining of normal blood pressure. To the best of our knowledge, the interactions of these SNPs and overweight/obesity on blood pressure parameters have not been previously explored.
The present study has several potential limitations. First, the levels of education, weight, and the percentages of subjects who consumed alcohol were higher in overweight/obese than in normal weight subjects, whereas the percentages of subjects who smoked cigarettes were lower in overweight/obese than in normal weight subjects. Although sex, age, education level, physical activity, alcohol consumption, cigarette smoking, and hyperlipidemia have been adjusted for the statistical analysis, we could not completely eliminate the potential effects of these factors on blood pressure levels among different genotypes in both groups. Second, the diet was not adjusted for the statistical analysis. In the present study, the population of Bai Ku Yao is a special and isolated ethnic subgroup of the Yao minority in China. The special customs and cultures including their clothing, intra-ethnic marriages, diet and lifestyle are still completely conserved to the present day. The diet in this population is consistent throughout the year and among individuals because of the Bai Ku Yao’s reliance on a limited number of locally available food items. Their staple food is corn gruel or corn tortillas. On ordinary days, they are vegetarians [3,4]. Third, it is clearly established that blood pressure levels are regulated by multiple environmental and genetic factors, and their interactions. Although we have detected the interactions of 10 lipid-related gene SNPs and overweight/obesity on blood pressure levels in this study, there are still many unmeasured environmental and genetic factors and their interactions. Thus, the interactions of gene-gene, gene-environment, and environment-environment on blood pressure levels remain to be determined. Finally, Bai Ku Yao is an isolated subgroup of the Yao minority in China. No replication of the interactions between genetic polymorphisms and overweight/obesity on blood pressure variation was obtained in this independent population. Thus, it may not generalize findings in other populations worldwide.

5. Conclusions

Several lipid-related SNPs in overweight/obese subjects were found to be associated with blood pressure levels in the Guangxi Bai Ku Yao population. The interactions of ABCA-1 (SBP and PP), LDL-R (DBP), LIPC (SBP and DBP), and SCARB1 (PP) and overweight/obesity on blood pressure levels were also detected. The differences in blood pressure levels between normal weight and overweight/obese subjects might partly result from different interactions of several lipid-related gene SNPs and overweight/obesity. However, large studies of populations with different ethnic origins are required to confirm these observations.

Acknowledgments

This work was supported by the National Natural Science Foundation of China (No. 30660061).

References

  1. Whitworth, J.A. World Health Organization, International Society of Hypertension Writing Group. 2003 World Health Organization (WHO)/International Society of Hypertension (ISH) statement on management of hypertension. J. Hypertens. 2003, 21, 1983–1992. [Google Scholar]
  2. Hui, P.; Nakayama, T.; Morita, A.; Sato, N.; Hishiki, M.; Saito, K.; Yoshikawa, Y.; Tamura, M.; Sato, I.; Takahashi, T.; et al. Common single nucleotide polymorphisms in Japanese patients with essential hypertension: Aldehyde dehydrogenase 2 gene as a risk factor independent of alcohol consumption. Hypertens. Res 2007, 30, 585–592. [Google Scholar]
  3. Yin, R.X.; Lin, W.X.; Yang, H.J.; Yang, D.Z.; Li, S.Q.; Pan, S.L.; Feng, Q.M.; Wu, J.Z.; Gan, J.T.; Deng, Y.J. Diet, lifestyle, and blood pressure of the middle-aged and elderly in the Guangxi Bai Ku Yao and Han populations. Am. J. Hypertens 2008, 21, 382–387. [Google Scholar]
  4. Yin, R.X.; Pan, S.L.; Li, S.Q.; Yang, D.Z.; Lin, W.X.; Feng, Q.M.; Chen, Y.M.; Huang, Y.H.; Zhou, Y.J.; Liao, Q.C. Comparison of hypertension and its risk factors between the Guangxi Bai Ku Yao and Han populations. Blood Press 2008, 17, 306–316. [Google Scholar]
  5. Yin, R.X.; Wu, D.F.; Wu, J.Z.; Cao, X.L.; Aung, L.H.; Miao, L.; Long, X.J.; Liu, W.Y.; Zhang, L.; Li, M. Interactions of several lipid-related gene polymorphisms and cigarette smoking on blood pressure levels. Int. J. Biol. Sci 2012, 8, 685–696. [Google Scholar]
  6. Xu, Q.; Wang, Y.H.; Tong, W.J.; Gu, M.L.; Wu, G.; Buren, B.; Liu, Y.Y.; Wang, J.; Li, Y.S.; Feng, H.; et al. Interaction and relationship between angiotensin converting enzyme gene and environmental factors predisposing to essential hypertension in Mongolian population of China. Biomed. Environ. Sci 2004, 17, 177–186. [Google Scholar]
  7. Levy, D.; Ehret, G.B.; Rice, K.; Verwoert, G.C.; Launer, L.J.; Dehghan, A.; Glazer, N.L.; Morrison, A.C.; Johnson, A.D.; Aspelund, T.; et al. Genome-wide association study of blood pressure and hypertension. Nat. Genet 2009, 41, 677–687. [Google Scholar]
  8. Newton-Cheh, C.; Johnson, T.; Gateva, V.; Tobin, M.D.; Bochud, M.; Coin, L.; Najjar, S.S.; Zhao, J.H.; Heath, S.C.; Eyheramendy, S.; et al. Genome-wide association study identifies eight loci associated with blood pressure. Nat. Genet 2009, 41, 666–676. [Google Scholar]
  9. Sõber, S.; Org, E.; Kepp, K.; Juhanson, P.; Eyheramendy, S.; Gieger, C.; Lichtner, P.; Klopp, N.; Veldre, G.; Viigimaa, M.; et al. Targeting 160 candidate genes for blood pressure regulation with a genome-wide genotyping array. PLoS One 2009, 4, e6034. [Google Scholar]
  10. Ehret, G.B.; Munroe, P.B.; Rice, K.M.; Bochud, M.; Johnson, A.D.; Chasman, D.I.; Smith, A.V.; Tobin, M.D.; Verwoert, G.C.; et al. International Consortium for Blood Pressure Genome-Wide Association Studies. Genetic variants in novel pathways influence blood pressure and cardiovascular disease risk. Nature 2011, 478, 103–109. [Google Scholar] [Green Version]
  11. Kopelman, P.G. Obesity as a medical problem. Nature 2000, 404, 635–643. [Google Scholar]
  12. James, P.T. Obesity: The worldwide epidemic. Clin. Dermatol 2004, 22, 276–280. [Google Scholar]
  13. Cheung, C.Y.; Tso, A.W.; Cheung, B.M.; Xu, A.; Ong, K.L.; Fong, C.H.; Wat, N.M.; Janus, E.D.; Sham, P.C.; Lam, K.S. Obesity susceptibility genetic variants identified from recent genome-wide association studies: Implications in a Chinese population. J. Clin. Endocrinol. Metab 2010, 95, 1395–1403. [Google Scholar]
  14. Ogden, C.L.; Carroll, M.D.; Curtin, L.R.; McDowell, M.A.; Tabak, C.J.; Flegal, K.M. Prevalence of overweight and obesity in the United States, 1999–2004. J. Am. Med. Assoc 2006, 295, 1549–1555. [Google Scholar]
  15. Flegal, K.M.; Carroll, M.D.; Ogden, C.L.; Curtin, L.R. Prevalence and trends in obesity among U.S. adults, 1999–2008. J. Am. Med. Assoc 2010, 303, 235–241. [Google Scholar]
  16. Reynolds, K.; Gu, D.; Whelton, P.K.; Wu, X.; Duan, X.; Mo, J.; He, J. InterASIA Collaborative Group. Prevalence and risk factors of overweight and obesity in China. Obesity (Silver Spring) 2007, 15, 10–18. [Google Scholar]
  17. Droyvold, W.B.; Midthjell, K.; Nilsen, T.I.; Holmen, J. Change in body mass index and its impact on blood pressure: A prospective population study. Int. J. Obes. Relat. Metab. Disord 2005, 29, 650–655. [Google Scholar]
  18. Tseng, C.H. Body mass index and blood pressure in adult type 2 diabetic patients in Taiwan. Circ. J 2007, 71, 1749–1754. [Google Scholar]
  19. Witteman, J.C.; Willett, W.C.; Stampfer, M.J.; Colditz, G.A.; Sacks, F.M.; Speizer, F.E.; Rosner, B.; Hennekens, C.H. A prospective study of nutritional factors and hypertension among US women. Circulation 1989, 80, 1320–1327. [Google Scholar]
  20. Brock, C.M.; King, D.S.; Wofford, M.R.; Harrell, T.K. Exercise, insulin resistance, and hypertension: A complex relationship. Metab. Syndr. Relat. Disord 2005, 3, 60–65. [Google Scholar]
  21. Rahmouni, K.; Fath, M.A.; Seo, S.; Thedens, D.R.; Berry, C.J.; Weiss, R.; Nishimura, D.Y.; Sheffield, V.C. Leptin resistance contributes to obesity and hypertension in mouse models of Bardet-Biedl syndrome. J. Clin. Invest 2008, 118, 1458–1467. [Google Scholar]
  22. Liatis, S.; Tentolouris, N.; Katsilambros, N. Cardiac autonomic nervous system activity in obesity. Pediatr. Endocrinol. Rev 2004, 1, 476–483. [Google Scholar]
  23. Sarzani, R.; Salvi, F.; Dessì-Fulgheri, P.; Rappelli, A. Renin-angiotensin system, natriuretic peptides, obesity, metabolic syndrome, and hypertension: An integrated view in humans. J. Hypertens 2008, 26, 831–843. [Google Scholar]
  24. Koenig, W. Haemostatic risk factors for cardiovascular diseases. Eur. Heart J 1998, 19, C39–C43. [Google Scholar]
  25. Fouillioux, C.; Contreras, F.; Lares, M.; Cano, R.; Leal, E.; Arraiz, N.; Bermúdez, V.; Velasco, M. Metabolic and hemodynamic markers of endothelial dysfunction in patients with hypertension and patients with type 2 diabetes during the cold pressor test. Am. J. Ther 2008, 15, 389–396. [Google Scholar]
  26. Brocq, M.L.; Leslie, S.J.; Milliken, P.; Megson, I.L. Endothelial dysfunction: From molecular mechanisms to measurement, clinical implications, and therapeutic opportunities. Antioxid. Redox. Signal 2008, 10, 1631–1674. [Google Scholar]
  27. Li, Q.; Yin, R.X.; Wei, X.L.; Yan, T.T.; Aung, L.H.; Wu, D.F.; Wu, J.Z.; Lin, W.X.; Liu, C.W.; Pan, S.L. ATP-binding cassette transporter G5 and G8 polymorphisms and several environmental factors with serum lipid levels. PLoS One 2012, 7, e37972. [Google Scholar]
  28. Selby, J.V.; Newman, B.; Quiroga, J.; Christian, J.C.; Austin, M.A.; Fabsitz, R.R. Concordance for dyslipidemic hypertension in male twins. J. Am. Med. Assoc 1991, 265, 2079–2084. [Google Scholar]
  29. Ruixing, Y.; Jinzhen, W.; Weixiong, L.; Yuming, C.; Dezhai, Y.; Shangling, P. The environmental and genetic evidence for the association of hyperlipidemia and hypertension. J. Hypertens 2009, 27, 251–258. [Google Scholar]
  30. Hunt, S.C.; Stephenson, S.H.; Hopkins, P.N.; Williams, R.R. Predictors of an increased risk of future hypertension in Utah. A screening analysis. Hypertension 1991, 17, 969–976. [Google Scholar]
  31. Halperin, R.O.; Sesso, H.D.; Ma, J.; Buring, J.E.; Stampfer, M.J.; Gaziano, J.M. Dyslipidemia and the risk of incident hypertension in men. Hypertension 2006, 47, 45–50. [Google Scholar]
  32. Shen, B.J.; Todaro, J.F.; Niaura, R.; McCaffery, J.M.; Zhang, J., III; Spiro, A.; Ward, K.D. Are metabolic risk factors one unified syndrome? Modeling the structure of the metabolic syndrome X. Am. J. Epidemiol 2003, 157, 701–711. [Google Scholar]
  33. Allayee, H.; de Bruin, T.W.; Dominguez, K.M.; Cheng, L.S.; Ipp, E.; Cantor, R.M.; Krass, K.L.; Keulen, E.T.; Aouizerat, B.E.; Lusis, A.J.; et al. Genome scan for blood pressure in Dutch dyslipidemic families reveals linkage to a locus on chromosome 4p. Hypertension 2001, 38, 773–778. [Google Scholar]
  34. Franceschini, N.; Reiner, A.P.; Heiss, G. Recent findings in the genetics of blood pressure and hypertension traits. Am. J. Hypertens 2011, 24, 392–400. [Google Scholar]
  35. Liu, A.P.; Zhan, S.Y.; Li, L.M.; Hu, Y.H.; Cao, W.H.; Wu, T.; Li, J.; Guo, X.X. Association between AvaII exon 13 polymorphism at the LDL receptor gene different and serum lipid levels in normotensives and essential hypertensives in Shanghai (In Chinese). Zhonghua Liu Xing Bing Xue Za Zhi 2003, 24, 542–546. [Google Scholar]
  36. Rodríguez-Esparragón, F.; Hernández-Perera, O.; Rodríguez-Pérez, J.C.; Anábitarte, A.; Díaz-Cremades, J.M.; Losada, A.; Fiuza, D.; Hernández, E.; Yunis, C.; Ferrario, C.M. The effect of methylenetetrahydrofolate reductase C677T common variant on hypertensive risk is not solely explained by increased plasma homocysteine values. Clin. Exp. Hypertens 2003, 25, 209–220. [Google Scholar]
  37. Kosmas, I.P.; Tatsioni, A.; Ioannidis, J.P. Association of C677T polymorphism in the methylenetetrahydrofolate reductase gene with hypertension in pregnancy and pre-eclampsia: A meta-analysis. J. Hypertens 2004, 22, 1655–1662. [Google Scholar]
  38. Jiang, S.; Hsu, Y.H.; Xu, X.; Xing, H.; Chen, C.; Niu, T.; Zhang, Y.; Peng, S.; Xu, X. The C677T polymorphism of the methylenetetrahydrofolate reductase gene is associated with the level of decrease on diastolic blood pressure in essential hypertension patients treated by angiotensin-converting enzyme inhibitor. Thromb. Res 2004, 113, 361–369. [Google Scholar]
  39. Jiang, S.; Hsu, Y.H.; Niu, T.; Xu, X.; Xing, H.; Chen, C.; Wang, X.; Zhang, Y.; Peng, S.; Xu, X. A common haplotype on methylenetetrahydrofolate reductase gene modifies the effect of angiotensin-converting enzyme inhibitor on blood pressure in essential hypertension patients—A family-based association study. Clin. Exp. Hypertens 2005, 27, 509–521. [Google Scholar]
  40. Qian, X.; Lu, Z.; Tan, M.; Liu, H.; Lu, D. A meta-analysis of association between C677T polymorphism in the methylenetetrahydrofolate reductase gene and hypertension. Eur. J. Hum. Genet 2007, 15, 1239–1245. [Google Scholar]
  41. Markan, S.; Sachdeva, M.; Sehrawat, B.S.; Kumari, S.; Jain, S.; Khullar, M. MTHFR 677 CT/MTHFR 1298 CC genotypes are associated with increased risk of hypertension in Indians. Mol. Cell. Biochem 2007, 302, 125–131. [Google Scholar]
  42. Marinho, C.; Alho, I.; Arduíno, D.; Falcão, L.M.; Brás-Nogueira, J.; Bicho, M. GST M1/T1 and MTHFR polymorphisms as risk factors for hypertension. Biochem. Biophys. Res. Commun 2007, 353, 344–350. [Google Scholar]
  43. Ilhan, N.; Kucuksu, M.; Kaman, D.; Ilhan, N.; Ozbay, Y. The 677 C/T MTHFR polymorphism is associated with essential hypertension, coronary artery disease, and higher homocysteine levels. Arch. Med. Res 2008, 39, 125–130. [Google Scholar]
  44. Ravera, M.; Viazzi, F.; Berruti, V.; Leoncini, G.; Zagami, P.; Bezante, G.P.; Rosatto, N.; Ravazzolo, R.; Pontremoli, R.; Deferrari, G. 5,10-Methylenetetrahydrofolate reductase polymorphism and early organ damage in primary hypertension. Am. J. Hypertens 2001, 14, 371–376. [Google Scholar]
  45. Lwin, H.; Yokoyama, T.; Yoshiike, N.; Saito, K.; Yamamoto, A.; Date, C.; Tanaka, H. Polymorphism of methylenetetrahydrofolate reductase gene (C677T MTHFR) is not a confounding factor of the relationship between serum uric acid level and the prevalence of hypertension in Japanese men. Circ. J 2006, 70, 83–87. [Google Scholar]
  46. Stiefel, P.; Miranda, M.L.; Bellido, L.M.; Luna, J.; Jiménez, L.; Pamies, E.; de Frutos, P.G.; Villar, J. Genotype of the CYBA promoter-930A/G, polymorphism C677T of the MTHFR and APOE genotype in patients with hypertensive disorders of pregnancy: An observational study. Med. Clin (Barc) 2009, 133, 657–661. [Google Scholar]
  47. Gao, L.; Wang, L.; Yun, H.; Su, L.; Su, X. Association of the PPARgamma2 gene Pro12Ala variant with primary hypertension and metabolic lipid disorders in Han Chinese of Inner Mongolia. Genet. Mol. Res 2010, 9, 1312–1320. [Google Scholar]
  48. Ostgren, C.J.; Lindblad, U.; Melander, O.; Melander, A.; Groop, L.; Råstam, L. Peroxisome proliferator-activated receptor-gammaPro12Ala polymorphism and the association with blood pressure in type 2 diabetes: Skaraborg hypertension and diabetes project. J. Hypertens 2003, 21, 1657–1662. [Google Scholar]
  49. Yan, Z.C.; Shen, C.Y.; Zhong, J.; Wang, L.; Ni, Y.X.; Nie, H.; Zhu, Z.M. PPARdelta + 294T/C gene polymorphism related to plasma lipid, obesity and left ventricular hypertrophy in subjects with metabolic syndrome (In Chinese). Zhonghua Xin Xue Guan Bing Za Zhi 2005, 33, 529–533. [Google Scholar]
Figure 1. Genotyping of 10 lipid-related gene polymorphisms by polymerase chain reaction and restriction fragment length polymorphism (PCR-RFLP). ABCA1, ATP-binding cassette transporter A1. Lane M, 100 bp marker ladder; lanes 1 and 2, GG genotype (525 bp); lanes 3 and 4, GA genotype (525-, 302- and 223-bp); and lanes 5 and 6, AA genotype (302- and 223-bp); ACAT-1, acyl-CoA:cholesterol acyltransferase-1. Lane M, 100 bp marker ladder; lanes 1–3, AA genotype (389 bp); lanes 4 and 5, AC genotype (389-, 279- and 110-bp); and lanes 6 and 7, CC genotype (279- and 110-bp); LDL-R, low density lipoprotein receptor. Lane M, 50 bp marker ladder; lanes 1–6, A+A+ genotype (141- and 87-bp); lanes 7–12, A-A+ genotype (228-, 141- and 87-bp); and lanes 13–15, A-A- genotype (228-bp); LIPC, hepatic lipase gene. Lane M, 100 bp marker ladder; lanes 1–3, GG genotype (411 bp); lane 4, GA genotype (411-, 301- and 110-bp); and lanes 5–7, AA genotype (301- and 110-bp); LIPG, endothelial lipase gene. Lane M, 50 bp marker ladder; lane 1, the PCR product of the sample (254 bp); lanes 2 and 3, CC genotype (254 bp); lanes 4 and 5, CT genotype (254-, 217- and 37-bp); and lanes 6 and 7, TT genotype (217- and 37-bp). The 37 bp fragment was invisible in the gel owing to its fast migration speed; MTHFR, methylenetetrahydrofolate reductase. Lane M, 50 bp marker ladder; lanes 1–3, CC genotype (245 bp); lanes 4–6, CT genotype (245-, 173- and 72-bp); and lanes 7 and 8, TT genotype (173- and 72-bp); MYLIP, the E3 ubiquitin ligase myosin regulatory light chain-interacting protein. Lane M, 100 bp marker ladder; lanes 1 and 2, AA genotype (387 bp); lanes 3 and 4, AG genotype (387-, 306- and 81-bp); and lanes 5 and 6, GG genotype (306- and 81-bp); PCSK9, proprotein convertase subtilisin-like kexin type 9. Lane M, 100 bp marker ladder; lanes 1 and 2, PCR products of the samples (440 bp); lanes 3 and 4, AG genotype (440-, 290- and 150-bp); and lanes 5 and 6, AA genotype (290- and 150-bp). The GG homozygous of the PCSK9 E670G was not detected in our study population; PPARD, peroxisome proliferator-activated receptor delta. Lane M, 100 bp marker ladder; lanes 1 and 2, TT genotype (269 bp); lanes 3–5, TC genotype (269-, 167- and 102-bp); and lanes 6 and 7, CC genotype (167- and 102-bp); SCARB1, Scavenger receptor class B type 1. Lane M, 50 bp marker ladder; lanes 1 and 2, TT genotype (218 bp); lanes 3 and 4, CT genotype (218-, 187- and 31-bp); and lanes 5 and 6, CC genotype (187- and 31-bp). The 31 bp fragment was invisible in the gel owing to its fast migration speed.
Ijms 13 12062f1
Figure 2. The parts of the nucleotide sequence of 10 lipid-related gene polymorphisms by direct sequencing. ABCA-1, ATP-binding cassette transporter A1; ACAT-1, acyl-CoA:cholesterol acyltransferase-1; LDL-R, low density lipoprotein receptor; LIPC, hepatic lipase gene; LIPG, endothelial lipase gene; MTHFR, methylenetetrahydrofolate reductase; MYLIP, the E3 ubiquitin ligase myosin regulatory light chain-interacting protein. PCSK9, proprotein convertase subtilisin-like kexin type 9; PPARD, peroxisome proliferator-activated receptor delta; SCARB1, Scavenger receptor class B type 1.
Ijms 13 12062f2
Figure 3. The genotypes of 10 SNPs and blood pressure levels between the normal weight and overweight/obese subjects. SBP, systolic blood pressure; DBP, diastolic blood pressure; PP, pulse pressure; ABCA-1, ATP-binding cassette transporter A1; ACAT-1, acyl-CoA:cholesterol acyltransferase-1; LDL-R, low density lipoprotein receptor; LIPC, hepatic lipase gene; LIPG, endothelial lipase gene; MTHFR, methylenetetrahydrofolate reductase; MYLIP, the E3 ubiquitin ligase myosin regulatory light chain-interacting protein; PCSK9, proprotein convertase subtilisin-like kexin type 9; PPARD, peroxisome proliferator-activated receptor delta; SCARB1, Scavenger receptor class B type 1. Sex, age, education level, physical activity, alcohol consumption, cigarette smoking, and hyperlipidemia have been adjusted for the statistical analysis. a p < 0.01 and b p < 0.001 (after permutation correction).
Ijms 13 12062f3
Table 1. The general characteristics and blood pressure levels between normal weight and overweight/obese subjects.
CharacteristicsNormal weightOverweight/obesityt2)p
Number978751--
Male/female490/488378/3730.0090.924
Age, years41.48 ± 16.2141.25 ± 12.500.3320.740
Education level, years3.71 ± 3.894.71 ± 4.49−4.1700.000
Height, cm153.73 ± 7.57154.29 ± 8.49−1.4610.144
Weight, kg50.28 ± 6.2063.19 ± 8.86−34.0420.000
Body mass index, kg/m221.23 ± 1.6826.48 ± 2.59−48.2850.000
Waist circumference, cm70.58 ± 6.5682.90 ± 7.39−30.7660.000
Alcohol consumption, n (%)373 (38.1)362 (48.2)23.0340.000
Cigarette smoking, n (%)305 (31.2)178 (23.7)15.0360.001
Systolic blood pressure, mmHg119.69 ± 17.40125.84 ± 17.64−7.2420.000
Diastolic blood pressure, mmHg75.11 ± 9.9880.57 ± 11.13−10.5630.000
Pulse pressure, mmHg44.60 ± 12.8745.36 ± 12.11−1.2510.211
Total cholesterol, mmol/L4.46 ± 0.945.01 ± 1.05−11.3250.000
Triglyceride, mmol/L1.21 ± 1.021.74 ± 1.50−8.8370.000
HDL-C, mmol/L1.80 ± 0.471.73 ± 0.413.0990.002
LDL-C, mmol/L2.52 ± 0.732.96 ± 0.85−11.1800.000
Apolipoprotein (Apo) A1, g/L1.37 ± 0.311.40 ± 0.27−2.0090.045
ApoB, g/L0.84 ± 0.220.98 ± 0.24−12.4660.000
ApoA1/ApoB1.75 ± 0.701.53 ± 0.587.2560.000
Values are means ± SD or number of subjects (%). HDL-C, high-density lipoprotein cholesterol; LDL-C, low-density lipoprotein cholesterol.
Table 2. The genotypic and allelic frequencies between the subjects with normal weight and overweight/obesity [n (%)].
SNPGenotype (Allele)Normal weight (n = 978)Overweight/obesity (n = 751)χ2p
ABCA-1 V825I (rs2066715)GG326 (33.3)269 (35.8)
GA480 (49.1)334 (44.5)
AA172 (17.6)148 (19.7)3.7080.157
G1132 (57.9)872 (58.1)
A824 (42.1)630 (41.9)0.0120.914

ACAT-1 (rs1044925)AA662 (67.7)527 (70.2)
AC279 (28.5)205 (27.3)
CC37 (3.8)19 (2.5)2.6710.263
A1603 (82.0)1259 (83.8)
C353 (18.0)243 (16.2)2.0800.149

LDL-R AvaIIA−A−527 (53.9)389 (51.8)
A−A+371 (37.9)295 (39.3)
A+A+80 (8.2)67 (8.9)0.8240.662
A−1425 (72.9)1073 (71.4)
A+531 (27.1)429 (28.6)0.8480.357

LIPC −250G > A (rs2070895)GG480 (49.1)233 (31.0)
GA425 (43.5)432 (57.5)
AA73 (7.5)86 (11.5)57.8820.000
G1385 (70.8)898 (59.8)
A571 (29.2)604 (40.2)45.9990.000

LIPG 584C > T (rs2000813)CC454 (46.4)308 (41.0)
CT477 (48.8)412 (54.9)
TT47 (4.8)31 (4.1)6.3140.043
C1385 (70.8)1028 (68.4)
T571 (29.2)474 (31.6)2.2550.133

MTHFR 677C > T (rs1801133)CC471 (48.2)354 (47.1)
CT441 (45.1)341 (45.4)
TT66 (6.7)56 (7.5)0.4040.817
C1383 (70.7)1049 (69.8)
T573 (29.3)453 (30.2)0.3050.581

MYLIP (rs3757354)AA230 (23.5)148 (19.7)
AG477 (48.8)363 (48.3)
GG271 (27.7)240 (32.0)5.4310.066
A937 (47.9)659 (43.9)
G1019 (52.1)843 (56.1)5.5500.018

PCSK9 E670G (rs505151)AA916 (93.7)721 (96.0)
AG62 (6.3)30 (4.0)
GG004.6360.031
A1894 (96.8)1472 (98.0)
G62 (3.2)30 (2.0)4.5090.034

PPARD +294T > C (rs2016520)TT559 (57.2)396 (52.7)
TC354 (36.2)312 (41.5)
CC65 (6.6)43 (5.7)5.2390.073
T1472 (75.3)1104 (73.5)
C484 (24.7)398 (26.5)1.3750.241

SCARB1 (rs5888)CC548 (56.0)417 (55.5)
CT390 (39.9)311 (41.4)
TT40 (4.1)23 (3.1)1.4970.473
C1486 (76.0)1145 (76.2)
T470 (24.0)357 (23.8)0.0320.859
Values are number of subjects (%). SNP, single nucleotide polymorphism; ABCA-1, ATP-binding cassette transporter A1; ACAT-1, acyl-CoA:cholesterol acyltransferase-1; LDL-R, low density lipoprotein receptor; LIPC, hepatic lipase gene; LIPG, endothelial lipase gene; MTHFR, methylenetetrahydrofolate reductase; MYLIP, the E3 ubiquitin ligase myosin regulatory light chain-interacting protein; PCSK9, proprotein convertase subtilisin-like kexin type 9; PPARD, peroxisome proliferator-activated receptor delta; SCARB1, Scavenger receptor class B type 1.
Table 3. Interactions of several lipid-related gene polymorphisms and overweight/obesity on blood pressure levels.
SNPGenotypeNormal weightOverweight/obesity


SBPDBPPPSBPDBPPP
ABCA-1 V825I (rs2066715)GG120.5 ± 15.975.4 ± 10.045.2 ± 11.2125.5 ± 15.480.0 ± 10.145.6 ± 10.2
GA118.8 ± 16.375.0 ± 9.643.8 ± 11.9125.1 ± 16.579.6 ± 11.345.5 ± 11.4
AA120.9 ± 18.675.5 ± 9.245.5 ± 14.3126.5 ± 20.180.1 ± 12.246.4 ± 13.4
F2.1270.2622.3090.1990.0790.724
p0.1200.7700.1000.8200.9240.485

ACAT-1 (rs1044925)AA130.6 ± 20.279.4 ± 10.651.2 ± 15.0130.3 ± 18.383.5 ± 11.346.8 ± 12.5↓
AC129.6 ± 19.079.7 ± 11.149.9 ± 15.3135.1 ± 20.1↑84.9 ± 13.950.2 ± 13.9
CC129.0 ± 25.579.8 ± 12.749.2 ± 24.9123.5 ± 11.5↓82.1 ± 12.741.5 ± 10.4↓
F0.3380.1121.0485.8251.2895.910
p0.7140.8940.3510.000 c0.2760.000 c

LDL-R AvaIIA−A−118.0 ± 17.573.4 ± 9.844.5 ± 13.2126.3 ± 16.780.5 ± 10.8↑45.8 ± 11.7
A−A+118.1 ± 18.074.2 ± 9.343.9 ± 12.9123.9 ± 17.379.2 ± 10.044.7 ± 11.4
A+A+118.9 ± 17.174.9 ± 10.544.0 ± 11.2124.7 ± 18.979.8 ± 13.745.0 ± 15.2
F0.1421.4200.3402.2494.2760.538
p0.8670.2420.7120.1060.003 c0.548

LIPC −250G > A (rs2070895)GG117.1 ± 16.974.2 ± 9.342.9 ± 12.7120.6 ± 16.977.8 ± 9.742.8 ± 13.1
GA116.8 ± 15.873.8 ± 8.943.0 ± 12.3123.8 ± 16.4↑79.5 ± 10.4↑44.3 ± 10.9
AA119.8 ± 19.274.3 ± 11.845.5 ± 13.5129.7 ± 22.0↑80.2 ± 12.649.5 ± 13.1
F1.3470.2991.6854.2333.1252.367
p0.2610.7410.1860.003c0.009 c0.094

LIPG 584C > T (rs2000813)CC117.8 ± 15.874.4 ± 9.543.37 ± 12.30123.6 ± 13.978.2 ± 10.545.3 ± 10.5
CT119.1 ± 17.075.3 ± 9.643.81 ± 12.60126.8 ± 18.281.1 ± 11.045.7 ± 11.6
TT116.8 ± 16.276.0 ± 8.841.07 ± 10.72121.5 ± 11.180.1 ± 10.941.4 ± 6.8
F1.2141.4521.2610.9202.4080.087
p0.2970.2350.2840.3990.0900.917

MTHFR 677C > T (rs1801133)CC113.7 ± 11.772.6 ± 7.541.1 ± 9.7116.4 ± 10.974.8 ± 7.541.7 ± 9.3
CT114.1 ± 11.973.0 ± 7.341.1 ± 9.5118.1 ± 11.775.2 ± 6.643.0 ± 9.6
TT115.8 ± 10.573.4 ± 7.642.5 ± 10.4116.8 ± 11.775.7 ± 7.642.6 ± 10.2
F1.0570.6040.6601.3120.0051.186
p0.3480.5470.5170.2700.9950.306

MYLIP (rs3757354)AA118.9 ± 16.375.5 ± 9.943.5 ± 11.8125.5 ± 16.579.5 ± 9.946.0 ± 11.2
AG120.8 ± 17.775.4 ± 10.045.4 ± 13.3126.3 ± 17.981.5 ± 11.244.8 ± 12.0
GG118.4 ± 17.674.4 ± 10.044.1 ± 12.9125.4 ± 18.079.9 ± 11.645.8 ± 12.8
F2.1221.1942.2240.2931.6482.565
p0.1200.3030.1090.7460.1930.077

PCSK9 E670G (rs505151)AA117.2 ± 16.374.2 ± 9.642.9 ± 12.0124.2 ± 16.979.8 ± 11.044.4 ± 12.1
AG116.0 ± 15.074.1 ± 8.141.8 ± 11.3124.7 ± 13.182.2 ± 11.942.5 ± 6.4
F0.4180.0060.6200.4571.8680.085
p0.5180.9380.4310.4990.1720.770

PPARD +294T > C (rs2016520)TT120.0 ± 17.575.7 ± 10.144.4 ± 12.8125.8 ± 18.379.9 ± 11.145.9 ± 13.3
TC119.4 ± 16.674.6 ± 9.244.7 ± 12.1123.5 ± 14.678.4 ± 8.945.1 ± 10.7
CC120.0 ± 21.375.5 ± 9.844.5 ± 15.5125.9 ± 25.782.0 ± 17.443.9 ± 11.2
F0.2071.3010.0880.6290.8580.703
p0.8130.2730.9160.5330.4240.495

SCARB1 (rs5888)CC130.3 ± 19.381.2 ± 11.749.1 ± 14.7132.4 ± 19.985.1 ± 12.047.3 ± 14.2
CT131.1 ± 20.679.7 ± 11.551.4 ± 16.4132.6 ± 19.183.6 ± 11.548.9 ± 13.8
TT131.7 ± 19.582.1 ± 12.649.6 ± 11.4137.6 ± 21.278.6 ± 10.359.1 ± 19.8↑
F0.2272.1902.6150.3572.9204.830
p0.7970.1120.0740.7000.0540.002 c
SNP, single nucleotide polymorphism; SBP, systolic blood pressure; DBP, diastolic blood pressure; PP, pulse pressure; ABCA-1, ATP-binding cassette transporter A1; ACAT-1, acyl-CoA:cholesterol acyltransferase-1; LDL-R, low density lipoprotein receptor; LIPC, hepatic lipase gene; LIPG, endothelial lipase gene; MTHFR, methylenetetrahydrofolate reductase; MYLIP, the E3 ubiquitin ligase myosin regulatory light chain-interacting protein; PCSK9, proprotein convertase subtilisin-like kexin type 9; PPARD, peroxisome proliferator-activated receptor delta; SCARB1, Scavenger receptor class B type 1. The values of F and p of the overweight/obese subjects are the interactions between genotypes and overweight/obesity on blood pressure parameters. P c is the p-value after permutation correction. ↑, genotype and overweight/obesity interactions to increase blood pressure levels; ↓, genotype and overweight/obesity interactions to decrease blood pressure levels. Sex, age, education level, physical activity, alcohol consumption, cigarette smoking, and hyperlipidemia have been adjusted for the statistical analysis.
Table 4. Correlation between genotypes or alleles and blood pressure levels in the normal weight and overweight/obese subjects.
Blood pressureGenotype/alleleUnstandardized coefficientStd. errorStandardized coefficienttp
Total population

SBPLIPC −250G > A genotype2.2110.5870.0813.7640.000
LIPC −250G > A allele1.8870.7600.0542.4820.013
LIPG 584C > T allele1.7990.7370.0532.4140.016

DBPLIPG 584C > T genotype1.3960.4030.0773.4600.001
LIPG 584C > T allele1.7340.4660.0833.7180.000
PPARD +294T > C allele−0.9640.469−0.046−2.0540.040
SCARB1 rs5888 genotype−1.2980.494−0.062−2.6270.009
SCARB1 rs5888 allele−1.5300.564−0.064−2.7110.007

PPSCARB1 rs5888 genotype1.9450.6060.0743.2080.001
SCARB1 rs5888 allele2.0950.6940.0703.0160.003

Overweight/obesity

SBPACAT-1 rs1044925 genotype2.8841.2770.0792.2590.024
ACAT-1 rs1044925 allele4.8161.4430.1163.3380.001
LIPC −250G > A genotype4.3170.9330.1544.6290.000
LIPC −250G > A allele4.4151.2670.1173.4840.001
LIPG 584C > T allele2.8501.1660.0852.4440.015

DBPLIPC −250G > A genotype1.4440.5790.0862.4930.013
LIPC −250G > A allele1.9380.7820.0852.4780.013
LIPG 584C > T genotype2.1670.6710.1123.2320.001
LIPG 584C > T allele2.7830.7640.1263.6440.000
SCARB1 rs5888 genotype−1.9790.762−0.093−2.5970.010
SCARB1 rs5888 allele−1.7880.856−0.075−2.0890.037

PPACAT-1 rs1044925 allele2.6510.9410.0932.8160.005
LIPC −250G > A genotype2.8620.6500.1484.4050.000
LIPC −250G > A allele2.4140.8820.0932.7360.006
SCARB1 rs5888 genotype2.9890.8840.1173.3830.001
SCARB1 rs5888 allele2.3840.9940.0832.3970.017
SBP, systolic blood pressure; DBP, diastolic blood pressure; PP, pulse pressure; ABCA-1, ATP-binding cassette transporter A1; ACAT-1, acyl-CoA:cholesterol acyltransferase-1; LDL-R, low density lipoprotein receptor; LIPC, hepatic lipase gene; LIPG, endothelial lipase gene; MTHFR, methylenetetrahydrofolate reductase; MYLIP, the E3 ubiquitin ligase myosin regulatory light chain-interacting protein; PCSK9, proprotein convertase subtilisin-like kexin type 9; PPARD, peroxisome proliferator-activated receptor delta; SCARB1, Scavenger receptor class B type 1. Sex, age, education level, physical activity, alcohol consumption, cigarette smoking, and hyperlipidemia have been adjusted for the statistical analysis.

