Article

Extreme Multiple Reticulate Origins of the Pteris cadieri Complex (Pteridaceae)

1
Division of Botanical Garden, Taiwan Forestry Research Institute, Taipei 10006, Taiwan
2
South China Botanical Garden, Chinese Academy of Sciences, Guangzhou 510650, China
3
Department of Biological Sciences, National Sun Yat-Sen University, Kaohsiung 80424, Taiwan
*
Authors to whom correspondence should be addressed.
These authors contributed equally to this work.
Int. J. Mol. Sci. 2012, 13(4), 4523-4544; https://doi.org/10.3390/ijms13044523
Submission received: 3 February 2012 / Revised: 21 March 2012 / Accepted: 26 March 2012 / Published: 10 April 2012
(This article belongs to the Section Biochemistry)

Abstract

:
The Pteris cadieri complex displays extensive morphological variation and seems to have originated through hybridization. However, the members of this complex reproduce by apogamy, which usually limits genetic variation. To evaluate the hypotheses of hybrid origins, the pattern of evolution in this species complex is reconstructed. Multiple methodologies were used. Diploids, triploids, and tetraploids were identified by chromosome counts and flow cytometry. Nuclear DNA markers (cytosolic phosphoglucose isomerase gene, PgiC) were used, together with chloroplast DNA markers (atpB-rbcL spacer and rbcL gene) to infer the biparental and maternal lineages of the Pteris cadieri complex. The three cpDNA haplotype groups and five PgiC alleles found in this study indicate that the evolution of the Pteris cadieri complex has been extremely reticulate. Up to 11 taxa belonging to eight morphs were identified. By comparing genetic variation in the Pteris cadieri in two independent areas, Hainan and Taiwan, we inferred that hybridization has occurred independently in different areas. Furthermore, we found evidence for phenological divergence (evergreen and deciduous) within Taiwan. We propose that the Pteris cadieri complex originated from different genetic lineages through multiple hybridizations in different geographical areas, leading to its present morphological diversity.

1. Introduction

Plants arising from hybridization usually have varied morphologies, which usually exhibit a gradual cline [1,2]. In some cases, the hybrids can cross with their parents and result in offspring with diverse genetic characters [35]. The delimitation of hybrid offsprings and the parental species becomes gradually indistinguishable. Hybridization has been demonstrated in ferns with great morphological variation, including Asplenium [6], Athyrium [7], Polystichum [8], Cheilanthes [9,10], and the Vandenboschia radicans complex [11]. Although most hybrid fern species seem to have high levels of genetic variation, apogamous ferns, usually the result of hybridization, have limited genetic variation [12]. Apogamy is a special form of asexual reproduction in ferns and provides a means for overcoming the inability of non-homologous chromosomes to pair in hybrid ferns [1315]. The parents and offspring of apogamous ferns have almost identical genetic characters and thus express the same morphologies. As a result, the mechanism of apogamy creates reproductive barriers that prevent gene flow among closely-related taxa, facilitating sympatric speciation.
The Pteris cadieri complex is widely distributed in eastern and southern Asia. The scale of morphological variation in P. cadieri, whose fronds range from simply pinnate to bipinnatifid, has led several authors to treat P. cadieri as several different species, including P. cadieri Christ, P. dimorpha Copel., P. grevilleana Wall. ex J. Agardh, P. hainanensis Ching, P. plumbea Christ, and P. × sintenensis (Masam.) Kuo [1619]. The morphology of these taxa overlapped to such an extent that it was difficult to identify each species unambiguously, leading some authors to treat them as synonyms of P. cadieri [16,19,20]. The significant morphological variation noted in the description of P. cadieri lead to the hypothesis that it arose through hybridization [2123]. Pteris grevilleana, with bipinnatifid fronds, was thought to be a parent of P. cadieri [2224]. Because of the apogamy of P. cadieri and P. grevilleana, both species are thought to have arisen from hybridization. However, P. grevileana should not be a parent of P. cadieri [25]. Their exact relationships remain unclear. On the other hand, the P. cadieri complex is apogamous but has distinctly great morphological variation. This complex could arise from complicated evolutionary events.
Recently, several hypotheses have described how species could be derived from multiple origins by a number of mechanisms [26], with recurrent hybridization events and polyploidy considered most important [2729]. Diverse cytotypes and genetic lineages are indicative of multiple hybridization and polyploidy [3032]. Because each population/taxon could arise independently, geographical patterns could provide valuable insights into historical processes [3335].
Nucleotide variation in plastid genes has proven a powerful tool for reconstructing plant phylogeny. Nuclear DNA data can provide bi-parental information about hybrids. In ferns, however, few nuclear markers have been developed, and some have disconcerting limitations. For example, internal transcribed spacers (ITS), popular sequences for phylogenetic inference, are of limited utility in ferns due to high homoplasy, bias of one parent, and difficult sequencing caused by secondary structure [3638]. Single-copy genes are more easily analyzed than low-copy genes. Among gene markers commonly used in ferns, leafy and gapCp were reported to be multiple-copy genes in some species [10,39,40], therefore, cytosolic phosphoglucose isomerase (PgiC) is considered the most suitable single-copy gene [41,42].
To investigate the Pteris cadieri species complex, with its great morphological variation, we collected plants with as many different morphologies as possible. However, this complex is widely distributed in eastern and southern Asia, so we could not obtain samples across its entire range for this study. For this study, we collected samples from two independent geographic regions, the islands of Hainan and Taiwan. We sampled extensively and tried to obtain samples of every morphological variant observed in the distinct populations on each island. We explored the evolutionary origins of the P. cadieri complex using multiple methodologies. To detect the presence of polyploidy, cytotypes were determined using cytological analyses. To detect hybrid origins, molecular analyses, including chloroplast (atpB-rbcL spacer and rbcL gene) and nuclear marker (PgiC gene) data, were used to make inferences about the maternal and paternal genetic lineages. Based on these analyses, we discuss the relationship between morphological variation, ploidy, and recurrent origins in the P. cadieri complex.

2. Results and Discussion

2.1. Results

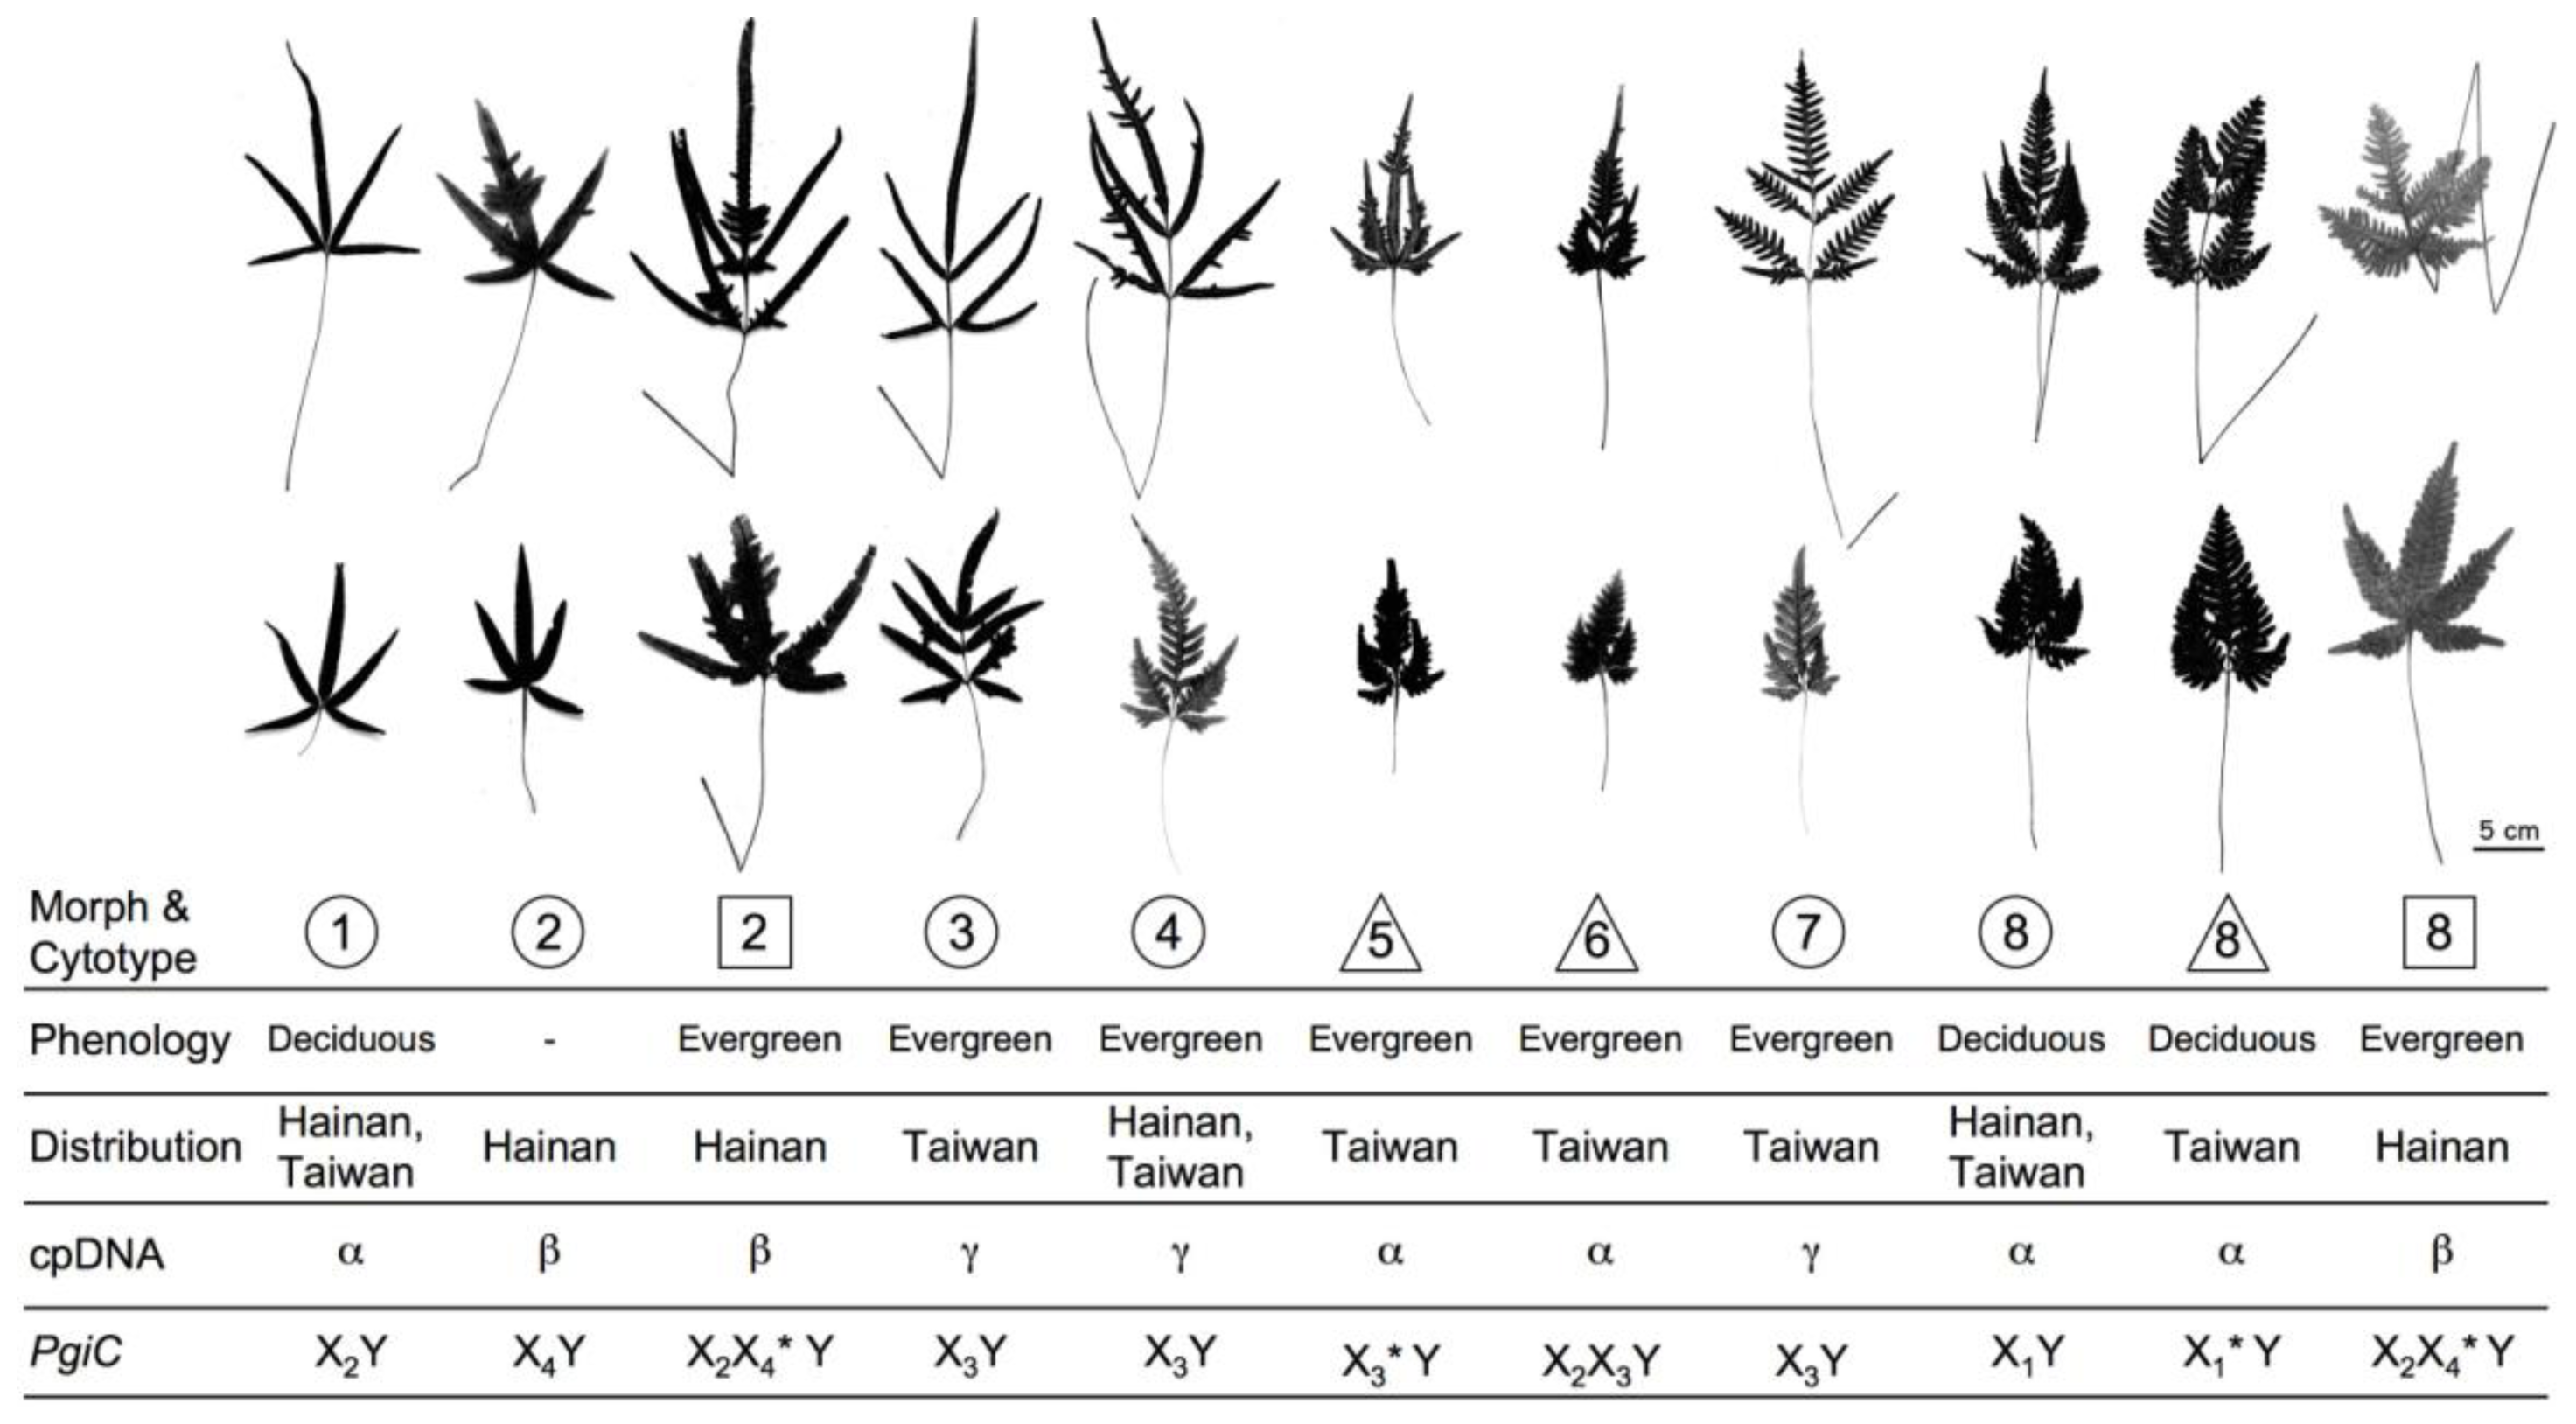
2.1.1. Morphological Discrimination

Samples were collected of each morphological variant in the Pteris cadieri complex from six populations in Hainan and 21 populations in Taiwan. Based on our careful and extensive searches of both islands we think we obtained samples from each population on Hainan and Taiwan [43,44]. Voucher specimens were deposited in the herbarium (TAIF) of the Taiwan Forest Research Institute (Supplementary S1). Altogether, eight morphological types were identified (morph 1 to morph 8), including simply pinnate, irregularly bipinnatifid, and regularly bipinnatifid. The morphological characters of each morph are summarized in Table 1 (see Figure 1 photos). Compared to the type specimens of related taxa, several morphs corresponded to previously described taxa: morph 1 was P. cadieri, morph 2 was P. hainanensis, morph 3 was P. plumbea, morph 4 was P. dimorpha, and morph 8 was P. grevilleana. However, morphs 5, 6, and 7 had no corresponding scientific names.

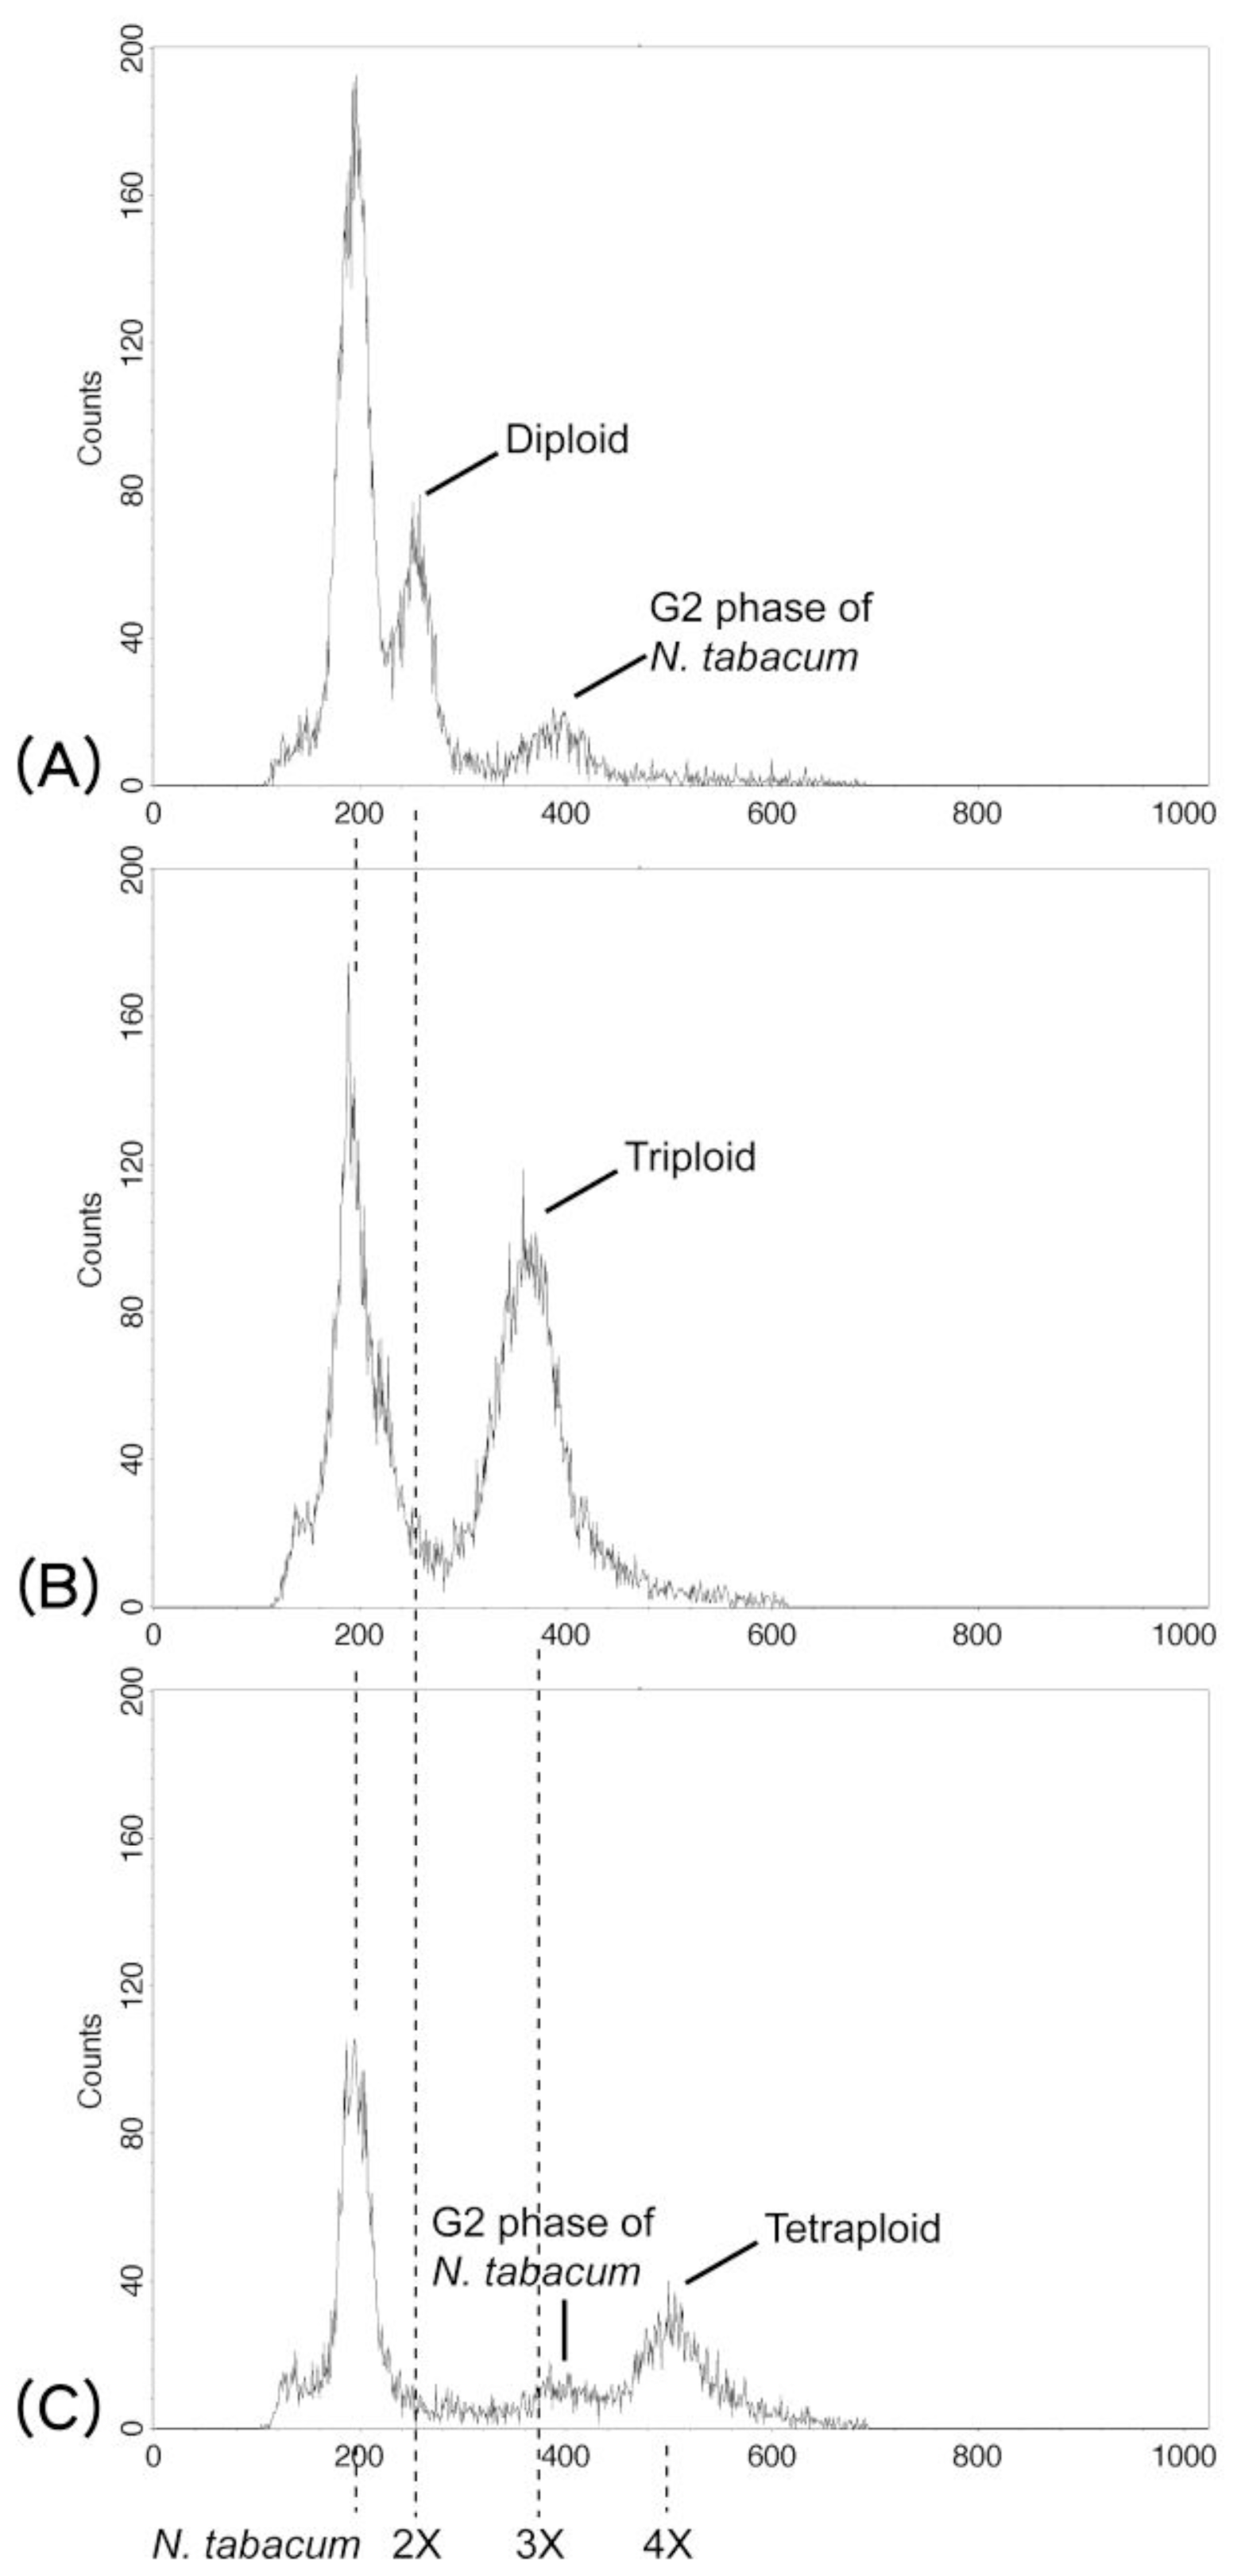
2.1.2. Cytotypes, Phenology, and Reproductive Systems

Using flow cytometry, the cytotypes of each plant in the P. cadieri complex were determined. Nicotiana tabacum L. “Xanthi” (4X = 20.08 pg; [45]) was used as a calibration standard to infer the genome size of the P. cadieri complex. We compared cytometric data for N. tabacum with those for diploid, triploid, and tetraploid members of the P. cadieri complex (Figure 2). The P. cadieri complex/N. tabacum genome ratios were 1.2, 1.8, or 2.4. Based on the genome size of N. tabacum and plants with known cytotypes (diploid and triploid, [25]), the genome size of diploid and triploid plants of the P. cadieri complex was approximately 24 pg (=20.08 pg × 1.2) and 36 pg (=20.08 pg × 1.8), respectively. We inferred that P. cadieri complex plants with a genome size of approximately 48 pg (=20.08 pg × 2.4) were tetraploid. The ploidy level of each morph was identified: morphs 1, 3, 4, and 7 were diploid; morphs 5 and 6 were triploid; morph 2 was diploid or tetraploid; morph 8 was diploid, triploid, or tetraploid. Therefore, the P. cadieri complex is comprised of 11 taxa altogether (Figure 1).
Ferns were cultivated in the Taipei Botanical Garden greenhouse for one to five years. Although all plants were collected at altitudes below 1000 m, their phenological characters were different. Morphs 3, 4, 5, 6, 7, and tetraploid morphs 2 and 8, were evergreen, whereas morph 1 and diploid and triploid morph 8 were deciduous in winter. Tetraploid morph 2 (from Hainan) were not studied because too few plants were cultivated.
The number of spores per sporangium was counted for each plant, except for a few plants that lacked fertile blades. All fertile plants had sporangia with 32 spores. A few sporangia had only 16 or 28 spores. Since no 64-spore sporangia were found, all the observed plants were determined to be apogamous.

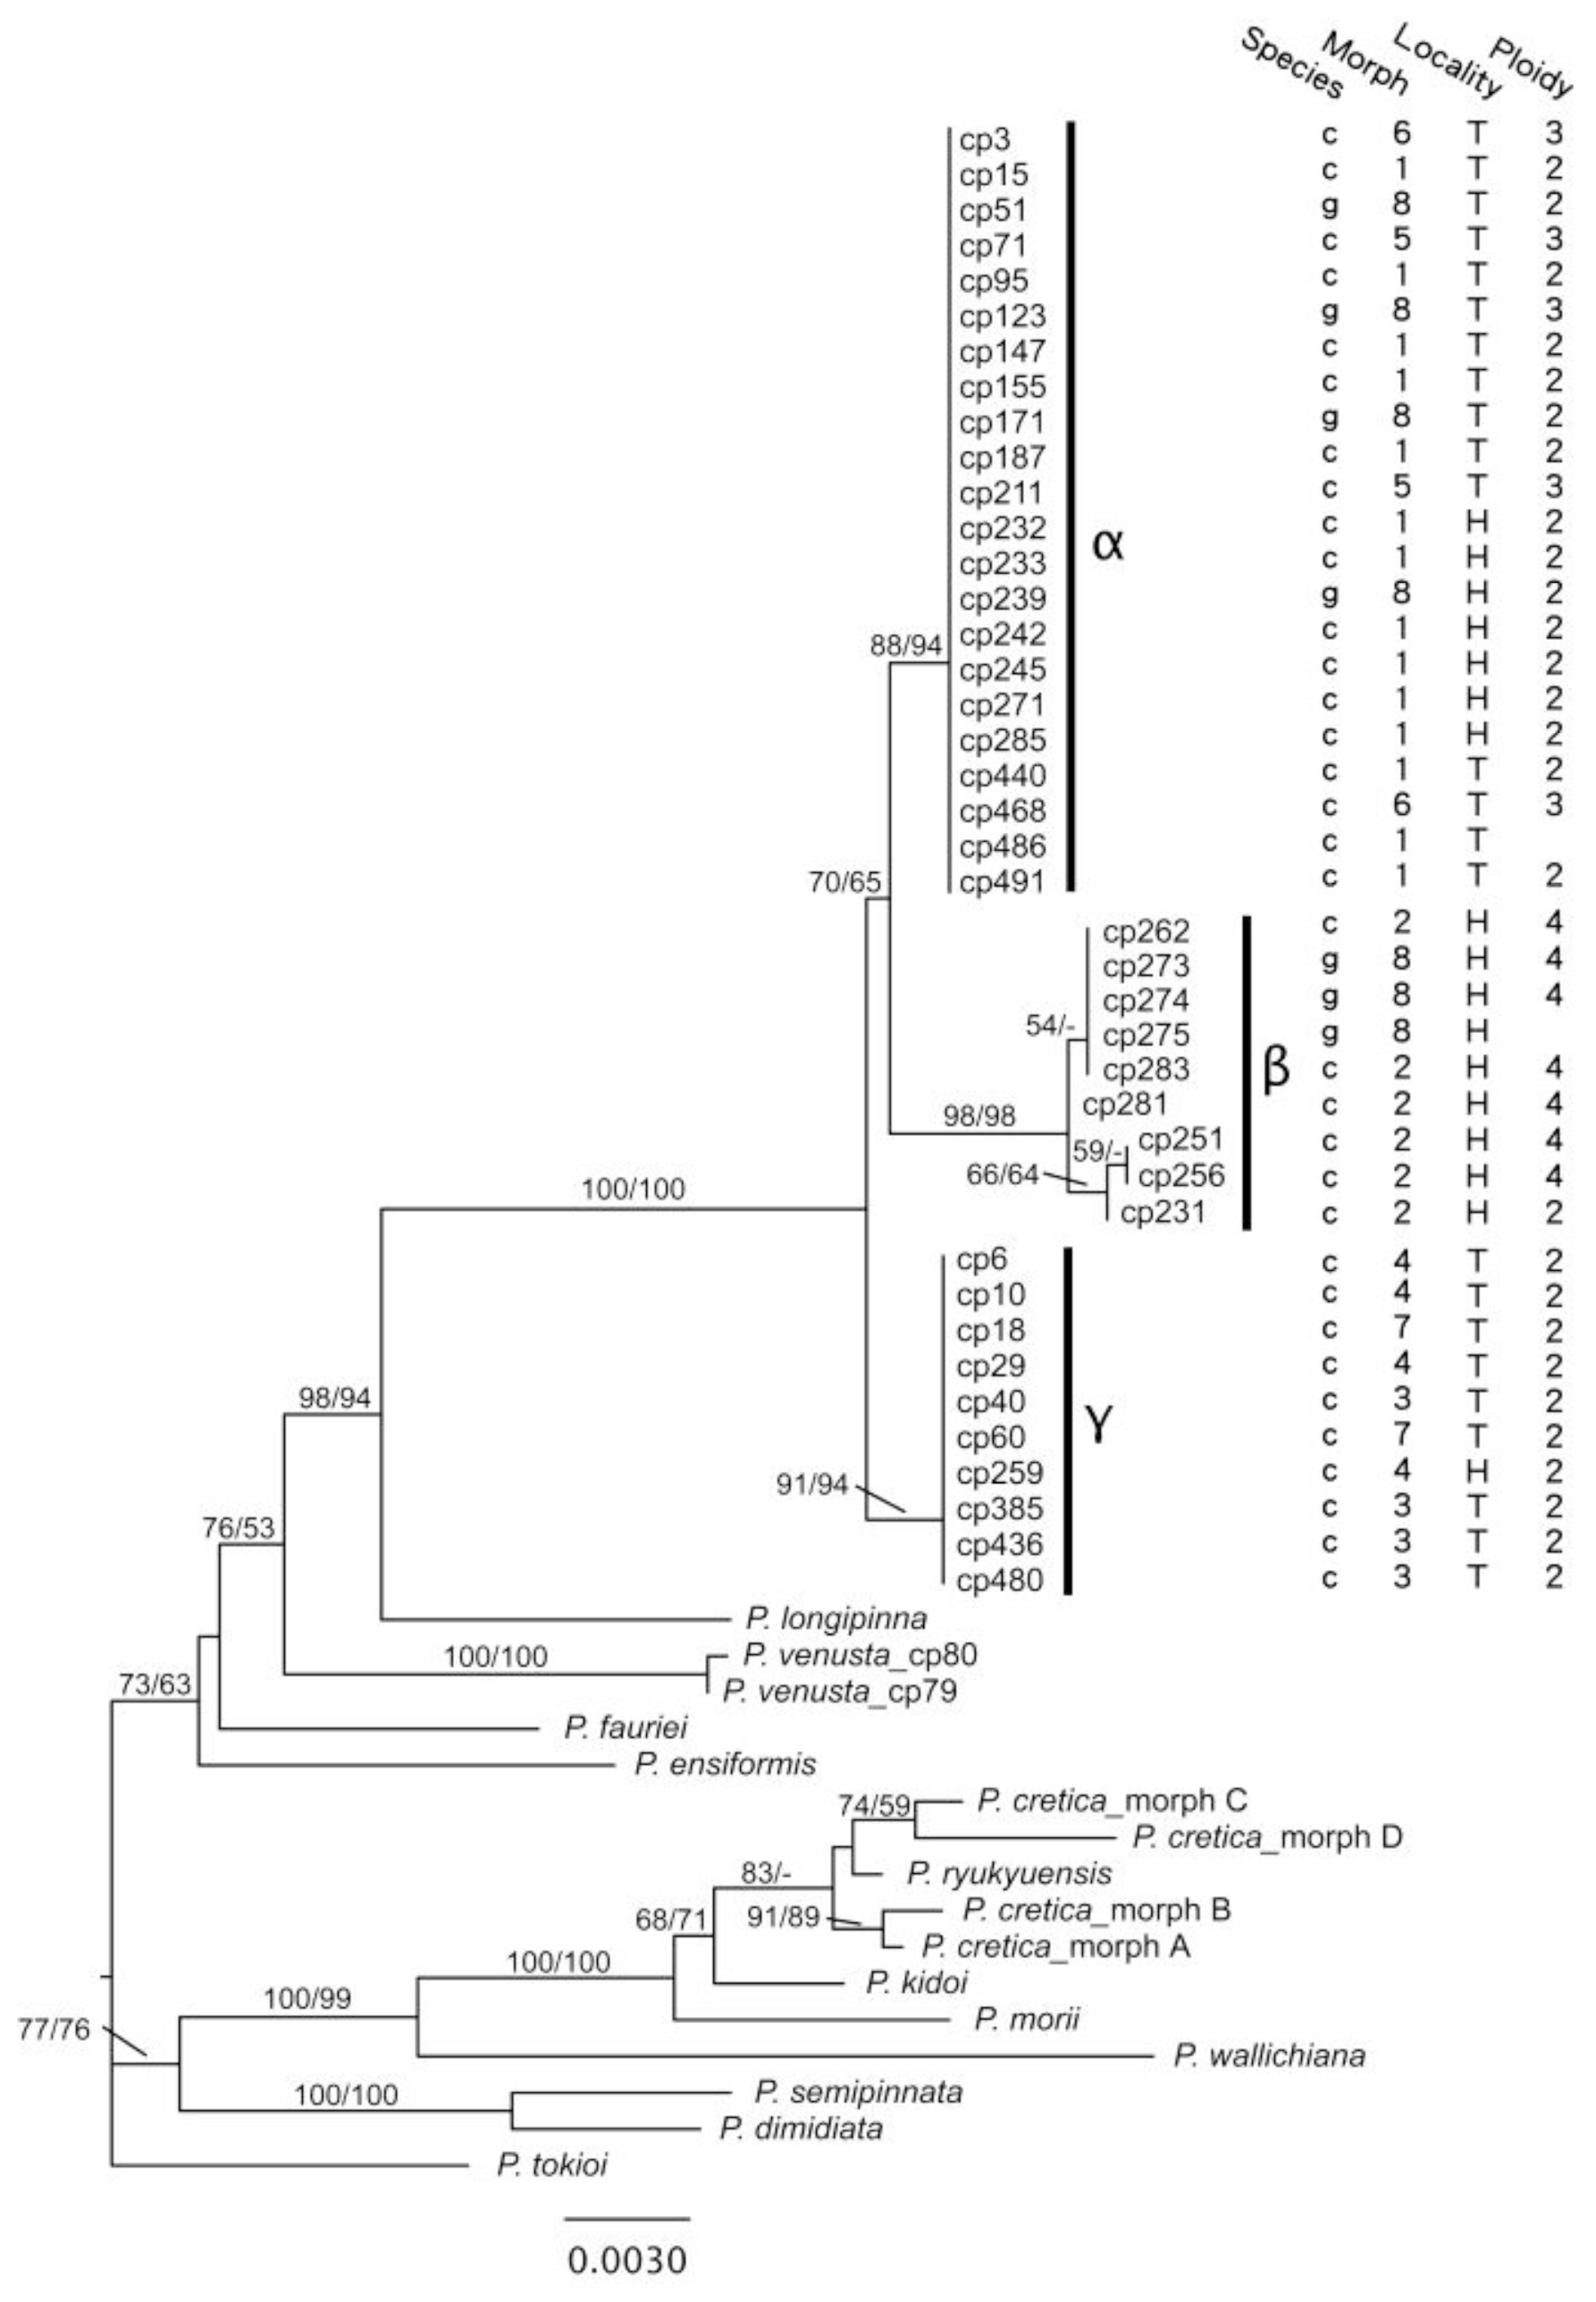
2.1.3. Phylogenetic Resolution of Chloroplast DNA Data

We performed the following phylogenetic analyses using the combined sequences of the two regions, including the atpB-rbcL spacer and rbcL gene (primers in Table 2). The ILD test did not show significant incongruence (P value = 0.289). General features of the DNA regions are summarized in Table 3. For the combined cpDNA dataset, the 50% majority rule consensus MP tree and the ML trees had identical topology (the ML tree is shown in Figure 3). The P. cadieri complex formed a well supported, monophyletic group distinct from the other Pteris species included in the analysis. The closest outgroup species was P. longipinna. The chloroplast haplotypes of the P. cadieri complex were assigned to three, moderately- to well-supported clades: haplotype groups α, β, and γ. Pteris cadieri had haplotype groups α, β, and γ, whereas P. grevilleana had haplotype groups α and β. Most morphs had a single haplotype group, except morph 8, which had two haplotype groups. Diploid and triploid morph 8 belonged to haplotype α, and tetraploid morph 8 belonged to haplotype β. Ploidy levels are shown on the chloroplast ML tree (Figure 3).

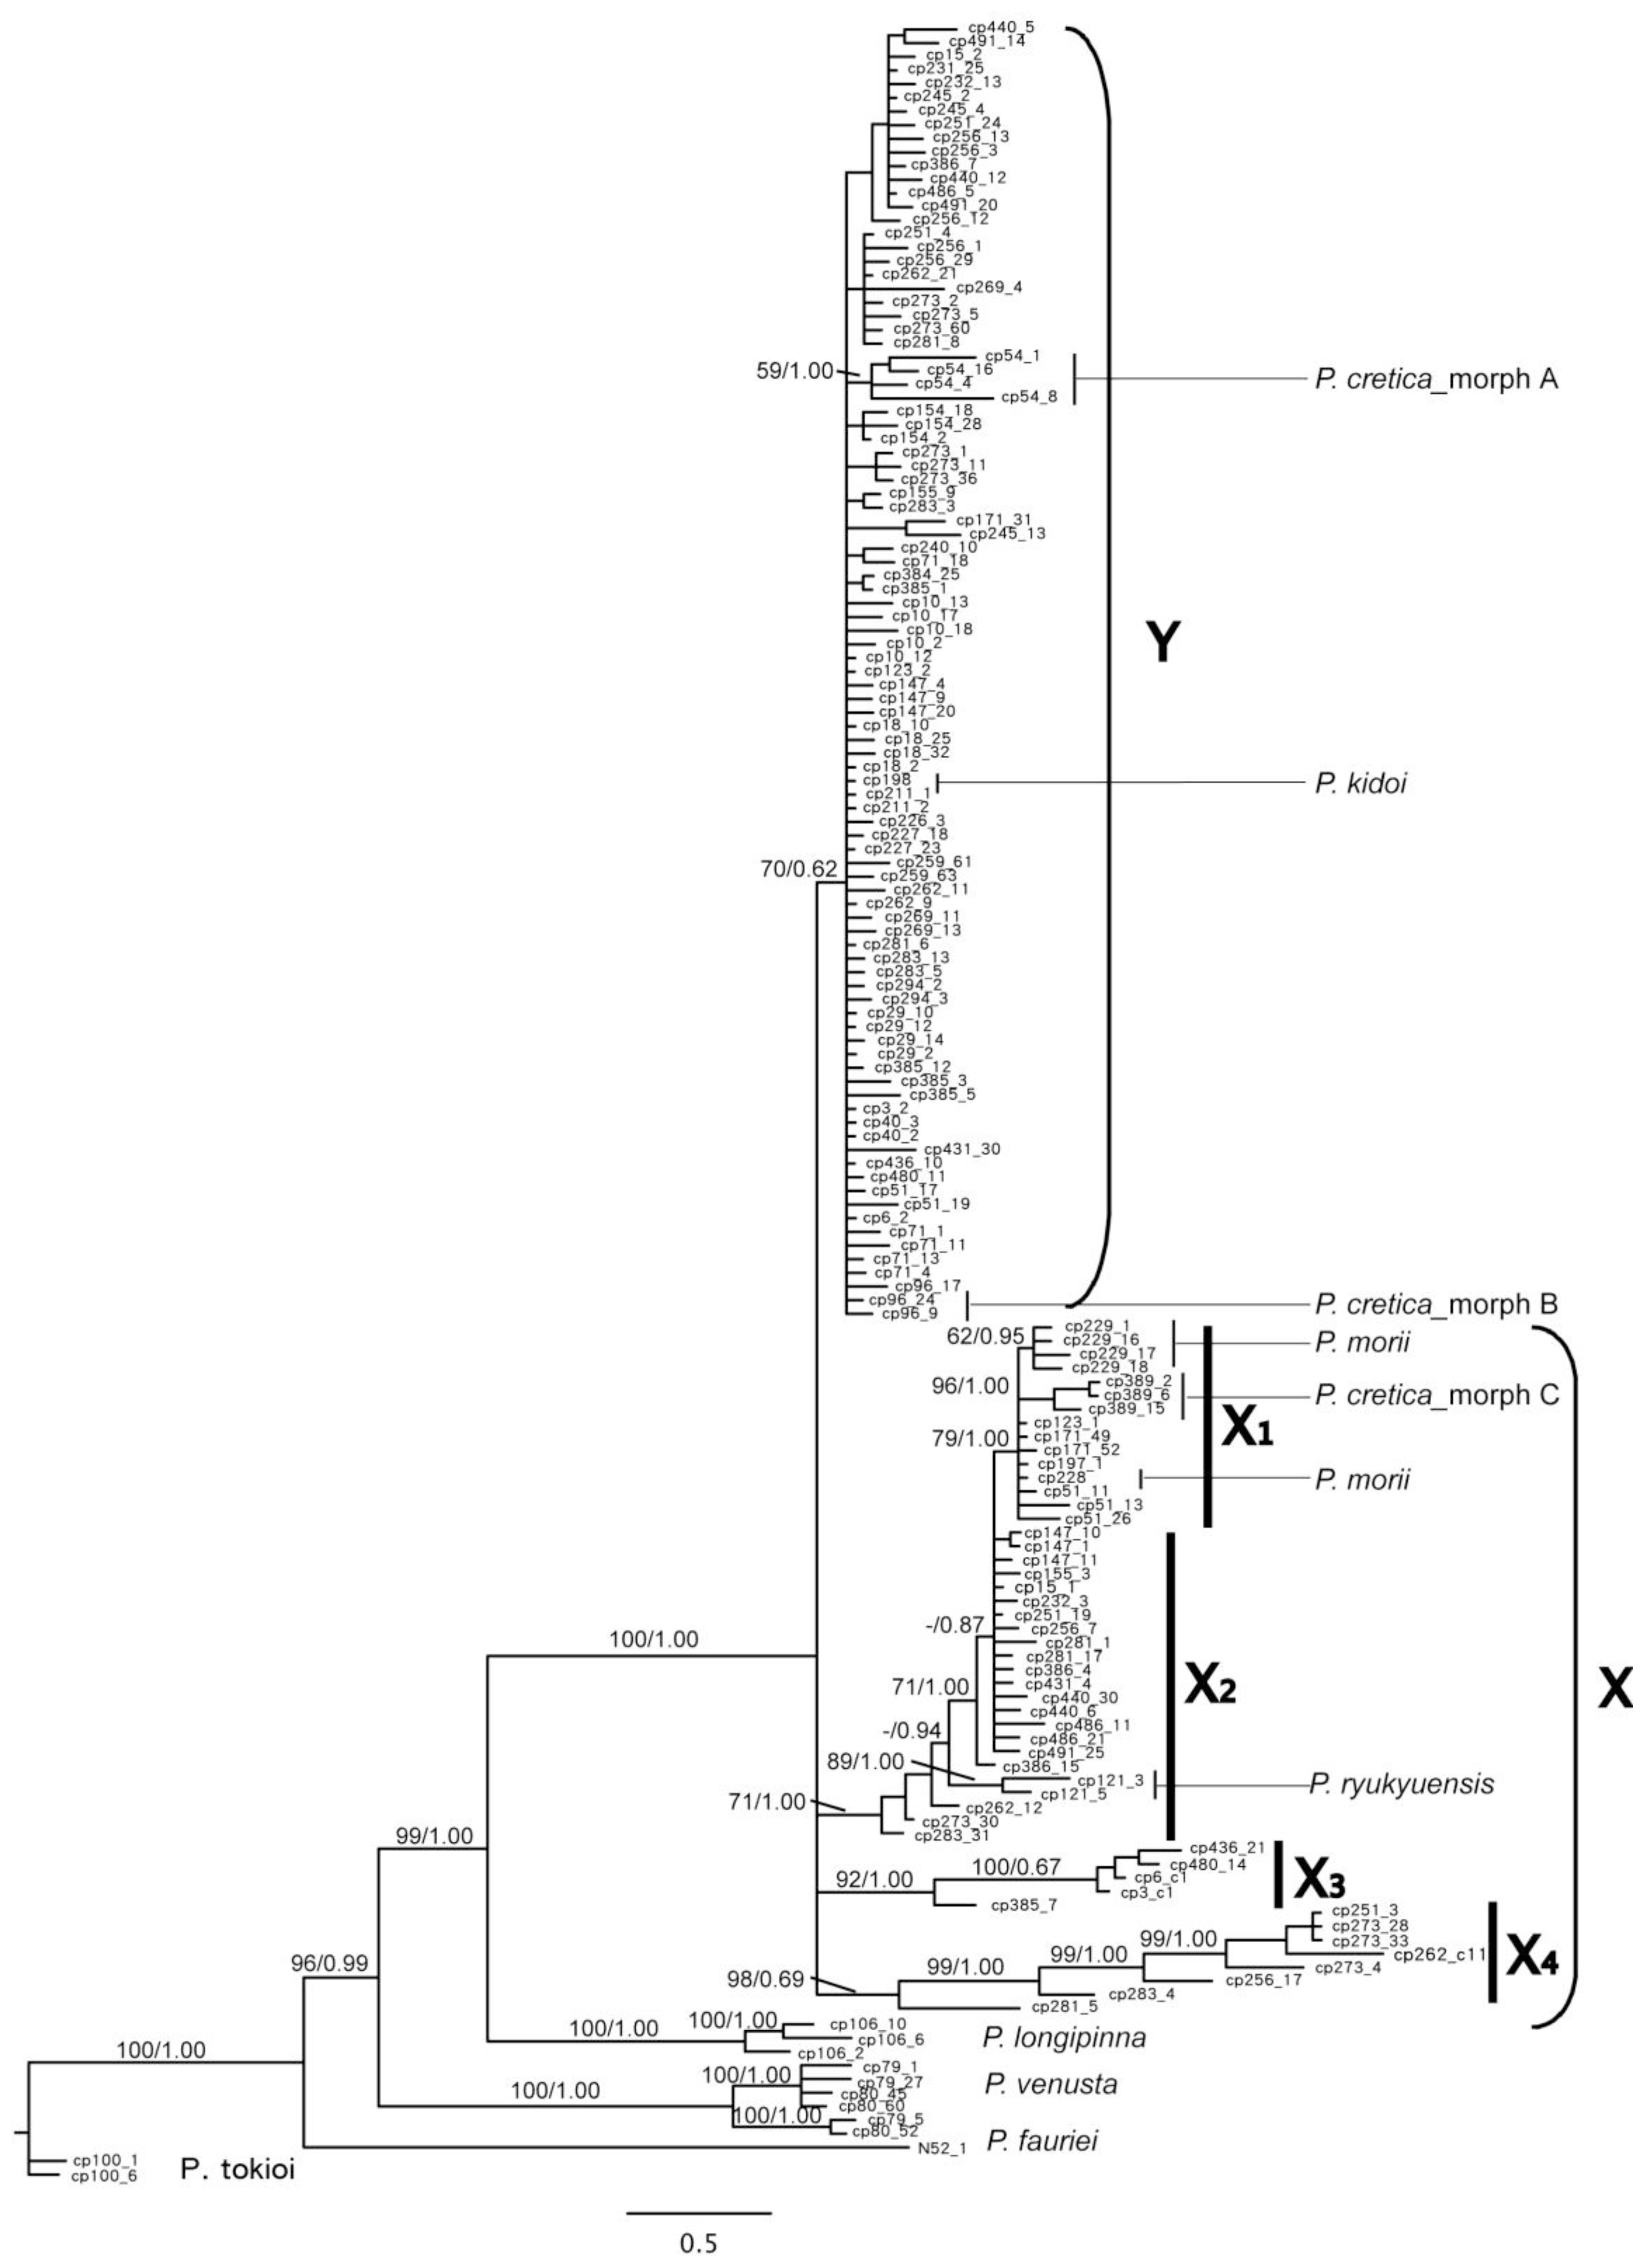
2.1.4. Phylogenetic Resolution of PgiC Gene Data

Existing primers for the PgiC gene in ferns do not work well in some taxa [10,11], therefore, we developed new primers for this nuclear marker in Pteris. Excluding the clones with repeated sequences, a total of 158 sequences of the PgiC gene were analyzed. After removing an ambiguously aligned region within intron 15, the unaligned length of long nuclear PgiC gene sequences, by means of primers 15PF and 17R, ranged from 1431 to 1705 bp. The aligned PgiC gene, 1744 bp, was analyzed directly using Bayesian inference. Bayesian tree and posterior probabilities are shown in Figure 4. Furthermore, for MP analysis, indels were coded and 50 binary characters produced to combine with the aligned PgiC gene. MP tree statistics are summarized in Table 3. Because the strict consensus tree from MP analysis (not shown) was similar to the inferred Bayesian tree, the corresponding bootstrap values were marked on the Bayesian tree (Figure 4).
Because of the distinctly morphological and phylogenetic difference, P. fauriei, P. longipinna, P. tokioi, and P. venusta, not involving in the P. cadieri complex, were used as outgroups, and their positions were consistent with the cpDNA tree. All clones of the P. cadieri complex were united in a well supported clade, including groups X and Y (Figure 4). Clones in group Y, defined as allele Y, were moderately supported and had a 15 bp synapomorphic deletion between exons 15 and 16 of PgiC compared to group X. Group X was comprised of subsclades X1, X2, X3, and X4, defined as alleles X1, X2, X3, and X4.
To avoid PCR bias [50], forward primers 15PFX or 15PFY, and reverse primer 17R, were used for additional sampling. These shorter sequences were combined with longer sequences from primers 15PF, and 17R and coded the indels (see section 3.4. Phylogenetic analysis). After removing clones with identical sequences, a total of 191 sequences of the PgiC gene were analyzed. The MP tree statistics are in Table 3. The results were used to determine the PgiC genotype of each plant (Supplementary S1 and Figure S2). The pattern of grouping was the same as the pattern from longer sequences (Figure 4). However, the topology had lower branch supporting values than in Figure 4. This is likely the result of having fewer parsimony informative characters.
Alleles of each individual in the P. cadieri complex fell into two or three clades of the PgiC gene tree: one clade was always allele Y and the others were alleles X1, X2, X3, or X4. Diploids had two alleles (e.g., morph 1 was X2 and Y), and triploids had two or three alleles (e.g., morph 5 was X3 and Y; morph 6 was X2, X3, and Y). The number of alleles was less than the ploidy level in some triploid and tetraploid plants. Based on sequences from a large number of clones, we inferred that this discrepancy could be caused by allele dosage; i.e., one of the alleles was present multiple times in a polyploid genome. Considering the position of alleles in the PgiC gene tree, cytotypes, and allele dosages, the genotypes of eight morphs were determined (Figure 1, Supplementary S1). Genotypes with an asterisk * indicate uncertain alleles [11]. For example, the genotype of morph 5, with the PgiC alleles X3 and Y, is shown as X3*Y because it could be X3X3Y or X3YY.
Although the PgiC genotype of each morph was determined, each genotype was not unique to a specific morph. For example, morphs 3, 4, and 7 had different morphologies but had the genotypes, X3Y.
Morphs with the same cpDNA haplotype group may have different PgiC genotypes, and vice versa. For example, morphs 1 and 8 share haplotype group α, but have PgiC genotypes X2Y and X1*Y respectively. In contrast, some morphs shared PgiC genotypes but had different cpDNA haplotypes. For example, both morphs 4 and 5 have PgiC X3 and Y alleles, but they have cpDNA haplotype groups γ and α, respectively. Such taxa have different maternal or paternal lineages.

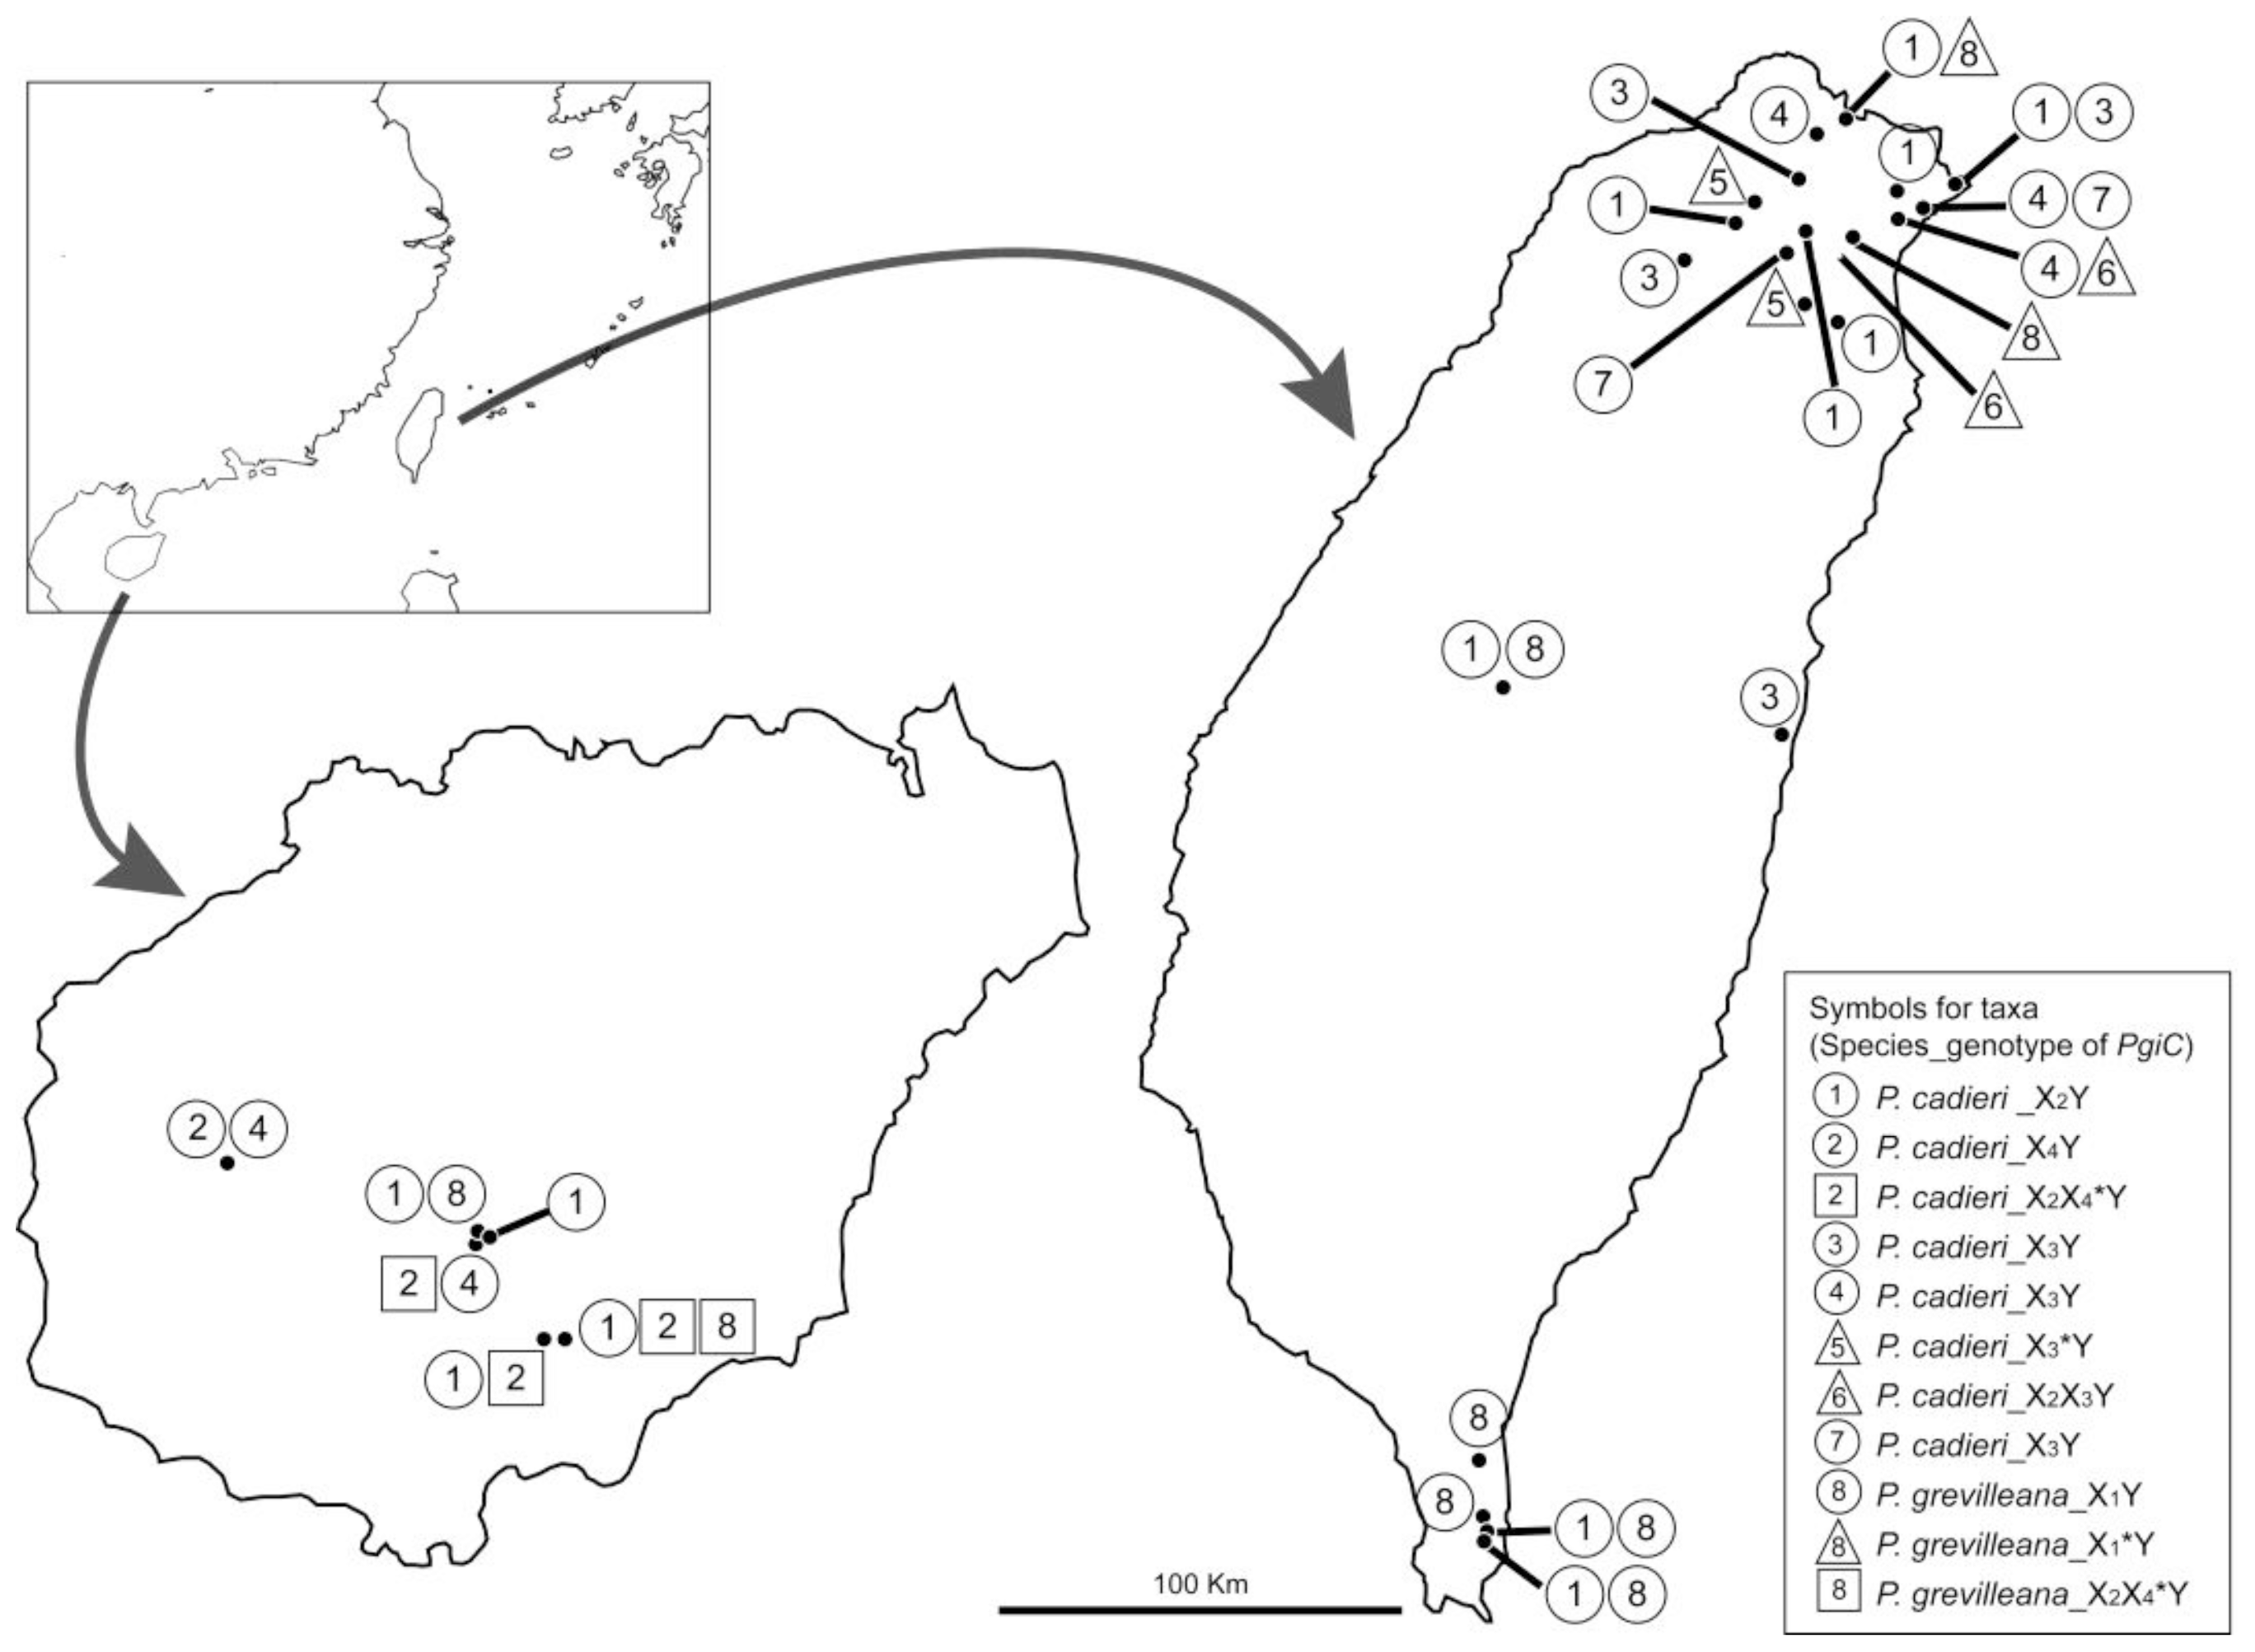
2.1.5. Divergence in Different Geographical Areas and Phenology

The geographic distribution of the eight morphs in the P. cadieri complex from Hainan and Taiwan are shown in Figure 5. A total of 27 populations, six in Hainan and 21 in Taiwan, were investigated. Morphs 1, 2, 4, and 8 occurred in Hainan, while morphs 1, 3, 4, 5, 6, 7, and 8 were found in Taiwan. Morphs 1 and 4, and the diploid form of morph 8 occurred in both Hainan and Taiwan. Morph 2 and the tetraploid form of morph 8 were restricted to Hainan, while morphs 3, 5, 6, 7, and the triploid form of morph 8 were found only in Taiwan. Genetic variation in P. cadieri complex cpDNA was greater in Hainan (α, β, and γ) than in Taiwan (α, γ). For the PgiC gene, the only difference between taxa in Hainan and Taiwan was that allele X4 was restricted to Hainan.
Tetraploids (in morphs 2 and 8) were found only in Hainan, and triploids (morphs 5, 6 and 8) occurred only in Taiwan. Because both morphs 2 and 8 occur only in Hainan, tetraploids may be associated with PgiC allele X4. In contrast, although the PgiC alleles X2, X3, and Y were found in Hainan and Taiwan, triploids (X3*Y, X2X3Y and X1*Y) were found only in Taiwan.

2.2. Discussion

2.2.1. Hybrid Origin

The Pteris cadieri complex is apogamous, which is usually thought to be with low genetic variation. However, it exhibits distinct morphological and phenological variation. Based on bi-parentally nuclear DNA and maternally inherited cpDNA [51], maternal and paternal lineages were inferred in this study. Our results suggest that the P. cadieri complex arose from multiple, recurrent hybridizations which may be responsible for the wide range of morphologies in this apogamous taxon. Furthermore, due to apogamy, the heterozygosity of PgiC gene in hybrids is preserved; each lineage is independent and free from confusion of recombination.
In the PgiC gene tree, P. longipinna, P. venusta, P. fauriei, and P. tokioi had its own independent clade. The other species, excluding the P. cadieri complex, belonged to a single clade, indicating that their genotypes are XX or YY (morphs A, B, and C of P. cretica L. were regarded as different taxa; Supplementary S1). This indicates that the genetic variation between the two clades is greater than intraspecific genetic diversity within each clade. Because the alleles of each taxon in the P. cadieri complex separated into two or three different clades, taxa in this complex were probably derived from several distinct species; that is, they originated through hybridization. In addition, apogamy is characteristic of species in the P. cadieri complex [25,52], a trait found in other ferns thought to have arisen through hybridization [13,14,5254].
Pteris grevilleana (morph 8 in this study) was proposed as a probable ancestor of P. cadieri [23]. However, evidence from the PgiC gene (Figure 4 and Figure S2) indicates that P. grevilleana was neither a maternal nor a paternal parent of other species in the P. cadieri complex. Because P. grevilleana, like other taxa in the P. cadieri complex, has two or more distinctly different alleles, it probably also arose through hybridization.

2.2.2. Parental Species?

Phylogenetic analyses of cpDNA revealed that the taxa in the P. cadieri complex (including P. grevilleana) were distinct from other Pteris species (Figure 3). Thus, species previously proposed as potential parents of Pteris species with linear pinnae, including P. cretica L., P. ensiformis Burm., P. kidoi Sa. Kurata, P. ryukyuensis Tagawa, P. morii Masam., and P. semipinnata L. [18,2224,55], could not be direct maternal parents of taxa in the P. cadieri complex. Moreover, the three haplotype groups of cpDNA phylogenetic tree indicate three absolutely different maternal elements. Without observing other Pteris species, the maternal elements of the P. cadieri complex probably came from the taxa in the complex itself or from extinct species.
Given that there are five PgiC alleles X1, X2, X3, X4, and Y, there could be five diploid ancestral taxa, with the genotypes X1X1, X2X2, X3X3, X4X4 and YY involved in the origin of the P. cadieri complex. Considering alleles X1 and X2, it is likely that P. cretica, P. kidoi, P. ryukyuensis, and P. morii represent the paternal progenitors or are closely allied to the paternal progenitors of the P. cadieri complex. Thus, allele X1 is the maternal element of diploid morph 8 and triploid morph 8, and allele X2 is the maternal element of morphs 1 and 6.
Alleles X3 and X4 appeared only in the P. cadieri complex and not in other Pteris species. Comparing the nuclear DNA and cpDNA trees, except for morphs 5 and 6, taxa with the alleles X3 or X4 correspond completely to groups γ or β, respectively. Although chloroplast and nuclear genomes evolve independently, this correspondence suggests that the maternal element of morphs 3, 4, and 7 is allele X3, and the maternal element of diploid morph 2, tetraploid morph 2, and tetraploid morph 8 is X4. Based on current data, it is difficult to further infer the paternal or maternal lineage of morph 5. Thus, some parent species of the P. cadieri complex still have not been identified. It is possible that the ancestral species are extinct or have yet to be discovered.

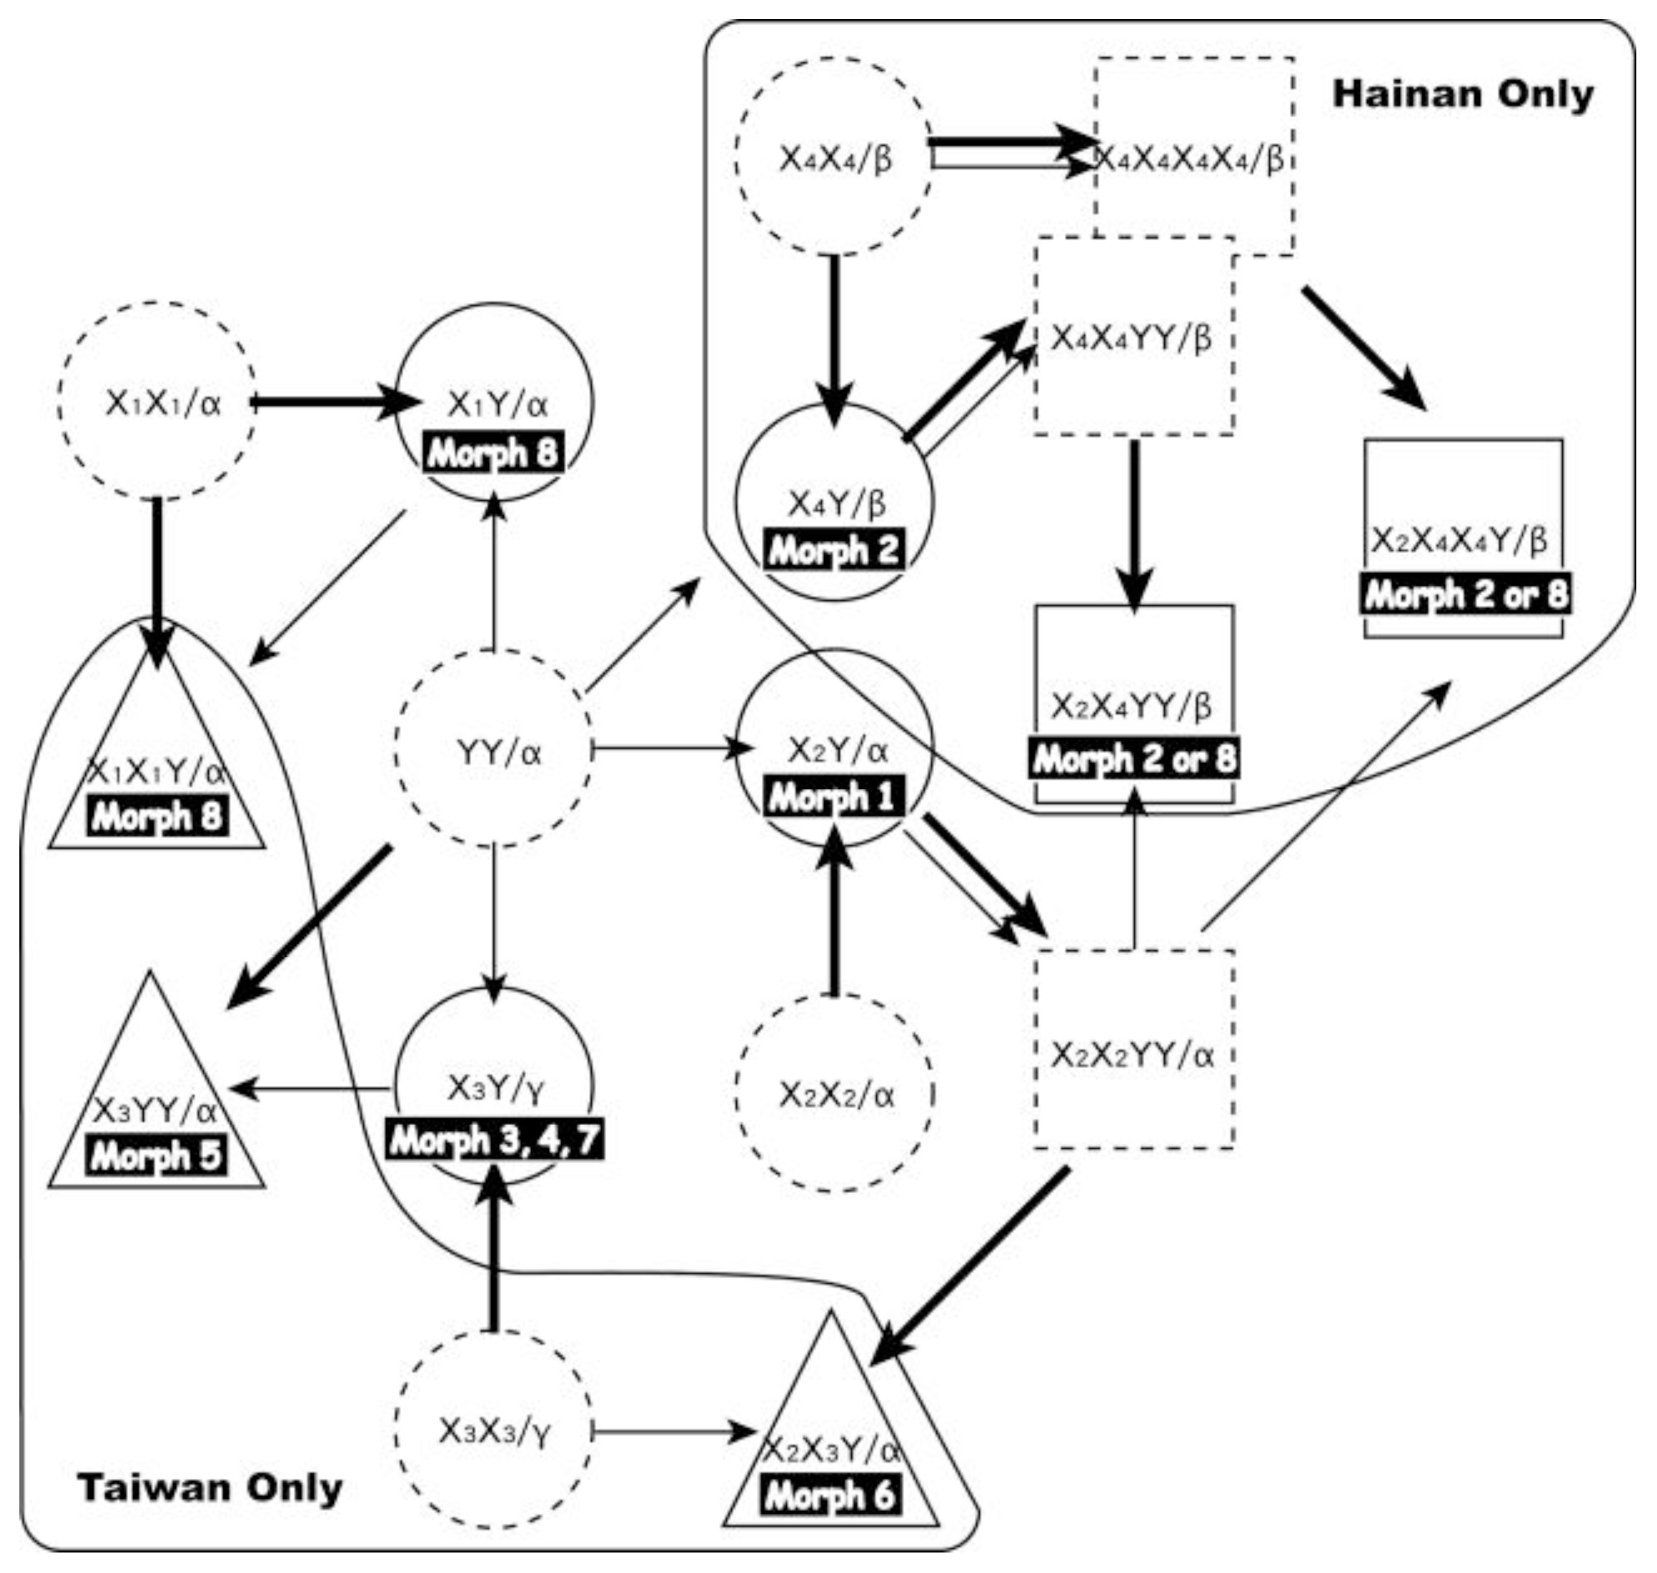
2.2.3. Reticulate Evolution of the Pteris cadieri Complex

Based on the cpDNA and nuclear DNA phylogenetic data, reticulate patterns of the Pteris cadieri complex were constructed, including the inferred paternal and maternal lineages (Figure 6). Using a “diploids-first” strategy [56], five diploid, sexual taxa, with the genotypes X1X1, X2X2, X3X3, X4X4 and YY of PgiC gene, are proposed as the progenitors of the P. cadieri complex. Furthermore, four sexual tetraploids were presumed, including X4X4X4X4, X2X2YY, and X4X4YY. They could arise from diploidy of X4X4, X2Y, and X4Y, respectively (Figure 6). Genotypes X2X2YY, and X4X4YY could also arise from genome addition as hybridization, such as X2X2 × YY, and X4X4 × YY, respectively (not shown).
It is then straightforward to infer the origin of the diploid apogamous taxa in the P. cadieri complex. For example, morph 1 could be derived from hybridization between the sexual parental taxa YY and X2X2. Apogamous triploids could arise from a cross between sexual diploid and sexual tetraploid species or between apogamous diploids (unreduced, diploid gametes, functionally male) and sexual diploids [53,54,57,58]. For example, morph 6 with the genotype X2X3Y, could arise via X2X2 × X3X3YY, X3X3 × X2X2YY, or X2X2 × X3Y, where a diploid taxon with X3Y is presumed to be apogamous and functionally male. Because allele dosages were not determined in this study, inferences about the origin of other triploid and tetraploid taxa are difficult to make. For example, the PgiC genotype of morph 5 is either X3X3Y or X3YY, and each genotype has a different evolutionary history. Inferring evolutionary histories becomes even more complicated in the tetraploid taxa. Tetraploid taxa of morphs 2 and 8 could have the genotypes X2X2X4Y, X2X4X4Y, or X2X4YY. In these cases, only genotype of X2X4X4Y, or X2X4YY and one probable evolutionary history of each genotype were illustrated to enhance the readability of Figure 6. It is also the most parsimonious scenario, having less presumed taxa. In this reticulate relationship (Figure 6), parts of the web are restricted to one geographic area, Hainan or Taiwan. This indicates that specific taxa were derived from specific progenitors (or alleles). For example, X4X4 occurs in Hainan and X3X3 in Taiwan.
The origin of apogamous diploids is an interesting example. Most apogamous diploids seem to come from hybrids between sexual diploid species and then acquired apogamy [53]. Given that apogamous diploids occurred earlier than apogamous polyploids, the apogamous diploids may be ancestors of the polyploids. However, “ploidy reduction” is an exception [59]. It was reported that the spores from one triploid Dryopteris pacifica (Nakai) Tagawa produced diploid and triploid gametophytes, and developed apogamous diploid and triploid sporophytes. The diploids and triploids in most taxa of the P. cadieri complex have different morphologies. Because no morphological differences were found in the offspring of the triploids in our cultures, “ploidy reduction” is unlikely to have been a factor in formation of the P. cadieri complex.

2.2.4. Multiple Origins Supported by Genotypic, Geographic, and Phenological Divergence

Diverse genetic traits and taxa strongly suggest that the P. cadieri complex originated from multiple evolutionary events. Moreover, because taxa in the P. cadieri complex are apogamous [25,52], plants that differ genetically should be derived from different evolutionary events. Multiple events also explain the existence of the subtle genetic variation found within the three main clades of the cpDNA tree and within the five main PgiC clades (Figures 3 and 4).
Multiple hybridizations led to the geographic and phenological divergence of the P. cadieri complex. The distribution of several taxa limited to Hainan or Taiwan is due to specific genetic characters in Hainan or Taiwan (such as PgiC X4 and X3). Phenological divergence corresponded to genetic divergence, and to geographic distribution. For example, taxa in Taiwan with PgiC allele X3 were evergreen and only distributed in northern Taiwan. These correlations indicate these morphs could have arisen independently in different geographic areas and niches.

3. Experimental Section

3.1. Sampling and Phenological Studies

Samples of the Pteris cadieri complex, including P. cadieri and P. grevilleana, and of each morphological variant, were collected from Taiwan and Hainan, under evergreen broad leaf forest below 1000 m altitude (Supplementary S1). Because morphological variation in the P. cadieri complex exists among populations, among individuals in a population, and among fronds of an individual, the morphology of each plant was examined carefully during field work. At least three individuals, including a representative of several morphological variants, were collected from each population. Samples were collected from six populations in Hainan and 21 populations in Taiwan. In addition, the parental candidates, also having similar morphologies with P. cadieri, P. cretica L. (including four individuals with distinct morphologies, morphs A, B, C, and D) (Supplementary S1), P. ensiformis Burm., P. kidoi Sa. Kurata, P. ryukyuensis Tagawa, P. morii Masam., and P. semipinnata L. [18,2224,55] were sampled. Pteris dimidiata Willd., P. fauriei Hieron., P. longipinna Hayata, P. tokioi Masam., P. venusta Kunze, and P. wallichiana J. Agardh were used as outgroups in phylogenetic analyses. Living plants were cultivated for one to five years in the greenhouse of the Taipei Botanical Garden for C-value measurements, phenological (evergreen or deciduous) studies, and morphological examinations. In the greenhouse, environmental effects on morphology were excluded. For phenological studies, the plants were determined to be either “evergreen” or “deciduous”. The “evergreen” plants produced new fronds all year, but “deciduous” plants lost all their fronds and did not produce new fronds from November to January. Voucher specimens were deposited at the herbarium (TAIF) of Taiwan Forestry Research Institute.
Type specimens of related taxa, including Pteris cadieri (in P), P. dimorpha (in K, MICH, and P), P. hainanensis (in IBSC and MICH), P. grevilleana (in B, E, and K), P. plumbea (in B, P, and TI), and P. sintenensis (in TI), were examined.

3.2. Ploidy Analysis and Reproductive Systems

Ploidy of each individual was determined by flow cytometry using fresh leaves from plants growing in the greenhouse. Nicotiana tabacum L. “Xanthi” (4X = 20.08 pg; [45]) was used as a calibration standard. Nuclei were extracted using CyStain PI absolute P kit (Partec, Münster, Germany). About 100 mm2 of fresh leaf tissue was chopped with a razor blade in 0.5 mL extraction buffer for 30–60 s, incubated for 10–15 min, filtered through a 50 mm nylon mesh (Partec, Münster, Germany), and processed in staining solution, containing RNase and propidium iodide (PI). Preparations were kept in the dark for 30 min. Ploidy was determined by FACScan (BD Technologies, Franklin Lakes, NJ, USA), using plants of known chromosome number as the control [25].
In most ferns, including the genus Pteris, sexual plants produce 64 spores per sporangium; apogamous plants produce 32 or fewer spores per sporangium [53,56,60,61]. Although it is known that P. cadieri and P. grevilleana are apogamous [25,52], to confirm the nature of the reproductive systems of plants in this study, the number of spores per sporangium was counted for each plant. Five mature sporangia were picked randomly from each plant. Spores, including shrunken ones, were counted, but debris was excluded.

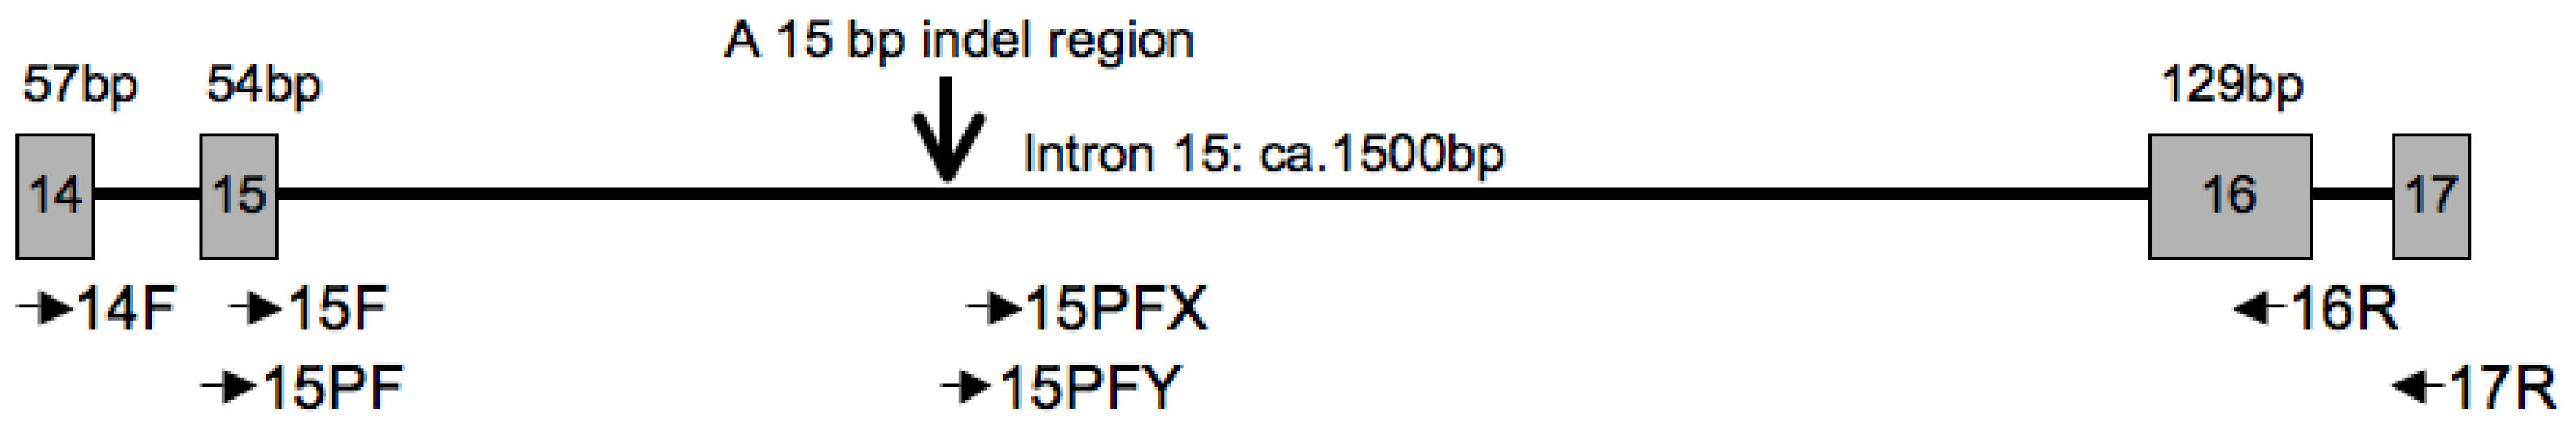
3.3. Molecular Methods

Total genomic DNA was extracted from silica gel-dried leaves, following a modified CTAB method [62] or Plant Genomic DNA Mini Kit (Geneaid Biotech Ltd., Taipei, Taiwan).
Two chloroplast regions, the rbcL gene and atpB-rbcL spacer, and one nuclear region, the cytosolic phosphoglucose isomerase (PgiC) gene, were amplified and sequenced. Polymerase chain reaction amplification of the rbcL gene was performed with primers designed for this study (primer rbcL_PF; Table 2) and previous studies (primers rbcL F1F [48], rbcL F1379R [49], Table 2). The atpB-rbcL spacer was amplified by either of two pairs of primers (primers atpB_672 and rbcL_r49R [46], primers atpB 493F and rbcL r158R [47], Table 2). Polymerase chain reactions (PCR) were performed in a total volume of 25 μL containing 1× Ex buffer, 0.2 mM dNTPs, 0.06 μM of each primer, one unit of Taq polymerase (Genet Bio, Chungnam, Korea), and approximately 10 ng of template DNA. PCR amplifications were made using a T3 Thermocycler (Biometra, Göttingen) under the following conditions: denaturation for 5 min at 95 °C, 35 cycles of 45 s at 94 °C, annealing for 45 s at 54 °C (primers for rbcL gene) or 30 s at 57 °C (primers for atpB-rbcL spacer), and extension at 72 °C for 75 s (primers for rbcL gene) or 60 s (primers for atpB-rbcL spacer), with a final extension time of 8 min at 72 °C.
For PgiC, the 14F and 16R primers [41] were initially used to amplify approximately 1.8 kb within exons 14, 15, and 16 in Pteris. Subsequently, a pair of new amplification primers, 15PF and 17R, were constructed for this study. Primer 15PF was located in intron 14 and exon 15, and primer 17R, designed from the cDNA of Dryopteris and Arabidopsis (NCBI), was located in exon 17. The amplified fragment includes 22 bp at the 3′ end of exon 15, two complete exons, two complete introns, and 35 bp from the 5′ end of exon 17 (Figure 7, Table 2). To avoid PCR bias (described below), two more forward primers, 15PFX and 15PFY, were designed. Amplifications were prepared in 25 μL reactions using 1× Ex buffer, 0.2 mM dNTPs, 0.08 μM of each primer, 0.6 units of Ex Taq polymerase (Genet Bio, Chungnam, Korea), 2% dimethylsulfoxide (DMSO), and approximately 20 ng of template DNA. PCR thermo cycling conditions were as follows: initial denaturation step of 95 °C for 5 min, followed by 35 cycles of denaturation at 94 °C for 45 s, annealing at 57 °C (primers 15PF and 17R), 54 °C (primers 15PFX and 17R) or 55 °C (primers 15PFY and 17R) for 45 s, and extension at 72 °C for 90 s, with a final extension at 72 °C for 8 min.
PCR products were purified using a Gel/PCR DNA Fragment Extraction Kit (Geneaid Biotech Ltd., Taipei, Taiwan). Some products were sequenced directly, while others were cloned into pGEM-T Easy vectors (Promega, Madison, WI, USA). Ligation, transformation, plating and selection of clones followed the instructions included with the kit. Plasmid DNA was purified using the High-Speed Plasmid Mini Kit (Geneaid Biotech Ltd., Taipei, Taiwan). Sequences were determined with an ABI 377 (Applied Biosystems Inc., Foster City, CA, USA) automated sequencer following the manufacturers protocols. A BLASTn search was conducted in GenBank to exclude contaminants. Previous studies indicated that there is a single copy of the PgiC gene [41], but it was not known whether this is true in Pteris. For an initial sampling of the PgiC gene from Pteris species, the PCR products were sequenced directly, and those that showed multiplicity or lacked clear base readings were cloned. In the P. cadieri complex, four to eight clones were sequenced from plants of different ploidy levels. We found that the number of PgiC gene alleles in each individual corresponded to that individual’s ploidy level. For example, a diploid plant had two alleles. On the other hand, some Pteris species had a single sequence and were presumed to be homozygous. Therefore, in Pteris, PgiC does appear to be a single-copy gene.
After initial cloning to design primers and develop PCR protocols for sequencing low-copy nuclear genes, initial analyses suggested the PgiC genes were effectively single-copy in diploids and that sequences in different individuals could be treated as ortholog.
We found marked PCR bias [50], in the PCR products from primers 15PF and 17R. In some samples, certain PgiC alleles were more difficult to isolate than other alleles. In order to gain all alleles in an individual, the largest indel region (15 bp) between exon 15 and 16 was used to design two, alternative forward primers, 15PFX and 15PFY, to primer 15PF (Figure 7, Table 2). Primer 15PFX was located in the insertion and primer 15PFY was located on both sides of the deletion. The PCR products were shorter than fragments amplified from the original primers, 14F and 16R, and most of them could be sequenced directly. If multiple PgiC sequences were amplified, cloning was used to isolate each allele. Clones were sequenced until two different types of alleles were captured more than once.

3.4. Phylogenetic Analysis

All DNA sequences were aligned using CLUSTAL X ver. 1.83 [63]. Subsequent manual corrections were carried out with BioEdit ver. 5.0.9. Maximum Parsimony analyses were performed with PAUP* ver. 4.0b10 [64] using a heuristic search algorithm, 100 random addition replicates, MULTREES option, no Steepest Descent, and tree-bisection reconnection (TBR) branch swapping. All characters were weighted equally and were unordered. In cpDNA sequences, indels were scored as missing data. We conducted an incongruence length difference test (ILD; [65]) to evaluate congruence between the atpB-rbcL spacer and the rbcL gene. The test was implemented in PAUP* with 1000 replicates of heuristic searches using parsimony informative characters. In PgiC data, ambiguously aligned regions were excluded and indels were scored as binary characters in phylogenetic analyses according to the method of “simple indel coding” [66] as implemented in the program GapCoder [67]. Branch support was evaluated by bootstrap analysis [68] with 1000 rounds of replication.
Maximum likelihood analyses were performed for cpDNA data using the program GARLI ver. 0.96 (Genetic Algorithm for Rapid Likelihood Inference, [69]). To ensure convergence to a similar topology and likelihood score, 10 independent runs were conducted using the automated stopping criterion or for up to 20,000 consecutive generations. To estimate the support for each node, 1000 bootstrap replicates were performed with the automated stopping criterion set at 10,000 generations. A 50% majority rule consensus tree of the 1000 bootstrap replicates from GARLI was then created using PAUP*.
Nuclear sequences, excluding indels, were analyzed, using a Bayesian inference with MrBayes ver. 3.1 [70]. The Tamura-Nei (TrN, [71] model of sequence evolution was chosen, based on results of the Akaike Information Criterion (AIC) as implemented in Modeltest ver. 3.7 [72]. The Akaike Information Criterion (AIC) was used to select the nucleotide substitution model. Among-site rate variation was allowed to follow a gamma distribution. Two runs with four chains each were run simultaneously for 106 generations each run, with the temperature of the heated chains set to 0.2. The program Tracer ver.1.5 [73] was used to confirm that the parameters had converged. The initial 20% was discarded as burn-in. Chains were sampled every 100 generations and the respective trees written to a tree file. Convergence of the chains was assessed by stationary distribution of the likelihood value. After discarding burn-in samples, the remaining trees were loaded into PAUP* [64] to construct a majority rule consensus tree. Frequency values of the trees serve as estimates of the posterior probability of nodes.

4. Conclusions

This study identifies the maternal and paternal lineages of the P. cadieri complex. Morphological diversity of apogamous ferns is most likely due to multiple hybrid origins. Our understanding of the evolutionary history of the P. cadieri complex is crucial to further taxonomic and systematic studies. Scientific names could not be assigned to all eight morphs. Moreover, taxonomic treatment of morphologically similar but genetically distinct taxa presents an interesting challenge [74]. For morph 8, the molecular data indicate that tetraploids are genetically distinct from diploids and triploids, and tetraploids occur only on Hainan. However, they are difficult to distinguish morphologically. In contrast, plants with the same genetic character exhibiting distinct morphologies also result in taxonomic problem. For example, morphs 3, 4, and 7 shared the same PgiC genotypes, but exhibited distinctly different frond morphologies. Similarly, this kind of epiallelic variation has also been found in other plant species [7577]. In addition, the DNA marker, the PgiC gene, could have limitations and might not differ in these morphs.
In a species complex with a complicated evolutionary history, no single method can be used to delimit a taxon. This study provides an example of the importance of reticulate evolution in fern speciation. The ancestral taxa of the P. cadieri complex apparently repeatedly and reciprocally crossed with one another. Following each hybridization event, apogamy shut down gene flow, genetically isolating each new taxon. Recurrent hybridization led to complex variation in the morphology and ploidy of taxa in the P. cadieri complex. It is likely that many hybrid taxa became extinct, while others persist to the present day and now comprise the P. cadieri species complex as we know it. Lost lineages make it difficult to reconstruct the complete evolutionary history of the P. cadieri complex. Because the P. cadieri complex is widely distributed in eastern and southern Asia, hybridization could have occurred extensively and independently in populations in other regions.

Supplementary Information

ijms-13-04523-s001.pdf

Acknowledgments

The authors thank Pi-Fong Lu, Chun-Ming Chen, Cheng-Wei Chen, Li-Yaung Kuo, Yao-Moan Huang, and Yi-Han Chang, for their assistance in collecting plant samples, and Alan Warneke for English editorial assistance. The directors and curators of herbaria B, E, HUH, IBSC, K, KYO, MICH, PC, TI, TAI, TAIF, UC, and US are gratefully acknowledged for loan of specimens. This research is supported by Taiwan Forestry Research Institute (96AS-11.1.2-FI-G1, 97AS-11.2.2-EI-W4, and 98AS-8.2.1-F1-G1).

References

  1. Hewitt, G.M. Hybrid zones—Natural laboratories for evolutionary studies. Trends Ecol. Evol 1988, 3, 158–167. [Google Scholar]
  2. Harrison, R.G. Hybrid Zones and the Evolutionary Process; Oxford University Press: New York NY, USA, 1993; p. 364. [Google Scholar]
  3. Van Droogenbroeck, B.; Kyndt, T.; Romeijn-Peeters, E.; van Thuyne, W.; Goetghebeur, P.; Romero-Motochi, J.P.; Gheysen, G. Evidence of natural hybridization and introgression between Vasconcellea species (Caricaceae) from southern Ecuador revealed by chloroplast, mitochondrial and nuclear DNA markers. Ann. Bot 2006, 97, 793–805. [Google Scholar]
  4. Kelly, L.J.; Leitch, A.R.; Clarkson, J.J.; Hunter, R.B.; Knapp, S.; Chase, M.W. Intragenic recombination events and evidence for hybrid speciation in Nicotiana (Solanaceae). Mol. Biol. Evol 2010, 27, 781–799. [Google Scholar]
  5. Lihová, J.; Kučera, J.; Perný, M.; Marhold, K. Hybridization between two polyploid Cardamine (Brassicaceae) species in north-western Spain: Discordance between morphological and genetic variation patterns. Ann. Bot 2007, 99, 1083–1096. [Google Scholar]
  6. Shepherd, L.D.; Perrie, L.R.; Brownsey, P.J. Low-copy nuclear DNA sequences reveal a predominance of allopolyploids in a New Zealand Asplenium fern complex. Mol. Biol. Evol 2008, 49, 240–248. [Google Scholar]
  7. Sciarretta, K.L.; Arbuckle, E.P.; Haufler, C.H.; Werth, C.R. Patterns of genetic variation in southern Appalachian populations of Athyrium filix-femina var. asplenioides (Dryopteridaceae). Int. J. Plant Sci 2005, 166, 761–780. [Google Scholar]
  8. Kentner, E.K.; Mesler, M.R. Evidence for natural selection in a fern hybrid zone. Am. J. Bot 2000, 87, 1168–1174. [Google Scholar]
  9. Grusz, A.L.; Windham, M.D.; Pryer, K.M. Deciphering the origins of apomictic polyploids in the Cheilanthes yavapensis complex (Pteridaceae). Am. J. Bot 2009, 96, 1636–1645. [Google Scholar]
  10. Schuettpelz, E.; Grusz, A.L.; Windham, M.D.; Pryer, K.M. The utility of nuclear gapCp in resolving polyploid fern origins. Syst. Bot 2008, 33, 621–629. [Google Scholar]
  11. Ebihara, A.; Ishikawa, H.; Matsumoto, S.; Lin, S.J.; Iwatsuki, K.; Takamiya, M.; Watano, Y.; Ito, M. Nuclear DNA, chloroplast DNA, and ploidy analysis clarified biological complexity of the Vandenboschia radicans complex (Hymenophyllaceae) in Japan and adjacent areas. Am. J. Bot 2005, 92, 1535–1547. [Google Scholar]
  12. Ootsuki, R.; Sato, H.; Nakato, N.; Murakami, N. Evidence of genetic segregation in the apogamous fern species Cyrtomium fortunei (Dryopteridaceae). J. Plant Res 2012. [Google Scholar] [CrossRef]
  13. Lovis, J.D. Evolutionary patterns and processes in ferns. Adv. Bot. Res 1977, 4, 229–414. [Google Scholar]
  14. Walker, T.G. The Cytogenetics of Ferns. In The Experimental Biology of Ferns; Dyer, A.F., Ed.; Academic Press: London, UK, 1979; pp. 87–132. [Google Scholar]
  15. Kato, M.; Nakato, N.; Cheng, X.; Iwatsuki, K. Cytotaxonomic study of ferns of Yunnan, southwestern China. Bot. Mag. Tokyo 1992, 105, 105–124. [Google Scholar]
  16. Simizu, H. Notes on the noteworthy ferns from Taiwan. Trans. Nat. Hist. Soc. Taiwan 1938, 28, 238–246. [Google Scholar]
  17. Shieh, W.C. Pteridaceae. In Flora of Taiwan, 1st ed; Li, H.-L., Liu, T.-C., Koyama, T., DeVol, C.E., Eds.; Epoch Publishing: Taipei, Taiwan, 1975; Volume 1, pp. 281–301. [Google Scholar]
  18. Ching, R.-C.; Wang, C.H. Materials for the pteridophytic flora of Hainan. Acta Phytotax. Sin 1959, 8, 125–171. [Google Scholar]
  19. Wu, S.-W. Pteridaceae. In Flor. Reipubl. Pop. Sinicae; Ching, R.-C., Shing, K.-H., Eds.; Science Press: Beijing, China, 1990; Volume 3, pp. 15–91. [Google Scholar]
  20. Walker, E.H. Pteridaceae. In Flora of Okinawa and the southern Ryukyu Islands; Smithsonian Institution Press: Washington, DC, USA, 1976. [Google Scholar]
  21. Christ, M.H. Flilices cadierianae. J. Bot. (Morot) 1905, 19, 58–79. [Google Scholar]
  22. Kuo, C.-M.; Yu, H.-T. Investigation on the Pteridophyta of Kenting National Park; Kenting National Park Administration Office: Hengchun Township, Taiwan, 1986; p. 114. [Google Scholar]
  23. Wagner, W.H.J. Venuloid idioblasts in Pteris and their systematic implication. Acta Phytotax. Geobot 1978, 29, 33–40. [Google Scholar]
  24. Nakaike, T. New Flora of Japan: Pteridophyta. Revised & Enlarged; Shibundo Company: Tokyo, Japan, 1992. [Google Scholar]
  25. Chao, Y.S.; Liu, H.Y.; Huang, Y.M.; Chiou, W.L. Reproductive traits of Pteris cadieri and P. grevilleana in Taiwan: Implications for their hybrid origins. Bot. Stud 2010, 51, 209–216. [Google Scholar]
  26. Levin, D.A. The Origin, Expansion, and Demise of Plant Species; Oxford University Press: New York, NY, USA, 2000. [Google Scholar]
  27. Soltis, D.E.; Soltis, P.S. Molecular data and the dynamic nature of polyploidy. Crit. Rev. Plant Sci 1993, 12, 243–273. [Google Scholar]
  28. Schwarzbach, A.E.; Rieseberg, L.H. Likely multiple origins of a diploid hybrid sunflower species. Mol. Ecol 2002, 11, 1703–1715. [Google Scholar]
  29. Soltis, D.E.; Soltis, P.S.; Bennett, M.D.; Leitch, I.J. Evolution of genome size in the angiosperms. Am. J. Bot 2003, 90, 1596–1603. [Google Scholar]
  30. Chat, J.; Jauregui, B.; Petit, R.J.; Nadot, S. Reticulate evolution in kiwifruit (Actinidia, actinidiaceae) identified by comparing their maternal and paternal phylogenies. Am. J. Bot 2004, 91, 736–747. [Google Scholar]
  31. Yang, W.; Glover, B.J.; Rao, G.-Y.; Yang, J. Molecular evidence for multiple polyploidization and lineage recombination in the Chrysanthemum indicum polyploid complex (Asteraceae). New Phytol 2006, 171, 875–886. [Google Scholar]
  32. Guggisberg, A.; Bretagnolle, F.; Mansion, G. Allopolyploid origin of the mediterranean endemic, Centaurium bianoris (Gentianaceae), inferred by molecular markers. Syst. Bot 2009, 31, 368–379. [Google Scholar]
  33. Nelson, A.D.; Elisens, W.J. Polyploid evolution and biogeography in Chelone (Scrophulariaceae): Morphological and isozyme evidence. Am. J. Bot 1999, 86, 1487–1501. [Google Scholar]
  34. Noyes, R.D. Intraspecific nuclear ribosomal DNA divergence and reticulation in sexual diploid Erigeron strigosus (Asteraceae). Am. J. Bot 2006, 93, 470–479. [Google Scholar]
  35. Watanabe, K.; Ohi-Toma, T.; Murata, J. Multiple hybridization in the Aristolochia kaempferi group (Aristolochiaceae): Evidence from reproductive isolation and molecular phylogeny. Am. J. Bot 2008, 95, 885–896. [Google Scholar]
  36. Baldwin, B.G.; Sanderson, M.J.; Porter, J.M.; Wojciechowski, M.F.; Campbell, C.S.; Donoghue, M.J. The ITS region of nuclear ribosomal DNA: A valuable source of evidence on angiosperm phylogeny. Ann. Mo. Bot. Gard 1995, 82, 247–277. [Google Scholar]
  37. Álvarez, I.; Wendel, J.F. Ribosomal its sequences and plant phylogenetic inference. Mol. Phylogenet. Evol 2003, 29, 417–434. [Google Scholar]
  38. Friar, E.A.; Prince, L.M.; Cruse-Sanders, J.M.; McGlaughlin, M.E.; Butterworth, C.A.; Baldwin, B.G. Hybrid origin and genomic mosaicism of Dubautia scabra (Hawaiian silversword alliance; Asteraceae, Madiinae). Syst. Bot 2008, 33, 589–597. [Google Scholar]
  39. Hoot, S.B.; Taylor, W.C. The utility of nuclear ITS, a leafy homolog intron, and chloroplast atpB-rbcL spacer region data in phylogenetic analyses and species delimitation in Isoëtes. Am. Fern J 2001, 91, 166–177. [Google Scholar]
  40. Adjie, B.; Masuyama, S.; Ishikawa, H.; Watano, Y. Independent origins of tetraploid cryptic species in the fern Ceratopteris thalictroides. J. Plant Res 2007, 120, 129–138. [Google Scholar]
  41. Ishikawa, H.; Watano, Y.; Kano, K.; Ito, M.; Kurit, S. Development of primer sets for PCR amplification of the PgiC gene in ferns. J. Plant Res 2002, 115, 65–70. [Google Scholar]
  42. Chang, H.-M.; Chiou, W.-L.; Wang, J.-C. Molecular evidence for genetic heterogeneity and the hybrid origin of Acrorumohra subreflexipinna from Taiwan. Am. Fern J 2009, 99, 61–77. [Google Scholar]
  43. Dong, S.Y.; Chen, Z.C.; Zhang, X.C. A survey of the pteridophytes of Hainan Island, China. Living For 2003, 6, 36–37. [Google Scholar]
  44. Dong, S.Y.; Chen, Z.C.; Zhang, X.C. Additions to the pteridophyte flora of Hainan Island. Bull. Bot. Res 2004, 24, 45–48. [Google Scholar]
  45. Johnston, J.S.; Bennett, M.D.; Rayburn, A.L.; Galbraith, D.W.; Price, H.J. Reference standards for determination of DNA content of plant nuclei. Am. J. Bot 1999, 86, 609–613. [Google Scholar]
  46. Wolf, P.G. Evaluation of atpB nucleotide sequences for phylogenetic studies of ferns and other pteridophytes. Am. J. Bot 1997, 84, 1429–1440. [Google Scholar]
  47. Pryer, K.M.; Schuettpelz, E.; Wolf, P.G.; Schneider, H.; Smith, A.R.; Cranfill, R. Phylogeny and evolution of ferns (monilophytes) with a focus on the early leptosporangiate divergences. Am. J. Bot 2004, 91, 1582–1598. [Google Scholar]
  48. Wolf, P.G.; Soltis, P.S.; Soltis, D.E. Phylogenetic relationships of dennstaedtioid ferns: Evidence from rbcL sequences. Mol. Phylogenet. Evol 1994, 3, 383–392. [Google Scholar]
  49. Pryer, K.M.; Smith, A.R.; Hunt, J.S.; Dubuisson, J.-Y. RbcL data reveal two monophyletic groups of filmy ferns (Filicopsida: Hymenophyllaceae). Am. J. Bot 2001, 88, 1118–1130. [Google Scholar]
  50. Wagner, A.; Blackstone, N.; Cartwright, P.; Dick, M.; Misof, B.; Snow, P.; Wagner, G.P.; Bartels, J.; Murtha, M.; Pendleton, J. Surveys of gene families using polymerase chain reaction: PCR selection and PCR drift. Syst. Biol 1994, 43, 250–261. [Google Scholar]
  51. Harris, J.L.; Ingram, R. Chloroplast DNA and biosystematics: The effects of intraspecific diversity and plasmid transmission. Taxon 1991, 40, 393–421. [Google Scholar]
  52. Walker, T.G. Cytology and evolution in the fern genus Pteris l. Evolution 1962, 16, 17–43. [Google Scholar]
  53. Manton, I. Problems of Cytology and Evolution in the Pteridophyta; Cambridge University Press: New York, NY, USA, 1950; p. 316. [Google Scholar]
  54. Suzuki, T.; Iwatsuki, K. Genetic variation in apogamous fern Pteris cretica l. In Japan. Heredity 1990, 65, 221–227. [Google Scholar]
  55. Nakaike, T. Index of Hybrid Ferns in Japan; University of Tokyo: Tokyo, Japan, 1970. [Google Scholar]
  56. Beck, J.B.; Windham, M.D.; Yatskievych, G.; Pryer, K.M. A diploids-first approach to species delimitation and interpreting polyploid evolution in the fern genus Astrolepis (Pteridaceae). Syst. Bot 2010, 35, 223–234. [Google Scholar]
  57. Haufler, C.H.; Windham, M.D.; Britton, D.M.; Robinson, S.J. Triploidy and its evolutionary significance in Cystopteris protrusa. Can. J. Bot 1985, 63, 1855–1863. [Google Scholar]
  58. Lin, S.-J.; Kato, M.; Iwatsuki, K. Electrophoretic variation of apogamous Dryopteris varia group (Drypteridaceae). J. Plant Res 1995, 108, 451–456. [Google Scholar]
  59. Lin, S.-J.; Kato, M.; Iwatsuki, K. Diploid and triploid offspring of triploid agamosporous fern Dryopteris pacifica. Bot. Mag. Tokyo 1992, 105, 443–452. [Google Scholar]
  60. Huang, Y.-M.; Chou, H.-M.; Wang, J.-C.; Chiou, W.-L. The distribution and habitats of the Pteris fauriei complex. Taiwania 2007, 52, 49–58. [Google Scholar]
  61. Hickok, L.G.; Klekowski, E.J., Jr. Inchoate speciation in Ceratopteris: An analysis of the synthesized hybrid C. richardii × C. pteridoides. Evolution 1974, 28, 439–446. [Google Scholar]
  62. Doyle, J.J.; Doyle, J.L. A rapid DNA isolation procedure for small quantities of fresh leaf tissue. Phytochem. Bull 1987, 19, 11–15. [Google Scholar]
  63. Thompson, J.D.; Gibson, T.J.; Plewniak, F.; Jeanmougin, F.; Higgins, D.G. The ClustalX windows interface: Flexible strategies for multiple sequence alignment aided by quality analysis tools. Nucleic Acids Res 1997, 24, 4876–4882. [Google Scholar]
  64. Swofford, D.L. Paup*: Phylogenetic Analysis Using Parsimony (*and Other Methods), version 4; Sinauer: Sunderland, MA, USA, 2002. [Google Scholar]
  65. Farris, J.S.; Kallersjo, M.; Kluge, A.G.; Bult, C. Testing significance of incongruence. Cladistics 1995, 10, 315–320. [Google Scholar]
  66. Simmons, M.P.; Ochoterena, H. Gaps as characters in sequence-based phylogenetic analyses. Syst. Biol 2000, 49, 369–381. [Google Scholar]
  67. Young, N.D.; Healy, J. Gapcoder automates the use of indel characters in phylogenetic analysis. BMC Bioinforma 2003, 4, 1–6. [Google Scholar]
  68. Felsenstein, J. Confidence limits on phylogenies: An approach using the bootstrap. Evolution 1985, 39, 783–791. [Google Scholar]
  69. Zwickl, D.J. Genetic Algorithm Approaches for the Phylogenetic Analysis of Large Biological Sequence Datasets under the Maximum Likelihood Criterion. Ph.D. Dissertation, University of Texas, Austin, TX, USA, 2006. [Google Scholar]
  70. Huelsenbeck, J.P.; Ronquist, F. Mrbayes: Bayesian inference of phylogeny. Bioinformatics 2001, 17, 754–755. [Google Scholar]
  71. Tamura, K.; Nei, M. Estimation of the number of nucleotide substitutions in the control region of mitochondrial DNA in humans and chimpanzees. Mol. Biol. Evol 1993, 10, 512–526. [Google Scholar]
  72. Posada, D.; Crandall, K.A. Modeltest: Testing the model of DNA substitution. Bioinformatics 1998, 14, 817–818. [Google Scholar]
  73. Rambaut, A.; Drummond, A.J. Tracer v1.5. 2009. Available online: http://tree.Bio.Ed.Ac.Uk/software/tracer/ accessed on 2 December 2009.
  74. Hörandl, E.; Stuessy, T.F. Paraphyletic groups as natural units of biological classification. Taxon 2010, 59, 1641–1653. [Google Scholar]
  75. Zhuang, Y.; Adams, K.L. Extensive allelic variation in gene expression in Populus F1 hybrids. Genetics 2007, 177, 1987–1996. [Google Scholar]
  76. Guo, M.; Rupe, M.A.; Zinselmeier, C.; Habben, J.; Bowen, B.A.; Smith, O.S. Allelic variation of gene expression in maize hybrids. Plant Cell 2004, 16, 1707–1716. [Google Scholar]
  77. Springer, N.M.; Stupar, R.M. Allele-specific expression patterns reveal biases and embryo-specific parent-of-origin effects in hybrid maize. Plant Cell 2007, 19, 2391–2402. [Google Scholar]
Figure 1. Morphologies and key characters of the eight morphs in the Pteris cadieri complex. Two leaves of each morph are shown. The upper leaf is fertile, and the lower leaf is sterile. The key characters include cytotype, phenology (evergreen or deciduous), geographic distribution, chloroplast haplotype, and PgiC genotype. An asterisk * represents an uncertain allele, e.g., genotype X1*Y means X1X1Y or X1YY. Symbols indicate cytotypes: ○ diploid; ▵ triploid; □ tetraploid. The number in each symbol indicates the morph.
Ijms 13 04523f1
Figure 2. Examples of the Pteris cadieri complex cytotype (2X, 3X, 4X) determination by flow cytometry. The horizontal axis indicates fluorescence intensity. Nicotiana tabacum was used as a calibration standard. There is a ratio 2:3:4 among the values of diploid, triploid and tetraploid. The vertical axis indicates the number of cells.
Ijms 13 04523f2
Figure 3. Chloroplast DNA tree for the Pteris cadieri complex and other Pteris species as determined by ML analyses. Based on the atpB-rbcL spacer and rbcL gene, plants of the P. cadieri complex, shown by specimen codes, were monophyletic, distinctly separate from the other Pteris species, and divided into three haplotype groups, α, β, and, γ. Species (c, P. cadieri; g, P. grevilleana), morph (1–8), locality (H, Hainan; T, Taiwan), and ploidy level (2, diploid; 3, triploid; 4, tetraploid) are shown. Numbers above the branches are ML/MP bootstrap values.
Ijms 13 04523f3
Figure 4. Nuclear DNA tree assessed by Bayesian inference for Pteris cadieri complex and other Pteris species. Based on the cytosolic phosphoglucose isomerase gene (PgiC) (primers 15PF and 17R), each clone is identified to alleles X1, X2, X3, X4 or Y. The number following the specimen code indicates the cloning sample (see Supplementary S1). If a specimen code is not followed by a cloning sample number, the sample was sequenced directly. Numbers above branches are MP bootstrap supporting/posterior probability (PP) (>50; >50%) values.
Ijms 13 04523f4
Figure 5. Geographic distribution of the eight morphs in the Pteris cadieri complex from Hainan and Taiwan. Populations are shown as dots. There were six populations in Hainan and 21 populations in Taiwan. Symbols indicate cytotypes: ○ diploid; ▵ triploid; □ tetraploid. The number in each symbol indicates the morph.
Ijms 13 04523f5
Figure 6. Inferred reticulate relationship of the Pteris cadieri complex. The most parsimonious scenario is exhibited. Symbols indicate cytotypes: ○ diploid; ▵ triploid; □ tetraploid. Symbols with a dotted outline indicate missing taxa. Maternal (bold line) and paternal (fine line) lineages were determined by comparing cpDNA and PgiC gene phylogenies. Taxa restricted to Hainan or Taiwan are indicated.
Ijms 13 04523f6
Figure 7. The positions of primers for PgiC gene from exon 14 to exon 17. Exons and introns are drawn to scale. Small arrows show positions and directions of the primers and the vertical arrow indicates the largest indel region.
Ijms 13 04523f7
Table 1. Morphological characteristics for identifying taxa in the Pteris cadieri complex.
Morph typePloidy levelFertile bladesSterile bladesScales
Morph 1DiploidPedate or pinnatePedate, basal pinna straight or incurvedWide and dark brown center
Morph 2Diploid, tetraploidPedate or pinnate, sometimes with digital projectsPedate, basal pinna straight or incurvedNarrow and dark brown center
Morph 3DiploidPinnate, sometimes with digital projectsPinnate, sometimes with digital projects, basal pinna straightWide and dark brown center
Morph 4DiploidPinnate, sometimes with digital projectsBipinnatifid, basal pinna straightWide and dark brown center
Morph 5TriploidPedate, sometimes with digital projectsBipinnatifid, basal pinna incurvedWide and dark brown center
Morph 6TriploidIrregularly bipinnatifidBipinnatifid, basal pinna incurvedWide and dark brown center
Morph 7DiploidAlmost regularly bipinnatifidBipinnatifd, basal pinna straightWide and dark brown center
Morph 8Diploid, triploid, tetraploidBipinnatifidBipinnatifid, basal pinna straight or incurvedWide and dark brown center
Table 2. PCR primers used in this study.
Primer for Chloroplast DNA

PrimerPrimer sequence (5′→3′)Origin
atpB_672CAC TSA GAG GRG CTC CCG TAT CAA[46]
rbcL_r49RCAC CAG CTT TGA ATC CAA CAC TTG C[46]
atpB 493FCGA CGA TAC GGR GCC AAA AGA TCC[47]
rbcL r158RAAG ATT CCG CAG CTA CTG CAG CTC C[47]
rbcL F1FATG TCA CCA CAA ACA GAA ACT AAA GCA AGT[48]
rbcL F1379RTCA CAA GCA GCA GCT AGT TCA GGA CTC[49]
rbcL_PFTAA GTA TCG TGY GGA GGT TRA ATC AThis study

Primer for PgiC

PrimerPrimer sequence (5′→3′)Origin

14FGTG CTT CTG GGT CTT TTG AGT G[41]
16RGTT GTC CAT TAG TTC CAG GTT CCC C[41]
15PFCAAATCCTTTCTTGCAATAGGCThis study
17RGAA ATCAC ATGGA ATAAC ACGTCCThis study
15PFXCAAGT ATACC TCTTC TTGAC AGThis study
15PFYCAG CAA GTA TAA CAA AAA CTC GCThis study
Table 3. Dataset and parsimony-based tree statistics for three DNA data. Including atpB-rbcL spacer & rbcL gene, PgiC gene by primers 15PF and 17R, and PgiC gene by forward primers 15PFX/15PFY and reverse primer 17R.
atpB-rbcL spacer & rbcL genePgiC gene (primers 15PF and 17R)PgiC gene (primers 15PFX/15PFY and 17R)
No. sequence57151191
Aligned length (bp)212617941090
Characters included (bp)2091–21191431–1705786–1050
Variable characters (bp)227559399
Parsimony informative characters (bp)98306 (50 binary characters produced by coding indels)200 (41 binary characters produced by coding indels)
Obtained trees32241281145
Tree length300774578
CI0.7770.7640.739
RI0.9300.9290.937

