Asymmetric Dimethylarginine Plasma Levels and Endothelial Function in Newly Diagnosed Type 2 Diabetic Patients


Abstract
:1. Introduction
2. Results
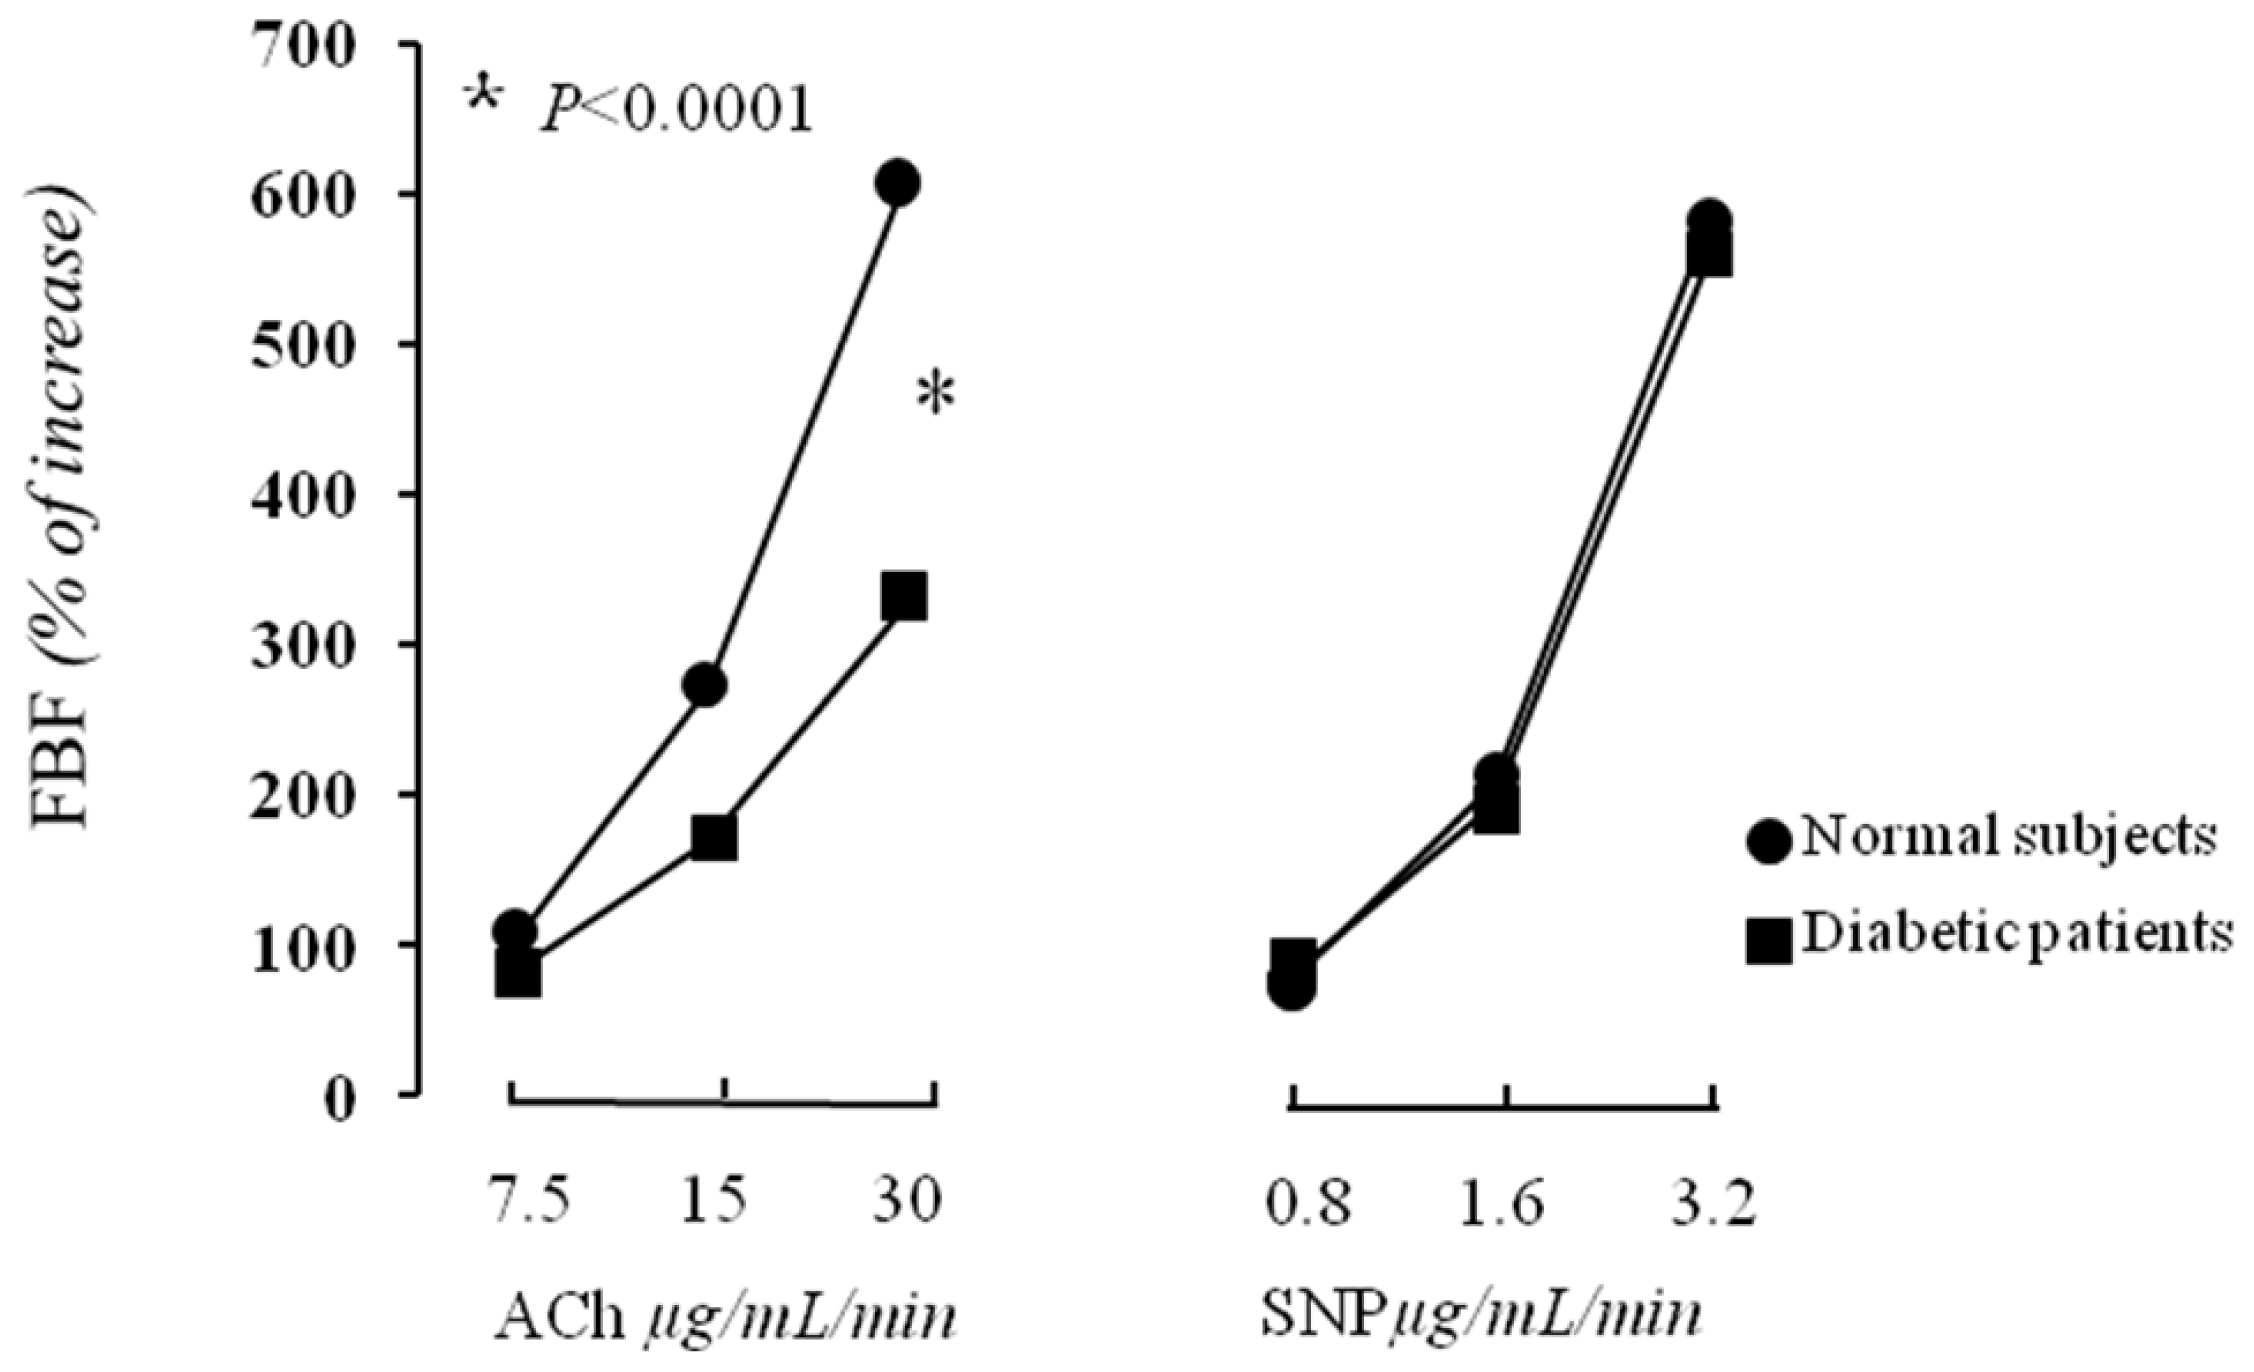
2.1. Vascular Function
2.2. Correlational Analyses
3. Discussion
4. Experimental Section
4.1. Study Population
4.2. Laboratory Determinations
4.3. Determination of Insulin Resistance
4.4. Determination of ADMA and l-Arginine
4.5. Forearm Blood Flow Measurements
4.6. Statistical Analysis
5. Conclusions
- Conflict of InterestThe authors declare no conflict of interest.
References
- Vane, J.R.; Auggard, E.E.; Botting, R.M. Regulatory functions of the vascular endothelium. N. Engl. J. Med 1990, 323, 27–36. [Google Scholar]
- Ross, R. Atherosclerosis: An inflammatory disease. N. Engl. J. Med 1999, 340, 115–126. [Google Scholar]
- Furchgott, R.F.; Zawadzki, J.V. The obligatory role of endothelial cells in the relaxation of arterial smooth muscle by acetylcholine. Nature 1980, 288, 373–376. [Google Scholar]
- Jeremy, J.Y.; Rowe, D.; Emsley, A.M.; Newby, A.C. Nitric oxide and the proliferation of vascular smooth muscle cells. Cardiovasc. Res 1999, 43, 580–594. [Google Scholar]
- Perticone, F.; Ceravolo, R.; Maio, R.; Ventura, G.; Zingone, A.; Perrotti, N.; Mattioli, P.L. Angiotensin-converting enzyme gene polymorphism is associated with endothelium-dependent vasodilation in never treated hypertensive patients. Hypertension 1998, 31, 900–905. [Google Scholar]
- Johnstone, M.T.; Creager, S.J.; Scales, K.M.; Cusco, J.A.; Lee, B.K.; Creager, M.A. Impaired endothelium-dependent coronary arterial vasodilation in patients with insulin-dependent diabetes mellitus. Circulation 1993, 88, 2510–2516. [Google Scholar]
- Perticone, F.; Ceravolo, R.; Candigliota, M.; Ventura, G.; Iacopino, S.; Sinopoli, F.; Mattioli, P.L. Obesity and body fat distribution induces endothelial dysfunction by oxidative stress. Protective effect of vitamin C. Diabetes 2001, 501, 159–165. [Google Scholar]
- Quyyumi, A.A. Endothelial function in health and disease: New insights into the genesis of cardiovascular disease. Am. J. Med 1998, 105, 32S–39S. [Google Scholar]
- Perticone, F.; Ceravolo, R.; Pujia, A.; Ventura, G.; Iacopino, S.; Scozzafava, A.; Ferraro, A.; Chello, M.; Mastroroberto, P.; Verdecchia, P.; et al. Prognostic significance of endothelial dysfunction in hypertensive patients. Circulation 2001, 104, 191–196. [Google Scholar]
- Kielstein, J.T.; Impraim, B.; Simmel, S.; Bode-Böger, S.M.; Tsikas, D.; Frölich, C.; Hoeper, M.M.; Haller, H.; Fliser, D. Cardiovascular effects of systemic nitric oxide synthase inhibition with asymmetrical dimethylarginine in humans. Circulation 2004, 109, 172–177. [Google Scholar]
- Zoccali, C.; Bode-Boger, S.; Mallamaci, F.; Benedetto, F.; Tripepi, G.; Malatino, L.; Cataliotti, A.; Bellanuova, I.; Fermo, I.; Frolich, J.; et al. Plasma concentration of asymmetrical dimethylarginine and mortality in patients with end-stage renal disease: A prospective study. Lancet 2001, 358, 2113–2117. [Google Scholar]
- Lu, T.M.; Ding, Y.A.; Leu, H.B.; Yin, W.H.; Sheu, W.H.; Chu, K.M. Effect of rosuvastatin on plasma levels of asymmetric dimethylarginine in patients with hypercholesterolemia. Am. J. Cardiol 2004, 94, 157–161. [Google Scholar]
- Perticone, F.; Sciacqua, A.; Maio, R.; Perticone, M.; Maas, R.; Boger, R.H.; Tripepi, G.; Sesti, G.; Zoccali, C. Asymmetric dimethylarginine, l-arginine, and endothelial dysfunction in essential hypertension. J. Am. Coll. Cardiol 2005, 46, 518–523. [Google Scholar]
- Abbassi, F.; Asagami, T.; Cooke, J.P.; Lambendola, C.; McLaughlin, T.; Reaven, G.M.; Stǜhlinger, M.C.; Tsao, P.S. Plasma Concentrations of asymmetric dimethylarginine are increased in patients with type 2 diabetes mellitus. Am. J. Cardiol 2001, 88, 1201–1203. [Google Scholar]
- Lin, K.Y.; Ito, A.; Asagami, T.; Tsao, P.S.; Adimoolam, S.; Kimoto, M.; Tsuji, H.; Reaven, G.M.; Cooke, J.P. Impaired nitric oxide synthase pathway in diabetes mellitus: Role of asymmetric dimethylarginine and dimethylarginine dimethylaminohydrolase. Circulation 2002, 106, 987–992. [Google Scholar]
- Ilercil, A.; Devereux, R.B.; Roman, M.J.; Paranicas, M.; O’grady, M.J.; Welty, T.K.; Robbins, D.C.; Fabsitz, R.R.; Howard, B.V.; Lee, E.T. Relationship of impaired glucose tolerance to left ventricular structure and function: The Strong Heart Study. Am. Heart J 2001, 141, 992–998. [Google Scholar]
- Cersosimo, E.; DeFronzo, R.A. Insulin resistance and endothelial dysfunction: The road map to cardiovascular diseases. Diabetes Metab. Res. Rev 2006, 22, 423–436. [Google Scholar]
- Nerpin, E.; Risérus, U.; Ingelsson, E.; Sundström, J.; Jobs, M.; Larsson, A.; Basu, S.; Arnlöv, J. Insulin sensitivity measured with euglycemic clamp is independently associated with glomerular filtration rate in a community-based cohort. Diabetes Care 2008, 31, 1550–1555. [Google Scholar]
- Succurro, E.; Marini, M.A.; Arturi, F.; Grembiale, A.; Lugarà, M.; Andreozzi, F.; Sciacqua, A.; Lauro, R.; Hribal, M.L.; Perticone, F.; et al. Elevated one-hour post-load plasma glucose levels identifies subjects with normal glucose tolerance but early carotid atherosclerosis. Atherosclerosis 2009, 207, 245–249. [Google Scholar]
- Succurro, E.; Arturi, F.; Lugarà, M.; Grembiale, A.; Fiorentino, T.V.; Caruso, V.; Andreozzi, F.; Sciacqua, A.; Hribal, M.L.; Perticone, F.; et al. One-hour postload plasma glucose levels are associated with kidney dysfunction. Clin. J. Am. Soc. Nephro 2010, 5, 1922–1927. [Google Scholar]
- Sciacqua, A.; Miceli, S.; Carullo, G.; Greco, L.; Succurro, E.; Arturi, F.; Sesti, G.; Perticone, F. One-hour postload plasma glucose levels and left ventricular mass in hypertensive patients. Diabetes Care 2011, 34, 1406–1411. [Google Scholar]
- Perticone, F.; Sciacqua, A.; Perticone, M.; Miceli, S.; Maio, R.; Tassone, J.E.; Arturi, F.; Sesti, G. Phenotypic characterization of normotolerant hypertensive patients. Int. J. Cardiol 2011, in press. [Google Scholar]
- Despres, J.P.; Lamarche, B.; Mauriege, P.; Cantin, B.; Dagenais, G.R.; Moorjani, S.; Lupien, P.J. Hyperinsulinemia as an independent risk factor for ischemic heart disease. N. Engl. J. Med 1996, 334, 952–957. [Google Scholar]
- Balletshofer, B.M.; Rittig, K.; Enderle, M.D.; Volk, A.; Maerker, E.; Jacob, S.; Matthaei, S.; Rett, K.; Haring, H.U. Endothelial dysfunction is detectable in young normotensive first-degree relatives of subjects with type 2 diabetes in association with insulin resistance. Circulation 2000, 101, 1780–1784. [Google Scholar]
- Zeng, G.; Nystrom, F.H.; Ravichandran, L.V.; Cong, L.N.; Kirby, M.; Mostowski, H.; Quon, M.J. Roles for insulin receptor, PI3-kinase, and Akt in insulin-signaling pathways related to production of nitric oxide in human vascular endothelial cells. Circulation 2000, 101, 1539–1545. [Google Scholar]
- Federici, M.; Pandolfi, A.; de Filippis, E.A.; Pellegrini, G.; Menghini, R.; Lauro, D.; Cardellini, M.; Romano, M.; Sesti, G.; Lauro, R.; et al. G972R IRS-1 variant impairs insulin regulation of eNOS in cultured human endothelial cells. Circulation 2004, 109, 300–405. [Google Scholar]
- Perticone, F.; Sciacqua, A.; Scozzafava, A.; Ventura, G.; Laratta, E.; Pujia, A.; Federici, M.; Lauro, R.; Sesti, G. Impaired endothelial function in never-treated hypertensive subjects carrying the Arg972 polymorphism in the insulin receptor substrate-1 gene. J. Clin. Endocr. Metab 2004, 89, 3606–3609. [Google Scholar]
- Stuhlinger, M.C.; Abbasi, F.; Chu, J.W.; Lamendola, C.; McLaughlin, T.L.; Cooke, J.P.; Reaven, G.M.; Tsao, P.S. Relationship between insulin resistance and an endogenous nitric oxide synthase inhibitor. JAMA 2002, 287, 1420–1426. [Google Scholar]
- Perticone, F.; Sciacqua, A.; Maio, R.; Perticone, M.; Leone, G.G.; Bruni, R.; di Cello, S.; Pascale, A.; Talarico, G.; Greco, L.; et al. Endothelial dysfunction, ADMA and insulin resistance in essential hypertension. Int. J. Cardiol 2010, 142, 236–241. [Google Scholar]
- Williams, S.B.; Cusco, J.A.; Roddy, M.A.; Johnstone, M.T.; Creager, M.A. Impaired nitric oxide-mediated vasodilation in patients with non-insulin-dependent diabetes mellitus. J. Am. Coll. Cardiol 1996, 27, 567–574. [Google Scholar]
- Perticone, F.; Maio, R.; Sciacqua, A.; Andreozzi, F.; Iemma, G.; Perticone, M.; Zoccali, C.; Sesti, G. Endothelial dysfunction and C-reactive protein are risk factors for diabetes in essential hypertension. Diabetes 2008, 57, 167–171. [Google Scholar]
- Anderssohn, M.; Schwedhelm, E.; Lüneburg, N.; Vasan, R.S.; Böger, R.H. Asymmetric dimethylarginine as a mediator of vascular dysfunction and a marker of cardiovascular disease and mortality: An intriguing interaction with diabetes mellitus. Diabetes Vasc. Dis. Res 2010, 7, 105–118. [Google Scholar]
- Fard, A.; Tuck, C.H.; Donis, J.A.; Sciacca, R.; di Tullio, M.R.; Wu, H.D.; Bryant, T.A.; Chen, N.T.; Torres-Tamayo, M.; Ramasamy, R.; et al. Acute elevations of plasma asymmetric dimethylarginine and impaired endothelial function in response to a high-fat meal in patients with type 2 diabetes. Arterioscler. Throm. Vas 2000, 20, 2039–2044. [Google Scholar]
- Hanai, K.; Babazono, T.; Nyumura, I.; Toya, K.; Tanaka, N.; Tanaka, M.; Ishii, A.; Iwamoto, Y. Asymmetric dimethylarginine is closely associated with the development and progression of nephropathy in patients with type 2 diabetes. Nephrol. Dial. Transpl 2009, 24, 1884–1888. [Google Scholar]
- Malecki, M.T.; Undas, A.; Cyganek, K.; Mirkiewicz-Sieradzka, B.; Wolkow, P.; Osmenda, G.; Walus-Miarka, M.; Guzik, T.J.; Sieradzki, J. Plasma asymmetric dimethylarginine (ADMA) is associated with retinopathy in type 2 diabetes. Diabetes Care 2007, 30, 2899–2901. [Google Scholar]
- Krzyzanowska, K.; Mittermayer, F.; Wolzt, M.; Schernthaner, G. Asymmetric dimethylarginine predicts cardiovascular events in patients with type 2 diabetes. Diabetes Care 2007, 30, 1834–1839. [Google Scholar]
- Tsikas, D.; Böger, R.H.; Sandmann, J.; Bode-Böger, S.M.; Frölich, J.C. Hypothesis: Endogenous nitric oxide synthase inhibitors are responsible for the l-arginine paradox. FEBS Lett 2000, 478, 1–3. [Google Scholar]
- Andreozzi, F.; Succurro, E.; Mancuso, M.R.; Perticone, M.; Sciacqua, A.; Perticone, F.; Sesti, G. Metabolic and cardiovascular risk factors in subjects with impaired fasting glucose: The 100 versus 110 mg/dL threshold. Diabetes Metab. Res. Rev 2007, 23, 547–550. [Google Scholar]
- Levey, A.S.; Stevens, L.A.; Schmid, C.H.; Zhang, Y.L.; Castro, A.F., III; Feldman, H.I.; Kusek, J.W.; Eggers, P.; van Lente, F.; Greene, T.; et al. A new equation to estimate glomerular filtration rate. Ann. Intern. Med. 2009, 150, 604–612. [Google Scholar]
- Hanley, A.J.; Williams, K.; Stern, M.P.; Haffner, S.M. Homeostasis model assessment of insulin resistance in relation to the incidence of cardiovascular disease: The San Antonio Heart Study. Diabetes Care 2002, 25, 1177–1184. [Google Scholar]
- Panza, J.A.; Quyyumi, A.A.; Brush, J.E.; Epstein, S.E. Abnormal endothelium dependent vascular relaxation in patients with essential hypertension. N. Engl. J. Med 1990, 323, 22–27. [Google Scholar]


| Nondiabetics (n = 30) | Newly Diagnosed Type 2 Diabetic (n = 45) | p | |
|---|---|---|---|
| Gender (males/females) | 17/13 | 24/21 | 0.962 * |
| Age (years) | 45.1 ± 10.6 | 44.6 ± 7.1 | 0.807 |
| Body mass index (kg/m2) | 27.3 ± 1.8 | 27.8 ± 2.9 | 0.403 |
| Waist circumference (cm) | 92.9 ± 7.4 | 93.9 ± 3.9 | 0.448 |
| Systolic BP (mmHg) | 125.8 ± 9.3 | 127.1 ± 8.9 | 0.545 |
| Diastolic BP (mmHg) | 77.7 ± 7.3 | 79.1 ± 8.3 | 0.456 |
| Fasting glucose (mg/dL) | 90.4 ± 8.6 | 114.1 ± 15.6 | <0.0001 |
| Fasting insulin (μU/mL) | 8.6 ± 2.8 | 15.1 ± 5.4 | <0.0001 |
| HOMA | 1.9 ± 0.6 | 5.6 ± 2.1 | <0.0001 |
| hs-CRP (mg/L) | 1.4 ± 0.8 | 4.5 ± 1.9 | <0.0001 |
| Total cholesterol (mg/dL) | 199.7 ± 22.1 | 194.2 ± 31.7 | 0.412 |
| LDL cholesterol (mg/dL) | 118.8 ± 23.9 | 123.7 ± 32.3 | 0.480 |
| HDL cholesterol (mg/dL) | 50.3 ± 10.5 | 42.8 ± 8.9 | 0.001 |
| Triglyceride (mg/dL) | 100.3 ± 41.4 | 138.6 ± 62.6 | 0.004 |
| basal FBF (m 100 mL−1 of tissue min−1) | 3.2 ± 0.8 | 3.1 ± 0.3 | 0.447 |
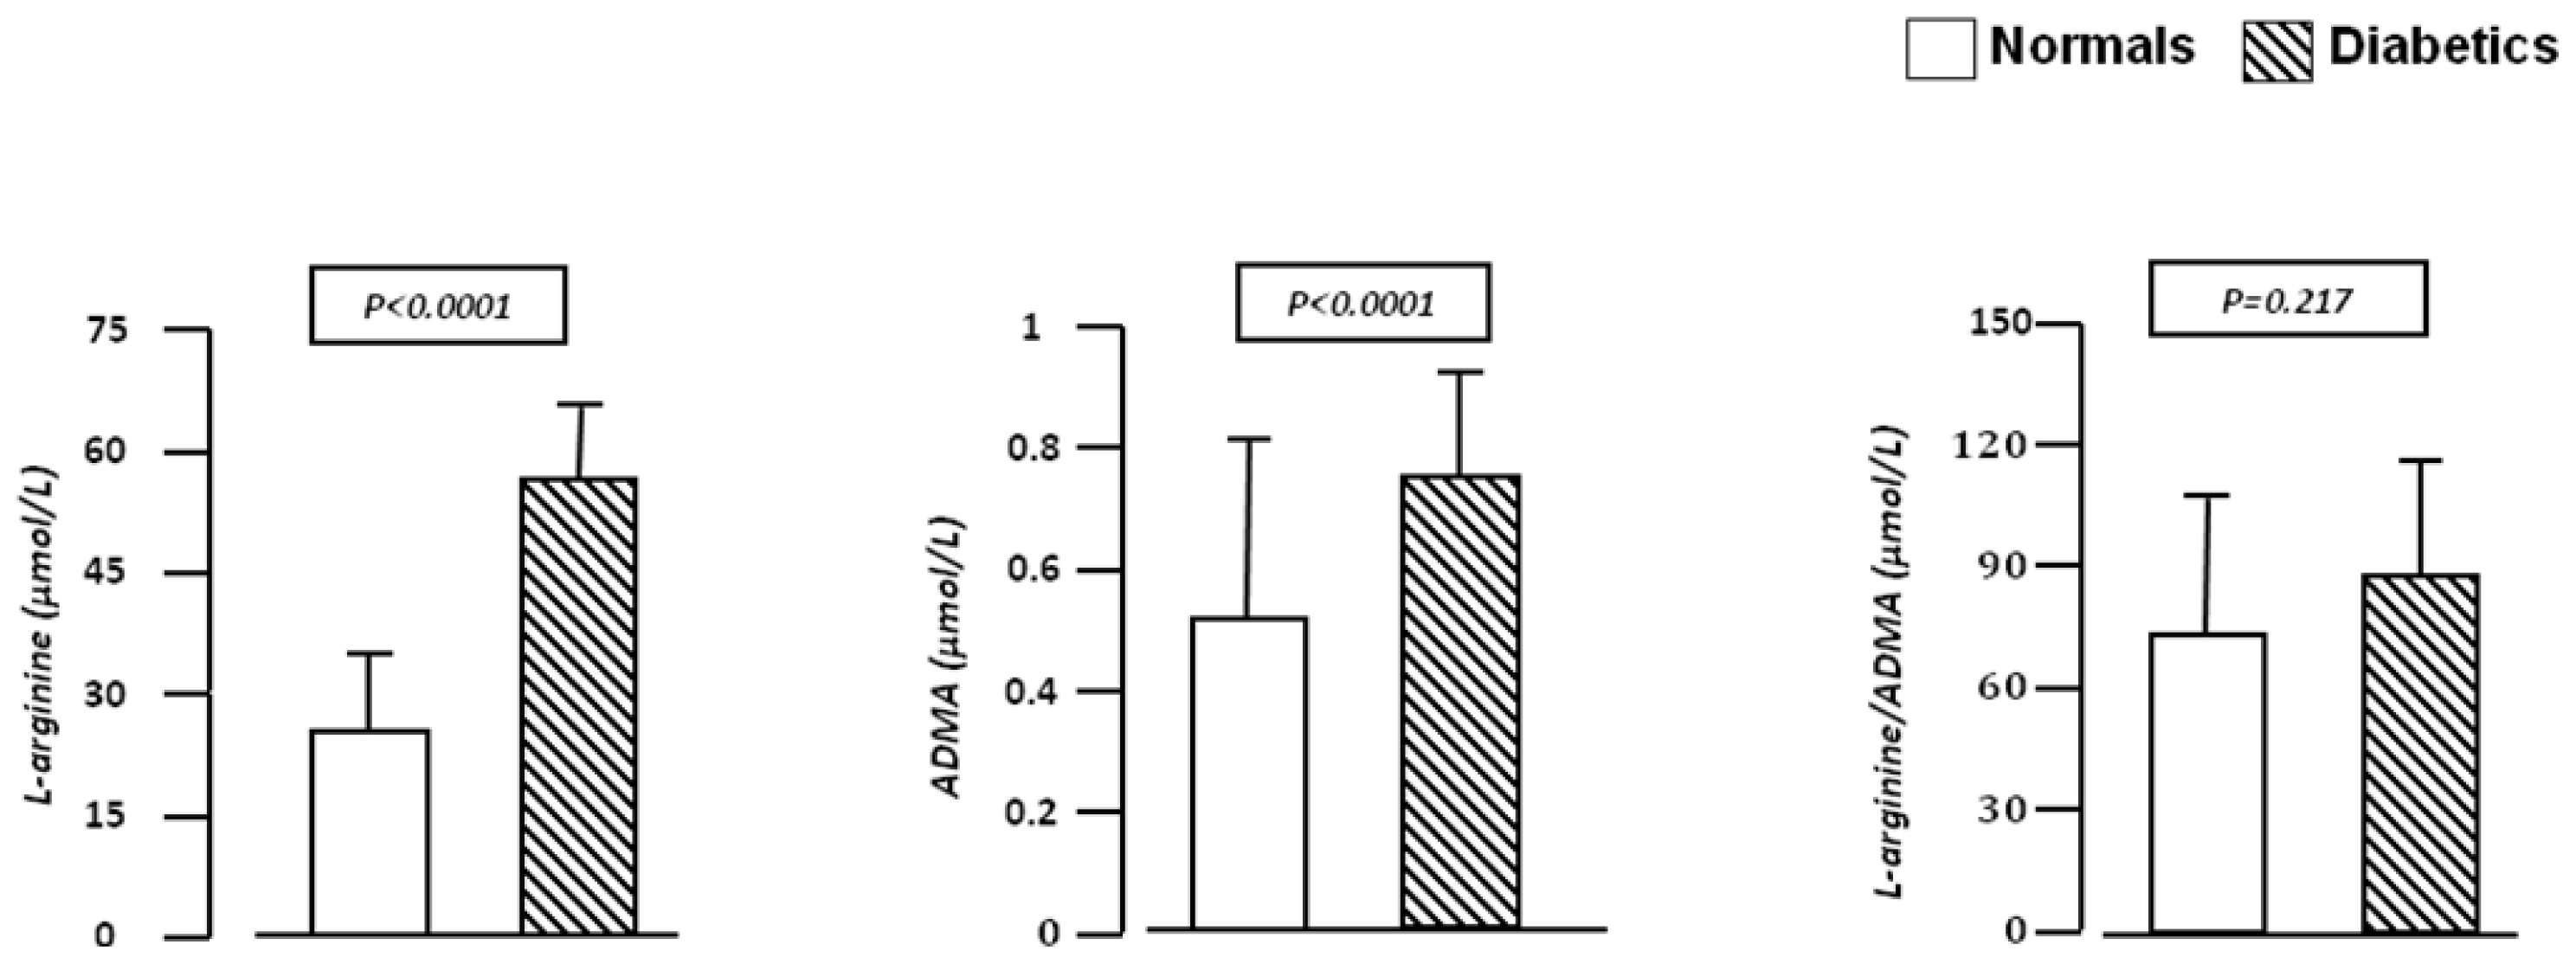
| l-arginine (μmol/L) | 28.5 ± 7.2 | 49.8 ± 16.8 | <0.0001 |
| ADMA (μmol/L) | 0.5 ± 0.2 | 0.7 ± 0.2 | <0.0001 |
| e-GFR (mL/min/1.73m2) | 99.6 ± 8.4 | 104.3 ± 15.8 | 0.140 |
| FBF R/p | |
|---|---|
| ADMA (μmol/L) | −0.524/<0.0001 |
| HOMA | −0.428/0.002 |
| hs-CRP (mg/L) | −0.416/0.002 |
| l-arginine (μmol/L) | −0.261/0.042 |
| Systolic BP (mmHg) | −0.190/0.105 |
| e-GFR (mL/min/1.73 m2) | 0.183/0.114 |
| Waist circumference (cm) | −0.156/0.153 |
| Total cholesterol (mmol/L) | 0.155/0.154 |
| Body mass index (kg/m2) | −0.143/0.175 |
| HDL cholesterol (mmol/L) | 0.117/0.221 |
| Triglycerides (mmol/L) | −0.063/0.340 |
| Age (yrs) | 0.044/0.387 |
| Diastolic BP (mmHg) | 0.024/0.437 |
| Partial R2 | Total R2 | p | |
|---|---|---|---|
| ADMA, μmol/L | 27.5 | 27.5 | <0.0001 |
| HOMA | 7.0 | 34.5 | 0.040 |
© 2012 by the authors; licensee Molecular Diversity Preservation International, Basel, Switzerland. This article is an open-access article distributed under the terms and conditions of the Creative Commons Attribution license (http://creativecommons.org/licenses/by/3.0/).
Share and Cite
Sciacqua, A.; Grillo, N.; Quero, M.; Sesti, G.; Perticone, F. Asymmetric Dimethylarginine Plasma Levels and Endothelial Function in Newly Diagnosed Type 2 Diabetic Patients. Int. J. Mol. Sci. 2012, 13, 13804-13815. https://doi.org/10.3390/ijms131113804
Sciacqua A, Grillo N, Quero M, Sesti G, Perticone F. Asymmetric Dimethylarginine Plasma Levels and Endothelial Function in Newly Diagnosed Type 2 Diabetic Patients. International Journal of Molecular Sciences. 2012; 13(11):13804-13815. https://doi.org/10.3390/ijms131113804
Chicago/Turabian StyleSciacqua, Angela, Nadia Grillo, Michele Quero, Giorgio Sesti, and Francesco Perticone. 2012. "Asymmetric Dimethylarginine Plasma Levels and Endothelial Function in Newly Diagnosed Type 2 Diabetic Patients" International Journal of Molecular Sciences 13, no. 11: 13804-13815. https://doi.org/10.3390/ijms131113804
APA StyleSciacqua, A., Grillo, N., Quero, M., Sesti, G., & Perticone, F. (2012). Asymmetric Dimethylarginine Plasma Levels and Endothelial Function in Newly Diagnosed Type 2 Diabetic Patients. International Journal of Molecular Sciences, 13(11), 13804-13815. https://doi.org/10.3390/ijms131113804