1. Introduction
The dihydroorotate dehydrogenase (DHODH) ia an essential mitochondrial enzyme that catalyzes the flavin mononucleotide-dependent formation of orotic acid, a key step in
de novo pyrimidine biosynthesis [
1,
2]. This enzyme is an attractive chemotherapeutic target in various pathogens, such as
Plasmodium falciparum and
Helicobacter pylori, and for the treatment of human disease, such as cancer, malaria and rheumatoid arthritis [
3–
5].
All potent inhibitors of DHODH published to date bind to the putative ubiquinone binding channel and display beneficial immunosuppressive and antiproliferative activities, shown to be most pronounced during T-cell proliferation [
6]. Brequinar and leflunomide are two examples of low-molecular weight inhibitors of DHODH that have been in clinical development [
7–
9]. Leflunomide is now marketed as a treatment for rheumatoid arthritis. A series of analogues of the active metabolite of an immunosuppressive agent leflunomide have also been synthesized and found to inhibit DHODH [
10].
Quantitative structure-activity relationships are the most important applications of chemometrics, giving useful information for the design of new compounds acting on a specific target. Quantitative structure-activity relationship (QSAR) attempts to find a consistent relationship between biological activity and molecular properties. Thus, QSAR models can be used to predict the activity of new compounds. Although there has been much interest in synthesis of various inhibitors of DHODH, there have been few QSAR studies of DHODH inhibitors [
10–
13]. Kuo [
10] and Ren [
11] have even reported the structure-activity relationships (SAR) and quantitative structure-activity relationship (2D-QSAR) of this series of analogues, respectively.
The self-organizing molecular field analysis (SOMFA) [
14] is a simple 3D-QSAR technique, which has been developed by Robinson
et al. The method has similarities to both comparative molecular field analysis (CoMFA) [
15] and molecular similarity studies. Like CoMFA, a grid-based approach is used; however, SOMFA only uses steric and electrostatic maps, which are related to interaction energy maps, no probe interaction energies need to be evaluated. The weighting procedure of the grid points by Mean-Centered-activity is an important ingredient of the SOMFA procedure. Like the similarity methods, it is the intrinsic molecular properties, such as the molecular shape and electrostatic potential, which are used to develop the QSAR models.
A SOMFA model could suggest a method of tackling the all-important alignment, which all 3D-QSAR methods have faced. The inherent simplicity of this method allows the possibility of aligning the training compounds as an integral part of the model derivation process and of aligning prediction compounds to optimize their predicted activities.
In a recent study, leflunomide has been found to exhibit some dose-dependent side effects in a small number of patients [
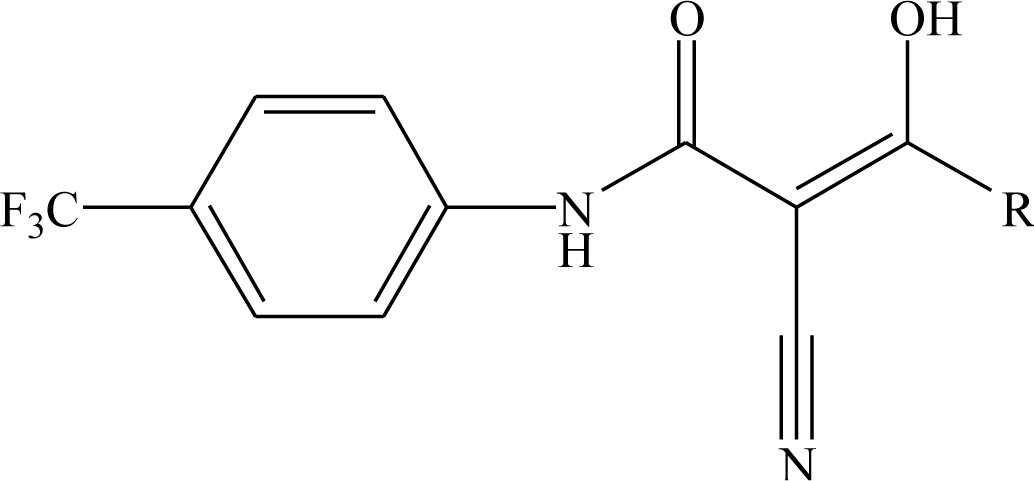
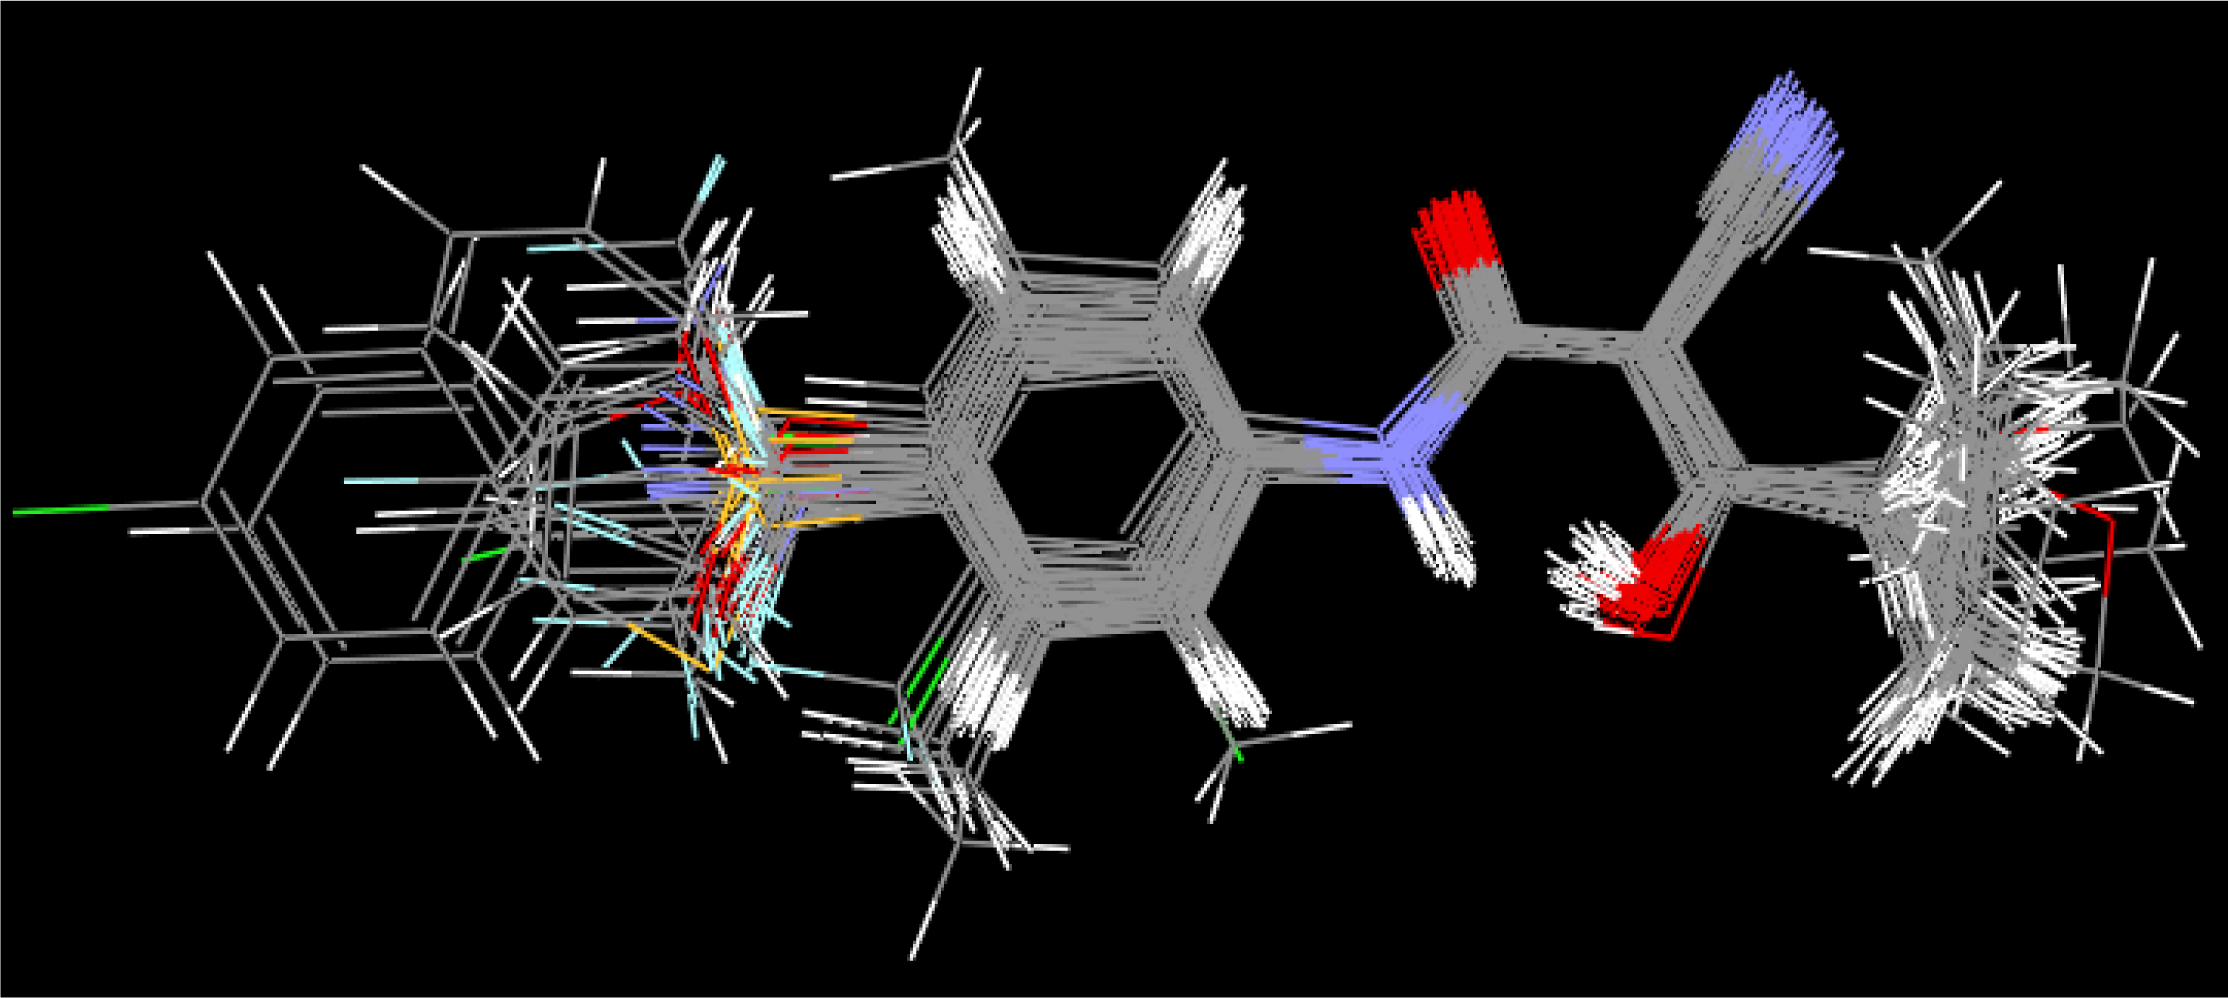
16]. The purpose of this paper is to describe the application of self-organizing molecular field analysis, SOMFA, on the analogues of the active metabolite of leflunomide, to analyze the three-dimensional quantitative structure-activity relationships (3D-QSAR) and to determine the structural requirements of this series of analogues for optimum activity. The 3D-QSAR together with the modeling studies will provide a more precise elucidation of the molecular forces involved in the DHODH inhibitor-enzyme interactions, and may be useful for further modification and improvement of inhibitors of this important enzyme.
3. Results and Discussion
SOMFA, a novel 3D-QSAR methodology, is employed for the analysis with the training set composed of 42 various compounds, from which biological activities are known. Statistical results of 12 SOMFA models are summarized in
Table 3.
A cross-validated value rCV2 which is obtained as a result of PLS analysis serves as a quantitative measure of the predictability of the SOMFA model. We find that the quality of the QSAR model was dependent upon the alignment and number of molecules. The model overlayed using alignment 2 shows higher rCV2 values than using the model of alignment 1, and the model of subgroups shows higher rCV2 values than the model of all analogues.
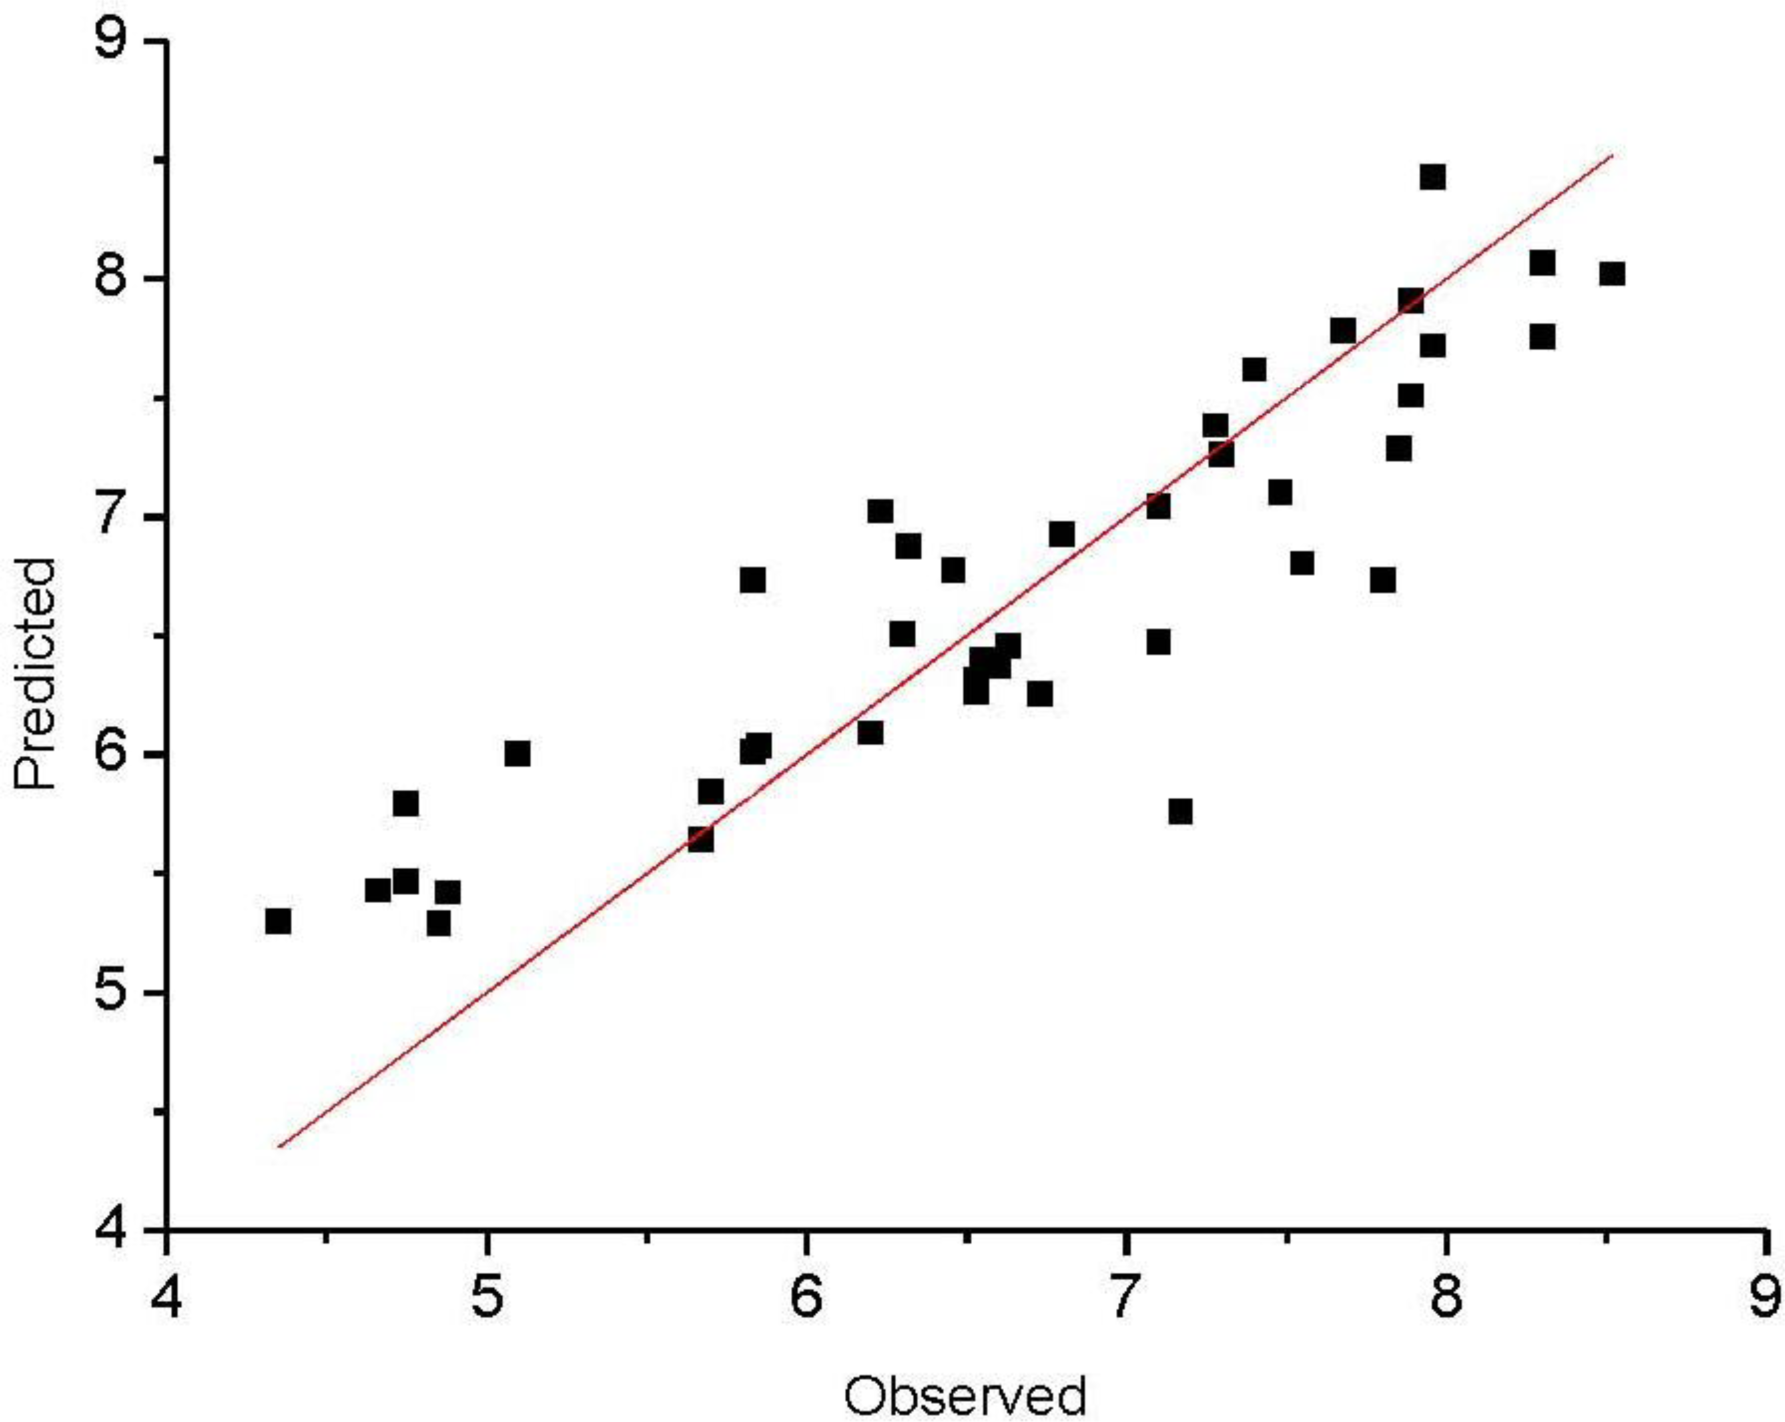
Among the models tested from all analogues, good cross-validated correlation coefficient rCV2 values (0.664), moderate non-cross-validated correlation coefficient r2 values (0.687) proves a good conventional statistical correlation which have been obtained, and we also find that the resultant SOMFA model have a satisfying predictive ability.
The observed and predicted activities of the training set are reported in
Table 4.
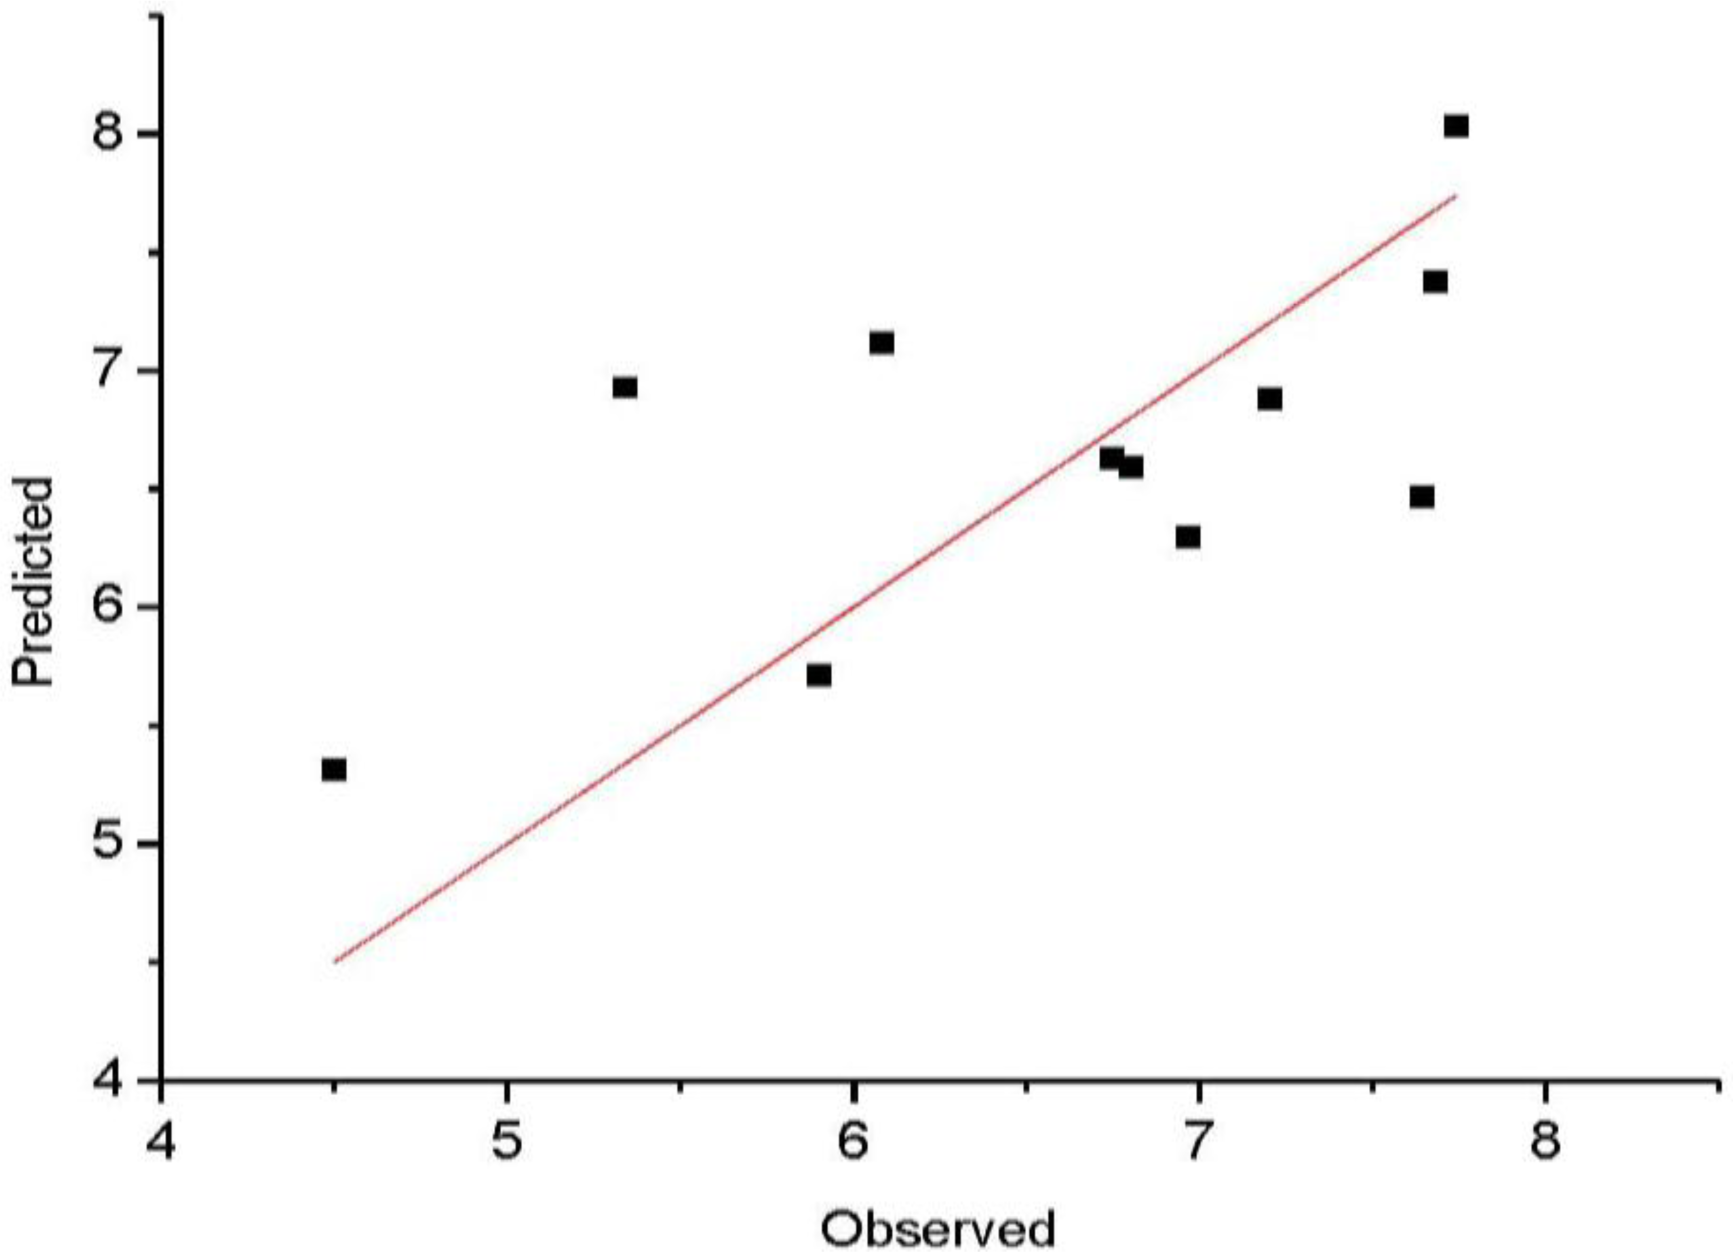
Figure 3 shows a satisfying linear correlation and moderate difference between observed and predicted values of molecules in the training set.
It is well known that the best way to validate a 3D-QSAR model is to predict biological activities for the compounds forming the test set. The SOMFA analysis of the test set composed of 11 compounds is reported in
Table 5. Most of the compounds in the test set show satisfying correlation between observed and predicted values in
Figure 4. We find that two compounds of test set (compound 10 and 15) always have large residuals, and could be classified as outliers. This is true for both rat and mouse DHODH models, there may be more complicated structure-activity relationships in these two compounds. The statistical parameters r
pred2 of test compounds excluding compound 10 and 15 are also summarized in
Table 3; all the models performed well (r
pred2 > 0.5) in the activity prediction of most test compounds.
SOMFA calculation for both shape and electrostatic potentials are performed, then combined to get an optimal coefficient c
1 = 0.766 according to
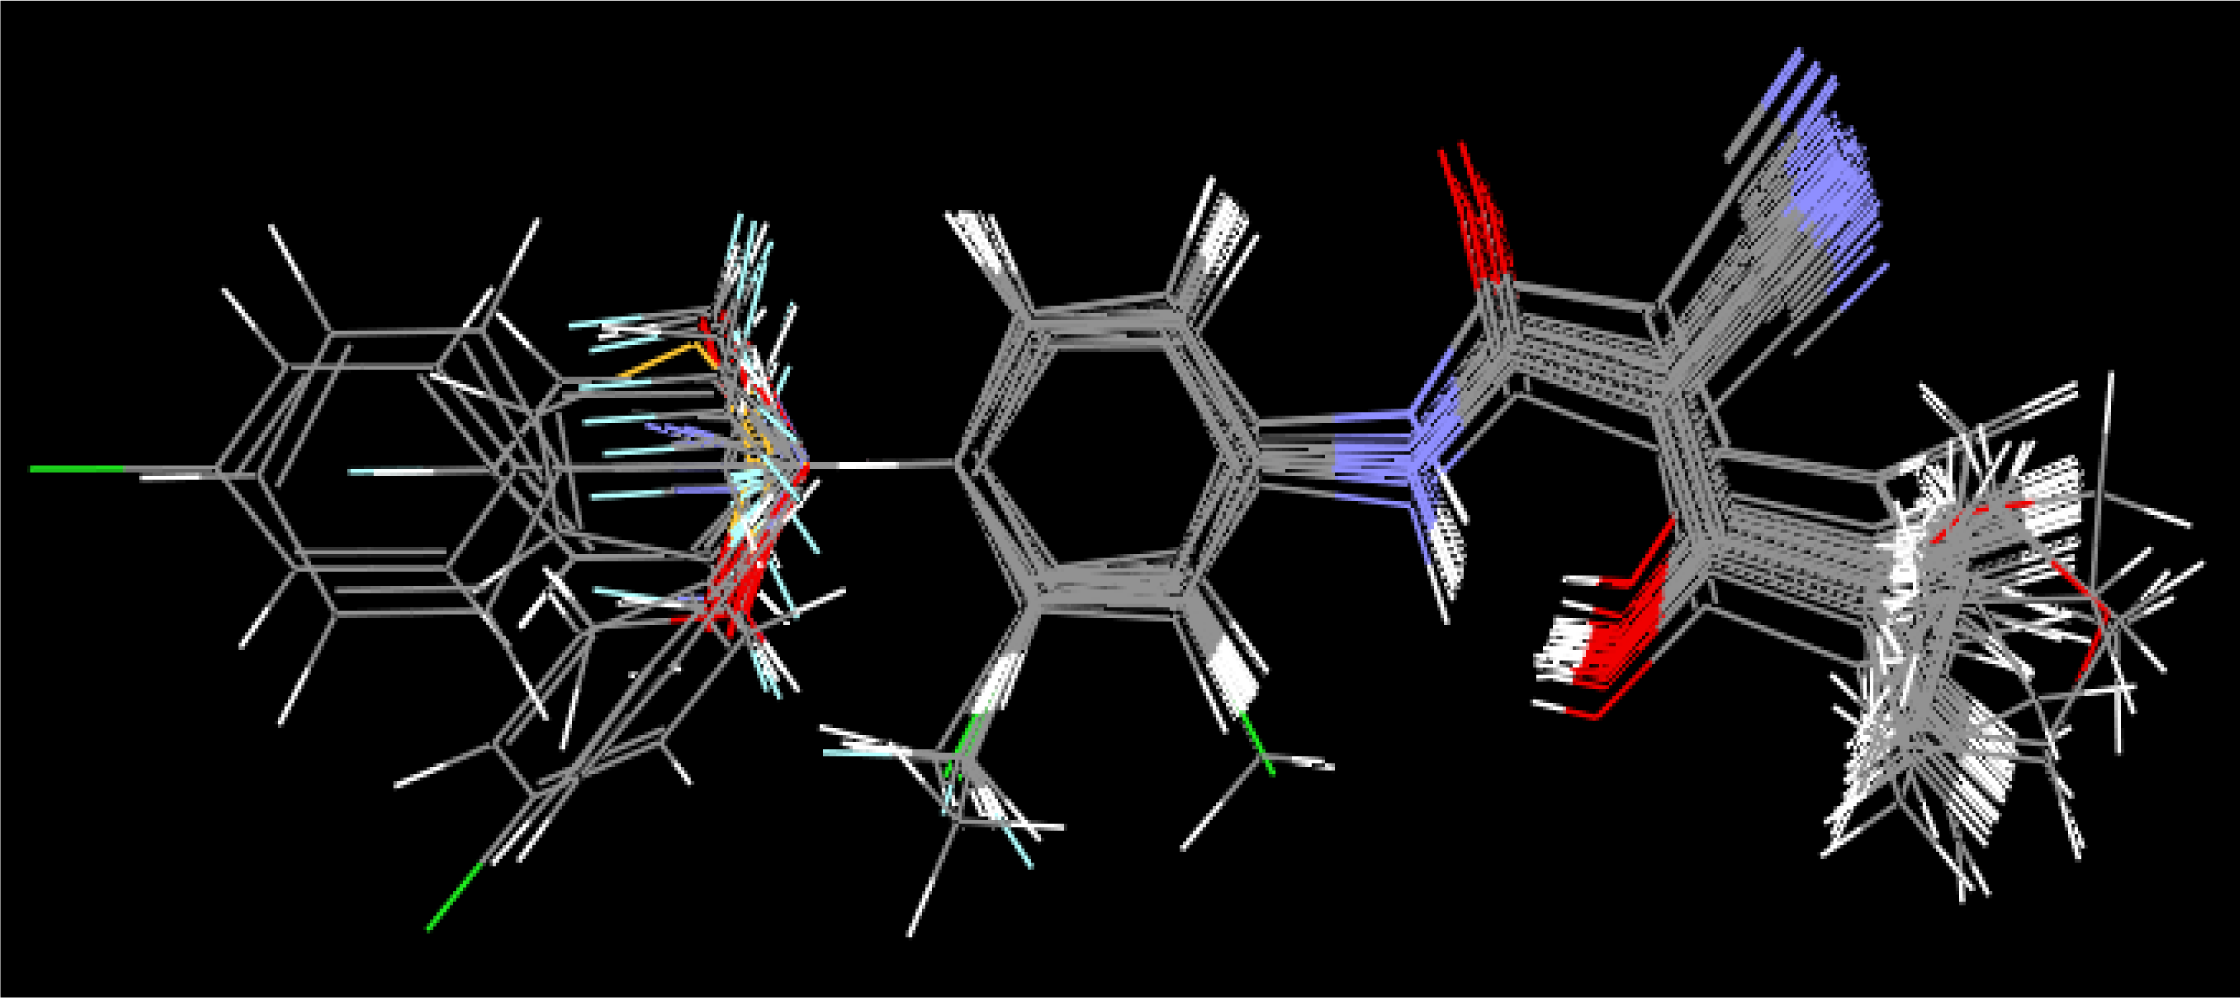
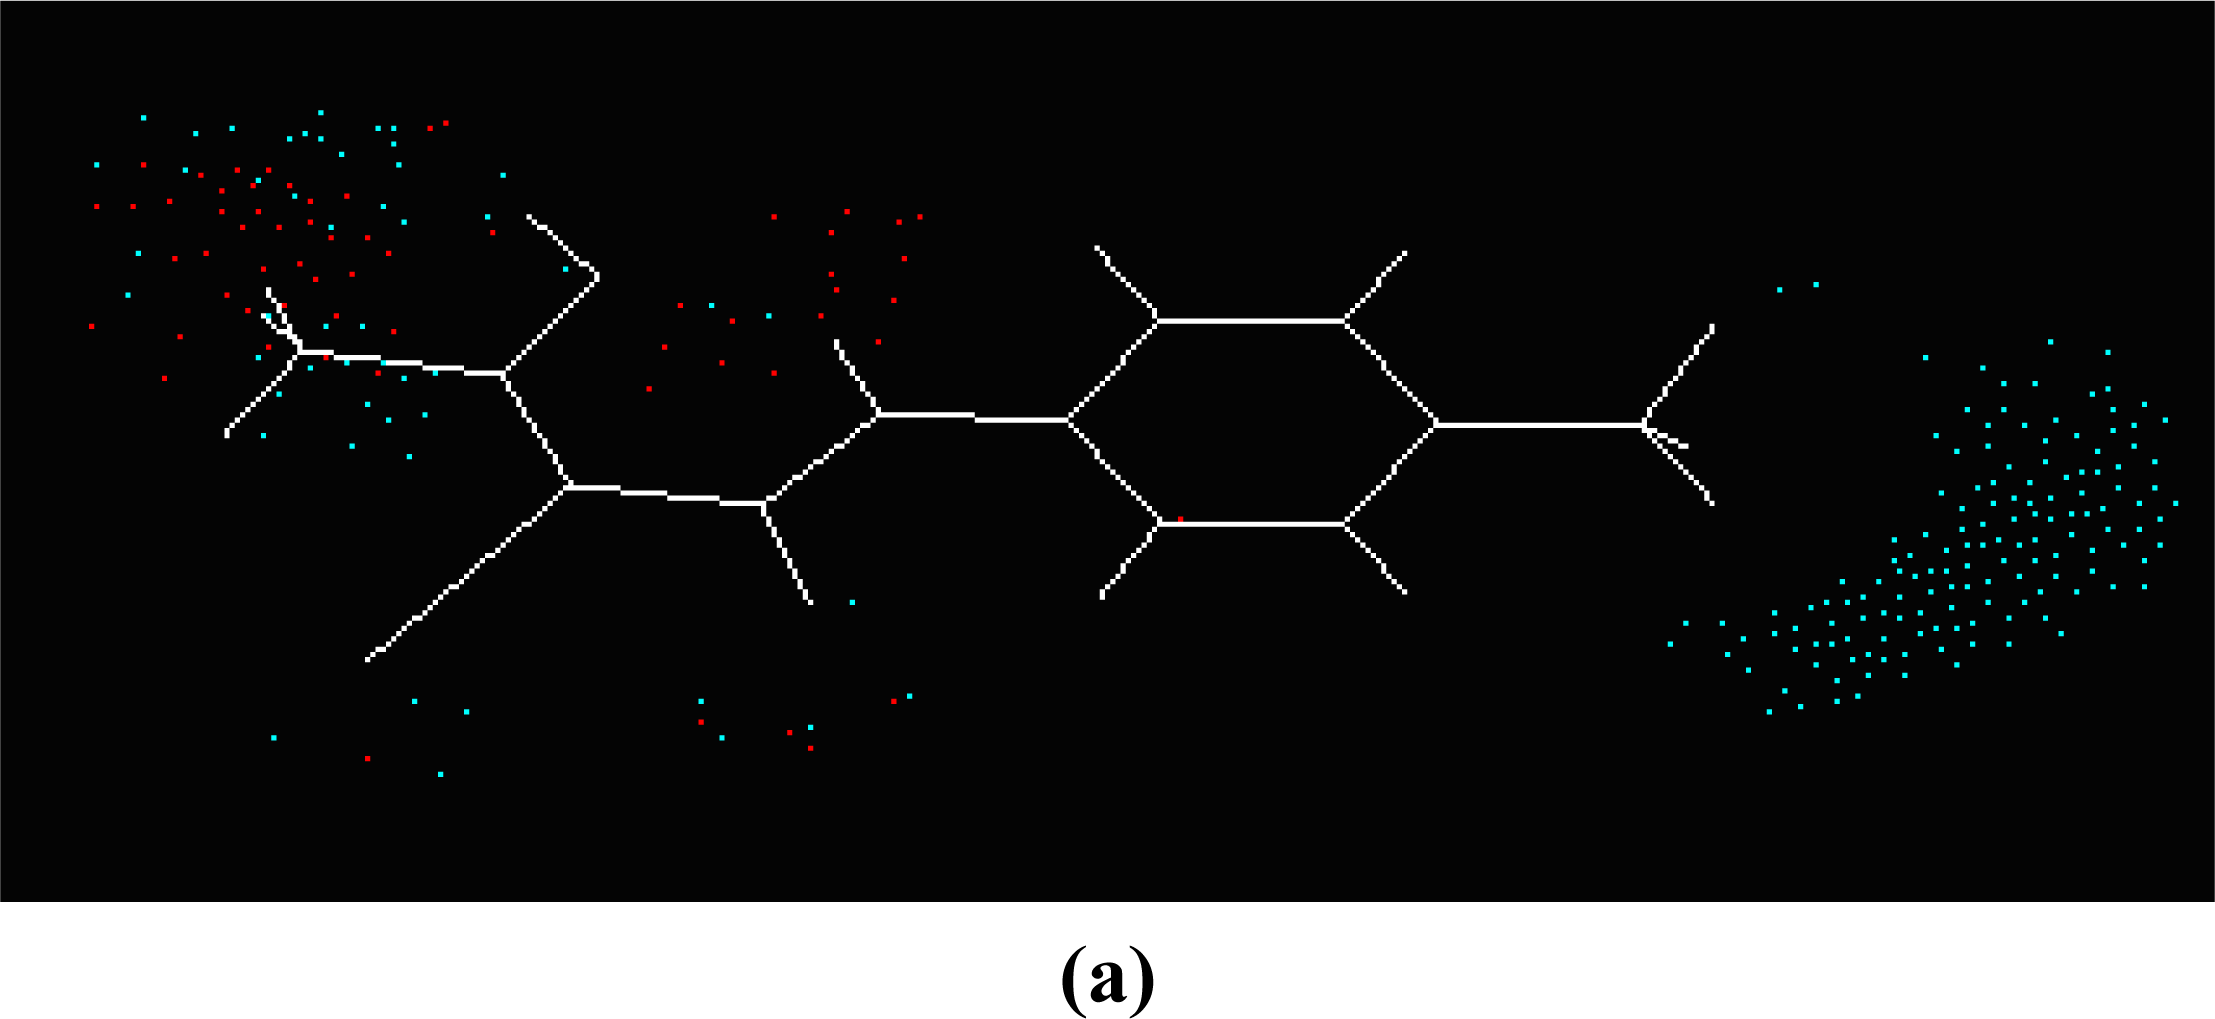
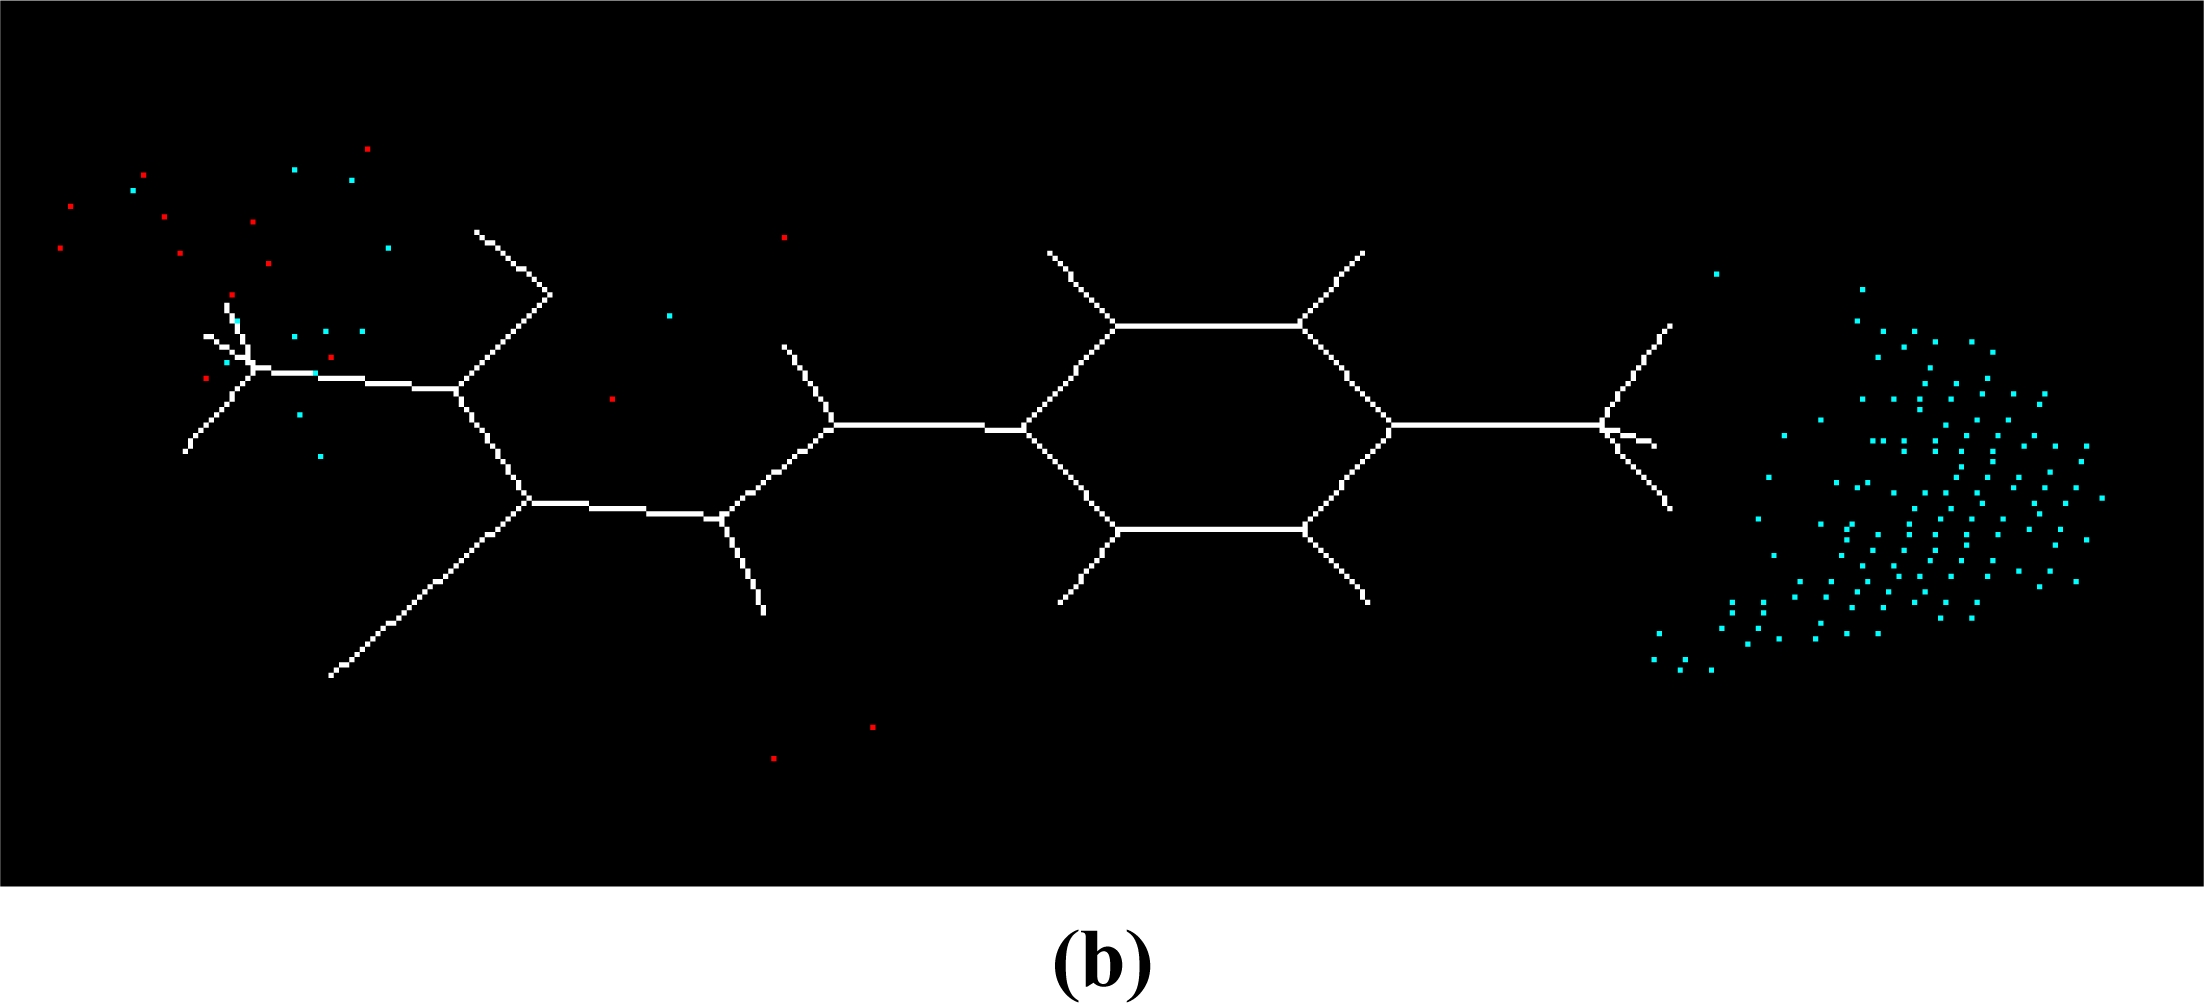
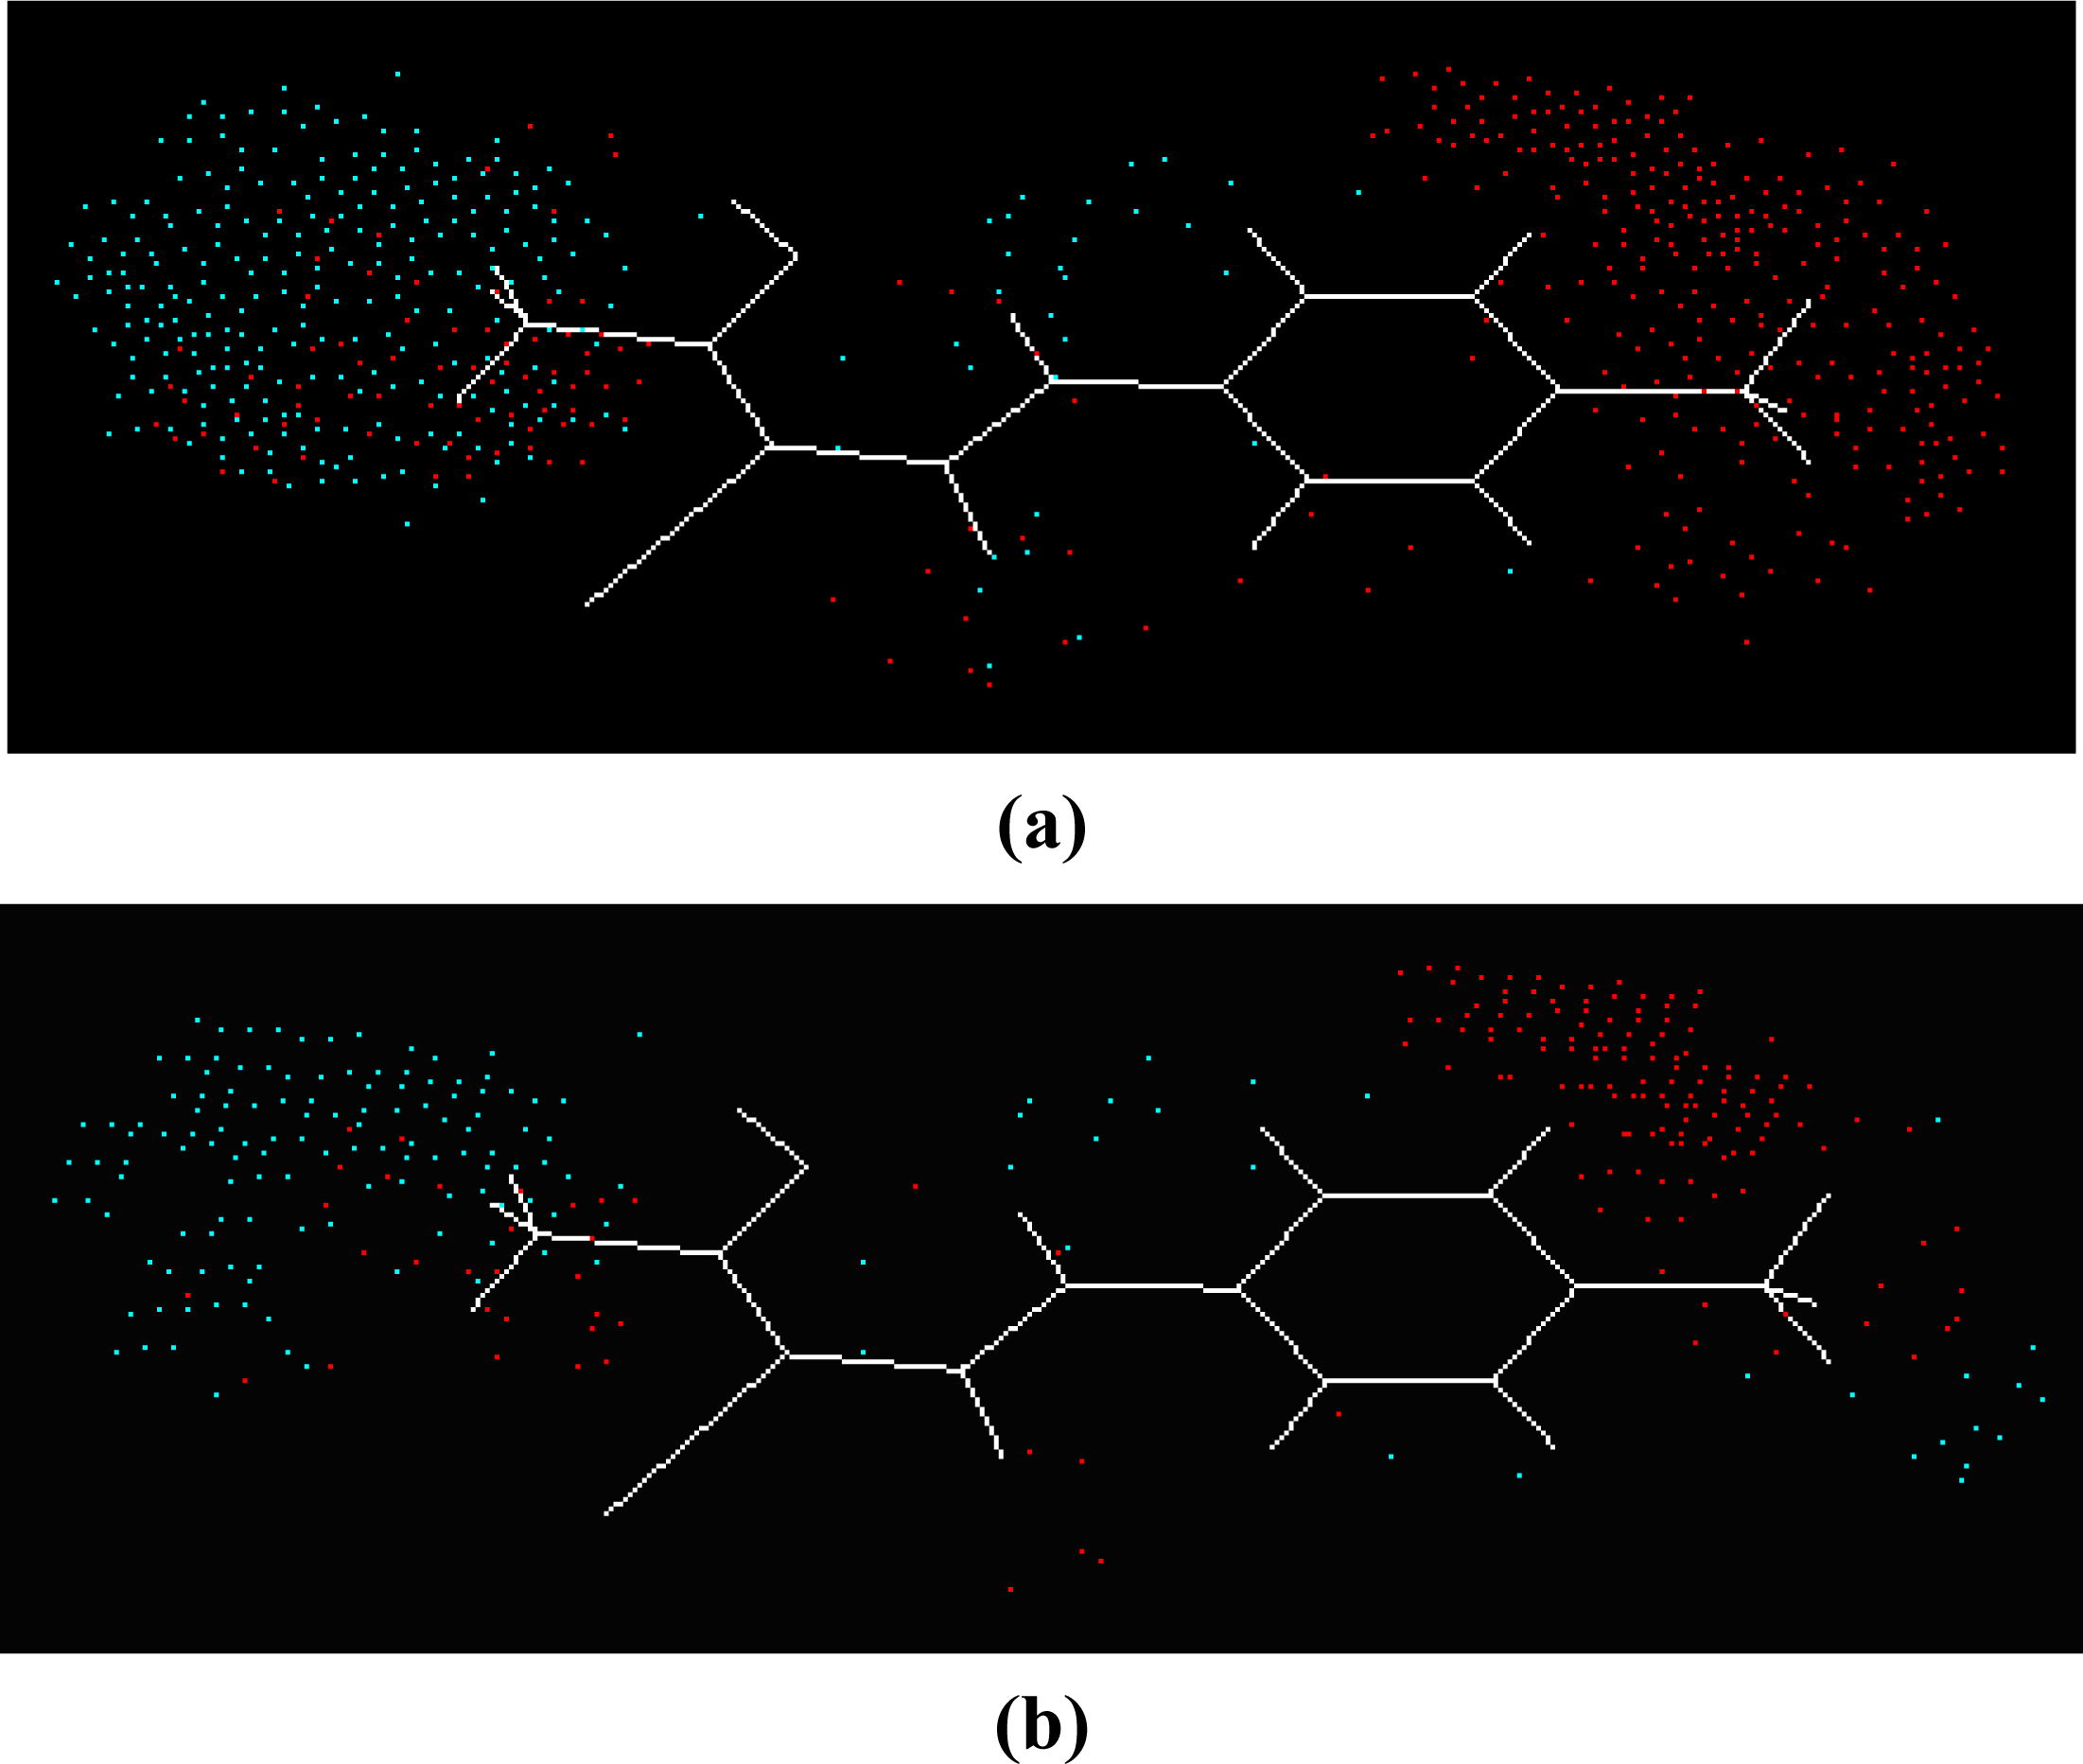
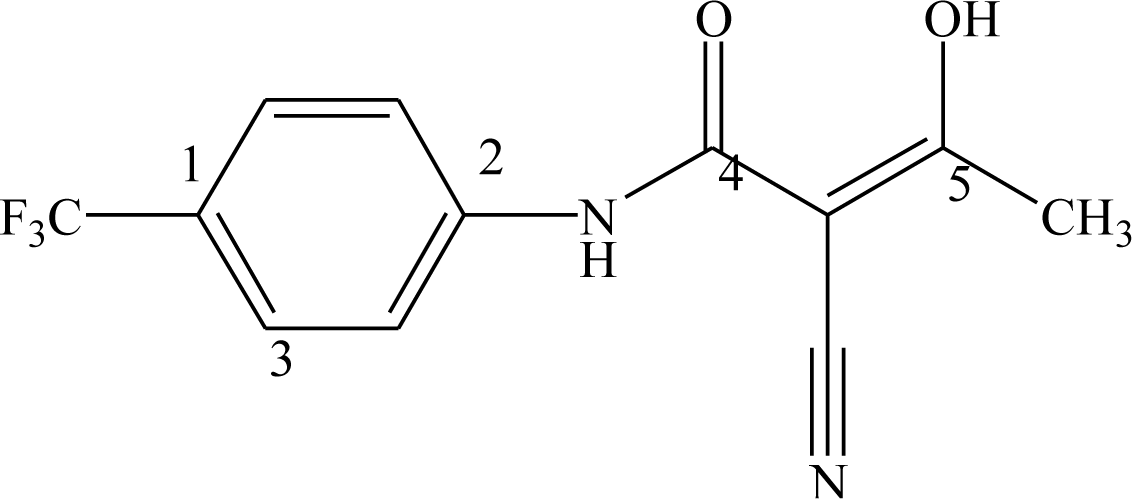
Equation 1. The master grid maps derived from the best model is used to display the contribution of electrostatic potential and shape molecular field. The master grid maps give a direct visual indication of which parts of the compounds differentiate the activities of compounds in the training set under study. The master grid also offers an interpretation as to how to design and synthesize some novel compounds with much higher activities. The visualization of the potential master grid and shape master grid of the best SOMFA model is showed in
Figure 5 and
Figure 6 respectively, with compound 43 as the reference.
Each master grid map is colored in two different colors for favorable and unfavorable effects. In other words, the electrostatic features are red (more positive charge increases activity, or more negative charge decreases activity) and blue (more negative charge increases activity, or more positive charge decreases activity), and the shape feature are red (more steric bulk increases activity) and blue (more steric bulk decreases activity), respectively.
It can be seen from
Figure 5 and
Figure 6 that the electrostatic potential and shape master grid for Rat DHODH are very similar to that for Mouse DHODH. Because Rat DHODH have structural similarities to Mouse DHODH, so active analogues have the same or a similar 3D-QSAR to them.
SOMFA analysis result indicates the electrostatic contribution is of a low importance (c
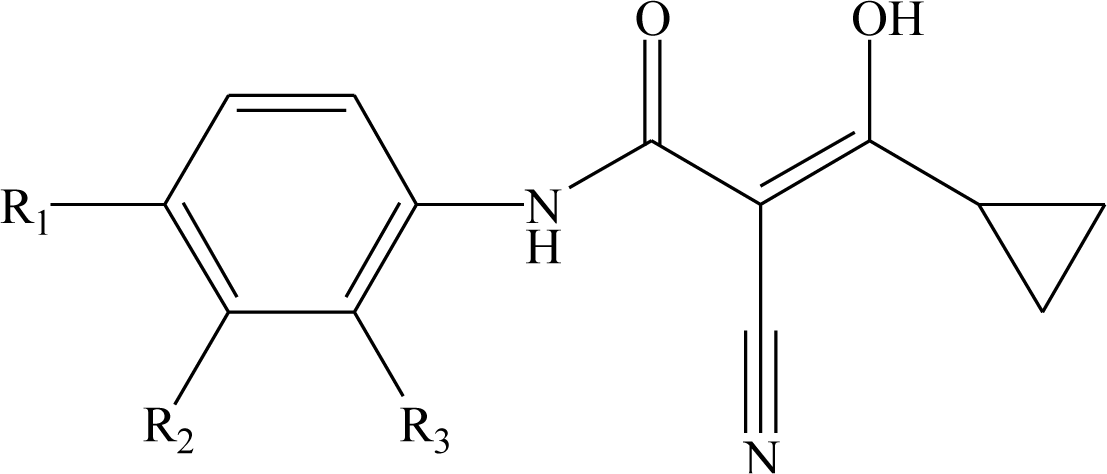
1 = 0.766). In the map of electrostatic potential master grid, we find a high density of blue points around the substituent R
1 at the phenyl ring, which means some electronegative groups are favorable. Meanwhile, the SOMFA shape potential for the analysis is presented as master grid in
Figure 6. In this map of important features, we can find a high density of red points around the substituent R
1 and R
2 at the phenyl ring, which means a favorable steric interaction; simultaneously, we also find a high density of blue points outside substituent R at the 3-substituted side chain, where an unfavorable steric interaction may be expected to enhance activities. Generally, the medium-sized electronegative potential substituent R
1 and R
2 (benzene ring with electron-withdrawing groups, pyridine ring, for example) at the phenyl ring increases the activity, the small-sized substituent R (methyl, ethyl, for example) at the 3-substituted side chain increases the activity.
All analyses of SOMFA models may provide some useful information in the design of new active metabolite analogues of leflunomide.


