Article

Differential Motor Neuron Impairment and Axonal Regeneration in Sporadic and Familiar Amyotrophic Lateral Sclerosis with SOD-1 Mutations: Lessons from Neurophysiology

1
Unit of Neurology, Department of Neuroscience, Pisa University Medical School, Pisa 56126, Italy
2
Department of Neuroscience, Neurology and Clinical Neurophysiology Section, University of Siena, Siena 53100, Italy
3
CNR Neuroscience Institute, Pisa 56124, Italy
4
Department of Neuroscience, SD of Neurology, Cisanello Hospital, Pisa University Medical School, Pisa 56124, Italy
*
Author to whom correspondence should be addressed.
Int. J. Mol. Sci. 2011, 12(12), 9203-9215; https://doi.org/10.3390/ijms12129203
Submission received: 9 October 2011 / Revised: 11 November 2011 / Accepted: 29 November 2011 / Published: 9 December 2011
(This article belongs to the Special Issue Studies of Motor Molecules)

Abstract

:
Amyotrophic Lateral Sclerosis (ALS) is a degenerative disorder of the motor system. About 10% of cases are familial and 20% of these families have point mutations in the Cu/Zn superoxide dismutase 1 (SOD-1) gene. SOD-1 catalyses the superoxide radical (O−2) into hydrogen peroxide and molecular oxygen. The clinical neurophysiology in ALS plays a fundamental role in differential diagnosis between the familial and sporadic forms and in the assessment of its severity and progression. Sixty ALS patients (34 males; 26 females) were enrolled in the study and examined basally (T0) and every 4 months (T1, T2, and T3). Fifteen of these patients are SOD-1 symptomatic mutation carriers (nine males, six females). We used Macro-EMG and Motor Unit Number Estimation (MUNE) in order to evaluate the neuronal loss and the re-innervation process at the onset of disease and during follow-up period. Results and Discussion: SOD-1 mutation carriers have a higher number of motor units at the moment of diagnosis when compared with the sporadic form, despite a more dramatic drop in later stages. Moreover, in familiar SOD-1 ALS there is not a specific time interval in which the axonal regeneration can balance the neuronal damage. Taken together, these results strengthen the idea of a different pathogenetic mechanism at the base of sALS and fALS.

1. Introduction

Amyotrophic Lateral Sclerosis (ALS) is a clinically and genetically heterogeneous, late-onset, neurodegenerative disorder of the motor system [1]. Five to ten percent of cases are familial and about 20% of these families have point mutations in the Cu/Zn superoxide dismutase 1 (SOD-1) gene [2]. The familial form is indistinguishable from the sporadic one with a mean age at clinical onset of 50 years. Mutations in Cu/Zn superoxide dismutase (SOD-1) have stimulated a huge amount of interest. More than 100 missense mutations in SOD-1 have been identified to date [3]. The age of onset of ALS in SOD-1 mutation carriers is variable, beginning from the second decade [4,5]. Superoxide dismutase (SOD-1) is a well characterized enzyme, which exists as a homodimer whose sequence of 153 amino acids is remarkably well conserved across species. However, the pathogenic mechanisms underlying disease’s induction in familiar cases are still largely controversial. The major hypothesis is that familiar ALS, SOD-1 positive, could be caused by a neuronal damage, due to a gradual accumulation of a toxic product SOD-1 derived; this cumulative damage may be due to oxidative stress, leading to a disruption of the cytoskeleton and organelle trafficking within motor neuron dendrites. As the amount increases, a critical threshold may be reached, which overwhelms cellular homeostasis, resulting in fast cell death [6,7]. Aggregates do not exclusively occur in neurons, but also in glial cells, raising the question of whether mutant SOD-1 expression in neurons is sufficient per se to induce pyramidal degeneration and sustain disease evolution over time [810]. Another intriguing explanation is that disulfide cross-linking and the ensuing formation of SOD-1 aggregates represent a secondary event in the pathogenetic cascade, following either a delayed maturation of intramolecular disulfide bonds or the induction of conformational abnormalities [11]. For instance, in G93A mice, about 40% of the motor endplates denervate at 50 days approximately, three months before the appearance of significant SOD-1 aggregation [12], suggesting that neuron-specific expression of mutant superoxide dismutase is sufficient to induce cortico-spinal degeneration [13,14]. The SOD-1 mutation was initially thought to reduce the neurons protection from oxidation, but a weight of evidence now suggests that the mutated enzyme has a toxic gain of function [15]. Although different mutations in SOD-1 have different effects on the progression of the disease once symptoms occur, the different mutations do not influence the age of clinical onset [16]. It has therefore been suggested that there may be a long preclinical period of motor neuron loss before the onset of symptoms [10,17].
In the absence of a biological marker to establish diagnosis, electrodiagnostic tool (EDX) in ALS plays a critical role in the diagnosis as well as in the assessment of its severity and progression [1820]. EMG investigation, usually performed with concentric needle electrodes, represents the gold standard [2123]. Amplitude, duration, area, shape, stability on repeated discharges of Motor Unit Potentials (MUPs), and activity at full effort are parameters conventionally used to evaluate the disease’s stage [19,24]. A particular method to record the full MU potentials is the so-called macro-EMG [25,26]. This technique provides information from a larger area of the muscle than the needle EMG methods. That represents a quantitative neurophysiology technique and can be applied to follow progress and effects of putative therapies [22], or to assess the size of individual motor unit (MU) [27,28]. Among EDX techniques, the methodology of Motor Unit Number Estimation (MUNE) has often been previously employed in assessing loss of surviving MU in ALS [2933]. Compared with previous studies [21,22], our innovatory idea was to take into consideration simultaneously macro-EMG and MUNE changes in both proximal and distal muscles in the same sample of patients with a 1-year follow-up, to assess whether fALS and sALS differ from each other in terms of motor unit loss and changes.

2. Results and Discussion

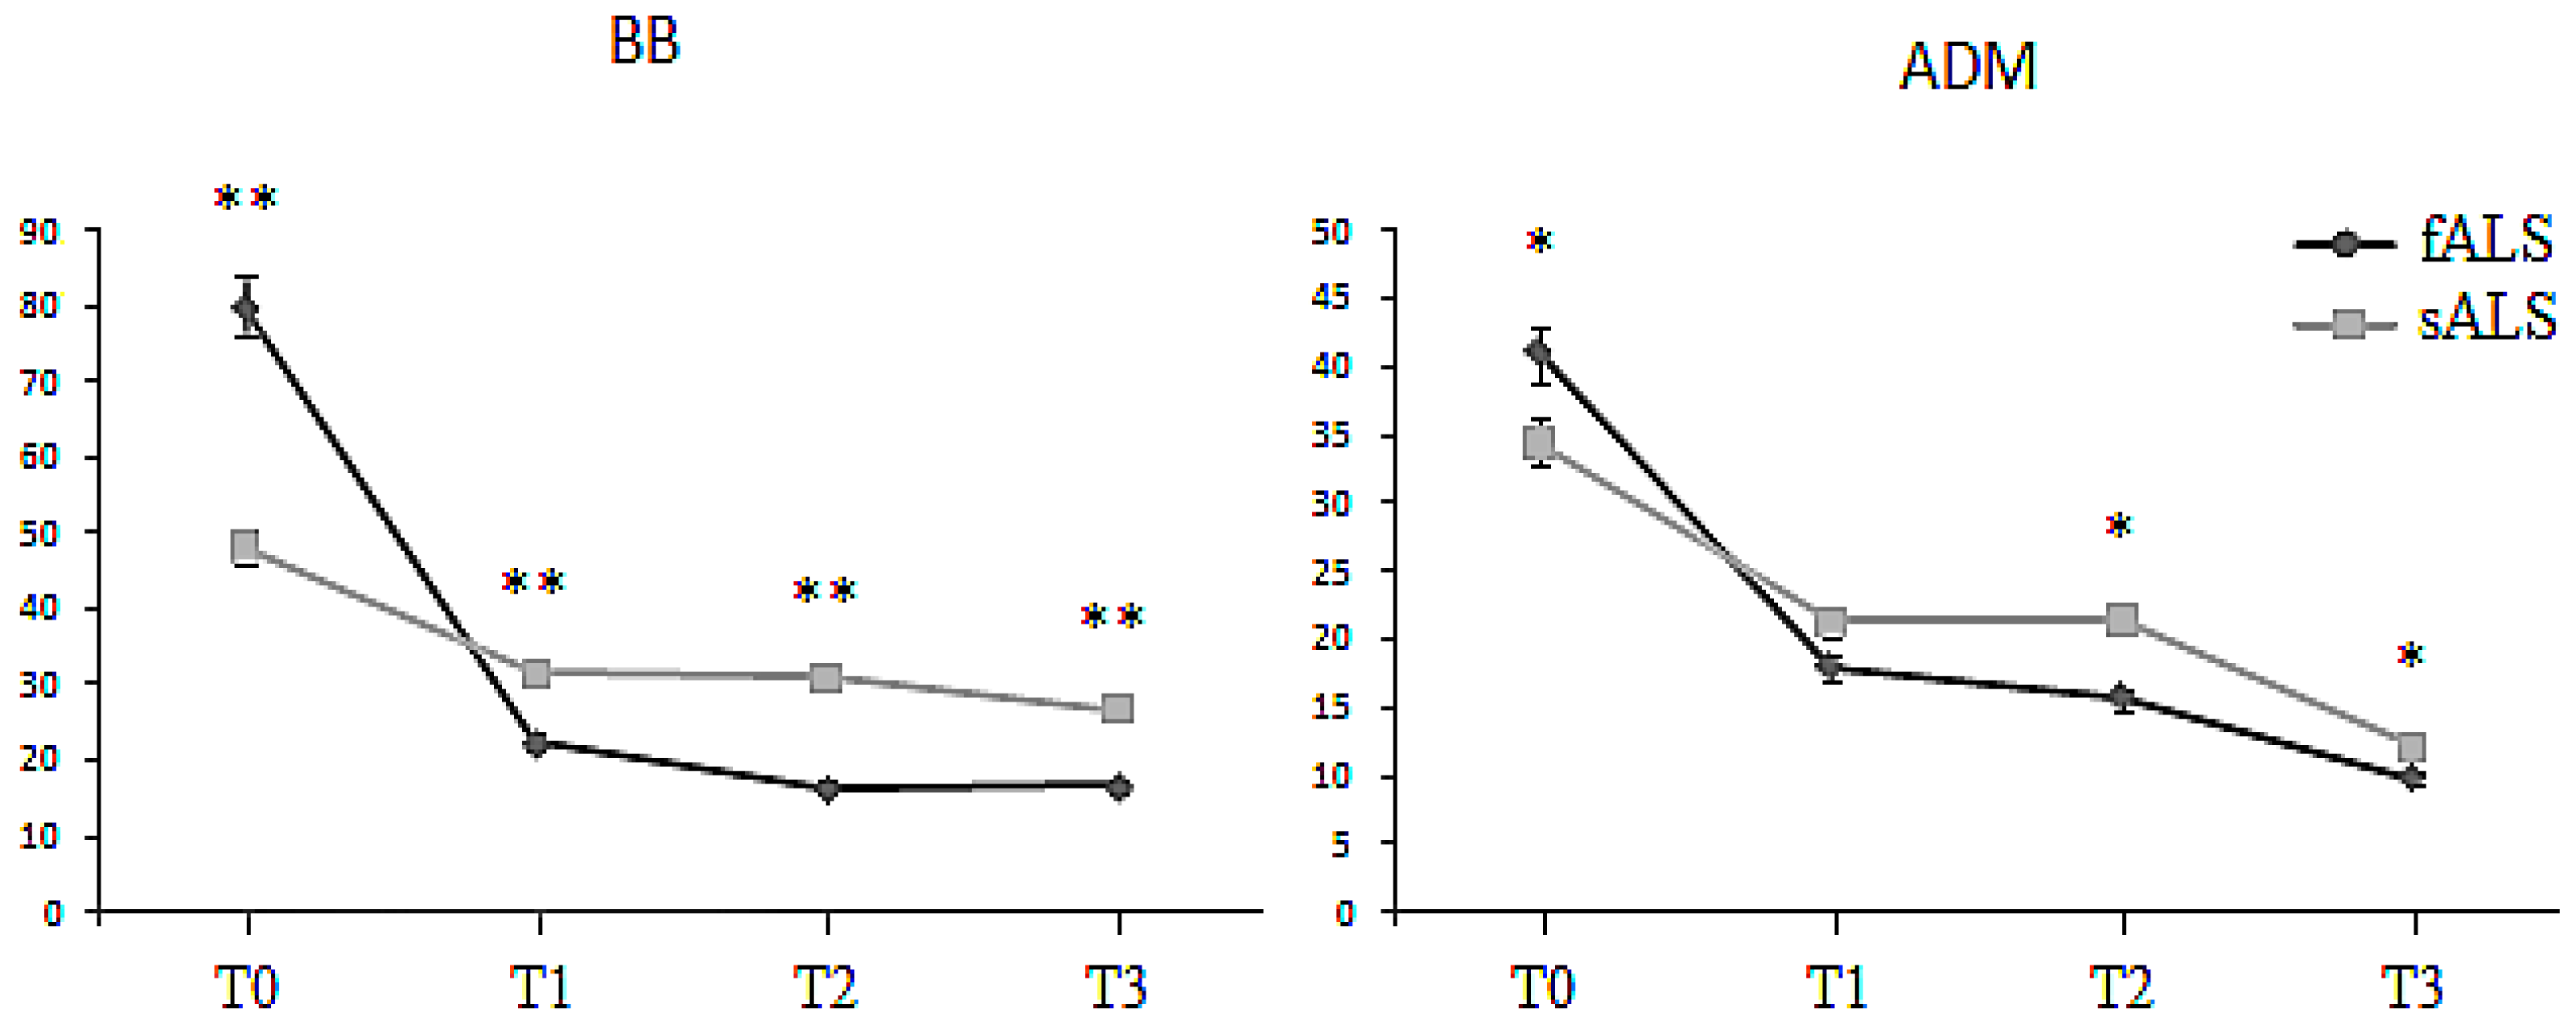
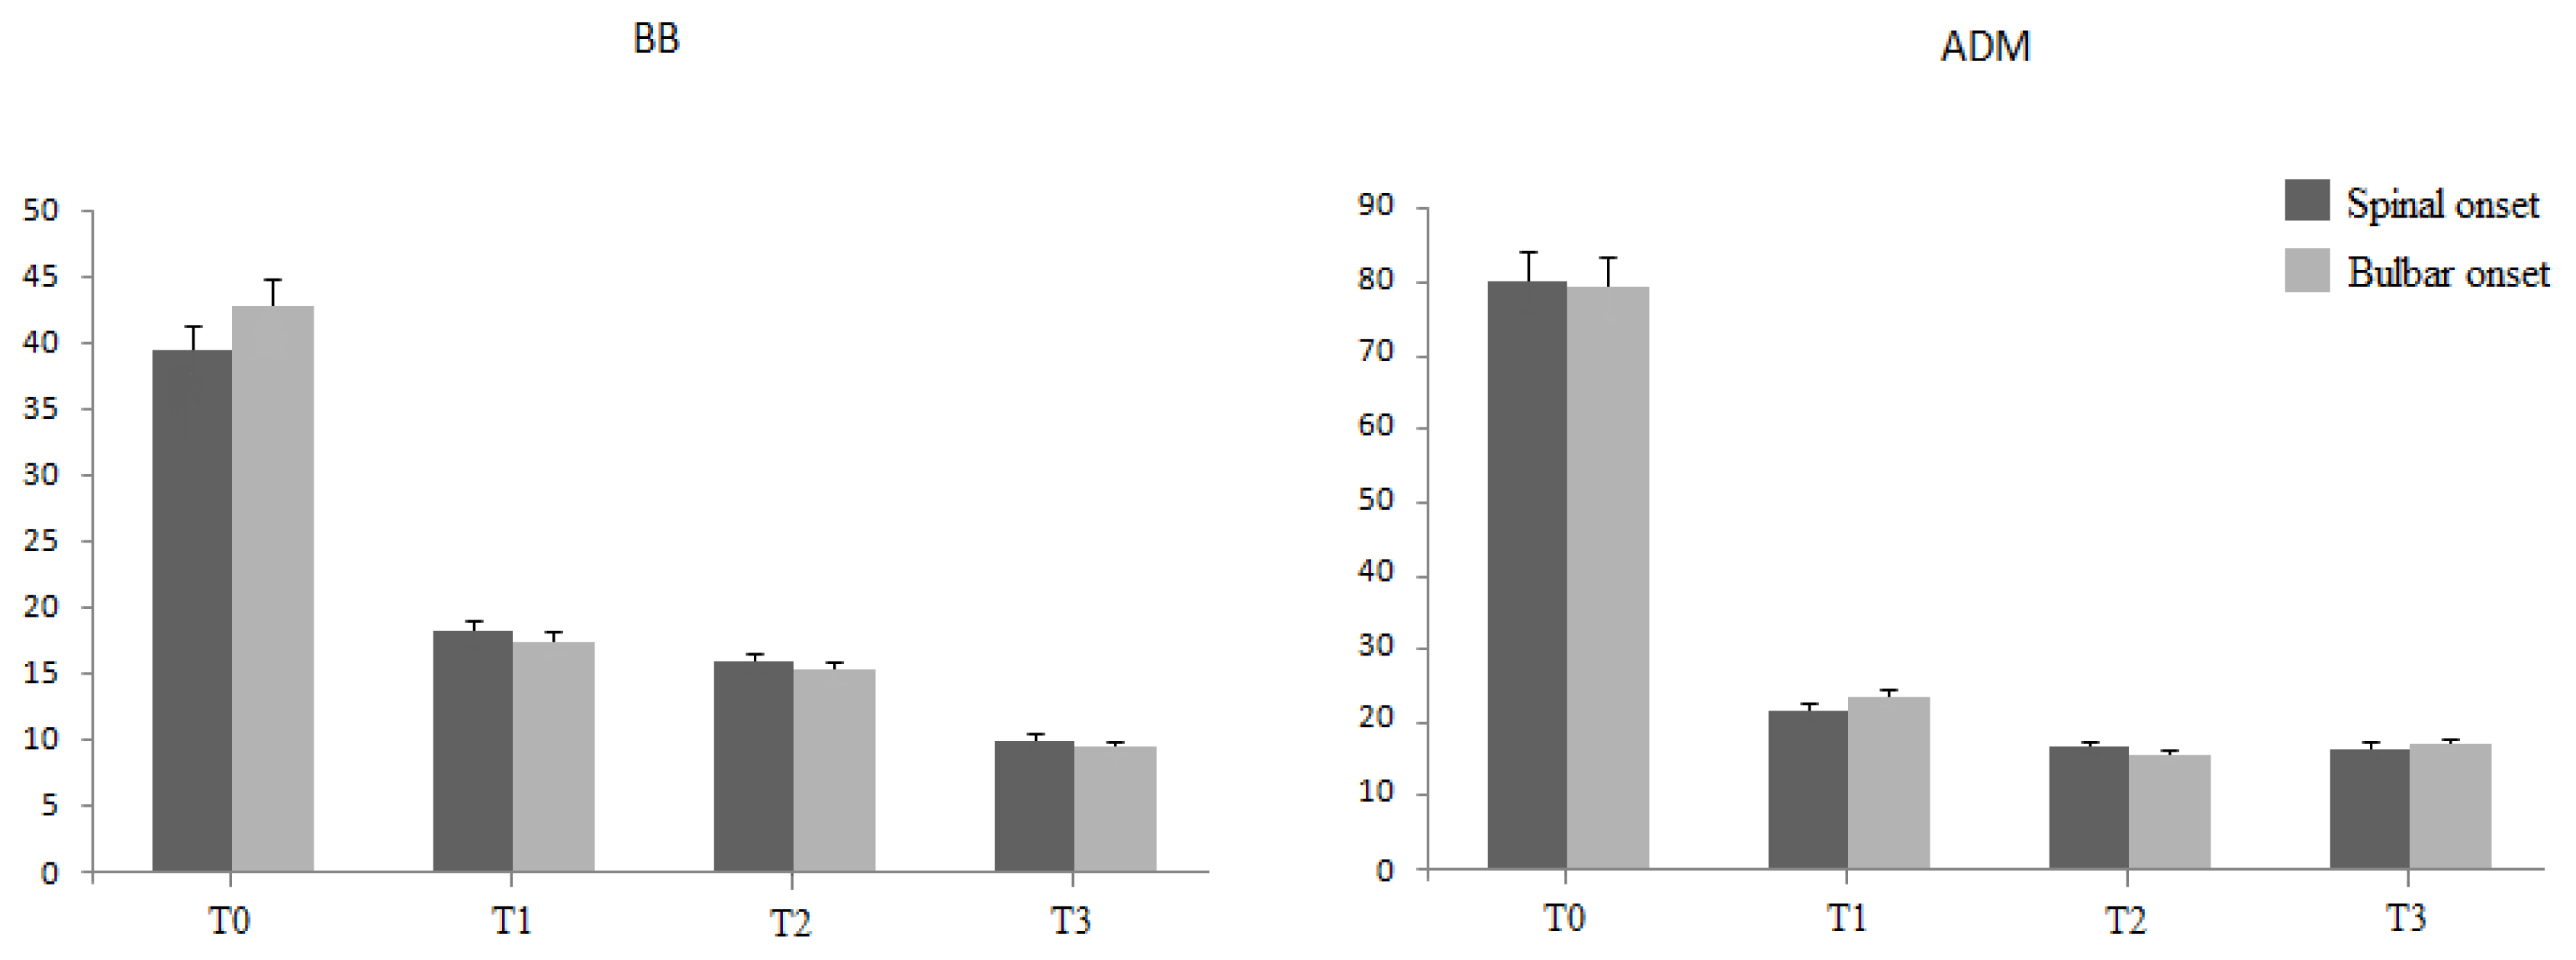
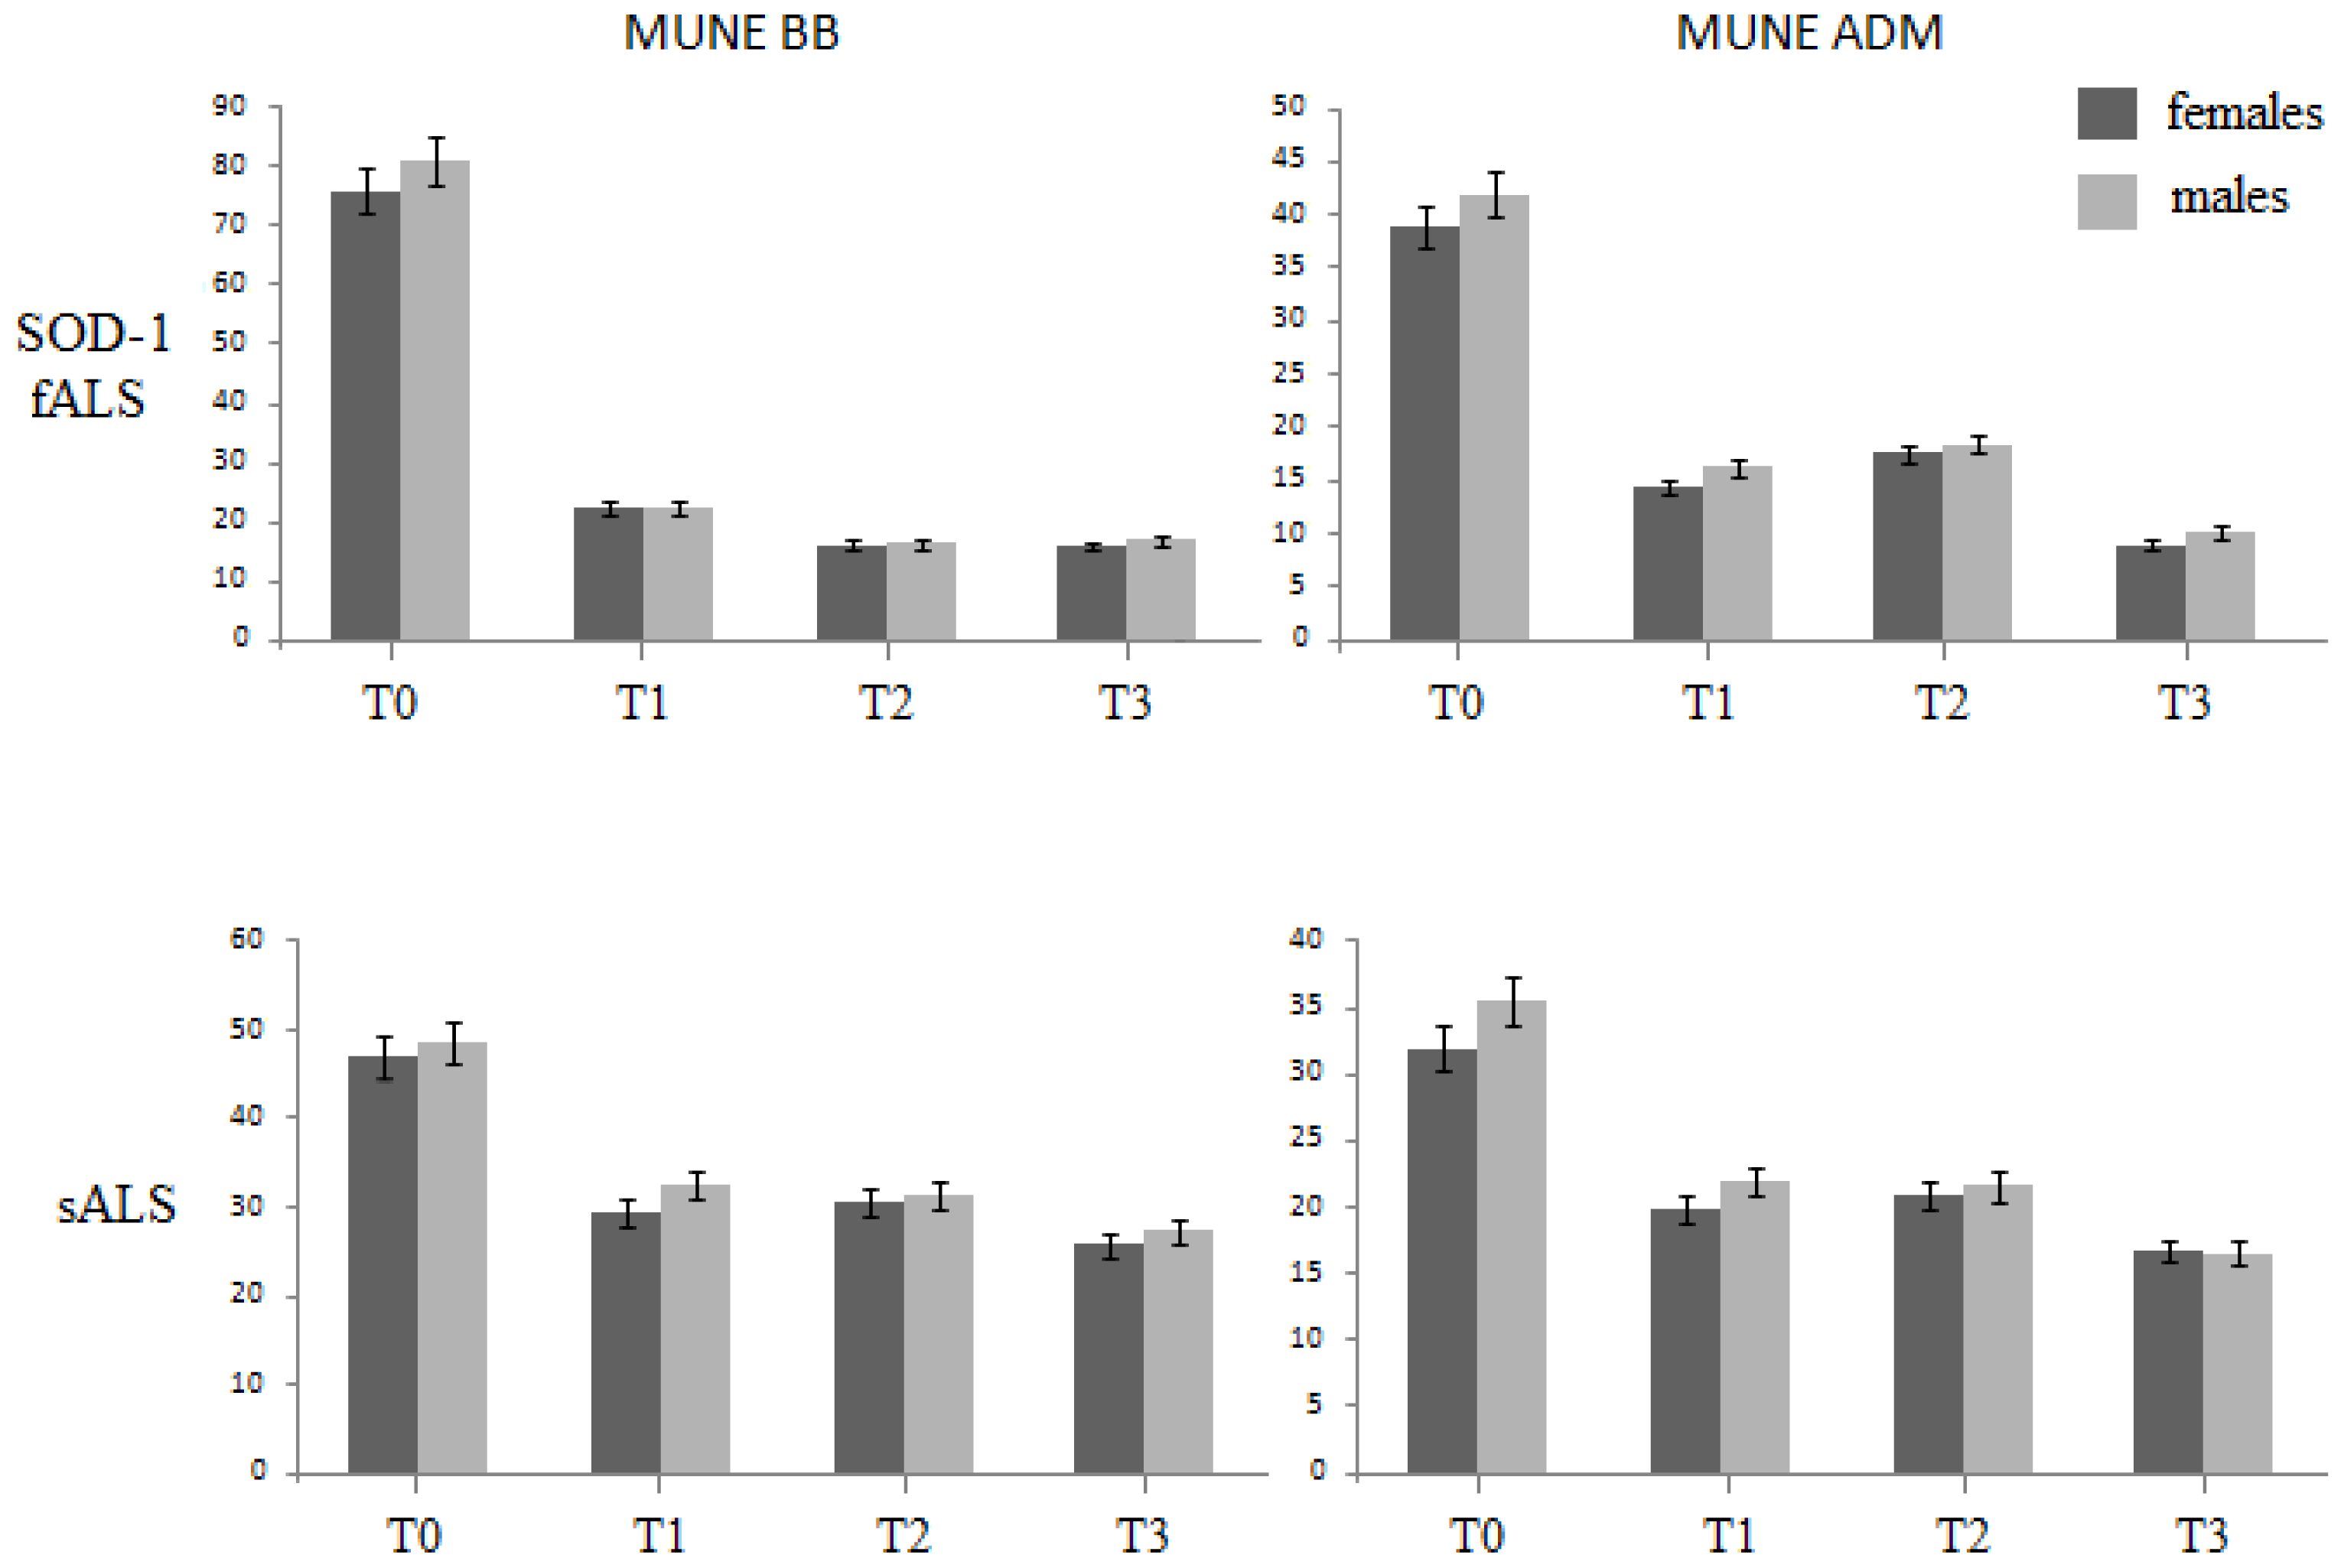
2.1. Motor Unit Number Estimation (MUNE)
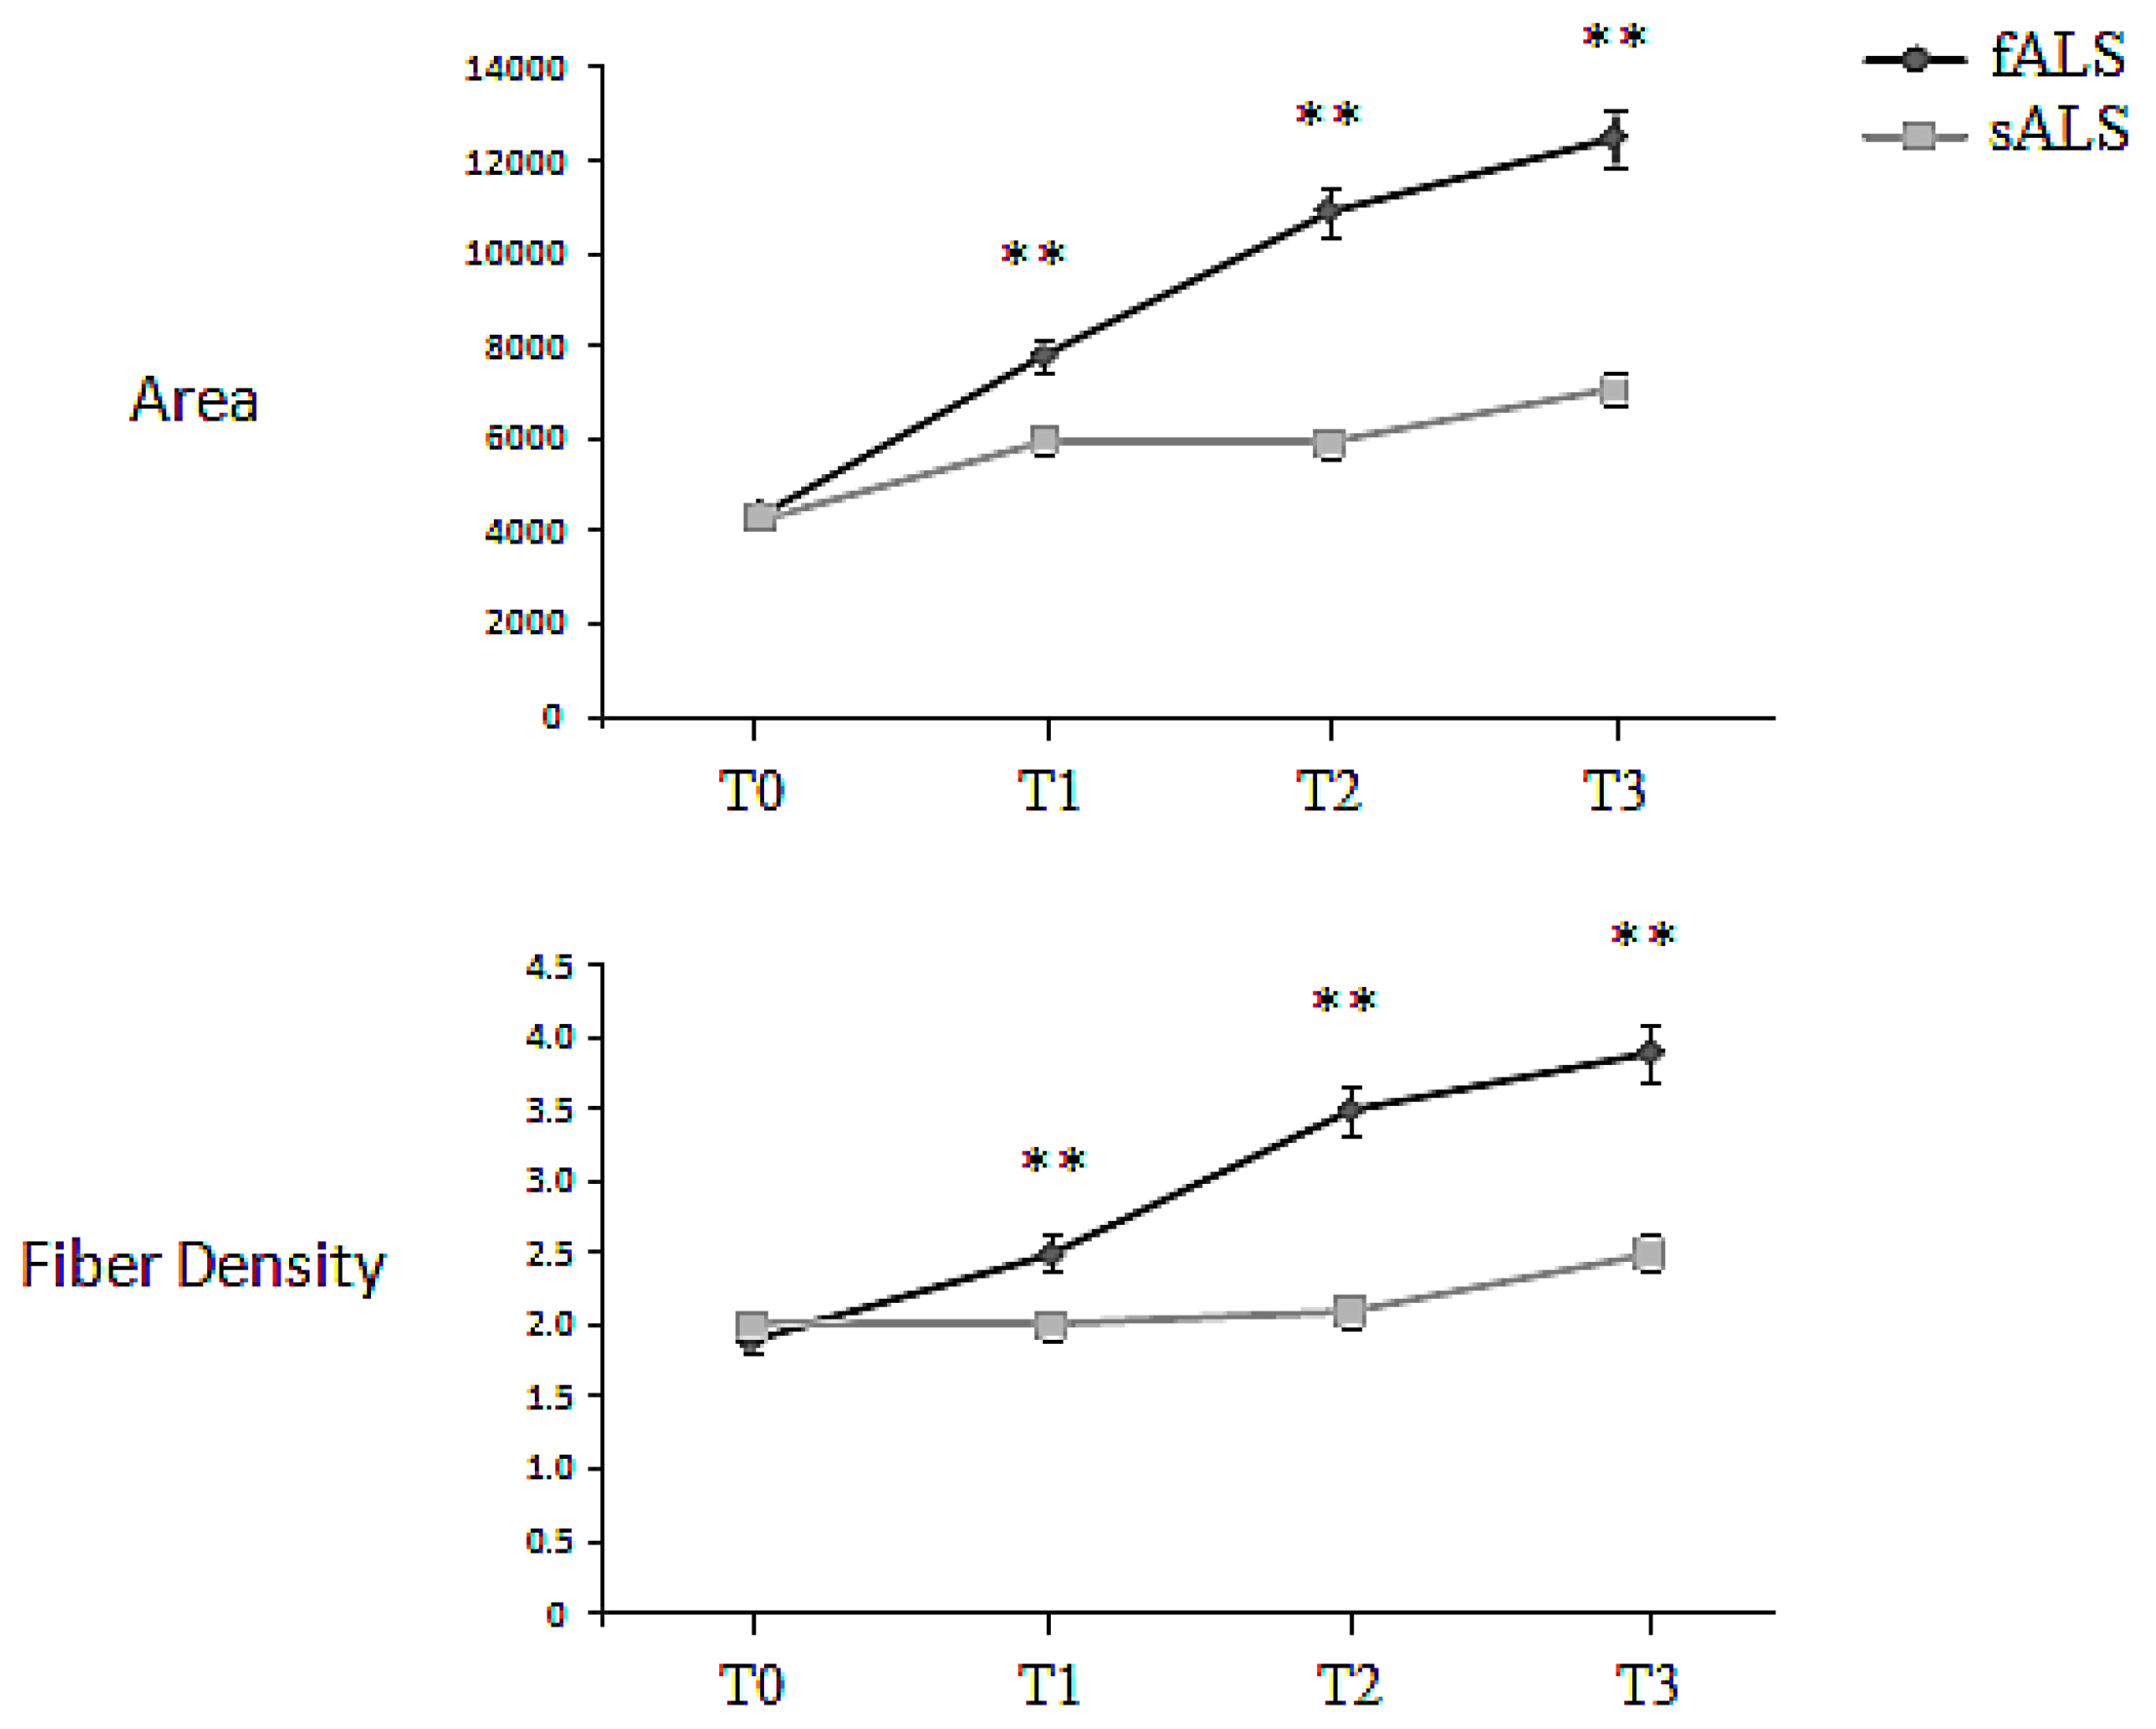
Values of MUNE and Macro-EMG parameters are provided in Table 1.
MUNE values (Figure 1) in ALS patients were below normal limits in 55 (91.7%) and within normal limits in 5 (8.3%) in biceps brachialis (BB) muscle; in 58 (96.7%) and in 2 (3.3%) in abductor digiti minimi (ADM) muscle, respectively [32]. Functioning MUs number progressively decreased in both muscles throughout the entire follow-up period. The Pearson’s correlation coefficient was 0.80, suggesting the rate and amount of MU decrease was approximately similar in both muscles [34]. In ALS, MUNE exhibited a parallel trends in proximal and distal muscles (BB and ADM), independently of disease duration; mean step area, instead, increased more in BB, especially in patients with longer disease duration. The MUNE’s results as concerns patients with fALS, SOD-1 positive, were 80.2 ± 7.8 (T0), 21.8 ± 2.2 (T1), 16.8 ± 1.0 (T2) and 16.5 ± 2.2 (T3) for BB and 42.8 ± 6.6 (T0), 18.4 ± 3.1 (T1), 15.3 ± 2.1 (T2) and 9.0 ± 2.1 (T3) for ADM. Curiously, SOD-1 fALS patients showed a higher number of functioning motor units in the early stage of disease (p < 0.001) and a more dramatic drop in later phases (Figure 1). These results suggest a normal pool of motor units in asymptomatic familiar ALS carriers [35]. No electrodiagnostic difference was found between patients with different SOD-1 point mutations.
Moreover, we did not found any significant difference between spinal and bulbar-onset fALS in terms of surviving MU, for both BB and ADM muscles (p > 0.05, Figure 2), as well as between males and females (p > 0.05, Figure 3).

2.2. Macro-EMG

In sALS patients at T0, both Macro-motor Unit Potentials (Macro-MUPs) area and fiber density (FD) were above upper normal limits (Figure 4; for a global overview of Macro-EMG in healthy subjects, see Sartucci et al. [32,33]): macro-MUP area was 4397.6 ± 255.9 μVms, mean FD 2.0 ± 0.2 (a summary of results is given in Figure 2). The macro EMG MUP area was abnormal in 57 (95.0%) and normal in 3 (5.0%) patients; in SOD-1 carriers baseline values of MUP area and FD matched with those of sALS patients (4378.9 ± 319.6 μVms and 1.9 ± 0.3, for Macro-MUPs area and FD respectively; p = 0.815 and p = 0.147). In sALS, Macro-MUPs area resulted progressively increased at every time, especially at T3, compared with T0 (Figure 4): Area: +45.3% (T1); +49.0% (T2); +83.6% (T3); FD showed a trend to increase up to T3: +3.5% (T1); +15.4% (T2); +22.4% (T3). Interestingly, in SOD-1 carriers there was a much steeper increase at T1, T2 and T3 in respect to sporadic forms, as concerns both Macro-MUPs area and FD values. Macro-MUPs area was 7791.0 ± 953.4, 10922.8 ± 1123.7 and 12499.3 ± 1874.4 (p < 0.01) μVms and mean FD 2.5 ± 0.3, 3.5 ± 0.6 and 3.9 ± 0.5 (p > 0.01). Taken together, these results account both for a more severe involvement of alfa-motorneurons pool and a paradoxical more effective axonal sprouting in fALS compared with sALS.

3. Experimental Section

3.1. Patients and Methods

Family members of known SOD-1 positive families were contacted and informed of this study. In the group of 15 symptomatic SOD-1 mutation carriers, two were found to have a point mutation in exon 4, codon 100, GAA to GGA—Glu100Gly; two were found to have a point mutation in exon 4, codon 113, ATT to ACT—Ile113Thr; five were found to have a point mutation in exon 5, codon 148, GTA to GGA—Val148Gly.; and six with homozygous for aspartate-to alanine mutations in codon 90 (homD90A), representing the most common SOD-1 mutation with a typical recessive fashion inheritance. Sixty ALS patients (34 males: mean age ± SD 60.0 ± 15.5 years, range 20–82; 26 females: mean age ± SD 62.0 ± 9.2 years, range 30–82) were enrolled in the study and examined basally (T0) and every 4 months (T1, T2, and T3). Fifteen of these patients are familial (SOD-1 mutation carriers, 9 males: mean age ± 1 SD 46.3 ± 14.8 years, range 20–68; 6 females: mean age ± 1 SD 49.0 ± 8.5 years; range 30–65). Macro Motor Unit Potentials (macro-MUPs) were derived from Biceps Brachialis (BB) muscle; MUNE was performed both in BB and Abductor Digiti Minimi (ADM) muscles of the same side. Thirty-three healthy volunteers (13 females and 20 males, mean age: 57.7 ± 13.8 years, range 28–77 years) served as controls. All patients had probable or definite ALS, according to the criteria of the World Federation of Neurology [19]. The sample group of patients included cases with a disease duration from clinical onset of symptoms to the time of the first examination less than 48 months (mean ± SD: 12.2 ± 11.0 months); only few cases had disease duration less than this limit (11 patients; about 14.3%). Twenty-two patients presented a bulbar onset and the remaining a spinal one. Regarding symptoms and signs, in carriers SOD-1 mutation, 10 patients have the spinal type, while only 5 patients have the bulbar type. Although different mutations in SOD-1 have different effects on the progression of the disease once symptoms occur, the different mutations do not influence the age of onset of symptoms. Forty patients were treated with riluzole (Rilutek®, 50 mg) at a mean daily dosage of 100 mg (50 mg BID) throughout the entire period of EDX follow-up. Both patients and controls gave their written informed consent prior to participation in the study that had been approved by the local Ethic Committee and followed the tenets of Helsinki.

3.2. Macro-EMG

Standard macro-EMG method was applied [28]. We employed a recording electrode, consisting of a modified single fibre EMG (SFEMG) electrode with the cannula Teflon insulated except for the distal 15 mm. The SFEMG recording surface was exposed 7.5 mm from the tip and the recording was made using two channels: the first one in whom the SFEMG activity was displayed (using the cannula as reference) and used to identify the MU and trigger the averaging procedure (band-pass filter for this channel: 500–10 KHz); fiber density (FD) of the triggering single fibre electrode was recorded. The second channel averaged the activity from the cannula until a smooth baseline and a constant macro MUP was obtained (Filter pass-band: 5–10 KHz).
We measured from the averaged signal the total area between the curve and the baseline, the maximal peak-to-peak amplitude (macro-MUP) during the total sweep time of 70 ms [36]. Results were expressed as individual area values from at least 20 recordings. The relative macro amplitude was expressed as the obtained mean value [28]. Fibre density was expressed as number of time locked spikes obtained on the SFEMG channel [37].
In 29 patients (subgroup 1, SG1: 19 males and 10 females; mean age ± 1 SD: 60.0 ± 11.8 years; range 30–78 years; spinal/bulbar onset: 22/7; mean disease duration 29.7 months) macro EMG was repeated after 4 months (T1). Among the second subgroup, 11 patients (subgroup 2, SG2: 8 males and 3 females; mean age ± SD: 57.0 ± 12.8 years; range 30–72 years; spinal/bulbar onset: 10/1; mean disease duration 31 months) were re-tested after 8 months (T2) and in 8 (Subgroup 3, SGP3; 7 males and 1 female; mean age ± SD: 58.0 ± 13.6 years; range 31–82 years; spinal/bulbar onset: 7/1; mean disease duration 37 months) after 12 months from the first examination.

3.3. Motor Unit Number Estimation (MUNE)

MUNE technique was performed on the same Keypoint® EMG equipment (Medtronic Dantec, Copenhagen, Denmark) provided with specific software (version 3009) for data acquisition and processing at same time and immediately after macro EMG on the same test session [38]. The used technique relayed on manual incremental stimulation of the motor nerve, known as the McComas technique [37], modified by Ballantyne and later implemented by Stålberg. The following test settings were used: sweep duration 50 ms, gain 2 mV/Div for M wave, 0.5 mV/Div for each step; filters 20–10 KHz [38]. The use of specific software for MUNE detects “alternation”, eliminates subjectivity and the sampling of artifactually small motor units in ALS patients [39,40]; ten incremental steps were recorded [32].
Percutaneous stimuli were delivered over musculocutaneous nerve immediately below axilla, recording from BB muscles, and ulnar nerve at the wrist by recording from the ADM muscle of the same upper limb [32]. Signals were detected with common surface electrodes, Ag/AgCl type, tapered on the cutis over target muscles with a common muscle-belly tendon montage. In those patients who underwent follow-up after 4, 8 and 12 months, each test was performed exactly on the same side with the same electrode position (spatial coordinates have been annotated in patients schedule).
At least two consecutive MUNE measures were performed on each patient to verify the consistency of our results; when required, further estimations were made until the MUNE was clearly stable. The mean of the two or more tests was calculated [41]. The results showed an excellent reproducibility with test-retest correlation coefficients ranging from 0.75 to 0.86 [32].

3.4. Statistical Analysis

Statistics were calculated using a STATISTICA-8® software package [42]. Data were analyzed using a one way ANOVA to compare each other FD and area mean values at different times; a two-way repeated measures ANOVA was performed to assess differences in terms of both FD and area between controls and patients. To isolate which group(s) differ from the others we applied a multiple comparison procedure (Holm-Sidak method). The size of surviving MUs in both biceps brachialis and ADM muscles, expressed as Macro EMG MUP area and peak to peak amplitude, was then compared using the Spearman’s coefficient.

4. Conclusions

The main purpose of our study was to assess the extent of MU loss and the changes in the innervation/denervation pattern in fALS compared with sALS patients.
We applied both macro-EMG and MUNE to the BB muscle, and only MUNE to ADM [27]. MUNE is an ideal tool for the assessment of disease in which primary defect is MU loss [29,43]. The reinnervation process is strictly connected with lower motor neuron loss; quantization of MU loss and the simultaneously collateral dynamic re-innervation may be assessed by both MUNE and macro-EMG at every time of disease evolution [30]. The macro-EMG gives a global view of the motor unit. Macro-MUP area and FD were beyond upper normal limits, as expected, in ALS [36,44]. Our results indicate that carriers of SOD-1 mutations have a higher number of motor units at moment of diagnosis when compared with sporadic cases. On the other hand, in sALS the macro-EMG parameters progressively increased, displaying a gradual increment of correlation up to 8 months, suggesting that the process of MU rearrangement begins to fall after 8 months of disease course. In familiar SOD-1 form there is not a specific time interval in which the axonal regeneration and the collateral sprouting can balance the neuronal damage. Paradoxically, despite faster loss of motor units, in fALS we have undisclosed a more effective axonal sprouting in the few surviving motor fibers. Compared with sporadic forms, in SOD-1 fALS the substantial lack of a fleeting stabilization of motor unit number within eight months from clinical onset, as emerged from MUNE, could indicate that damage of cell types different from motor neurons is a critical factor to the progression of corticospinal degeneration [45,46]. Our results strengthen the idea that accelerated disease progression does not alter the timing of disease onset. These data are consistent with those reported by Yamanaka and colleagues [46]: using chimeras derived from embryonic cells of SOD-1G37R mice, they postulated that multiple cell types drive non-cell-autonomous onset of motor degeneration. That could also explain the wide variability in terms of age of onset, clinical presentation and rate of progression in familiar forms of ALS. As to the identity of the cell types beyond motor neurons, potential contributors might include Schwann cells and the endothelial cells of the vasculature. MRI studies have underlined a relative sparing of both cortical and white matter structures in fALS, making unlikely a Wallerian axonal degeneration following primary neuronal injury. This is in line with previous papers showing a differential pyramidal tract degeneration in homozygous SOD-1D90A ALS and sALS [4749]; e.g., Blain and colleagues have recently reported a marked reduction in fractional anisotropy in the corticospinal tract in patients with sALS and fALS, despite similar levels of upper motor neurons dysfunction and overall clinical disability [47]. Amyotrophic Lateral Sclerosis is featured by repetitive cycles of denervation/reinnervation and the mechanism lead to a variation in FD within a given motor unit [22,50]. SOD-1 carriers had a full complement of motor neurons during the asymptomatic phase, indicating that SOD-1 mutation carriers have normal survival of motor neurons until sudden catastrophic cell death occurs. This significant gradual preclinical loss does not occur in SOD-1 mutation carriers. Despite the small sample of fALS patients, we also tried to detect significant differences in motor unit pool between spinal and bulbar forms, for both BB and ADM muscles. Interestingly, we did not found any difference, suggesting the rate and amount of motor unit decrease is approximately similar in proximal and distal muscles. That could confirm the non length-dependent and all-or-none nature of pathological processes underlying progression of fALS. A possible explanation could be based on an epigenetics approach: it has been proposed that epigenetic silencing of genes vital for motor neuron function could underlie ALS [51,52]. The promoter of genes thought to be implicated in sALS, SOD-1 and VEGF, or that of MT-Ia and MT-II (the most common human isoforms of the metallothionein (MT) family of proteins), has been found with inappropriate methylation levels [53]. There is an increasing interest in this field. Despite this, no conclusive remark has been collected in human models so far. This is likely due to the discrepancy between humans patients and animal models, in terms of disease and pre-symptomatic phase duration, absence of sensitive biological markers and different pathogenesis. Our findings agree with those described by Aggarwal both in symptomatic and asymptomatic SOD-1 mutation carriers: symptomatic fALS could represent an all-or none process and it is not the final result of a slow attrition of motor neurons.
Another interesting finding is about the lack of significant differences in motor unit depletion over time between females and males in SOD-1 type, both in spinal and bulbar form: the antioxidant effects of estrogens and their proved role in preventing glutamate related toxicity in vitro [54,55] could not delay both the early retraction of nerve terminals from neuromuscular end-plates and the dying-back of axons during asymptomatic phase in vivo, as well as the denervation/reinnervation process at later stages. To an extent, taken together, these results strengthen the idea of a different pathogenetic mechanism at the base of sALS and fALS. Further studies are needed to solve the dilemma, especially in familiar forms different from those related to mutations pertaining to Cu, Zn superoxide dismutase gene.

Acknowledgements

We gratefully acknowledge the participation of all subjects, as well as C. Orsini for his excellent technical assistance. The paper was supported in part by the Italian operating and development MIUR PRIN grant year 2006, 2006062332_002.

References

  1. Juergens, S.M.; Kurland, L.T.; Okazaki, H.; Mulder, D.W. ALS in rochester, minnesota, 1925–1977. Neurology 1980, 30, 463–470. [Google Scholar]
  2. Rosen, D.R.; Siddique, T.; Patterson, D.; Figlewicz, D.A.; Sapp, P.; Hentati, A.; Donaldson, D.; Goto, J.; O’Regan, J.P.; Deng, H.X.; et al. Mutations in Cu/Zn superoxide dismutase gene are associated with familial amyotrophic lateral sclerosis. Nature 1993, 362, 59–62. [Google Scholar]
  3. Amyotrophic Lateral Sclerosis Online Genetics Database. http://alsod.iop.kcl.ac.uk/ accessed on 8 October 2011.
  4. de Belleroche, J.; Orrell, R.; King, A. Familial amyotrophic lateral sclerosis/motor neuron disease (FALS): A review of current developments. J. Med. Genet 1995, 32, 841–847. [Google Scholar]
  5. Aggarwal, A.; Nicholson, G. Detection of preclinical motor neuron loss in sod1 mutation carriers using motor unit number estimation. J. Neurol. Neurosurg. Psychiatry 2002, 73, 199–201. [Google Scholar]
  6. Clarke, G.; Lumsden, C.J.; McInnes, R.R. Inherited neurodegenerative diseases: The one-hit model of neurodegeneration. Hum. Mol. Genet 2001, 10, 2269–2275. [Google Scholar]
  7. Johnston, J.A.; Dalton, M.J.; Gurney, M.E.; Kopito, R.R. Formation of high molecular weight complexes of mutant Cu, Zn-superoxide dismutase in a mouse model for familial amyotrophic lateral sclerosis. Proc. Natl. Acad. Sci. USA 2000, 97, 12571–12576. [Google Scholar]
  8. Bruijn, L.I.; Becher, M.W.; Lee, M.K.; Anderson, K.L.; Jenkins, N.A.; Copeland, N.G.; Sisodia, S.S.; Rothstein, J.D.; Borchelt, D.R.; Price, D.L.; et al. ALS-linked SOD1 mutant G85R mediates damage to astrocytes and promotes rapidly progressive disease with SOD1-containing inclusions. Neuron 1997, 18, 327–338. [Google Scholar]
  9. Deng, H.X.; Shi, Y.; Furukawa, Y.; Zhai, H.; Fu, R.; Liu, E.; Gorrie, G.H.; Khan, M.S.; Hung, W.Y.; Bigio, E.H.; et al. Conversion to the amyotrophic lateral sclerosis phenotype is associated with intermolecular linked insoluble aggregates of SOD1 in mitochondria. Proc. Natl. Acad. Sci. USA 2006, 103, 7142–7147. [Google Scholar]
  10. Kong, J.; Xu, Z. Massive mitochondrial degeneration in motor neurons triggers the onset of amyotrophic lateral sclerosis in mice expressing a mutant SOD1. J. Neurosci 1998, 18, 3241–3250. [Google Scholar]
  11. Karch, C.M.; Prudencio, M.; Winkler, D.D.; Hart, P.J.; Borchelt, D.R. Role of mutant SOD1 disulfide oxidation and aggregation in the pathogenesis of familial ALS. Proc. Natl. Acad. Sci. USA 2009, 106, 7774–7779. [Google Scholar]
  12. Fischer, L.R.; Culver, D.G.; Tennant, P.; Davis, A.A.; Wang, M.; Castellano-Sanchez, A.; Khan, J.; Polak, M.A.; Glass, J.D. Amyotrophic lateral sclerosis is a distal axonopathy: Evidence in mice and man. Exp. Neurol 2004, 185, 232–240. [Google Scholar]
  13. Jaarsma, D.; Teuling, E.; Haasdijk, E.D.; de Zeeuw, C.I.; Hoogenraad, C.C. Neuron-specific expression of mutant superoxide dismutase is sufficient to induce amyotrophic lateral sclerosis in transgenic mice. J. Neurosci 2008, 28, 2075–2088. [Google Scholar]
  14. Deng, H.X.; Hentati, A.; Tainer, J.A.; Iqbal, Z.; Cayabyab, A.; Hung, W.Y.; Getzoff, E.D.; Hu, P.; Herzfeldt, B.; Roos, R.P.; et al. Amyotrophic lateral sclerosis and structural defects in Cu, Zn superoxide dismutase. Science 1993, 261, 1047–1051. [Google Scholar]
  15. Siddique, T.; Deng, H.X. Genetics of amyotrophic lateral sclerosis. Hum. Mol. Genet 1996, 5, 1465–1470. [Google Scholar]
  16. Andersen, P.M.; Nilsson, P.; Keranen, M.L.; Forsgren, L.; Hagglund, J.; Karlsborg, M.; Ronnevi, L.O.; Gredal, O.; Marklund, S.L. Phenotypic heterogeneity in motor neuron disease patients with CuZn-superoxide dismutase mutations in Scandinavia. Brain 1997, 120, 1723–1737. [Google Scholar]
  17. Swash, M.; Ingram, D. Preclinical and subclinical events in motor neuron disease. J. Neurol. Neurosurg. Psychiatry 1988, 51, 165–168. [Google Scholar]
  18. Beghi, E.; Balzarini, C.; Bogliun, G.; Logroscino, G.; Manfredi, L.; Mazzini, L.; Micheli, A.; Millul, A.; Poloni, M.; Riva, R.; et al. Reliability of the El Escorial diagnostic criteria for amyotrophic lateral sclerosis. Neuroepidemiology 2002, 21, 265–270. [Google Scholar]
  19. Brooks, B.R.; Miller, R.G.; Swash, M.; Munsat, T.L. El Escorial revisited: Revised criteria for the diagnosis of amyotrophic lateral sclerosis. Amyotroph. Lateral Scler. Other Motor Neuron Disord 2000, 1, 293–299. [Google Scholar]
  20. Olney, R.K.; Lomen-Hoerth, C. Motor unit number estimation (MUNE): How may it contribute to the diagnosis of ALS? Amyotroph. Lateral Scler. Other Motor Neuron Disord 2000, 1, S41–S44. [Google Scholar]
  21. Bromberg, M.B.; Forshew, D.A.; Nau, K.L.; Bromberg, J.; Simmons, Z.; Fries, T.J. Motor unit number estimation, isometric strength, and electromyographic measures in amyotrophic lateral sclerosis. Muscle Nerve 1993, 16, 1213–1219. [Google Scholar]
  22. de Carvalho, M.; Costa, J.; Swash, M. Clinical trials in ALS: A review of the role of clinical and neurophysiological measurements. Amyotroph. Lateral Scler. Other Motor Neuron Disord 2005, 6, 202–212. [Google Scholar]
  23. Eisen, A. Clinical electrophysiology of the upper and lower motor neuron in amyotrophic lateral sclerosis. Semin. Neurol 2001, 21, 141–154. [Google Scholar]
  24. Finsterer, J.; Fuglsang-Frederiksen, A. Concentric-needle versus macro EMG. II. Detection of neuromuscular disorders. Clin. Neurophysiol 2001, 112, 853–860. [Google Scholar]
  25. Stålberg, E. Macro EMG, a new recording technique. J. Neurol. Neurosurg. Psychiatry 1980, 43, 475–482. [Google Scholar]
  26. Dengler, R.; Konstanzer, A.; Kuther, G.; Hesse, S.; Wolf, W.; Struppler, A. Amyotrophic lateral sclerosis: Macro-EMG and twitch forces of single motor units. Muscle Nerve 1990, 13, 545–550. [Google Scholar]
  27. Guiloff, R.J.; Modarres-Sadeghi, H.; Stålberg, E.; Rogers, H. Short-term stability of single motor unit recordings in motor neuron disease: A macro EMG study. J. Neurol. Neurosurg. Psychiatry 1988, 51, 671–676. [Google Scholar]
  28. Stålberg, E. Macro EMG. Muscle Nerve 1983, 6, 619–630. [Google Scholar]
  29. Daube, J.R. Motor unit number estimates—From A to Z. J. Neurol. Sci 2006, 242, 23–35. [Google Scholar]
  30. Gooch, C.L.; Shefner, J.M. ALS surrogate markers. MUNE. Amyotroph. Lateral Scler. Other Motor Neuron Disord 2004, 5, 104–107. [Google Scholar]
  31. McComas, A.J.; Fawcett, P.R.; Campbell, M.J.; Sica, R.E. Electrophysiological estimation of the number of motor units within a human muscle. J. Neurol. Neurosurg. Psychiatry 1971, 34, 121–131. [Google Scholar]
  32. Sartucci, F.; Maritato, P.; Moscato, G.; Orlandi, G.; Calabrese, R.; Domenici, G.L.; Murri, L. Motor unit number estimation (MUNE) as a quantitative measure of disease progression and motor unit reorganization in amyotrophic lateral sclerosis. Int. J. Neurosci 2007, 117, 1229–1236. [Google Scholar]
  33. Sartucci, F.; Moscato, G.; Rossi, C.; Caleo, M.; Bocci, T.; Murri, L.; Giannini, F.; Rossi, A. Macro-EMG and MUNE changes in patients with amyotrophic lateral sclerosis: One-year follow up. Int. J. Neurosci 2011, 121, 257–266. [Google Scholar]
  34. Cuturic, M.; Shamsnia, M.; Palliyath, S. Lateral asymmetry of motor unit number estimate (MUNE). Electromyogr. Clin. Neurophysiol 2005, 45, 233–239. [Google Scholar]
  35. Aggarwal, A.; Nicholson, G. Normal complement of motor units in asymptomatic familial (SOD1 mutation) amyotrophic lateral sclerosis carriers. J. Neurol. Neurosurg. Psychiatry 2001, 71, 478–481. [Google Scholar]
  36. Bauermeister, W.; Jabre, J.F. The spectrum of concentric macro EMG correlations. Part I. Normal subjects. Muscle Nerve 1992, 15, 1081–1084. [Google Scholar]
  37. Sanders, D.B.; Stalberg, E.V. Aaem minimonograph #25: Single-fiber electromyography. Muscle Nerve 1996, 19, 1069–1083. [Google Scholar]
  38. Keypoint Service Manual; DANTEC Keypoint: Copenhagen, Denmark, 1996.
  39. McComas, A.J. Motor unit estimation: Anxieties and achievements. Muscle Nerve 1995, 18, 369–379. [Google Scholar]
  40. Hong, Y.H.; Sung, J.J.; Park, K.S.; Kwon, O.; Min, J.H.; Lee, K.W. Statistical MUNE: A comparison of two methods of setting recording windows in healthy subjects and ALS patients. Clin. Neurophysiol 2007, 118, 2605–2611. [Google Scholar]
  41. Henderson, R.D.; Ridall, P.G.; Hutchinson, N.M.; Pettitt, A.N.; McCombe, P.A. Bayesian statistical MUNE method. Muscle Nerve 2007, 36, 206–213. [Google Scholar]
  42. STATISTICA, version 8; StatSoft, Inc: Tulsa, OK, USA, 2007.
  43. Strong, M.J.; Brown, W.F.; Hudson, A.J.; Snow, R. Motor unit estimates in the biceps-brachialis in amyotrophic lateral sclerosis. Muscle Nerve 1988, 11, 415–422. [Google Scholar]
  44. Gan, R.; Jabre, J.F. The spectrum of concentric macro EMG correlations. Part II. Patients with diseases of muscle and nerve. Muscle Nerve 1992, 15, 1085–1088. [Google Scholar]
  45. Ilieva, H.S.; Yamanaka, K.; Malkmus, S.; Kakinohana, O.; Yaksh, T.; Marsala, M.; Cleveland, D.W. Mutant dynein (Loa) triggers proprioceptive axon loss that extends survival only in the SOD1 ALS model with highest motor neuron death. Proc. Natl. Acad. Sci. USA 2008, 105, 12599–12604. [Google Scholar]
  46. Yamanaka, K.; Boillee, S.; Roberts, E.A.; Garcia, M.L.; McAlonis-Downes, M.; Mikse, O.R.; Cleveland, D.W.; Goldstein, L.S. Mutant SOD1 in cell types other than motor neurons and oligodendrocytes accelerates onset of disease in ALS mice. Proc. Natl. Acad. Sci. USA 2008, 105, 7594–7599. [Google Scholar]
  47. Blain, C.R.; Brunton, S.; Williams, V.C.; Leemans, A.; Turner, M.R.; Andersen, P.M.; Catani, M.; Stanton, B.R.; Ganesalingham, J.; Jones, D.K.; et al. Differential corticospinal tract degeneration in homozygous “D90A” SOD-1 ALS and sporadic ALS. J. Neurol. Neurosurg. Psychiatry 2011, 82, 843–849. [Google Scholar]
  48. Agosta, F.; Pagani, E.; Petrolini, M.; Caputo, D.; Perini, M.; Prelle, A.; Salvi, F.; Filippi, M. Assessment of white matter tract damage in patients with amyotrophic lateral sclerosis: A diffusion tensor MR imaging tractography study. AJNR Am. J. Neuroradiol 2010, 31, 1457–1461. [Google Scholar]
  49. Agosta, F.; Chio, A.; Cosottini, M.; de Stefano, N.; Falini, A.; Mascalchi, M.; Rocca, M.A.; Silani, V.; Tedeschi, G.; Filippi, M. The present and the future of neuroimaging in amyotrophic lateral sclerosis. AJNR Am. J. Neuroradiol 2010, 31, 1769–1777. [Google Scholar]
  50. de Carvalho, M.; Chio, A.; Dengler, R.; Hecht, M.; Weber, M.; Swash, M. Neurophysiological measures in amyotrophic lateral sclerosis: Markers of progression in clinical trials. Amyotroph. Lateral Scler. Other Motor Neuron Disord 2005, 6, 17–28. [Google Scholar]
  51. Zhai, J.; Ström, A.L.; Kilty, R.; Venkatakrishnan, P.; White, J.; Everson, W.V.; Smart, E.J.; Zhu, H. Proteomic characterization of lipid raft proteins in amyotrophic lateral sclerosis mouse spinal cord. FEBS J 2009, 276, 3308–3323. [Google Scholar]
  52. Basso, M.; Samengo, G.; Nardo, G.; Massignan, T.; D’Alessandro, G.; Tartari, S.; Cantoni, L.; Marino, M.; Cheroni, C.; de Biasi, S.; et al. Characterization of detergent-insoluble proteins in ALS indicates a causal link between nitrative stress and aggregation in pathogenesis. PLoS One 2009, 4. [Google Scholar] [CrossRef]
  53. Migliore, L.; Coppedè, F. Genetics, enviromental factors and the emergin role of epigenetics in neurodegenerative diseases. Mutat. Res 2009, 667, 82–97. [Google Scholar]
  54. Hegedus, J.; Putman, C.T.; Gordon, T. Progressive motor unit loss in the G93A mouse model of amyotrophic lateral sclerosis is unaffected by gender. Muscle Nerve 2009, 39, 318–327. [Google Scholar]
  55. Nakamizo, T.; Urushitani, M.; Inoue, R.; Shinohara, A.; Sawada, H.; Honda, K.; Kihara, T.; Akaike, A.; Shimohama, S. Protection of cultured spinal motor neurons by estradiol. Neuroreport 2000, 11, 3493–3497. [Google Scholar]
Figure 1. MUNE values for biceps brachialis (BB, on the left) and abductor digiti minimi muscles (ADM, on the right). Note that, at the moment of diagnosis, motor units number is higher for familiar cases (black lines, fALS) compared with sporadic ones (gray lines, sALS); as the disease progresses, motor unit loss becomes more pronounced in the first group. Moreover, compared with sporadic form, patients carrying SOD-1 mutations did not show evidence of partial recovery within eight months from clinical onset (* p < 0.05; ** p < 0.01).
Ijms 12 09203f1
Figure 2. Histogram showing MUNE values in both BB (left) and ADM (right) muscles at every time of follow-up, in spinal (dark gray) and bulbar-onset (gray) cases of fALS. Note the lack of any significant difference between spinal ad bulbar forms for both proximal and distal muscles, throughout the entire follow-up period.
Ijms 12 09203f2
Figure 3. Histogram highlighting MUNE values in both BB (left) and ADM (right) muscles at every time of follow-up, in females (black columns) and males (gray columns); the top row shows the evolution of motor unit loss in the familiar form, whereas the bottom one the trend in sporadic cases. The lack of significant differences between males and females, in sporadic as well as in familiar forms, is consistent with results recently reported by Hegedus and colleagues (see the text for a more exhaustive discussion).
Ijms 12 09203f3
Figure 4. Time trend of Macro-EMG parameters (area, fiber density) with time. All the values increase more steeply in familiar than in sporadic forms (black and gray lines, respectively), strengthening the idea that in the first group there is a paradoxical more effective axonal sprouting (* p < 0.05; ** p < 0.01).
Ijms 12 09203f4
Table 1. Macro-EMG and Motor Unit Number Estimation (MUNE) results, expressed as mean ± 1 SD, both in patients with sALS and fALS and their changes over 4, 8 and 12 months of follow-up.
T0T1T2T3
(mean ± 1 SD)(mean ± 1 SD)(mean ± 1 SD)(mean ± 1 SD)
BB Macro EMGsALS4397.6 ± 255.96389.2 ± 586.36553 ± 498.78072.4 ± 1023.4
Area (μVms)fALS4378.9 ± 319.67791.0 ± 953.410922.8 ± 1123.712499.3 ± 1874.4
BB Macro-EMGsALS2.0 ± 0.32.1 ± 0.12.3 ± 0.32.5 ± 0.2
Fiber DensityfALS1.9 ± 0.32.5 ± 0.33.5 ± 0.63.9 ± 0.5
BB MUNEsALS48.3 ± 9.334.1 ± 1.935.4 ± 1.430.8 ± 2.2
fALS80.2 ± 7.821.8 ± 2.216.8 ± 1.016.5 ± 2.0
ADM MUNEsALS35.6 ± 3.420.1 ± 1.822.8 ± 5.212.1 ± 5.8
fALS42.8 ± 6.618.4 ± 3.115.3 ± 2.19.0 ± 2.1

