Kinetics of Chromium(III) Transport Through a Liquid Membrane Containing DNNSA as a Carrier

Abstract
:1. Introduction
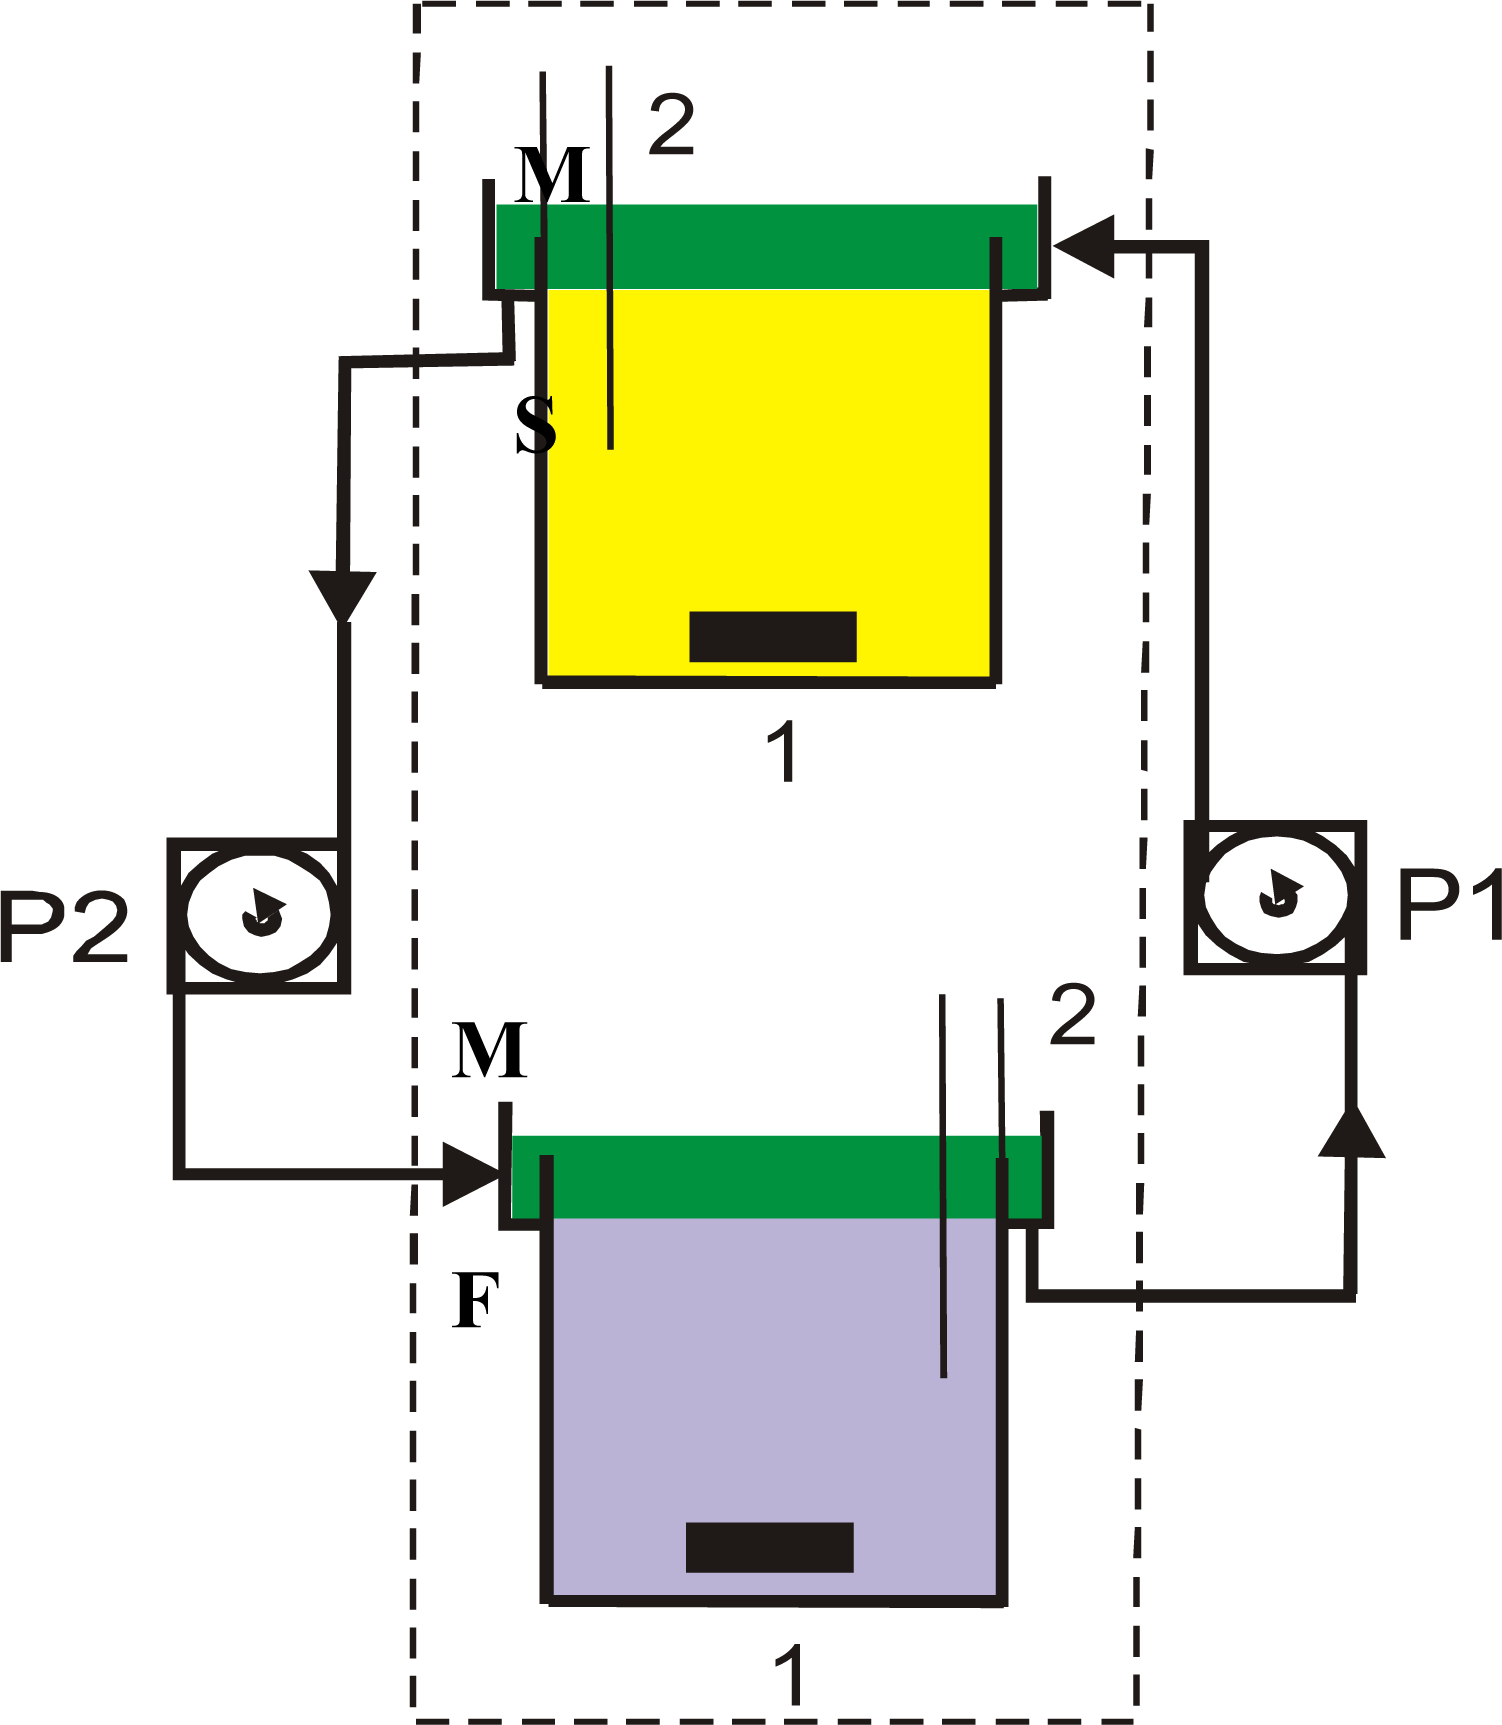
2. Experimental Section
3. Results and Discussion
3.1. Theoretical
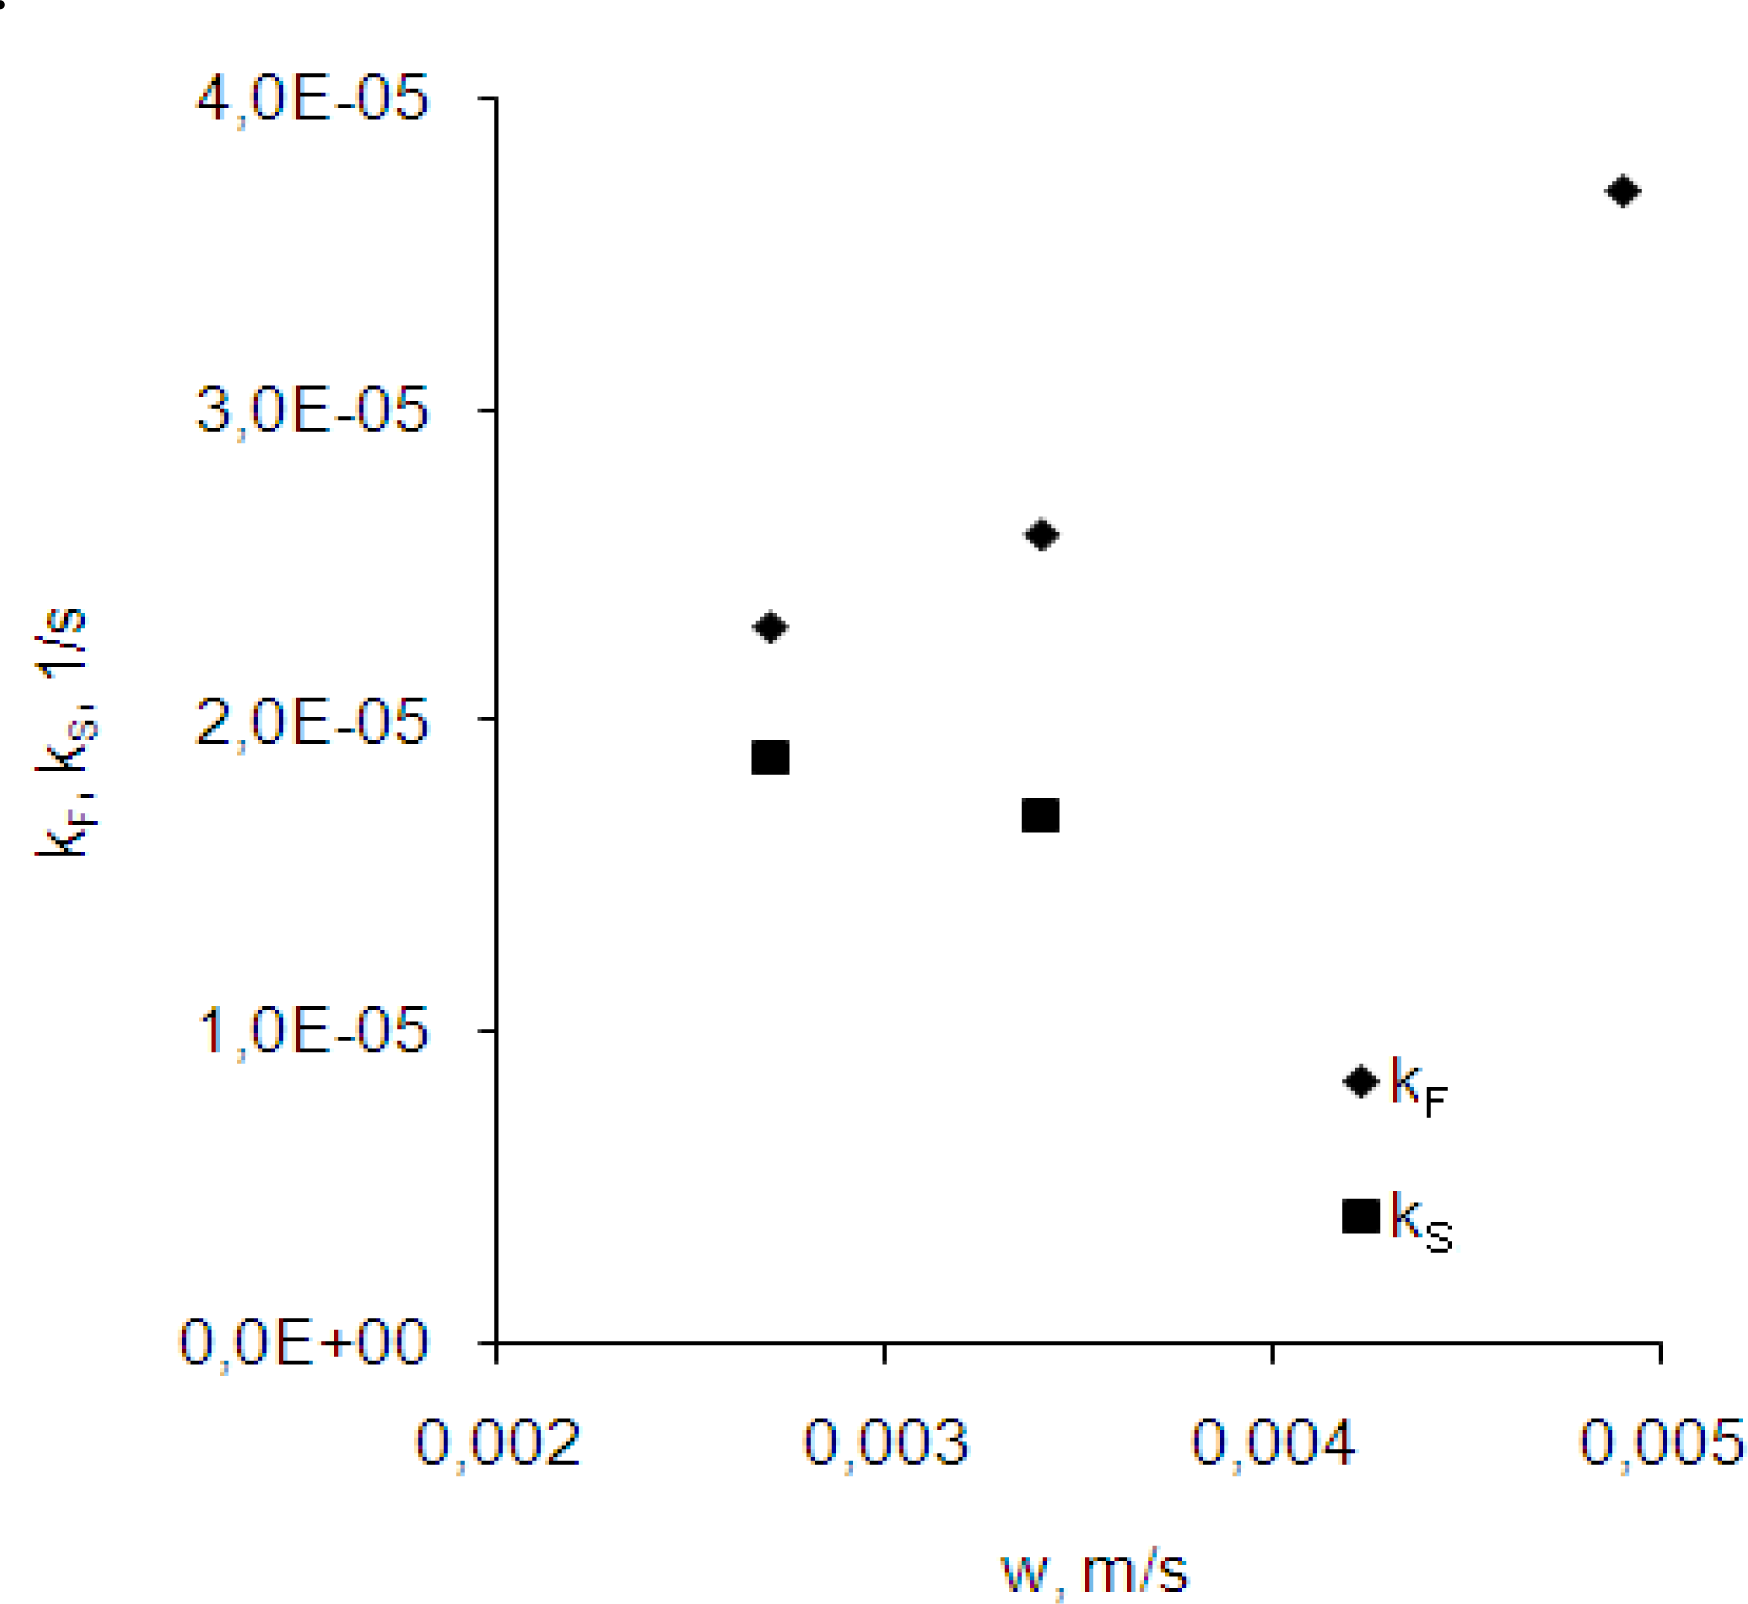
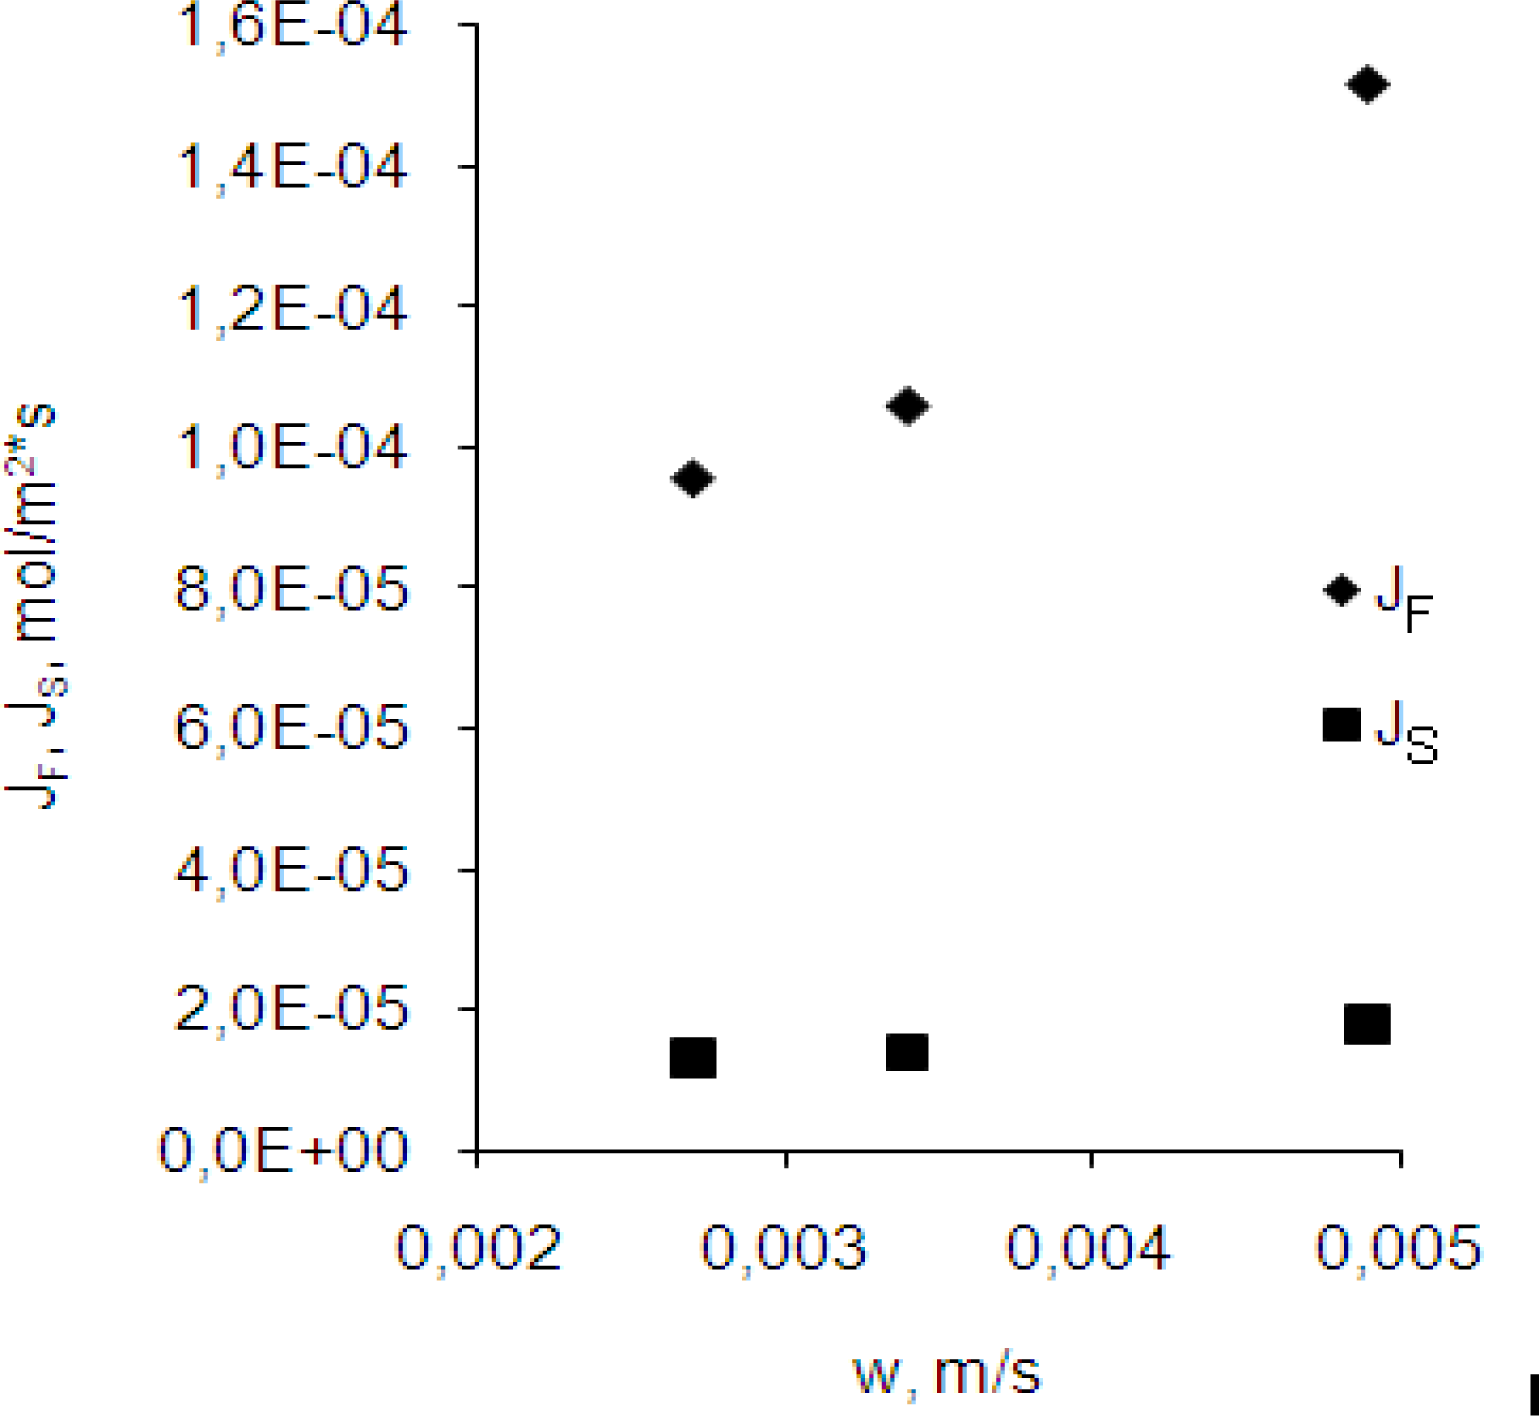
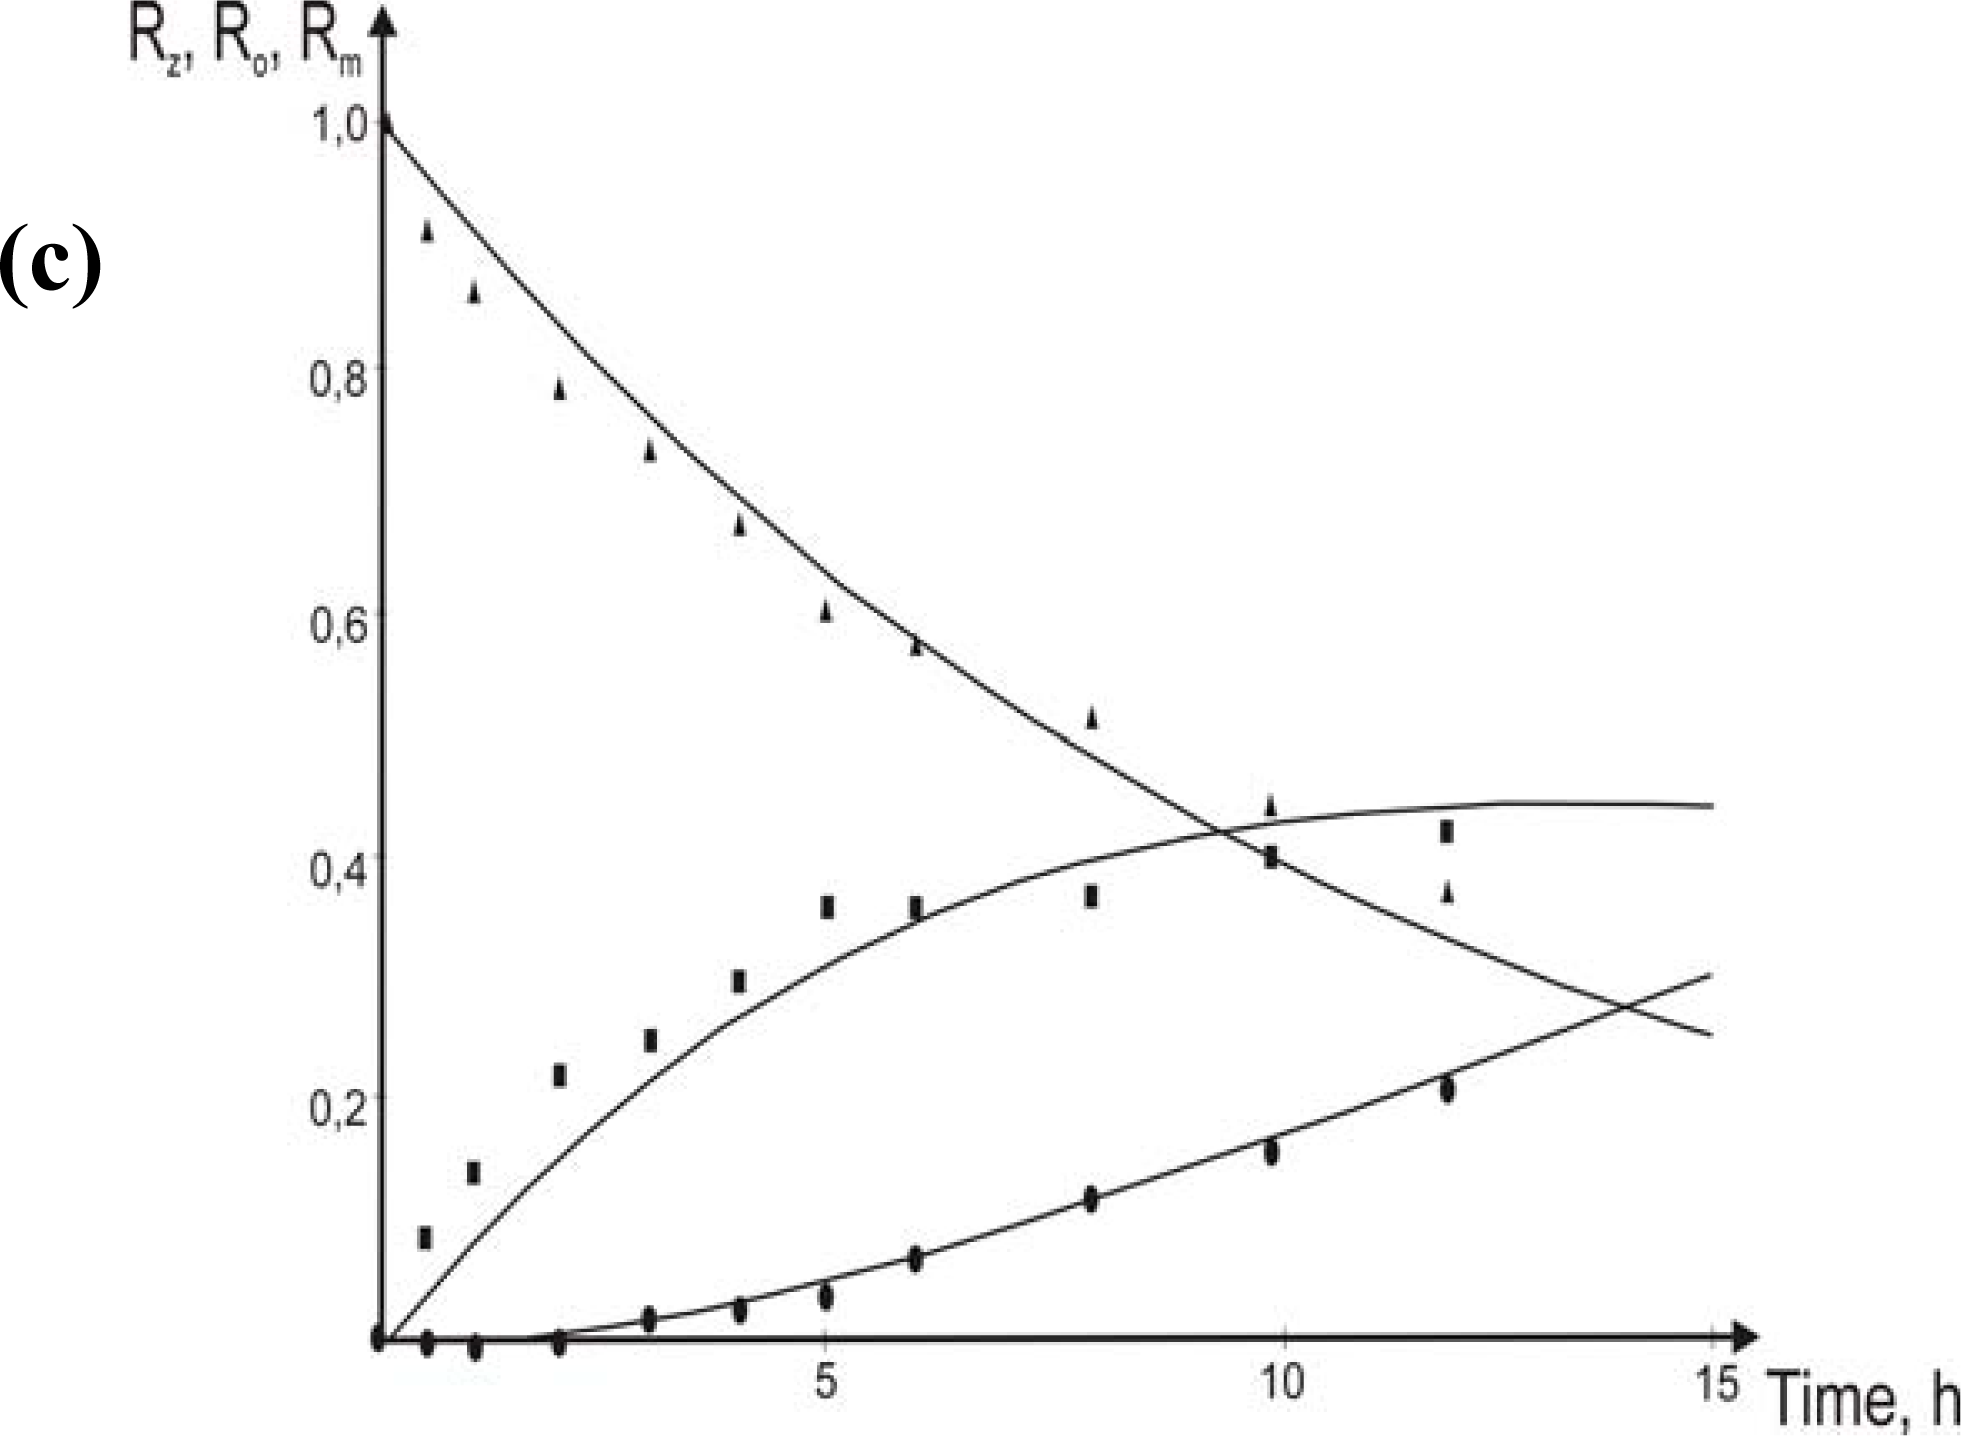
3.2. Effect of the velocity of the membrane’s flow
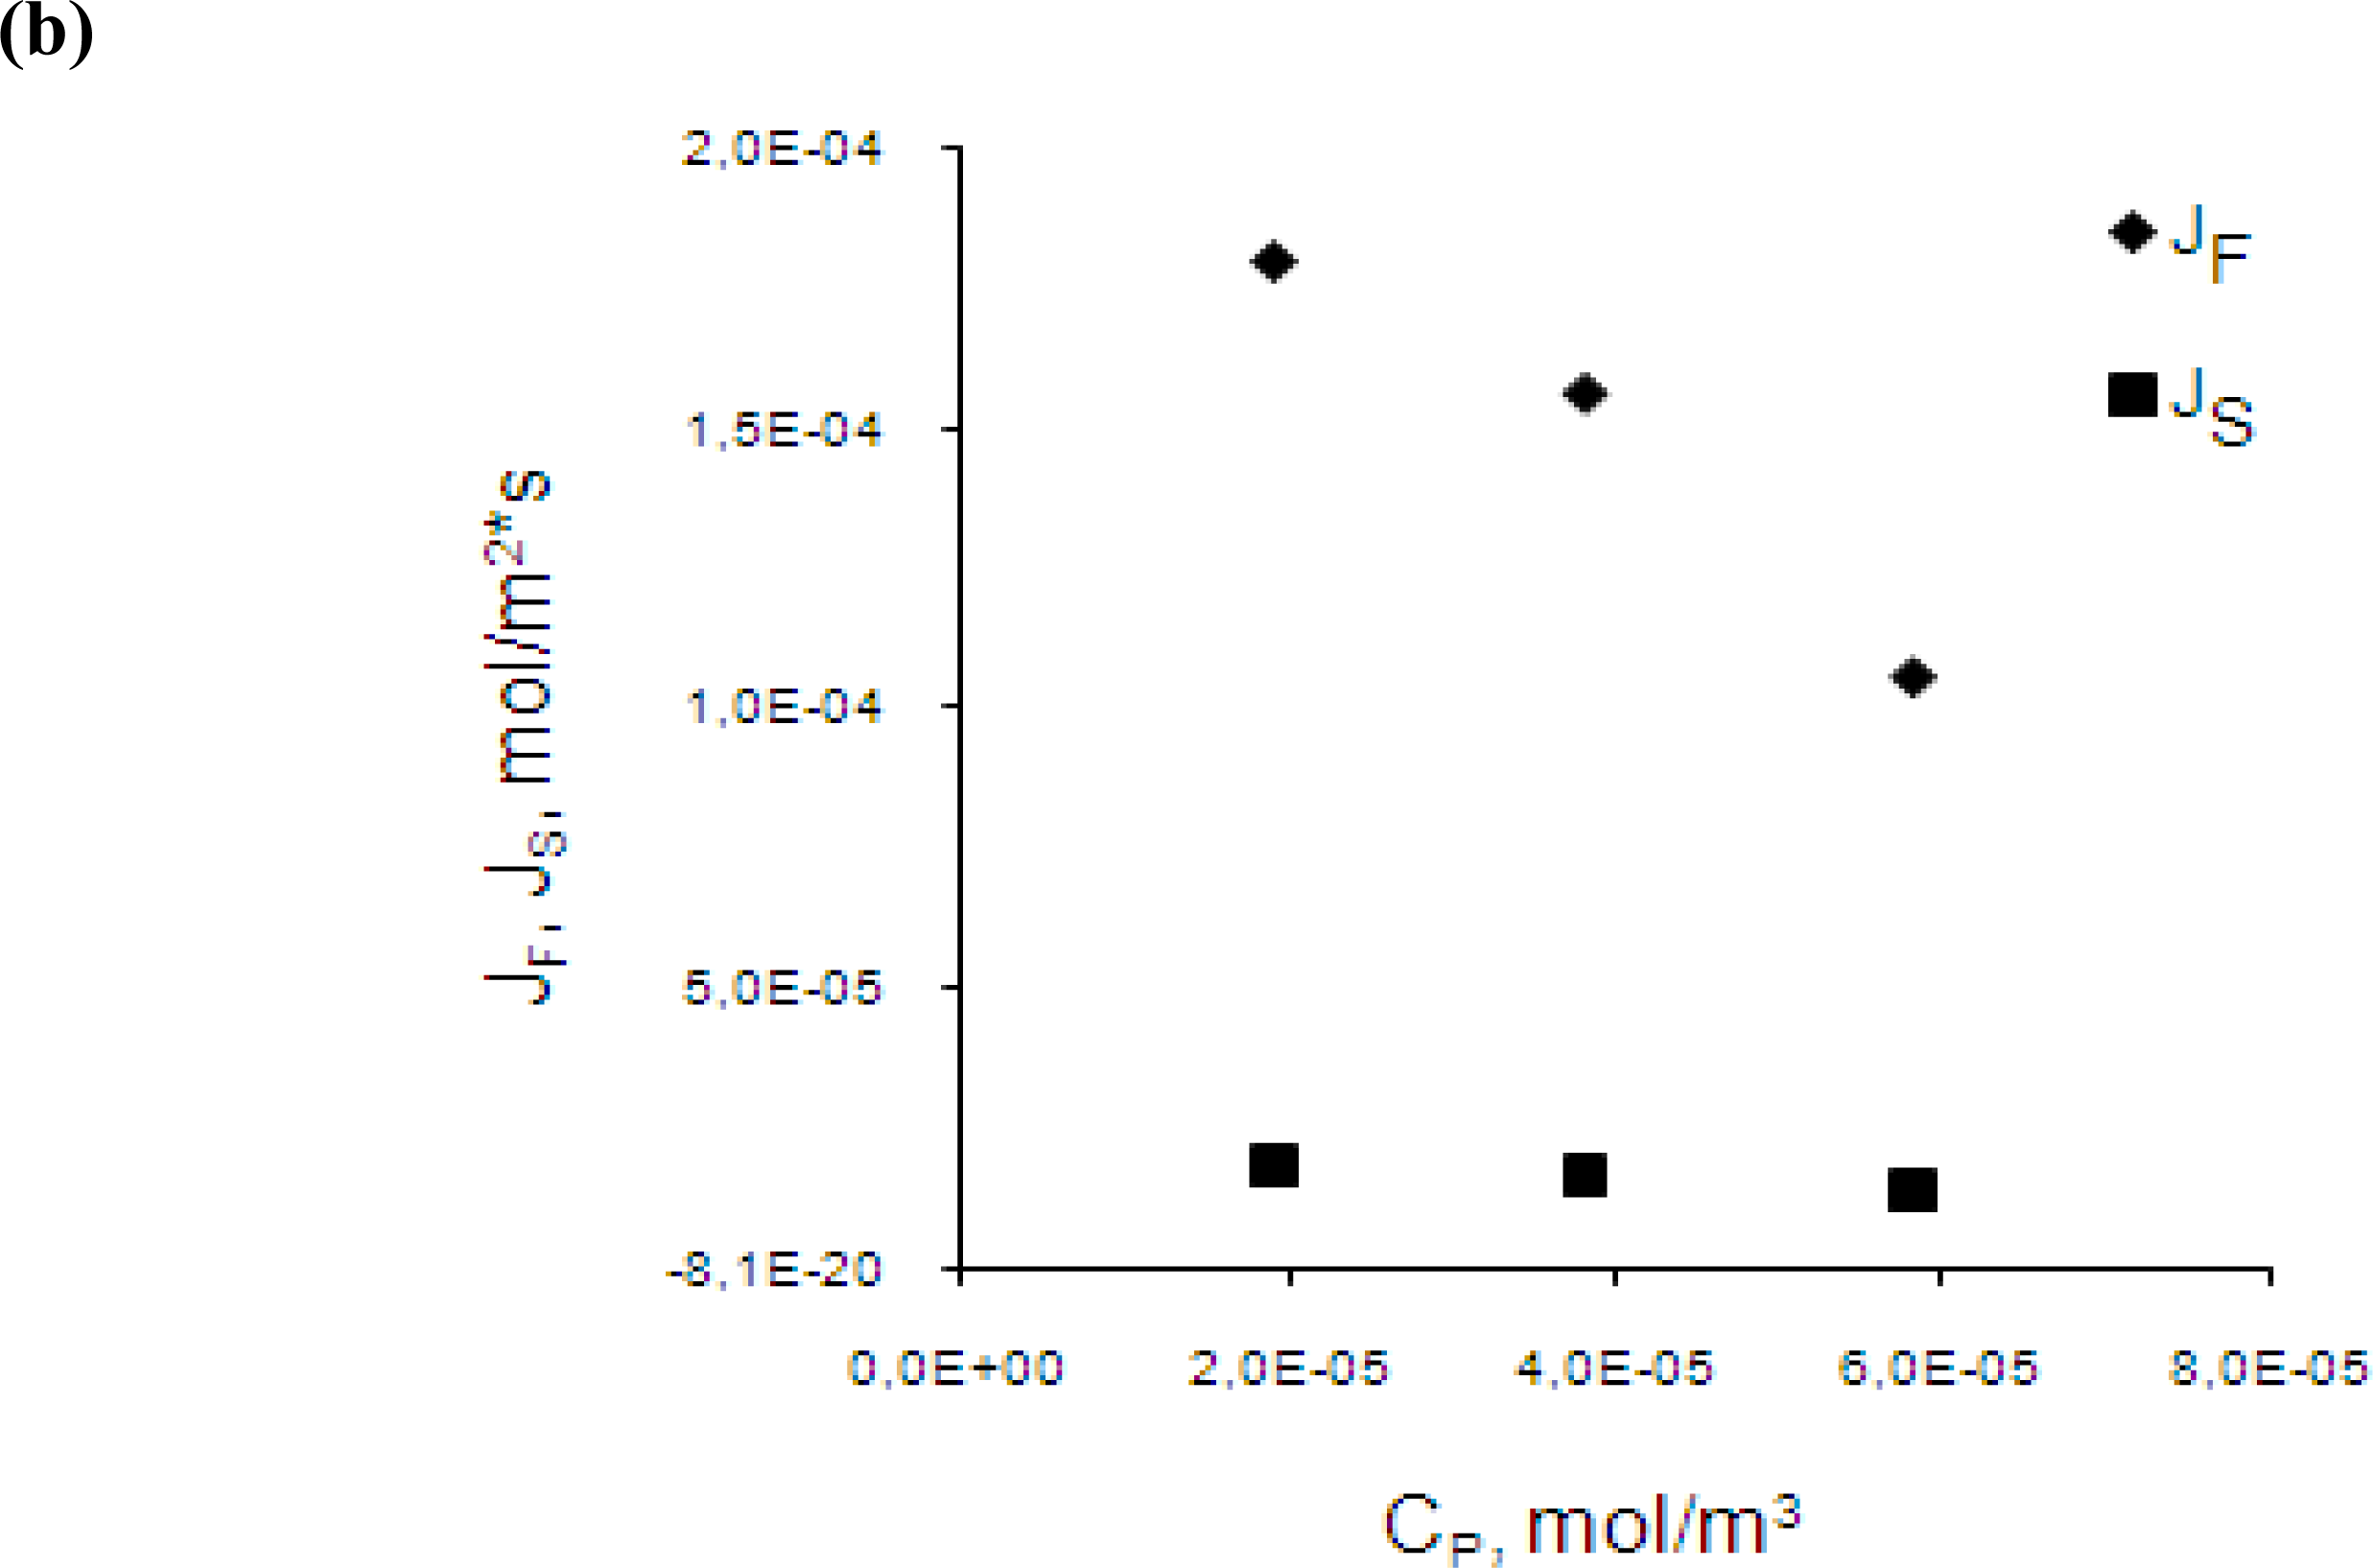
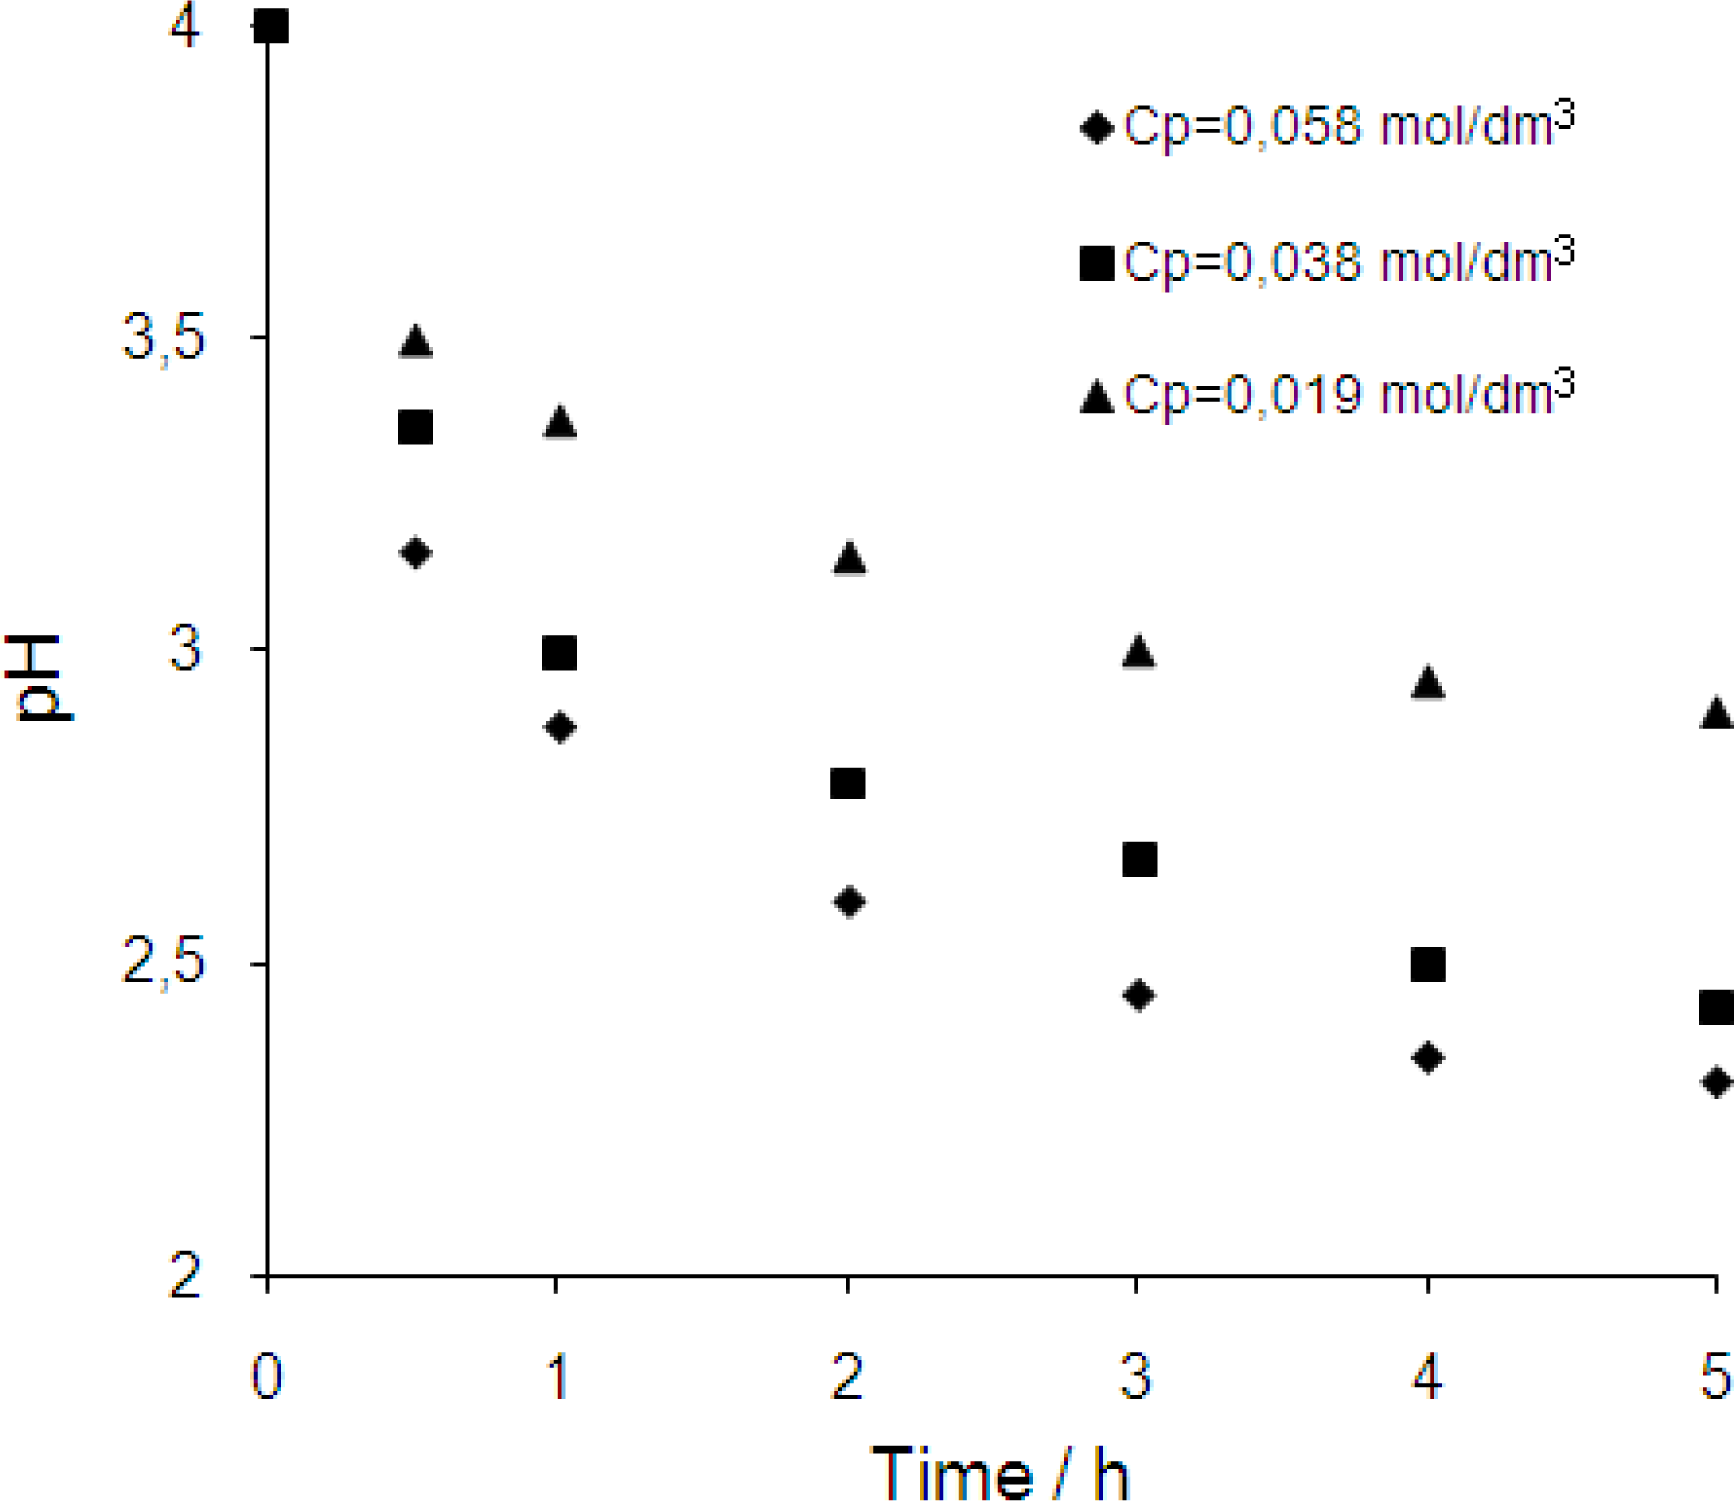
3.3. Effect of initial chromium(III) concentration in the feed phase
4. Conclusions
References
- Ashraf, M; Chaudry, S; Ahmad, M; Malik, T. Supported liquid membrane technique applicability for removal of chromium from tannery wastes. Waste Management 1998, 17, 211–218. [Google Scholar]
- Gill, JS; Singh, H; Gupta, CK. Studies on supported liquid membranes for simultaneous separation of Fe(III), Cu(II) and Ni(II) from dilute feed. Hydrometallurgy 2000, 55, 113–116. [Google Scholar]
- Kulkarni, PS; Mulchopadhyay, S; Bellary, MP; Ghosh, SK. Studies on membrane stability and recovery of uranium(VI) from aqueous solutions using a liquid emulsion membrane process. Hydrometallurgy 2002, 64, 49–58. [Google Scholar]
- Susmi, B; Siddhartha, D; Shyamal, KS. Mass transfer analysis of the extraction of Cr(VI) by liquid surfactant membrane. Sep. Sci. Technol 2000, 35, 483–501. [Google Scholar]
- Bhowal, A; Datta, S. Studies on transport mechanism of Cr(VI) extraction from an acidic solution using liquid surfactant membranes. J. Membr. Sci 2001, 188, 1–8. [Google Scholar]
- Gęga, J; Walkowiak, W. Separation of Cr(VI) and Cr(III) ions from sulfuric acid solutions with TOPO by bulk and supported liquid membranes. Pol J Applied Chem 1999, XLIII(3–4), 147–160. [Google Scholar]
- Schroeder, D; Lee, GF. Potential transformations of chromium in natural waters. Water, Air, Soil Pollut 1975, 4, 355–365. [Google Scholar]
- Świetlik, R. Kinetic study of redox processes of chromium in natural river water. Pol. J. Env. Studies 2002, 11, 165–169. [Google Scholar]
- Lanagan, MD; Ibana, DC. The solvent extraction and stripping of chromium with Cyanex 272. Miner. Eng 2003, 16, 237–245. [Google Scholar]
- Kuvaeva, AI; Mikulich, AV; Skripchewnko, AS. Extraction of chromium(III) ions with polynonylnaphthalenesulphonic acid solution. Ser. Him. Navuk 1991, 3, 7–9. [Google Scholar]
- Szpakowska, M; Nagy, O’B. Membrane material effect on copper coupled transport through liquid membrane. J. Membr. Sci 1991, 64, 129–143. [Google Scholar]
- Kocaoba, S; Akcin, G. Removal and recovery of chromium and chromium speciation with MINTEQA2. Talanta 2002, 57, 23–30. [Google Scholar]
- Coelhoso, IM; Moura, TF; Crespo, JPSG; Carrondo, MJT. Transport mechanisms in liquid membranes with ion exchange carrier. J. Membr. Sci 1995, 108, 231–244. [Google Scholar]
- Gawroński, R; Religa, P. Transfer of chromium(III) ions in systems with liquid membrane. In Monograph of Environmental Engineering Committee of Polish Academy of Sciences; PAN: Warsaw, Poland, 2004; Volume 22, pp. 295–304. [Google Scholar]

 - eqs.6–8).

 - eqs.6–8).
- eqs.6–8).
- eqs.6–8).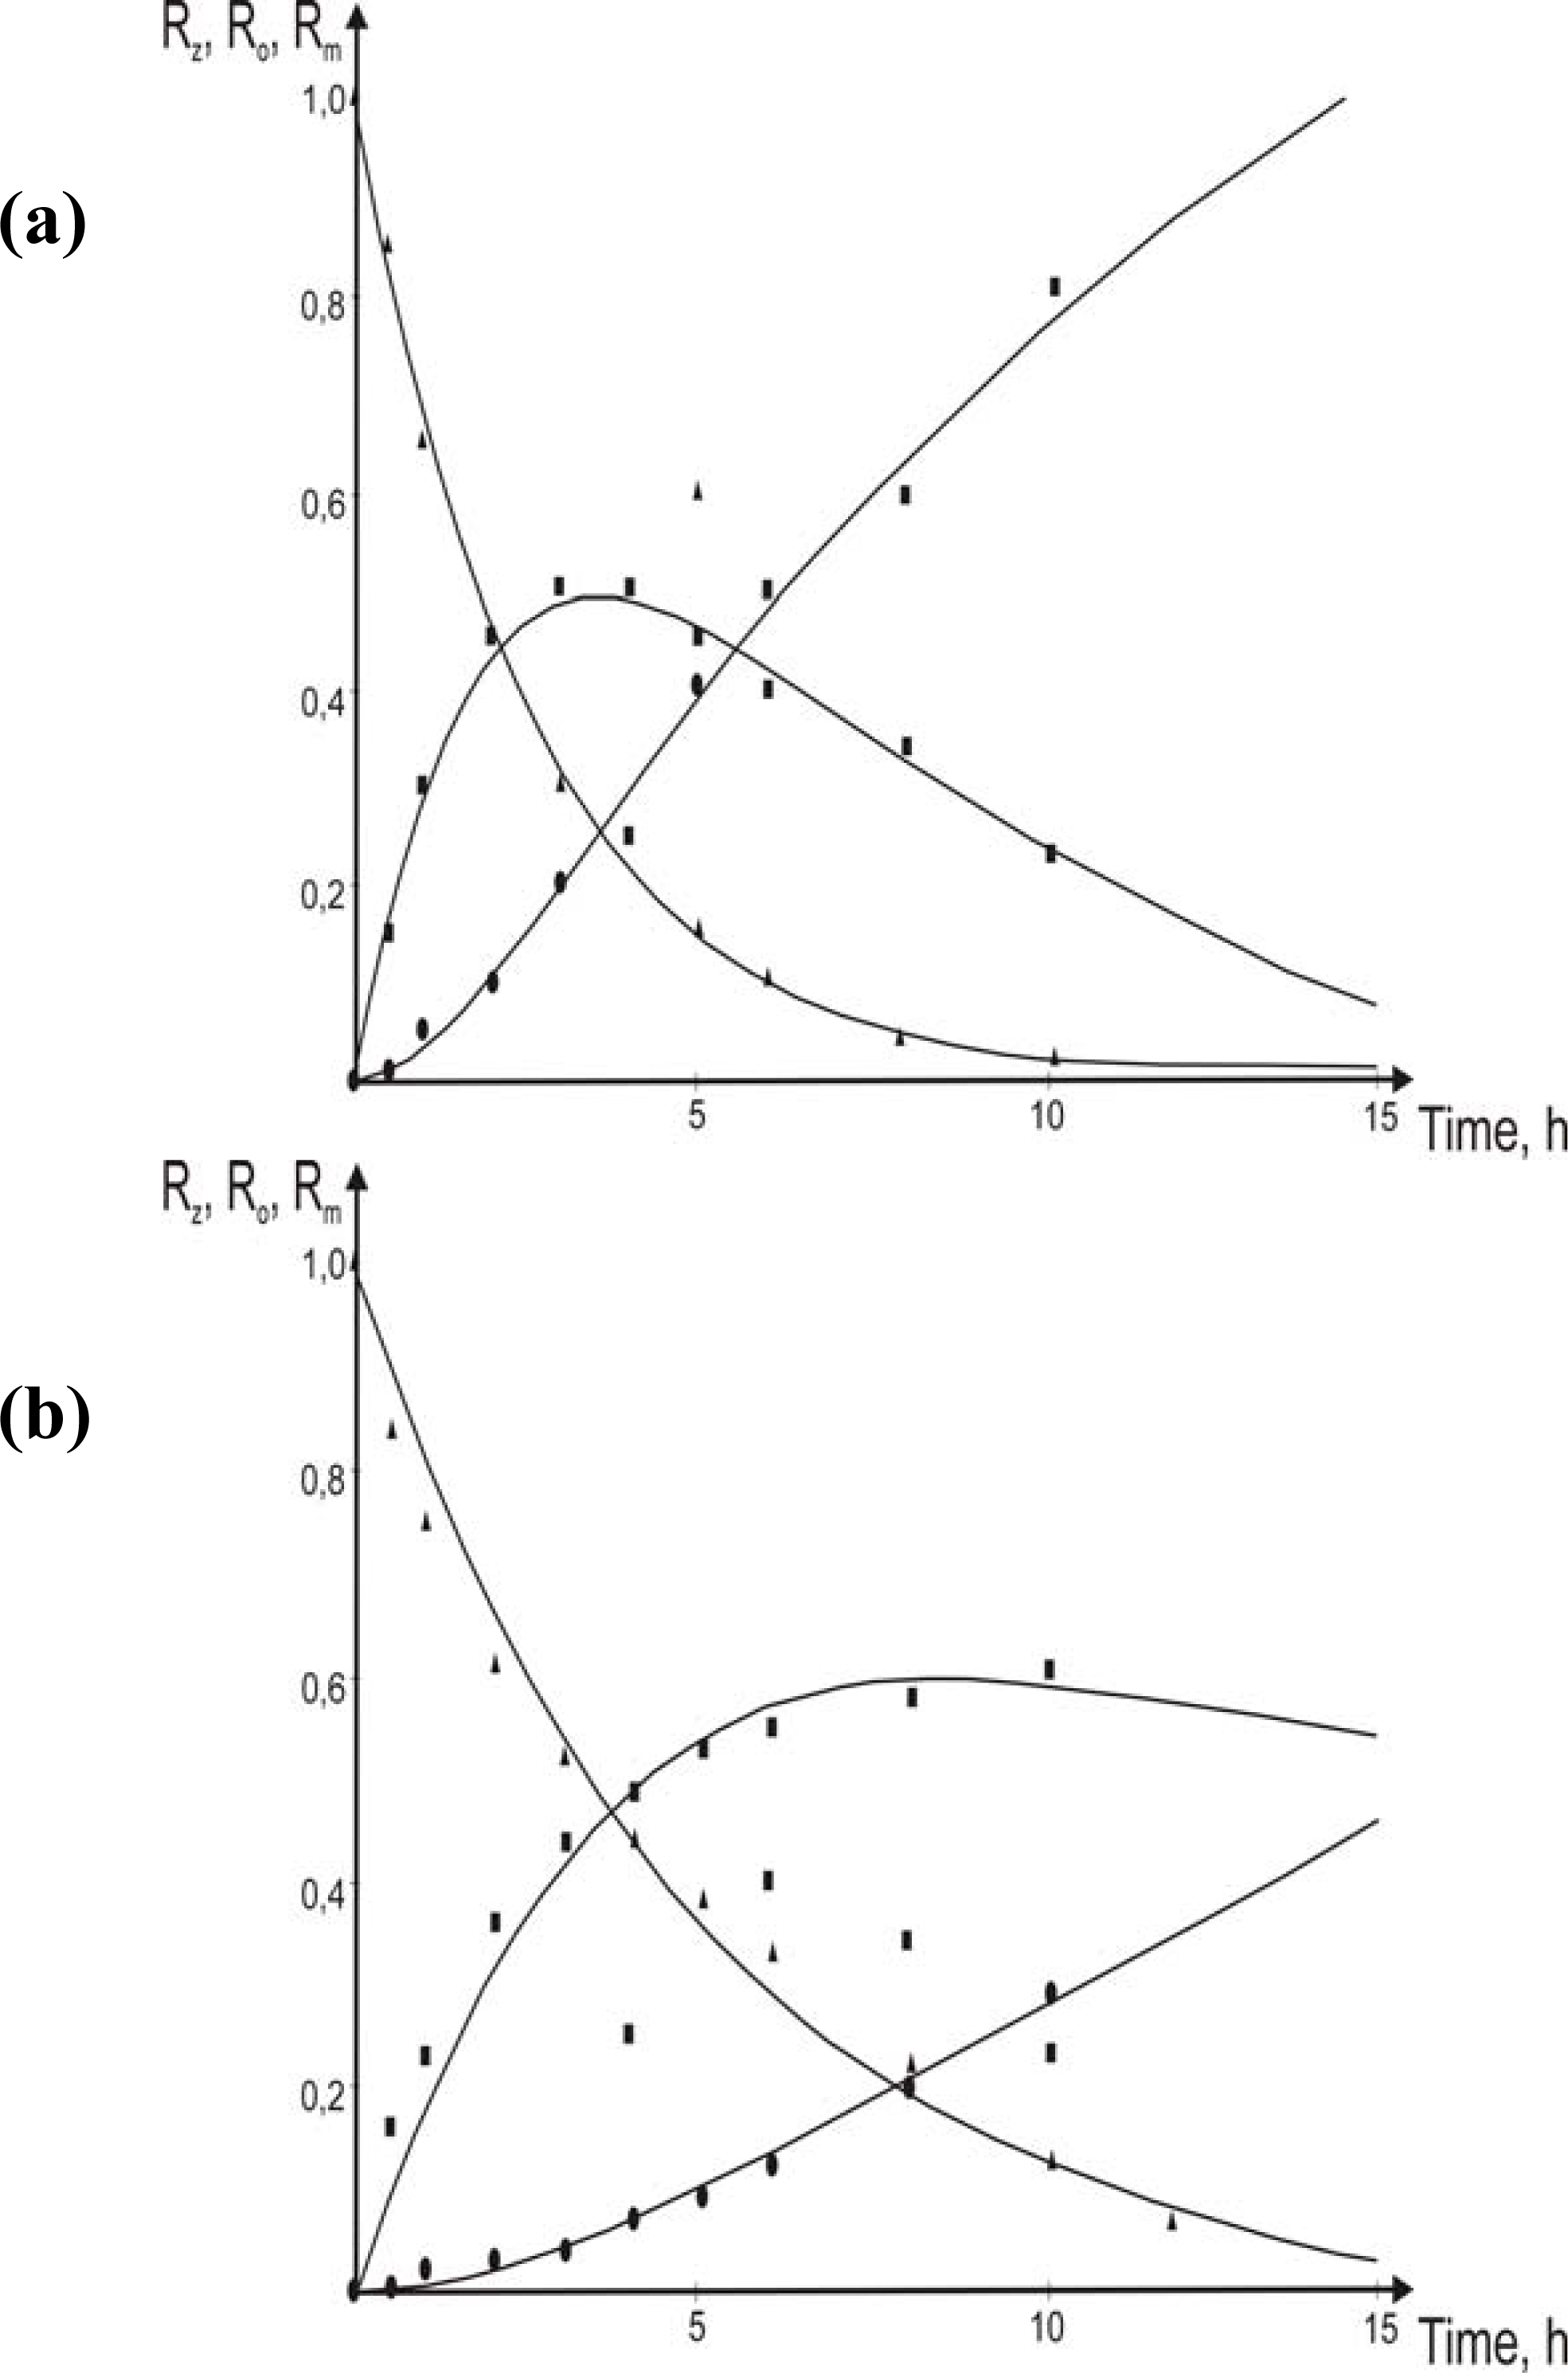


© 2009 by the authors; licensee Molecular Diversity Preservation International, Basel, Switzerland. This article is an open-access article distributed under the terms and conditions of the Creative Commons Attribution license ( http://creativecommons.org/licenses/by/3.0/). This article is an open-access article distributed under the terms and conditions of the Creative Commons Attribution license ( http://creativecommons.org/licenses/by/3.0/).
Share and Cite
Religa, P.; Gawroński, R.; Gierycz, P. Kinetics of Chromium(III) Transport Through a Liquid Membrane Containing DNNSA as a Carrier. Int. J. Mol. Sci. 2009, 10, 964-975. https://doi.org/10.3390/ijms10030964
Religa P, Gawroński R, Gierycz P. Kinetics of Chromium(III) Transport Through a Liquid Membrane Containing DNNSA as a Carrier. International Journal of Molecular Sciences. 2009; 10(3):964-975. https://doi.org/10.3390/ijms10030964
Chicago/Turabian StyleReliga, Paweł, Roman Gawroński, and Paweł Gierycz. 2009. "Kinetics of Chromium(III) Transport Through a Liquid Membrane Containing DNNSA as a Carrier" International Journal of Molecular Sciences 10, no. 3: 964-975. https://doi.org/10.3390/ijms10030964