Giving Molecules an Identity. On the Interplay Between QSARs and Partial Order Ranking

Abstract
:Introduction
Methods
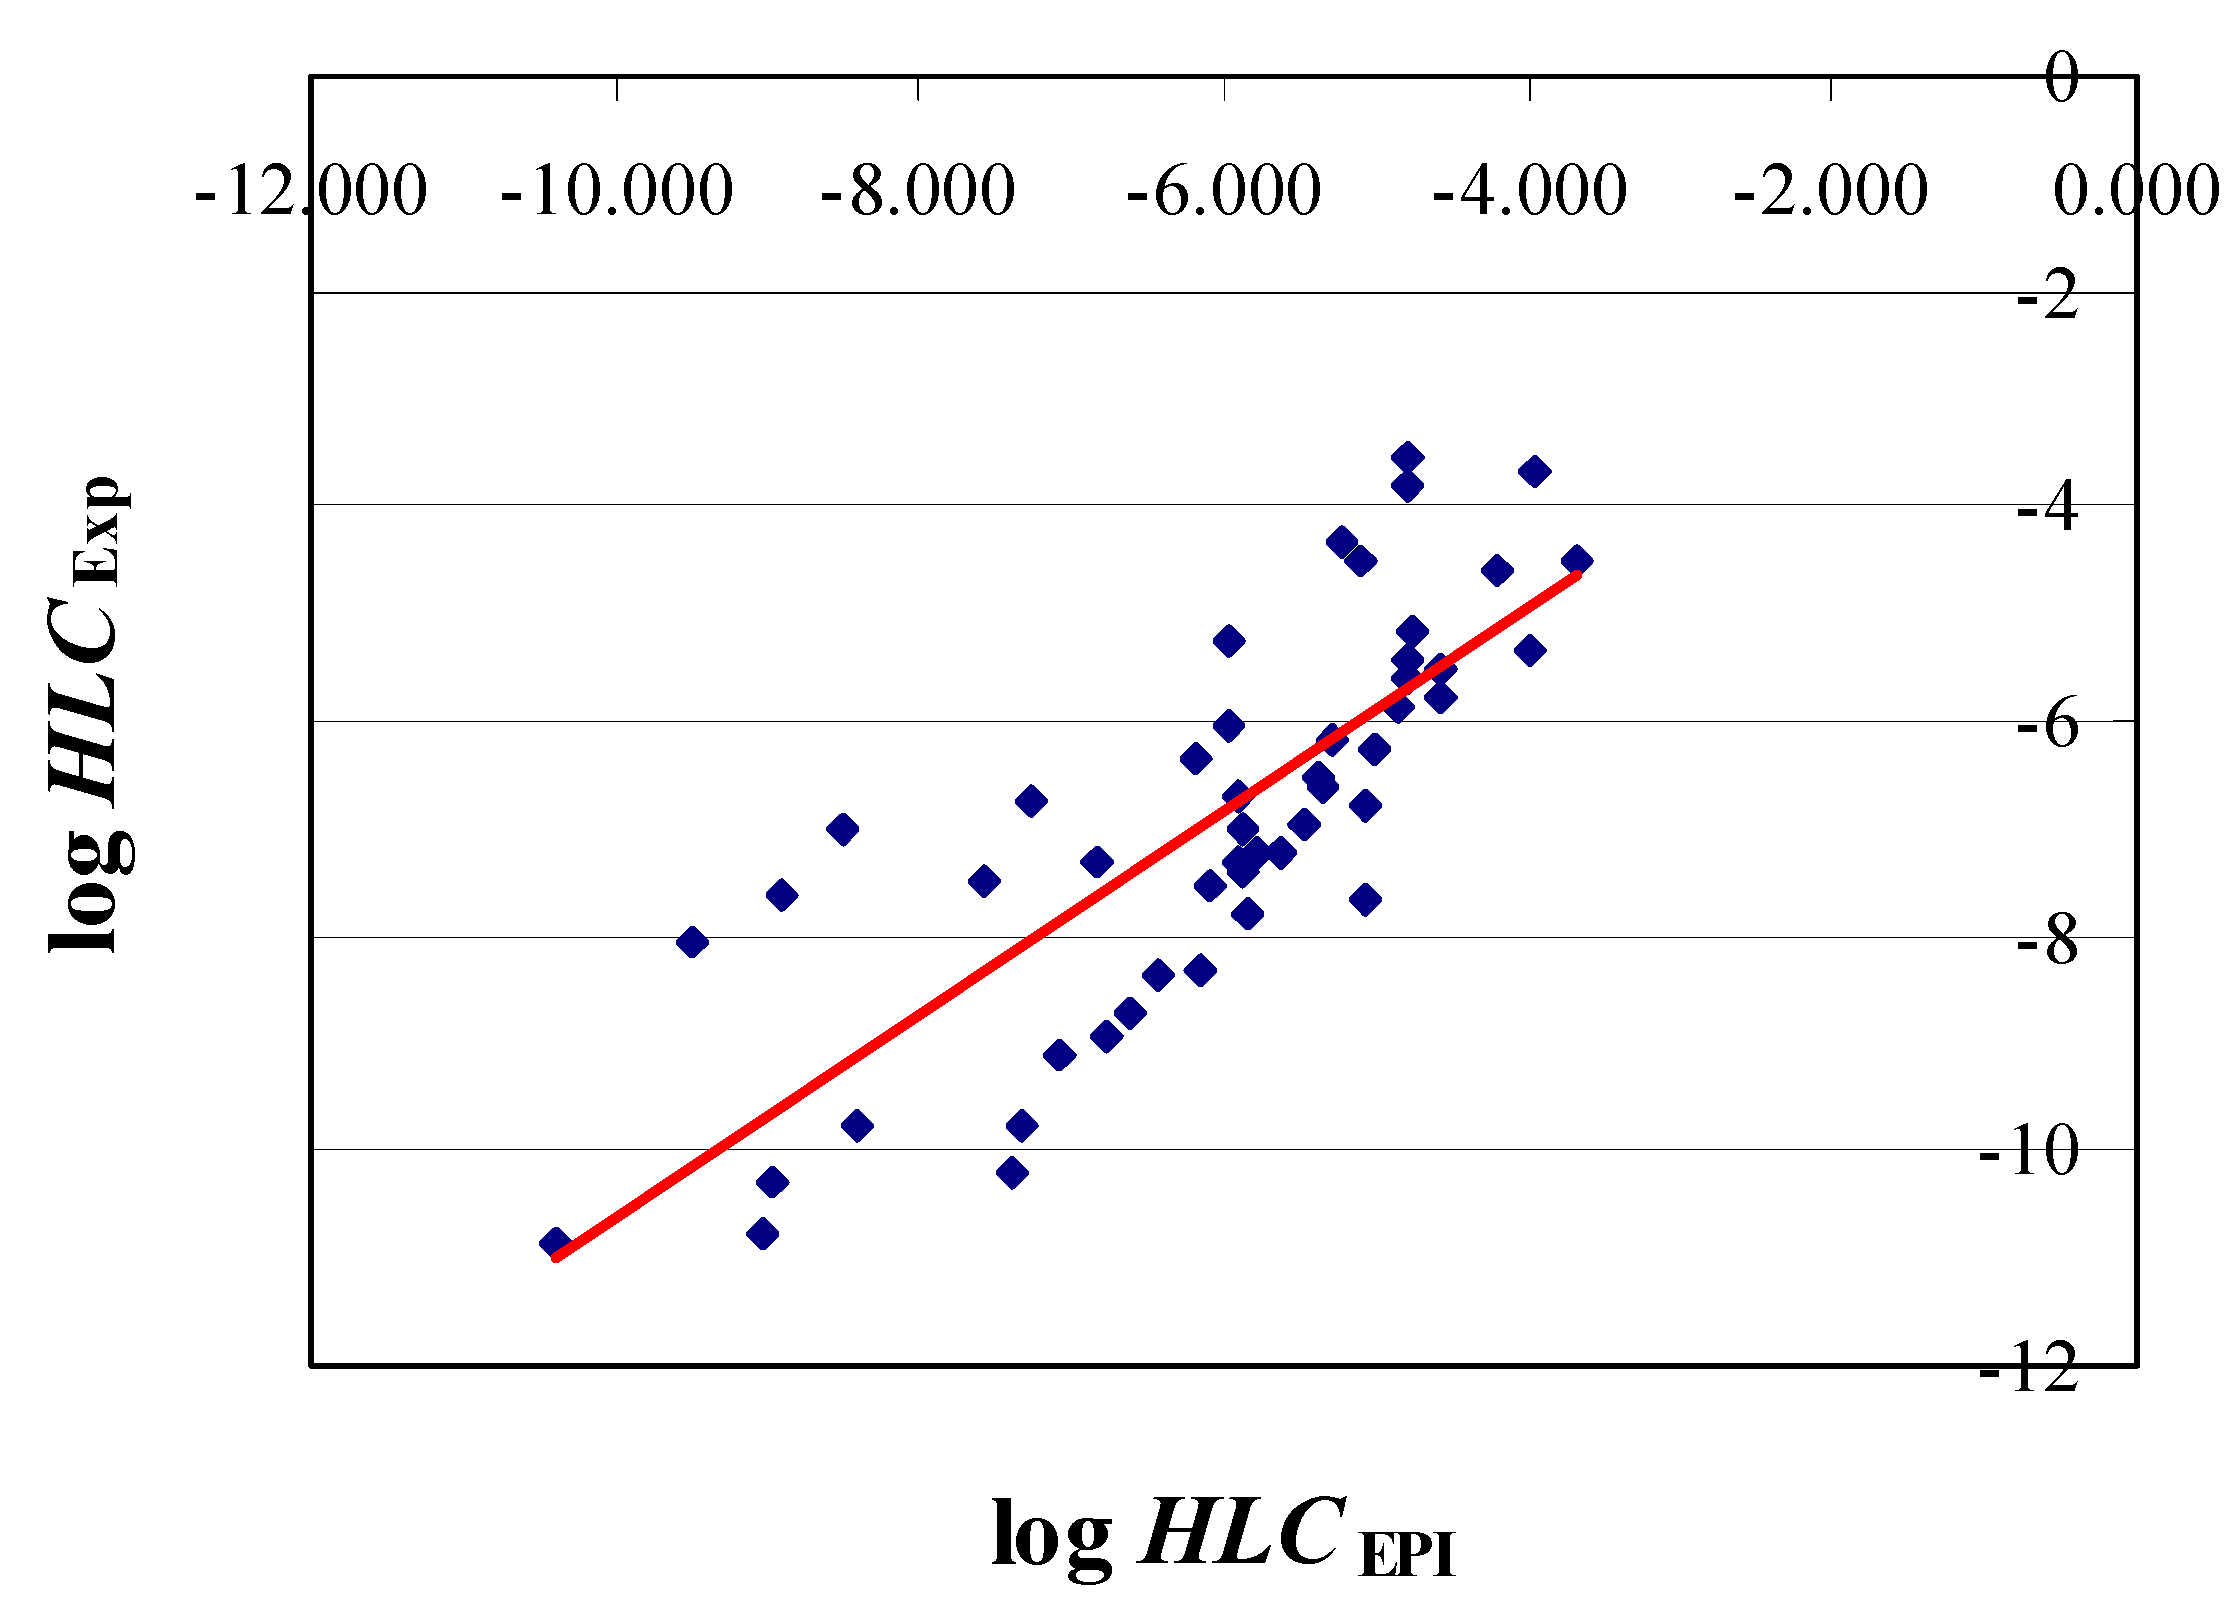
QSAR
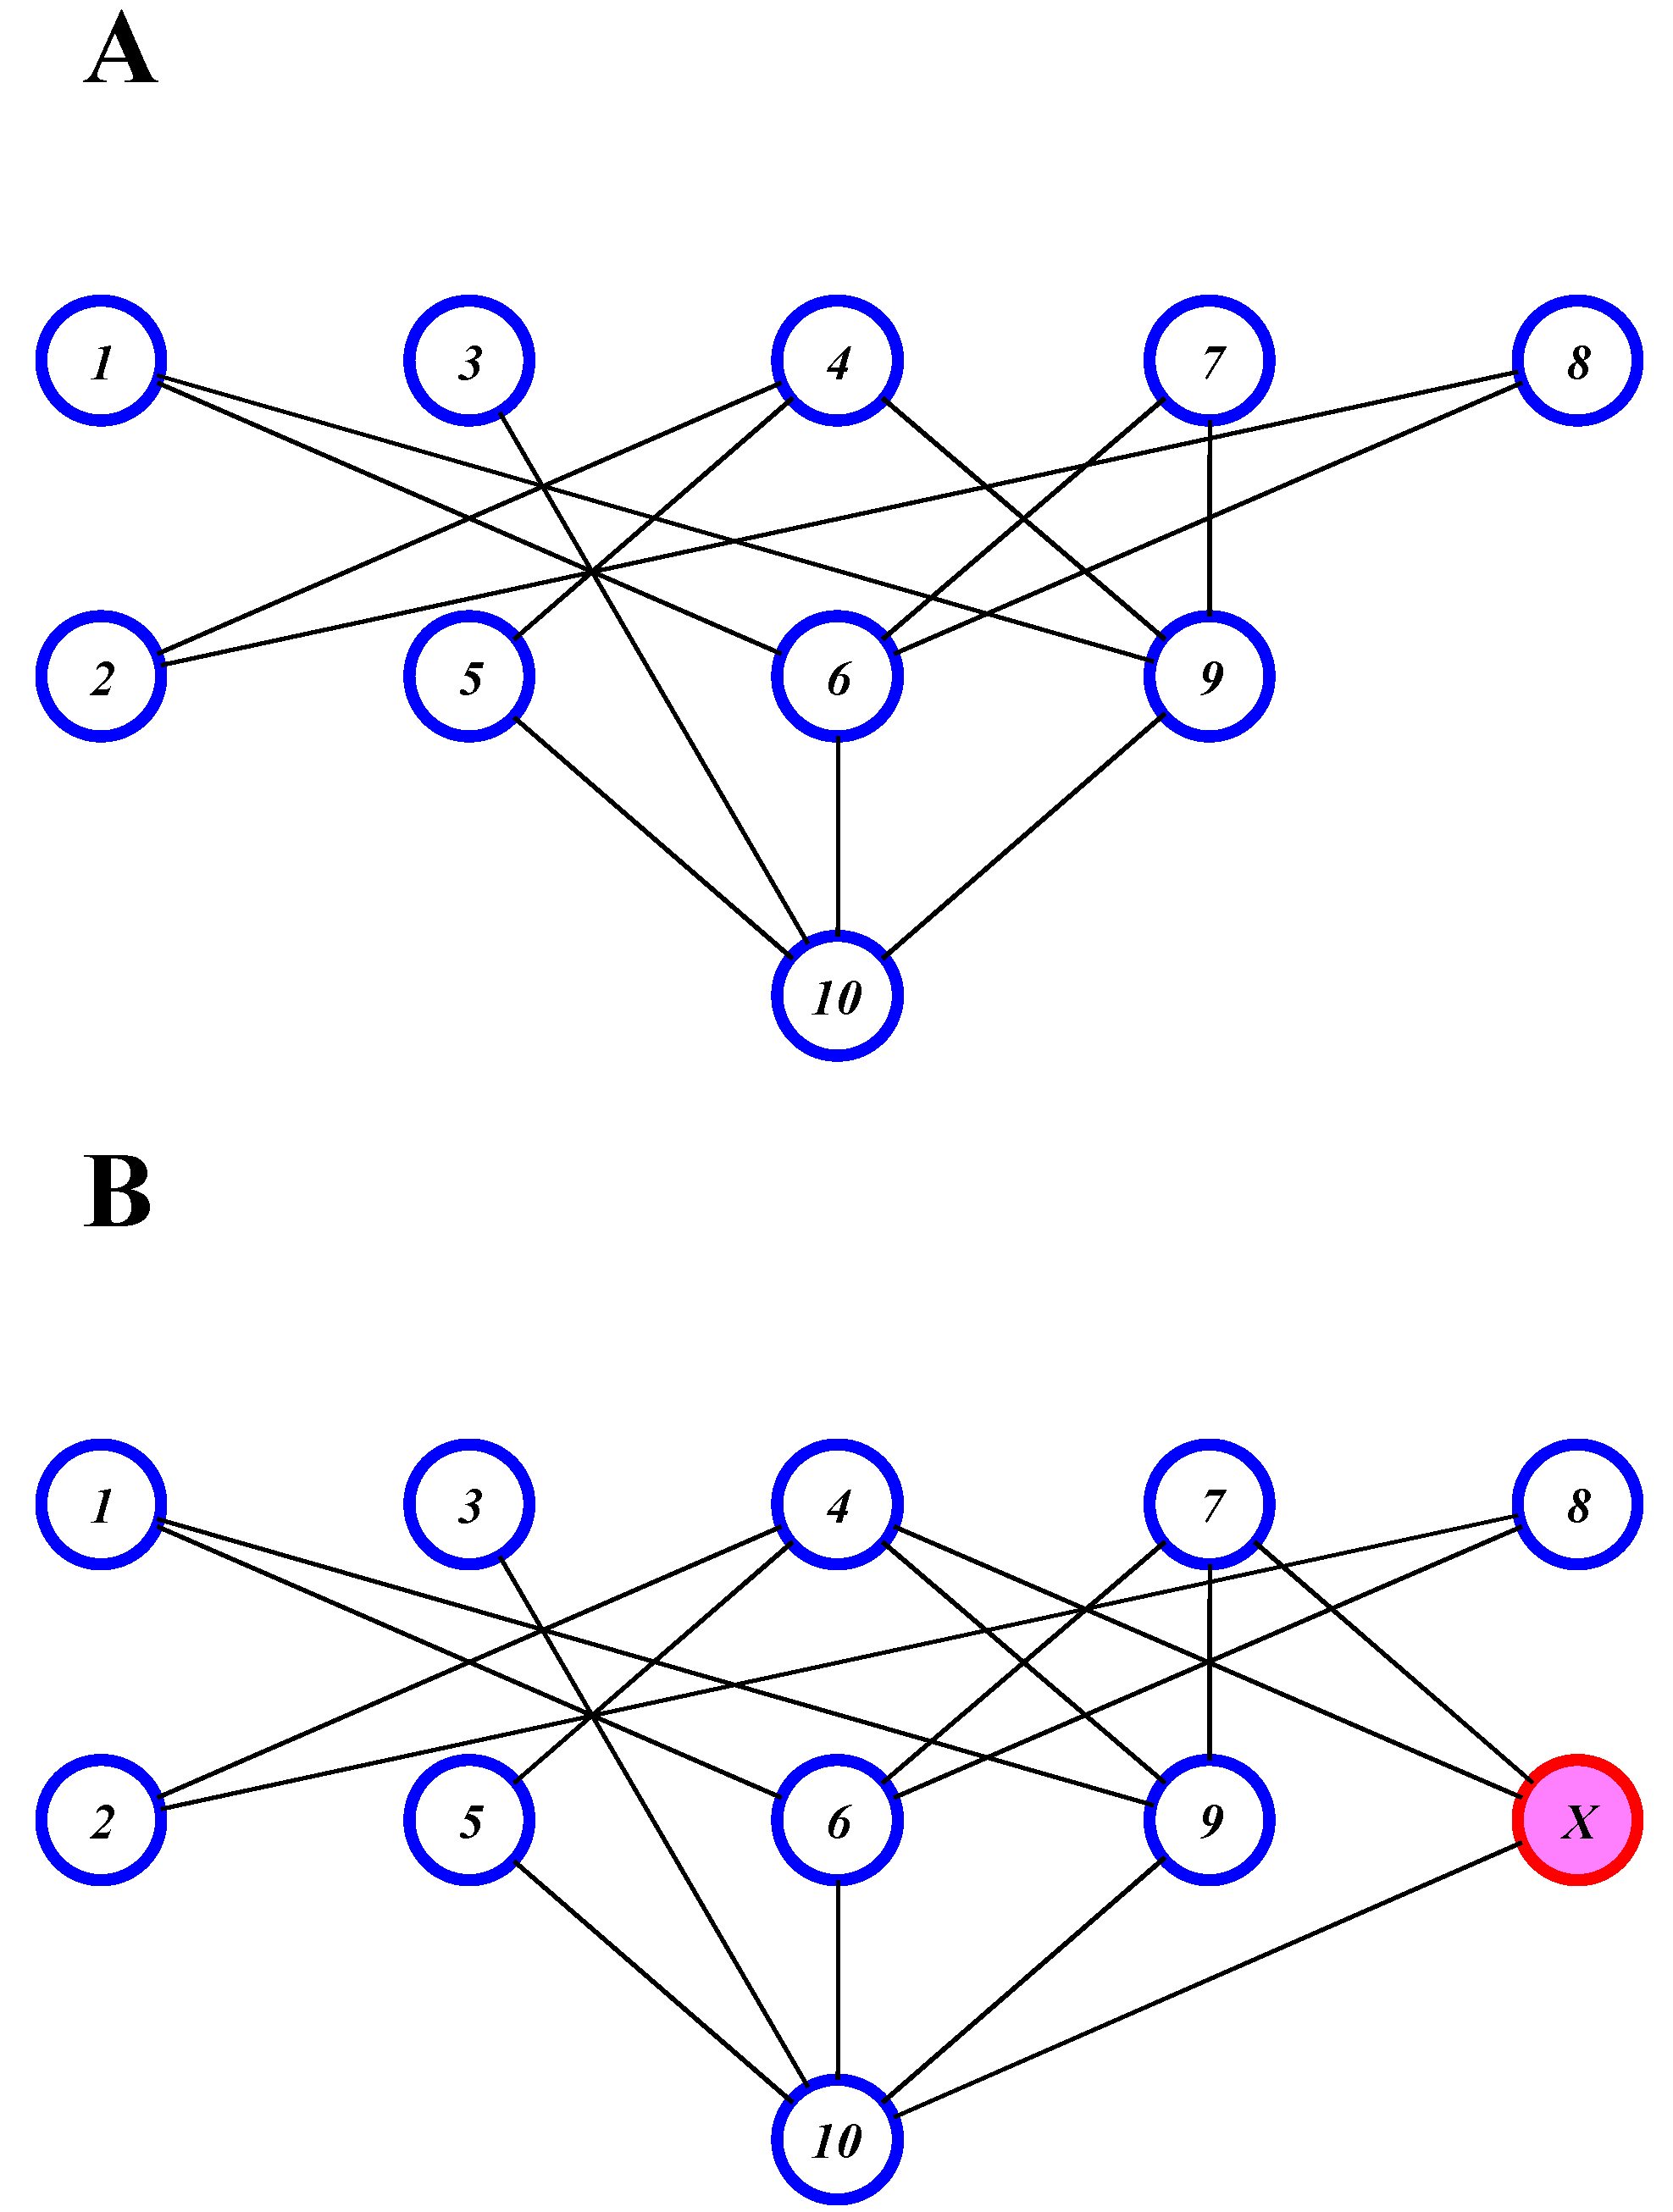
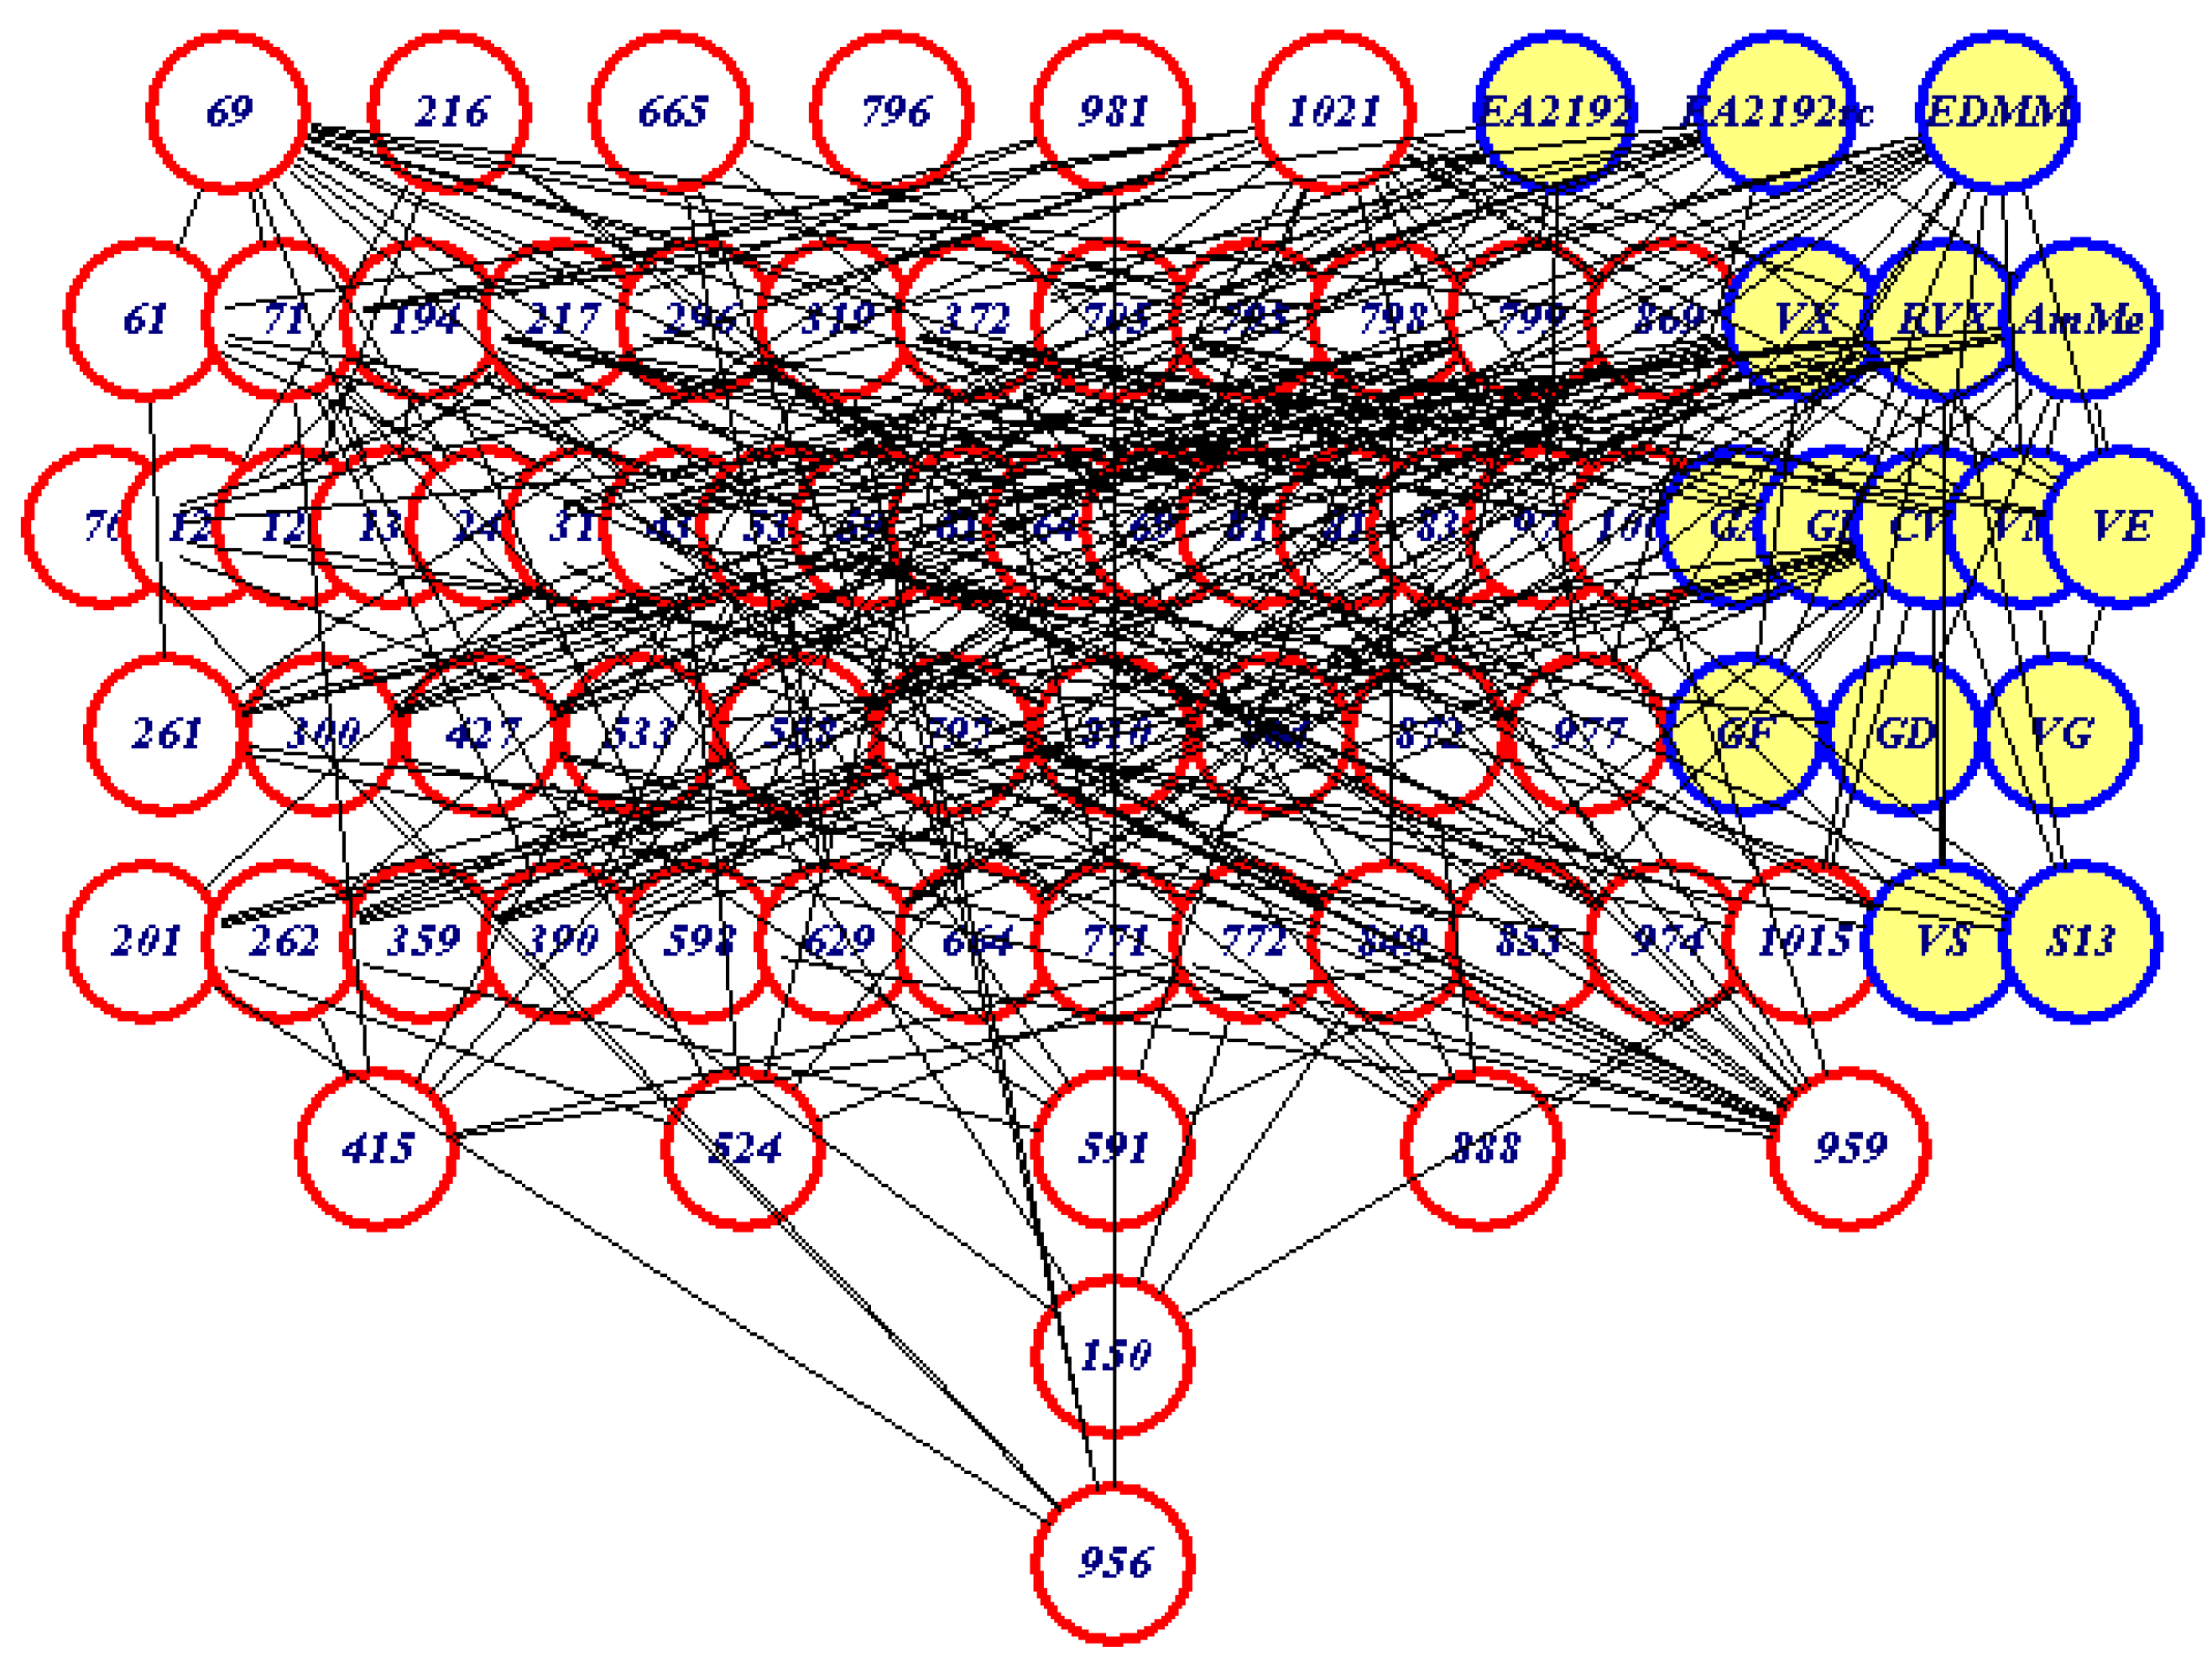
Partial Order Ranking
Linear extensions
Results and Discussion

| Compound | Average Rank Rkav | Acute Oral Toxicity (mg/kg) | Acute Percutaneous Toxicity (mg/kg) |
|---|---|---|---|
| Anilofos | 20.5 | 472 | >2000 |
| Azinphos methyl | 25.6 | 4 | 220 |
| Chlorfenvinphos | 9.6 | 24 | 31 |
| Chlorpyriphos methyl | 18.2 | 1630 | >3700 |
| Dialifos | 41 | 5 | na |
| Dicrotophos | 9.1 | 17 | 110 |
| Ditalimfos | 19.3 | 5660 | >2000 |
| Monocrotophos | 10.3 | 20 | 112 |
| Phosalone | 35.1 | 135 | >1500 |
| Phosmet | 21.9 | 160 | na |
| Phosphamidon | 6.2 | 17.9 | 374 |
| Pyraclofos | 18.9 | 237 | >2000 |
| VX | 5.3 | 0.088 | 0.1 |
Conclusions
References and Notes
- EINECS (European Inventory of Existing Commercial Chemical Substances). cf. European Commission 1967: Directive 67/548/EEC on the application of laws, regulations and administrative provisions relating to the classification, packaging and labeling of dangerous substances and the 6th amendment: Directive 79/831/EEC; art. 13.
- Niëmela, J. Working document on the availability of data for classification and labelling of chemical substances at the European market. 1994. [Google Scholar]
- Walker, J.D.; Carlsen, L.; Hulzebos, E.; Simon-Hettich, B. Government Applications of Analogues, SARs and QSARs to Predict Aquatic Toxicity, Chemical or Physical Properties, Environmental Fate Parameters and Health Effects of Organic Chemicals. SAR QSAR Environ. Res. 2002, 13, 607–619. [Google Scholar]
- Carlsen, L. A QSAR Approach to Physico-Chemical Data for Organophosphates with Special Focus on Known and Potential Nerve Agents. Submitted for publication.
- Carlsen, L. Partial Order Ranking of Organophosphates with Special Emphasis on Nerve Agents. Commun. Math. Comp. Chem.- MATCH. in press.
- Pollution Prevention (P2) Framework, EPA-758-B-00-001; may be obtained through the link 'P2 Manual 6-00.pdf' found at http://www.epa.gov/pbt/framwork.htm, US EPA
- FADINAP. Database on pesticide and the environment. http://www.fadinap.org/pesticide/.
- Connell, D.W.; Hawker, D.W. Use of polynomial expressions to describe the bioconcentration of hydrophobic chemicals in fish. Ecotox. Environ. Safety 1988, 16, 242–257. [Google Scholar]
- Davey, B.A.; Priestley, H.A. Introduction to Lattices and Order; Cambridge University Press: Cambridge, UK, 1990. [Google Scholar]
- Carlsen, L.; Sørensen, P.B.; Thomsen, M. Partial order ranking based QSAR’s: Estimation of solubilities and octanol-water partitioning. Chemosphere 2001, 43, 295–302. [Google Scholar]
- Brüggemann, R.; Pudenz, S.; Carlsen, L.; Sørensen, P.B.; Thomsen, M.; Mishra, R.K. The use of Hasse diagrams as a potential approach for inverse. QSAR. SAR QSAR Environ. Res. 2001, 11, 473–487. [Google Scholar]
- Carlsen, L.; Sørensen, P.B.; Thomsen, M.; Brüggemann, R. QSAR´s Based on Partial Order Ranking. SAR and QSAR Environ. Res. 2002, 13, 153–165. [Google Scholar]
- Carlsen, L.; Walker, J.D. QSARs for Prioritizing PBT Substances to Promote Pollution Prevention. QSAR Comb. Sci. 2003, 22, 49–57. [Google Scholar]
- Hasse, H. Über die Klassenzahl abelscher Zahlkörper; Akademie Verlag: Berlin, 1952. [Google Scholar]
- Halfon, E.; Reggiani, M.G. On the ranking of chemicals for environmental hazard. Environ. Sci. Technol. 1986, 20, 1173–1179. [Google Scholar]
- Brüggemann, R.; Halfon, E.; Welzl, G.; Voigt, K.; Steinberg, C.E.W. Applying the concept of partially ordered sets on the ranking of near-shore sediments by a battery of tests. J. Chem. Inf. Comput. Sci. 2001, 41, 918–925. [Google Scholar]
- Brüggemann, R.; Halfon, E.; Bücherl, C. Theoretical base of the program “Hasse”. GSF-Bericht 20/95; Neuherberg, 1995; the software may be obtained by contacting Dr. R. Brüggemann, Institute of Freshwater Ecology and Inland Fisheries, Berlin. [Google Scholar]
- Fishburn, P.C. On the family of linear extensions of a partial order. J. Combinat. Theory 1974, 17, 240–243. [Google Scholar]
- Graham, R.L. Linear Extensions of Partial Orders and the FKG Inequality. In Ordered Sets; Rival, I., Ed.; D. Reidel Publishing Company: Dordrecht (The Netherlands), 1982; pp. 213–236. [Google Scholar]
- Winkler, P.M. Average height in a partially ordered set. Discrete Mathematic. 1982, 39, 337–341. [Google Scholar]
- Winkler, P.M. Correlation among partial orders. Siam J Alg Disc Meth. 1983, 4, 1–7. [Google Scholar]
- Brüggemann, R.; Lerche, D.; Sørensen, P.B.; Carlsen, L. Estimation of average ranks by a local partial order model. J. Chem. Inf. Comput. Sci. 2004, 44, 618–625. [Google Scholar]
- Lerche, D.; Brüggemann, R.; Sørensen, P.; Carlsen, L.; Nielsen, O.J. A comparison of partial order technique with three methods of multi-criteria analysis for ranking of chemical substances. J. Chem. Inf. Comput. Sci. 2002, 42, 1086–1098. [Google Scholar]
© 2004 by MDPI (http://www.mdpi.org). Reproduction is permitted for noncommercial purposes.
Share and Cite
Carlsen, L. Giving Molecules an Identity. On the Interplay Between QSARs and Partial Order Ranking. Molecules 2004, 9, 1010-1018. https://doi.org/10.3390/91201010
Carlsen L. Giving Molecules an Identity. On the Interplay Between QSARs and Partial Order Ranking. Molecules. 2004; 9(12):1010-1018. https://doi.org/10.3390/91201010
Chicago/Turabian StyleCarlsen, Lars. 2004. "Giving Molecules an Identity. On the Interplay Between QSARs and Partial Order Ranking" Molecules 9, no. 12: 1010-1018. https://doi.org/10.3390/91201010
APA StyleCarlsen, L. (2004). Giving Molecules an Identity. On the Interplay Between QSARs and Partial Order Ranking. Molecules, 9(12), 1010-1018. https://doi.org/10.3390/91201010