
Structural and Thermal Characterization of Milled Wood Lignin from Bamboo (Phyllostachys pubescens) Grown in Korea


1
Department of Carbon Materials and Fiber Engineering, Jeonbuk National University, Jeonju 54896, Republic of Korea
2
Department of Wood Science and Technology, Jeonbuk National University, Jeonju 54896, Republic of Korea
*
Author to whom correspondence should be addressed.
Molecules 2024, 29(1), 183; https://doi.org/10.3390/molecules29010183
Submission received: 1 December 2023
/
Revised: 22 December 2023
/
Accepted: 26 December 2023
/
Published: 28 December 2023
(This article belongs to the Special Issue Polymer Composites: Chemical Synthesis and Applications)
Abstract
:The structural and thermal characterization of milled wood lignin (MWL) prepared from bamboo (Phyllostachys pubescens) grown in Korea was investigated, and the results were compared with bamboo MWLs from other studies. The C9 formula of the bamboo MWL was C9H7.76O3.23N0.02 (OCH3)1.41. The Mw and Mn of MWL were 13,000 and 4400 Da, respectively, which resulted in a polydispersity index (PDI) of 3.0. The PDI of the prepared MWL was higher than other bamboo MWLs (1.3–2.2), suggesting a broader molecular weight distribution. The structural features of MWL were elucidated using FT-IR spectroscopy and NMR techniques (1H, 13C, HSQC, 31P NMR), which indicate that MWL is of the HGS-type lignin. The major lignin linkages (β-O-4, β-β, β-5) were not different from other bamboo MWLs. The syringyl/guaiacyl ratio, determined from 1H NMR, was calculated as 0.89. 31P NMR revealed variations in hydroxyl content, with a higher aliphatic hydroxyl content in MWL compared to other bamboo MWLs. Thermal properties were investigated through TGA, DSC, and pyrolysis-GC/MS spectrometry (Py-GC/MS). The DTGmax of MWL under inert conditions was 287 °C, and the Tg of MWL was 159 °C. Py-GC/MS at 675 °C revealed a syringyl, guaiacyl, p-hydroxyphenyl composition of 17:37:47.
1. Introduction
According to the Food and Agriculture Organization (FAO), the annual rate of deforestation was estimated at 10 million ha between 2015 and 2020. Over the past three decades, an estimated 420 million ha of forest have been lost since 1990 [1]. This rampant forest destruction contributes to approximately 20% of global carbon emissions [2]. Moreover, the excessive use of wood has faced strong criticism due to the continuous depletion of forest resources worldwide [3]. As the world’s wood resources decline, there is a growing need for lignocellulosic biomass to replace them. Among these lignocellulosic biomass, bamboo is an emerging biomass that can replace wood because of its short production cycle and high amount of biomass per unit area. In addition, the remarkable regeneration capability and minimal maintenance requirements make bamboo an environmentally friendly alternative [3,4,5]. The Food and Agriculture Organization (FAO) reports that bamboo is widely grown in tropical and subtropical climatic zones, including in East, Southeast, and South Asia [6]. In historical China, bamboo found diverse applications, such as arrowheads, baskets, writing scrolls, pens, paper, boats, shoes, and construction materials [7]. In modern-day China, bamboo utilization spans various applications, including bamboo shoots, ceiling/flooring interiors, scaffolding, timber, furniture, and crafts [3,8]. According to China’s 9th National Forest Inventory, China’s bamboo forest area gradually increased from 2014 to 2018, with a total bamboo forest area of 6.73 million ha [6]. In this light, China’s research on bamboo remained active over these years. However, in Korea, bamboo consumption is declining, leading to the desolation of domestic bamboo forests [9]; hence, there has not been much research on bamboo in Korea.
Bamboo can be processed into a variety of products, including particleboards, plywood, laminated bamboo, bamboo composites, and bamboo fiber [10,11,12]. Truly, the utilization of bamboo is limited due to its hollow structure, and certain bamboo stems may not be affected by certain types of chemicals due to their waxy skin [13]. These impermeable properties may limit chemical treatment to improve mechanical properties for potential applications [3]. In addition to these problems, numerous obstacles still impede the efficient utilization of bamboo resources. Therefore, overcoming these hurdles requires further research efforts.
On the other hand, bamboo can be easily delignified compared to other woody biomass [14,15]. In other words, it offers the advantage of producing pulps, as well as lignin, more readily compared to other conventional methods. Additionally, bamboo lignin contains a substantial amount of p-hydroxyphenyl units, a feature nearly absent in softwood and hardwood lignins [16]. The high reactivity of this unit, with vacant positions at 3 and 5, is expected to significantly contribute to future lignin utilization.
In this study, the structural and thermal characteristics of lignin were investigated as a fundamental study for the future utilization of bamboo grown in Korea. In addition, the results obtained were compared with previously reported bamboo lignin.
2. Results and Discussion
2.1. Chemical Composition of Bamboo
Analysis of ash, extracts, carbohydrates, and lignin content was performed to determine the chemical composition of bamboo, and the results are shown in Table 1. The alkaline extract yield was approximately 30%, surpassing that of cold-water, hot-water, and organic solvent extracts. Li et al. [17] investigated changes in the maturation of bamboo (Phyllostachys pubescens). The ash, Klason lignin, holocellulose, and α-cellulose content were close to the reported values of 3-year-old bamboo culms.
2.2. Chemical and Structural Characterization of Bamboo MWL
2.2.1. Elemental Composition of MWL
The C, H, O, N, S, and OCH3 contents of MWL are shown in Table 2. The methoxyl content was estimated from the integration ratio of protons originating from aromatic rings and methoxyl groups in the 1H NMR, following the method outlined by Abreu [18]. The C, H, and O contents of the MWL prepared in this study were similar to MWL-A from Phyllostachys acuta. On the other hand, the C content of MWL was lower than that of MWL-X from an unknown bamboo species. The methoxyl content of MWL was found to be higher than the other two bamboo MWLs. This result may be due to the presence of fewer p-hydroxyphenyl (H) units, which have no methoxy groups, in the two bamboo lignins, as shown in Table 2 for comparison. In Table 3, the C9 molecular formula and formula weight of MWL and other bamboo MWLs are listed. The formula weight of MWL was approximately 214 Da, higher than that of the other two bamboo MWLs.
2.2.2. Molecular Weight (MW) Distribution, Average MW, and Polydispersity
The weight-average (w) and number-average (n) MW, along with the polydispersity index (PDI), of acetylated MWL (Ac-MWL), were determined using gel permeation chromatography (GPC). The MW distribution of Ac-MWL is illustrated in Figure 1, and the corresponding w, n, and PDI values are presented in Table 4. For comparison, data on previously reported bamboo MWLs are provided in Table 4. The w and n of Ac-MWL were approximately 13,000 Da and 4400 Da, respectively. The w of Ac-MWL prepared in this study was higher than that of all other bamboo MWLs. In addition, the PDI of Ac-MWL was also higher than that of all other bamboo MWLs, indicating a broader distribution of MW. The Mw, Mn, and PDI differed even from the same bamboo species. This result is likely attributed to the different climatic zones wherein the bamboo was grown, since the Korean-grown bamboo is from temperate regions and the Chinese-grown bamboo is from subtropical regions. The Korean-grown bamboo was believed to have thicker and more rigid culms to withstand colder temperatures and harsher climatic conditions. This robustness was thought to contribute to the greater strength and density of Korean-grown bamboo, potentially resulting in a higher Mw.
2.2.3. FT-IR Spectroscopy
FT-IR spectroscopy was conducted for the determination of functional groups in MWL. In Figure 2, the FT-IR spectrum of MWL is presented. The bands have been assigned according to the work of Faix [24], and the assignments are detailed in Table 5. The observed spectral features of MWL aligned with those of HGS-type lignins found in other bamboo MWLs [19,21,24]. Notably, the band at 834 cm−1, corresponding to C–H out-of-plane vibrations in H units, along with a characteristic shoulder at 1160 cm−1—typical for HGS type—was observed. In addition, the C=O stretching related to unconjugated ketone, carbonyl, and ester groups was assigned at 1718 cm−1, aromatic skeleton vibrations at 1594, 1503, and 1419 cm−1, syringyl (S)-related bands at 1130 and 1123 cm−1, and guaiacyl (G)-related bands at 1330, 1266, 1222, and 1033 cm−1.
2.2.4. 1H NMR Analysis
The 1H NMR spectrum of Ac-MWL is presented in Figure 3. The aromatic region (7.20–6.25 ppm) revealed the presence of G and S phenylpropane (C9) units. The aliphatic content was higher than the aromatic content.
Signal assignments in the 1H NMR spectrum of Ac-MWL are listed in Table 6, based on literature data [25,26]. To estimate the distribution of protons per C9 structural unit in Ac-MWL, integration ratios and their C9 molecular formulas were used [27]. The methoxyl content in the C9 molecular formula for MWL was 1.41, multiplied by 3 to yield 4.23—the total number of protons in the methoxyl groups. Integration values for other structural components were normalized to the methoxyl protons in a single C9 unit. However, certain quantitative conclusions cannot be drawn due to overlapping signals, carbohydrate inclusions, and uncertainties in range assignments.
The arylglycerol β-O-4 aryl ether linkage (6.25–5.75 ppm, 4.90–4.30 ppm) is the main intermonomeric linkage found in native lignin [25]. The Hα and Hβ contents from Ac-β-O-4 structures were highest among the linkages. The aromatic protons per C9 unit for Ac-MWL were determined to be 0.93 for S units and 1.05 for G units. The S/G molar ratio of MWL based on 1H NMR was determined to be 0.89.
To ascertain the number of aliphatic and phenolic hydroxyl groups per C9 unit, corresponding acetyl group signals (2.50–1.60 ppm) were examined. The Oac/OCH3 mole ratio was calculated as (0.76 + 4.38)/4.23, resulting in 1.22. Consequently, the total Oac/C9 ratio was determined as (1.41 OCH3) × (1.22 Oac/1 OCH3), yielding 1.72. The number of aliphatic Oac/OCH3 was calculated as (1.41 OCH3/C9) × (4.38 Oac/4.23 OCH3), resulting in 1.46, while the number of phenolic Oac/OCH3 was calculated as (1.41) × (0.76/4.23), resulting in 0.25. Therefore, the estimated number of aliphatic and phenolic hydroxyl groups per 100 C9 units of MWL was 146 and 25, respectively.
2.2.5. 13C NMR Analysis
The structural features and linkages within MWL were further elucidated through 13C NMR analysis. In Figure 4, the 13C NMR spectrum of MWL is presented, and Table 7 provides the chemical shifts along with their assignments based on previously reported works [16,21,28,29]. The NMR spectrum was divided into four regions: C=O, aromatic, side chain, and aliphatic.
The signals at positions 1 and 2 correspond to carbonyl groups in MWL. Signals at positions 25, 26, 31, 32, and 33 were attributed to residual carbohydrates, which likely originated from impurities such as traces of hemicelluloses associated with some MWL substructures. The intense signal at position 40 is indicative of OCH3 in both S and G units.
In the aromatic region (166 to 103 ppm) of the spectrum, several peaks were assigned to S, G, and H units. For S units: C-3/C-5 etherified (6), C-5 nonetherified (8), C-4 etherified (10), C-1 etherified and C-4 nonetherified (11), C-1 nonetherified (14), C-2/C-6 with α-carbonyl (22), C-2/C-6 (23, 24). For G units: C-4 etherified and C-3 etherified G with α-carbonyl (7), C-3 (8), C-4 nonetherified (9), C-1 etherified (12), C-1 nonetherified (13), C-6 (18), C-5 (20), C-2 (21). For H units: C-4 (4), C-2/C-6 (16), and C-3/C-5 (20). Additionally, six peaks were assigned to C-9 (3), C-4 (5), C-2/C-6 (15), C-1 (17), C-3/C-5 (19), and C-8 (20) in p-coumaric ester (p-CE). The NMR analysis indicated that a considerable amount of p-coumaric acid (p-CA) is etherified at the γ-position [21,30,31,32,33]. The 13C NMR results confirmed that MWL is an HGS-type lignin, consistent with the FT-IR results.
The etherified S/nonetherified S unit ratio was estimated based on the peak height ratio at 152.2/147.1 ppm, while the etherified G/nonetherified G ratio was derived from resonance ratios at 149.4/145.5 ppm [34]. The values of etherified S/nonetherified S (4.4) and etherified G/nonetherified G (1.5) suggested a greater involvement of S units in ether linkages with other lignin units compared to G structures. This finding agrees with previously reported results [21,34].
In the side chain region (87 to 57 ppm) of the spectrum, several peaks were assigned to β-O-4, β-β resinol, β-1, and β-5. For β-O-4: C-α (33, 34), C-β (28, 30), C-γ (39), C-γ in β-O-4 with α-carbonyl (38); for β-β: C-α (29), C-γ (35), C-4 (23); for β-1: C-α (32); and for β-5: C-α (27), C-γ (37, 38). No notable differences were observed in the 13C NMR results of MWL compared to other bamboo MWLs.
Since MWL is a macromolecule, some overlapping signals were observed in the 13C NMR spectrum. Therefore, 2D HSQC NMR analysis was performed to enhance spectral resolutions in intercoupling bonds and linkages within lignin substructures.
2.2.6. 2D HSQC NMR Analysis
Figure 5 depicts the side chain (120–70/5.0–3.0 ppm) and aromatic (160–100/8.0–6.0 ppm) regions of MWL in the HSQC spectrum. The aliphatic region was excluded from the discussion, as notable information was not provided. Cross-signals and their assignments, derived from previously reported works by Wen et al. [21,35,36], are shown in Table 8. The substructures present in MWL, along with their corresponding notations, are presented in Figure 6.
In the side chain region (Figure 5a), β-O-4 (A), β-β resinol (B), and β-5 phenylcoumarans (C) moieties were detected. For β-O-4 moieties, Cα–Hα (Aα) at 72.8/4.85 and Cγ–Hγ (Aγ) at 60.2/3.38–3.89 were observed. Cβ–Hβ in β-O-4 substructures linked to a G/H unit (Aβ(G/H)) and S unit (Aβ(S)) were at 84.6/4.26 and 86.6/4.10 ppm, respectively. The signals at 85.8/4.64 and 54.1/3.04 were assigned to Cα–Hα (Bα) and Cβ–Hβ (Bβ), respectively, whereas 71.8/4.16 and 72.1/3.80 were assigned to Cγ–Hγ (Bγ) in β-β moieties. For β-5 moieties, Cβ–Hβ (Cβ) at 51.5/3.70 and Cγ–Hγ (Cγ) at 62.8/3.73 were observed. The signals of methoxyl and the β-O-4 moiety were prominent in this region. Additionally, the signal at 63.3/4.11 ppm was assigned to Cγ–Hγ in p-hydroxycinnamyl alcohol end-groups (Fγ). Carbohydrate-associated signals were also found, including signals from β-D-xylopyranoside moieties (X2, X3, X4) and 2-O- and 3-O-acetyl-β-D-xylopyranoside moieties (X22, X33), as reported by Kim and Ralph [37] and Wen et al. [35,36].
In the aromatic region (Figure 5b), signals from S, G, and H moieties were highly visible. S moieties (S2,6, S′2,6′, and S″2,6) were in the range of 104.8–107.2/7.30–6.69 ppm. G moieties were situated at 111.9/6.97, 115.4/6.68, and 129.8/6.80 ppm for C2–H2, C5–H5, and C6–H6, respectively. H moieties were observed at 113.8/6.67 ppm for C3,5–H3,5 and 128.3/7.17 ppm for C2,6–H2,6. Additionally, three cross signals were assigned to C3,5–H3,5 (116.1/6.78 ppm), C8–H8 (116.2/6.26 ppm), and C2,6–H2,6 (130.6/7.48 ppm) in p-CE. The HSQC NMR results confirmed MWL as an HGS-type lignin, consistent with the FT-IR and 13C NMR results. Signals related to spirodienone, ferulate, and cinnamaldehyde end-groups were observed in bamboo MWL from P. pubescens grown in China [21], but not in bamboo MWL grown in Korea.
2.2.7. 31P NMR Analysis
The hydroxyl and carboxyl content of MWL were determined using the 31P NMR method based on Argyropoulos et al. [38], which allows the quantification of different types of hydroxyl groups, including aliphatic and phenolic hydroxyl groups, as well as G, S, H, and C5 condensed phenolic hydroxyl groups. In Figure 7a, the full 31P NMR spectrum of phosphitylated MWL is presented, and Figure 7b shows the enlarged hydroxyl group region of interest (150–134 ppm). A sharp peak at 174 ppm was attributed to the excess amount of unreacted TMDP, indicating the complete derivatization of all hydroxyl groups in MWL.
The aliphatic and phenolic (C5-substituted + S, G, and H) hydroxyl, and carboxyl contents of MWL, calculated from the 31P NMR result, are listed in Table 9. The hydroxyl content was compared to other bamboo MWLs based on published data [23,39]. For MWL, the total hydroxyl content was found to be 8.19 mmol/g MWL. The hydroxyl group of the H units was similar in all bamboo MWLs. The aliphatic and total hydroxyl contents in MWL were notably higher, while the C5-substituted+S content was lower compared to MWL-Y and MWL-N. The carboxyl content of MWL was determined to be 0.23 mmol/g MWL, close to MWL-N and slightly lower than MWL-Y.
2.3. Thermal Characterization of Bamboo MWL
2.3.1. TGA
TGA is widely employed for examining the thermal behavior and thermal and thermo-oxidative stability of lignin. Figure 8a,b show the thermogravimetric (TG) and derivative TG (DTG) curves of MWL, respectively, under oxidative and inert conditions. In the TG and DTG curves, two crucial temperatures are observed. The onset temperature marks the point at which decomposition begins, indicating the initiation of gas release during thermal oxidation or pyrolysis experiments. The other temperature, DTGmax, represents the point at which maximum thermal degradation occurs and is considered a parameter for determining the thermal stability of lignins [40].
The decomposition process of the lignin sample can be divided into several stages. In the initial stage before 120 °C, the weight loss is attributed to the evaporation of moisture remaining in the lignin samples [41] and low MW volatiles. Under oxidative conditions at 120 °C, a weight loss of 1.9% in MWL was noted (Table 10). The onset temperature was 234 °C and DTGmax was 544 °C. The weight losses at 400 °C and 500 °C were approximately 43% and 65%, respectively. There were no weight changes beyond 590 °C, and the ash content obtained at 800 °C was 0.3%.
Under inert conditions at 120 °C, a weight loss of 1.8% in MWL was observed (Table 10). The onset temperature of MWL was found to be 235 °C, nearly the same as that of oxidative condition (234 °C). In the 200–400 °C region of the DTG curve, two major bands were observed at 287 °C and 370 °C (Figure 8b). The weight loss in this region is attributed to the cleavage of interunit linkages in lignin, releasing monomeric phenols into the vapor phase [42]. Specifically, the peak at 287 °C signifies the degradation of aliphatic side chains, particularly the scission of β-O-4 ether linkages, while the peak at 370 °C indicates the degradation of methoxyl groups [43], based on information regarding gases released during pyrolysis [44]. Between 400 and 600 °C, the weight loss is primarily attributed to the decomposition or condensation of the aromatic ring [42,45]. The weight losses at 400 °C and 500 °C were approximately 11% and 36%, respectively. MWL underwent continuous carbonization at temperatures ranging from 600 to 800 °C, with a residual content of 28.7% at 800 °C.
In Table 10, the DTGmax and residual content of other bamboo MWLs are presented in comparison to MWL. The DTGmax of MWL was lower (287 °C) than that of other bamboo MWLs (360 and 367 °C). This difference may be attributed to higher S unit content. The residue content of MWL was higher than MWL-Y and lower than MWL-N.
Furthermore, under inert conditions, the DTGmax (287 °C) was lower than that obtained under oxidative conditions (544 °C). This can be attributed to the difficulty involved in degrading oxidized condensed aromatic moieties [43].
2.3.2. DSC
The thermal behavior of MWL, expressed as heat flow with respect to temperature, was determined over the range of 20–240 °C. In Figure 9, the 1st heating, cooling, and 2nd heating cycles of MWL are illustrated. During the 1st heating cycle, the thermal history of MWL, i.e., moisture absorbed during storage conditions, residual solvents, and drying methods, was removed. Upon reaching 240 °C, a temperature exceeding its melting transition, MWL was allowed to cool at 20 °C. An exothermic peak observed during the cooling cycle indicated the solidification of the lignin melt. The 2nd heating cycle reveals the true thermal behavior of the sample and is known to provide a reliable estimate of the glass transition temperature (Tg). Tg is an important transition temperature, at which amorphous polymers shift from a glassy to a rubbery state. In the 2nd heating cycle, the Tg of MWL was determined to be 159 °C.
2.3.3. Pyrolysis GC/MS (Py-GC/MS)
Py-GC/MS was conducted at 675 °C to analyze the composition of MWL. The choice of pyrolysis temperature was based on TGA, where 675 °C was selected due to its minimal observed weight change. Compound identification was achieved by comparing mass spectra with published data from NIST and Wiley libraries [46,47], along with bamboo Py-GC/MS data [20,22,48]. The pyrogram of MWL is shown in Figure 10, and the resulting pyrolysis products with their relative compositions are listed in Table 11. Sixteen monolignol compounds were identified during pyrolysis at 675 °C, encompassing typical H-, G-, and S-related pyrolysis products. The pyrolysis products of MWL were categorized into three groups: H lignin derivatives (peaks 1, 2, 4, 6), G lignin derivatives (peaks 3, 5, 8, 10, 11, 12, 13), and S lignin derivatives (peaks 7, 9, 14, 15, 16). The major pyrolysis products released were 4-vinylphenol (6), 4-vinylguaiacol (8), guaiacol (3), syringol (9), and 4-methylphenol (2). These five major pyrolysis products constituted 68% of the total relative composition of MWL. Among them, 4-vinylphenol was the most abundant, accounting for approximately 30% of the total relative composition, consistent with previously reported findings from Saiz-Jimenez and De Leeuw [48] and Li et al. [20]. The S:G:H composition of MWL was determined to be 16:37:47. The calculated S/G ratio for MWL was 0.43, aligning with a previously published result (0.4) from Bai et al. [22]. The S/G ratio derived from Py-GC/MS differed from the S/G ratios obtained through 1H NMR (0.89). However, both methods concurred that the S content was lower than the G content.
3. Materials and Methods
3.1. Materials
The bamboo powder, prepared from a 2–3-year-old bamboo (P. pubescens) culm, was supplied by Songjuk Industry, located in Hamyang, Gyeongnam, Republic of Korea. The bamboo powder was air dried at room temperature for a week, 40 mesh passed powders were used.
The reagents, sodium hydroxide (NaOH, 93%), sodium chlorite (NaClO2, 78%), ethanol (HPLC grade), benzene (EP), acetic anhydride (EP), and tetrahydrofuran (THF, 99.9%) were purchased from Duksan Pure Chemical (Seoul, Republic of Korea). Anhydrous ethyl ether (EP) and acetic acid (EP) were purchased from Samchun Chemical (Seoul, Republic of Korea). 1,2-dichloroethane (GR) and sulfuric acid (H2SO4, 93%), were purchased from Duksan Pharmaceutical (Sangju-si, Republic of Korea) and Daejung Chemicals & Metals (Siheung, Republic of Korea), respectively. 1,4-Dioxane (HPLC grade) was purchased from Wako Chemical (Tokyo, Japan), anhydrous pyridine (GR) from Kanto Chemical (Tokyo, Japan), toluene (HPLC grade) from Fisher-Scientific Korea (Seoul, Republic of Korea), chloroform-d (CDCl3) and dimethyl sulfoxide-d6 (DMSO-d6) from Eurisotop (Saint-aubin-des-bois, France), N-hydroxy-5-norbornene-2,3-dicarboximide (NHND, 97%) from AlfaAesar (Heysham, UK), chromium (III) acetylacetonate (97%) from AlfaAesar (Ward Hill, MA, USA), and 2-chloro-4,4,5,5-tetramethyl-1,3,2-dioxaphospholane (TMDP, 95%) from Sigma-Aldrich (St. Louis, MO, USA). All reagents and solvents were used without further purification. Molecular sieves (pore diameter 4Å, 1.6 mm pellet) were purchased from Yakuri Pure Chemicals (Tokyo, Japan).
3.2. Chemical Composition of Bamboo
The ash, extracts, and lignin were measured following TAPPI test methods [49,50,51,52,53,54]. Acid-soluble lignin was determined in accordance with the TAPPI standard method UM 250 [54], using an absorption coefficient of 110 L/g·cm. Holocellulose content was determined using the Wise method [55], and α-cellulose was determined using the TAPPI test method T203 om-83 [56]. Hemicellulose content was calculated by subtracting the α-cellulose value from the holocellulose value.
3.3. Preparation of MWL
The thoroughly dried, extractive-free bamboo powder was used for the preparation of MWL. Six grams of bamboo powder were placed in a 500-mL stainless-steel jar and filled with toluene. The jar, containing the sample, was then mounted on a vibratory ball mill and treated for 100 h. After milling, the MWL was isolated and purified according to the Björkman method [57].
3.4. Elemental Analysis
The MWL was vacuum dried under P2O5 at ambient temperature for 24 h prior to elemental analysis. C, H, O, N, and S analyses were performed using an Elemental Analyzer (IT/Flash 2000, Thermo Fisher Scientific, Waltham, MA, USA) at the Center for University-wide Research Facility, Jeonbuk National University (CURF, JBNU).
3.5. Acetylation of MWL
For the acetylation, 50 mg of MWL was dissolved in 1 mL of pyridine and 1 mL of acetic anhydride. The reactions of quenching, filtering, washing, and drying were carried out in the same manner as described by Mun et al. [58]. The acetylated MWL was designated as Ac-MWL.
3.6. Determination of MW
The average MW of MWL was determined by gel permeation chromatography (GPC). One milligram of Ac-MWL was dissolved in 1 mL of THF in a 10-mL conical beaker. The beaker was sonicated for 5 s and then filtered through a 0.45 μm PTFE syringe filter (Chemco Scientific, Seoul, Republic of Korea). The filtrate was transferred into a 2-mL vial and diluted 2 times with THF. The GPC (Waters, Milford, MA, USA) was conducted at CURF under the conditions shown in Table 12.
3.7. FT-IR Spectroscopy
FT-IR analysis was conducted utilizing a diamond attenuated total reflectance (ATR) accessory on an FT-IR spectrophotometer (Frontier, Perkin Elmer, Shelton, CT, USA), equipped with a deuterated triglycine sulfate (DTGS) detector. The spectrum was acquired in the wavelength range of 4000–500 cm⁻¹ with a resolution of 4 cm⁻¹. The analysis was performed at the CURF, JBNU.
3.8. 1H NMR Analysis
Ten milligrams of the Ac-MWL sample was dissolved in 0.4 mL of CDCl3 in a 10-mL conical beaker. The beaker was sonicated for 1–2 min to dissolve the sample. The mixture was filtered through a fine glass wool suspended inside a Pasteur pipette, which was directly connected to a clean NMR tube. The conical beaker was rinsed with additional 0.3 mL of CDCl3 and the contents were transferred as described in a previous filtration method. The measurement was conducted using the NMR spectrometer (500 MHz FT-NMR, JNM-ECZ500R, JEOL, Tokyo, Japan) at the CURF, JBNU.
3.9. 13C and 2D HSQC NMR Analysis
A 120 mg MWL was placed into a 5-mL vial and vacuum dried under P2O5 at ambient temperature for 24 h before sample preparation. The moisture-free MWL was dissolved at 0.75 mL DMSO-d6 at 50 °C. The filtration was carried out in the same manner as for 1H NMR samples mentioned above. The 13C and HSQC NMR analyses were conducted using an NMR spectrometer (600 MHz, JEOL, Tokyo, Japan) at the CURF, JBNU.
3.10. 31P NMR Analysis
The hydroxyl and carboxyl group content of MWL was determined through 31P NMR analysis following the procedure outlined by Argyropoulos et al. [38]. The sample was prepared using pyridine/CDCl3 (1.6:1 v/v) solvent with an internal standard NHND, a relaxation agent (chromium (III) acetylacetonate), and a phosphitylating agent (TMDP). Throughout the process, maintaining a moisture-free condition was crucial. The 31P NMR analysis was conducted using an NMR spectrometer (600 MHz, JEOL, Tokyo, Japan) at the CURF, JBNU. The spectrum was obtained using an inverse-gated decoupling pulse sequence, a 10 s relaxation delay, and 64 scans.
3.11. TGA
A 4–8 mg MWL was placed in a standard aluminum pan and secured in a thermogravimetric analyzer (Q600 SDT, TA Instruments). The sample was heated from 20 to 800 °C at 10 °C/min under nitrogen and oxidative conditions. TGA was performed at the CURF, JBNU.
3.12. DSC
A 2–6 mg MWL was loaded in a standard aluminum pan, and the heat flow was measured by a differential scanning calorimeter (DSC Q20, TA Instruments, New Castle, DE, USA). The sample was heated from 40 to 240 °C at 10 °C/min under a nitrogen atmosphere. The sample was cooled to 40 °C. The sample was again heated to 240 °C at the same heating rate. The glass transition temperature (Tg) was estimated from the second heating cycle. DSC was performed at the CURF, JBNU.
3.13. Pyrolysis GC/MS (Py-GC/MS)
4. Conclusions
The MWL prepared from bamboo grown in Korea was investigated through several structural and thermal characterization techniques, and the results were compared with other bamboo MWLs grown in China. The distinct difference observed in MWL was that it had a higher average molecular weight and a broader molecular weight distribution compared to other bamboo MWLs. Various spectroscopic analyses showed that the MWL was a typical grass lignin but exhibited a very high aliphatic hydroxyl content compared to other bamboo lignins. The MWL also had a considerably lower DTGmax (287 °C), which indicated that there were more β-O-4 ether linkages. Through this research on lignin from bamboo grown in Korea, the authors were able to obtain fundamental data on the structural and thermal characteristics of domestic bamboo, and it was confirmed that there were some structural differences from bamboo grown in temperate and subtropical regions.
Author Contributions
Investigation, formal analysis, writing—original draft preparation, J.-S.M.; conceptualization, investigation, writing—review and editing, supervision, funding acquisition, S.-P.M. All authors have read and agreed to the published version of the manuscript.
Funding
This research was supported by the Technology Innovation Program through the Korea Evaluation Institute of Industrial Technology (KEIT), funded by the Ministry of Trade, Industry, and Energy (MOTIE, Republic of Korea) (Carbon Innovation Stars Program, grant no. 20018304).
Institutional Review Board Statement
Not applicable.
Informed Consent Statement
Not applicable.
Data Availability Statement
The data presented in this study are available in article.
Acknowledgments
The authors would like to appreciate the technical assistance provided by the CURF, JBNU.
Conflicts of Interest
The authors declare no competing interests.
References
- Food and Agriculture Organization of the United Nations. The State of the World’s Forests. Available online: https://www.Fao.org/3/ca8642en/online/ca8642en.html (accessed on 15 December 2023).
- Climate Change 2007: The Physical Science Basis; Contribution of Working Group I Contribution to the Fourth Assessment Report of the Intergovernmental Panel on Climate Change; Cambridge University Press: Cambridge, UK, 2007.
- Dlamini, L.C.; Fakudze, S.; Makombe, G.G.; Muse, S.; Zhu, J. Bamboo as a valuable resource and its utilization in historical and modern-day China. BioResources 2022, 17, 1926–1938. [Google Scholar] [CrossRef]
- Chaowana, P. Bamboo: An alternative raw material for wood and wood-based composites. J. Mater. Sci. Res. 2013, 2, 90–102. [Google Scholar] [CrossRef]
- Li, W.; He, S. Research on the utilization and development of bamboo resources through problem analysis and assessment. IOP Conf. Ser. Earth Environ. Sci. 2019, 300, 052028. [Google Scholar] [CrossRef]
- Lobovikov, M.; Paudel, S.; Piazza, M.; Ren, H.; Wu, J. World Bamboo Resources: A Thematic Study Prepared in the Framework of the Global Forest Resources Assessment 2005; Food and Agriculture Organization (FAO): Rome, Italy, 2007. [Google Scholar]
- Yeromiyan, T. The Culture and History of Chinese Bamboo, The Chinese Language Institute. Available online: https://studycli.org/chinese-culture/chinese-bamboo (accessed on 17 August 2023).
- Nirmala, C.; Bisht, M.S.; Bajwa, H.K.; Santosh, O. Bamboo: A rich source of natural antioxidants and its applications in the food and pharmaceutical industry. Trends Food Sci. Technol. 2018, 77, 91–99. [Google Scholar] [CrossRef]
- National Institute of Forest Science (NIFoS). Distribution Status of Bamboo Forest Resources in Korea; National Institute of Forest Science: Seoul, Republic of Korea, 2016. [Google Scholar]
- Sharma, B.; Gatóo, A.; Bock, M.; Ramage, M. Engineered bamboo for structural applications. Constr. Build. Mater. 2015, 81, 66–73. [Google Scholar] [CrossRef]
- Liu, X.; Smith, G.D.; Jiang, Z.; Bock, M.C.D.; Boeck, F.; Frith, O.; Gatóo, A.; Liu, K.; Mulligan, H.; Semple, K.E.; et al. Nomenclature for engineered bamboo. BioResources 2016, 11, 1141–1161. [Google Scholar] [CrossRef]
- Nayak, L.; Mishra, S.P. Prospect of bamboo as a renewable textile fiber, historical overview, labeling, controversies and regulation. Fash. Text. 2016, 3, 2. [Google Scholar] [CrossRef]
- Okokpujie, I.P.; Akinlabi, E.T.; Fayomi, O.O. Assessing the policy issues relating to the use of bamboo in the construction industry in Nigeria. Heliyon 2020, 6, e04042. [Google Scholar] [CrossRef]
- Hidayati, S.; Suroso, E.; Satyajaya, W.; Iryani, D.A. Chemistry and structure characterization of bamboo pulp with formacell pulping. IOP Conf. Ser. Mater. Sci. Eng. 2019, 532, 012024. [Google Scholar] [CrossRef]
- Bonfatti Júnior, E.A.; Lengowski, E.C.; de Andrade, A.S.; Venson, I.; Klock, U.; da Silva Júnior, F.G.; Gonçalez, J.C.; de Muñiz, G.I.B. Bamboo kraft pulping. Adv. For. Sci. 2019, 6, 791–796. [Google Scholar] [CrossRef]
- Nimz, H.H.; Robert, D.; Faix, O.; Nemr, M. 13C NMR spectra of lignins, 8. Structural differences between lignins of hardwoods, softwoods, grasses and compression wood. Holzforschung 1981, 35, 16–26. [Google Scholar] [CrossRef]
- Li, X.B.; Shupe, T.F.; Peter, G.F.; Hse, C.Y.; Eberhardt, T.L. Chemical changes with maturation of the bamboo species Phyllostachys pubescens. J. Trop. For. Sci. 2007, 19, 6–12. [Google Scholar]
- Abreu, H.D.S.; Freire, M.D.F.I. Methoxyl content determination of lignins by 1H NMR. Ann. Acad. Bras. Ciênc. 1995, 67, 379–382. [Google Scholar]
- Li, M.F.; Sun, S.N.; Xu, F.; Sun, R.C. Formic acid based organosolv pulping of bamboo (Phyllostachys acuta): Comparative characterization of the dissolved lignins with milled wood lignin. Chem. Eng. J. 2012, 179, 80–89. [Google Scholar] [CrossRef]
- Li, X.; Chen, C.Z.; Li, M.F. Structural Characterization of bamboo lignin isolated with formic acid and alkaline peroxide by gel permeation chromatography and pyrolysis gas chromatography mass spectrometry. Ann. Chromatogr. Sep. Tech. 2015, 1, 1006. [Google Scholar] [CrossRef]
- Wen, J.L.; Sun, S.L.; Xue, B.L.; Sun, R.C. Quantitative structural characterization of the lignins from the stem and pith of bamboo (Phyllostachys pubescens). Holzforschung 2013, 67, 613–627. [Google Scholar] [CrossRef]
- Bai, Y.Y.; Xiao, L.P.; Shi, Z.J.; Sun, R.C. Structural variation of bamboo lignin before and after ethanol organosolv pretreatment. Int. J. Mol. Sci. 2013, 14, 21394–21413. [Google Scholar] [CrossRef]
- Zhang, Y.C.; Qin, M.H.; Xu, W.Y.; Fu, Y.J.; Wang, Z.J.; Li, Z.Q.; Willför, S.; Xu, C.L.; Hou, Q.X. Structural changes of bamboo-derived lignin in an integrated process of autohydrolysis and formic acid inducing rapid delignification. Ind. Crops Prod. 2018, 115, 194–201. [Google Scholar] [CrossRef]
- Faix, O. Classification of lignins from different botanical origins by FT-IR spectroscopy. Holzforschung 1991, 45, 21–27. [Google Scholar] [CrossRef]
- Lundquist, K. NMR studies on lignin. 2. Interpretation of the 1H NMR spectrum of acetylated birch lignin. Acta Chem. Scand. B 1979, 33, 27–30. [Google Scholar] [CrossRef]
- Lundquist, K. NMR studies on lignin. 4. Investigation of spruce lignin by 1H NMR spectroscopy. Acta Chem. Scand. B 1980, 34, 21–26. [Google Scholar] [CrossRef]
- Jahan, M.S.; Mun, S.P. Characteristics of dioxane lignins isolated at different ages of nalita wood (Trema orientalis). J. Wood Chem. Technol. 2007, 27, 83–98. [Google Scholar] [CrossRef]
- Sun, R.C.; Xiao, B.; Lawther, J.M. Fractional and structural characterization of ball-milled and enzyme lignins from wheat straw. J. Appl. Polym. Sci. 1998, 68, 1633–1641. [Google Scholar] [CrossRef]
- Shi, Z.J.; Xu, G.F.; Deng, J.; Dong, M.Y.; Murugadoss, V.; Liu, C.T.; Shao, Q.; Wu, S.D.; Guo, Z.H. Structural characterization of lignin from D. sinicus by FTIR and NMR techniques. Green Chem. Lett. Rev. 2019, 12, 235–243. [Google Scholar] [CrossRef]
- Nakatsubo, F.; Tanahashi, M.; Higuchi, T. Acidolysis of bamboo lignin II. Isolation and identification of acidolysis products. Wood Res. 1972, 53, 9–18. [Google Scholar]
- Higuchi, T.; Tanahashi, M.; Nakatsubo, F. Acidolysis of bamboo lignin III. Estimation of arylglycerol-β-aryl ether groups in lignins. Wood Res. 1972, 54, 9–18. [Google Scholar]
- Tanahashi, M.; Nakatsubo, F.; Higuchi, T. Structural elucidation of bamboo lignin by acidolysis and ozonolysis I. Wood Res. 1975, 58, 9–18. [Google Scholar]
- Nakamura, Y.; Higuchi, T. Ester linkage of p-coumaric acid in bamboo lignin. Holzforschung 1976, 30, 87–191. [Google Scholar] [CrossRef]
- Seca, A.M.; Cavaleiro, J.A.; Domingues, F.M.; Silvestre, A.J.; Evtuguin, D.; Neto, C.P. Structural characterization of the lignin from the nodes and internodes of Arundo donax reed. J. Agric Food Chem. 2000, 48, 817–824. [Google Scholar] [CrossRef] [PubMed]
- Wen, J.L.; Xue, B.L.; Xu, F.; Sun, R.C. Unveiling the atructural heterogeneity of bamboo lignin by in situ HSQC NMR technique. Bioenerg. Res. 2012, 5, 886–903. [Google Scholar] [CrossRef]
- Wen, J.L.; Xue, B.L.; Xu, F.; Sun, R.C.; Pinkert, A. Unmasking the structural features and property of lignin from bamboo. Ind. Crops Prod. 2013, 42, 332–343. [Google Scholar] [CrossRef]
- Kim, H.; Ralph, J. Solution-state 2D NMR of ball-milled plant cell wall gels in DMSO-d6/pyridine-d5. Org. Biomol. Chem. 2010, 8, 576–591. [Google Scholar] [CrossRef] [PubMed]
- Argyropoulos, D.S.; Pajer, N.; Crestini, C. Quantitative 31P NMR analysis of lignins and tannins. J. Vis. Exp. 2021, 174, e62696. [Google Scholar] [CrossRef]
- Wang, B.; Li, D.L.; Chen, T.Y.; Qin, Z.Y.; Peng, W.X.; Wen, J.L. Understanding the mechanism of self-bonding of bamboo binderless boards: Investigating the structural changes of lignin macromolecule during the molding pressing process. BioResources 2017, 12, 514–532. [Google Scholar] [CrossRef]
- Amit, T.A.; Roy, R.; Raynie, D.E. Thermal and structural characterization of two commercially available technical lignins for potential depolymerization via hydrothermal liquefaction. Curr. Res. Green Sustain. Chem. 2021, 4, 100106. [Google Scholar] [CrossRef]
- Wörmeyer, K.; Ingram, T.; Saake, B.; Brunner, G.; Smirnova, I. Comparison of different pretreatment methods for lignocellulosic materials. Part II. Influence of pretreatment on the properties of rye straw lignin. Bioresour. Technol. 2011, 102, 4157–4164. [Google Scholar] [CrossRef] [PubMed]
- Sun, R.C.; Lu, Q.; Sun, X.F. Physico-chemical and thermal characterization of lignins from Caligonum monogoliacum and Tamarix spp. Polym. Degrad. Stab. 2001, 72, 229–238. [Google Scholar] [CrossRef]
- Pe, J.A.; Mun, J.S.; Mun, S.P. Thermal characterization of kraft lignin prepared from mixed hardwoods. BioResources 2023, 18, 926–936. [Google Scholar] [CrossRef]
- Liu, Q.; Wang, S.; Zheng, Y.; Luo, Z.; Cen, K. Mechanism study of wood lignin pyrolysis by using TG–FTIR analysis. J. Anal. Appl. Pyrolysis 2008, 82, 170–177. [Google Scholar] [CrossRef]
- Yoshida, H.; Mörck, R.; Kringstad, K.P.; Hatakeyama, H. Fractionation of kraft lignin by successive extraction with organic solvents. II. Thermal properties of kraft lignin fractions. Holzforschung 1987, 41, 171–176. [Google Scholar] [CrossRef]
- Faix, O.; Meier, D.; Fortmann, I. Thermal degradation products of wood. A collection of electron-impact (EI) mass spectra of monomeric lignin derived products. Holz. Roh. Werkst. 1990, 48, 351–354. [Google Scholar] [CrossRef]
- Ralph, J.; Hatfield, R.D. Pyrolysis–GC–MS characterization of forage materials. J. Agric. Food Chem. 1991, 39, 1426–1437. [Google Scholar] [CrossRef]
- Saiz-Jimenez, C.; De Leeuw, J.W. Lignin pyrolysis products: Their structures and their significance as biomarkers. Org. Geochem. 1986, 10, 869–876. [Google Scholar] [CrossRef]
- TAPPI T 211 om-02; Ash in Wood, Pulp, Paper, and Paperboard, TAPPI Test Methods. TAPPI Press: Atlanta, GA, USA, 2002. Available online: https://www.tappi.org/content/sarg/t211.pdf (accessed on 15 March 2021).
- TAPPI T 207 cm-08; Water Solubility of Wood and Pulp. TAPPI Press: Atlanta, GA, USA, 2008.
- TAPPI T 204 os-76; Alcohol-Benzene and Dichloromethane Solubles in Wood and Pulp. TAPPI Press: Atlanta, GA, USA, 1988.
- TAPPI T 212 om-02; One Percent Sodium Hydroxide Solubility of Wood and Pulp, TAPPI Test Methods. TAPPI Press: Atlanta, GA, USA, 2002. Available online: https://tappi.micronexx.com/CD/TESTMETHODS/T212.pdf (accessed on 15 March 2021).
- TAPPI T 222 om-02; Acid-Insoluble Lignin in Wood and Pulp, TAPPI Test Methods. TAPPI Press: Atlanta, GA, USA, 2006. Available online: https://www.tappi.org/content/sarg/t222.pdf (accessed on 15 March 2021).
- TAPPI UM 250; Acid-Soluble Lignin in Wood and Pulp, TAPPI Useful Methods. TAPPI Press: Atlanta, GA, USA, 1991.
- Wise, L.E.; Murphy, M.; Daddieco, A.A. Chlorite holocellulose, its fractionation and bearing on summative wood analysis and on studies on the hemicellulose. Tech. Assoc. Pap. 1946, 29, 210–218. [Google Scholar]
- TAPPI T 203 om-83; Alpha-, Beta-, and Gamma-Cellulose in Pulp. TAPPI Press: Atlanta, GA, USA, 1988.
- Björkman, A. Isolation of lignin from finely divided wood with neutral solvents. Nature 1954, 174, 1057–1058. [Google Scholar] [CrossRef]
- Mun, J.S.; Pe, J.A.; Mun, S.P. Chemical characterization of kraft lignin prepared from mixed hardwoods. Molecules 2021, 26, 4861. [Google Scholar] [CrossRef]
Figure 1.
MW distribution of Ac-MWL.
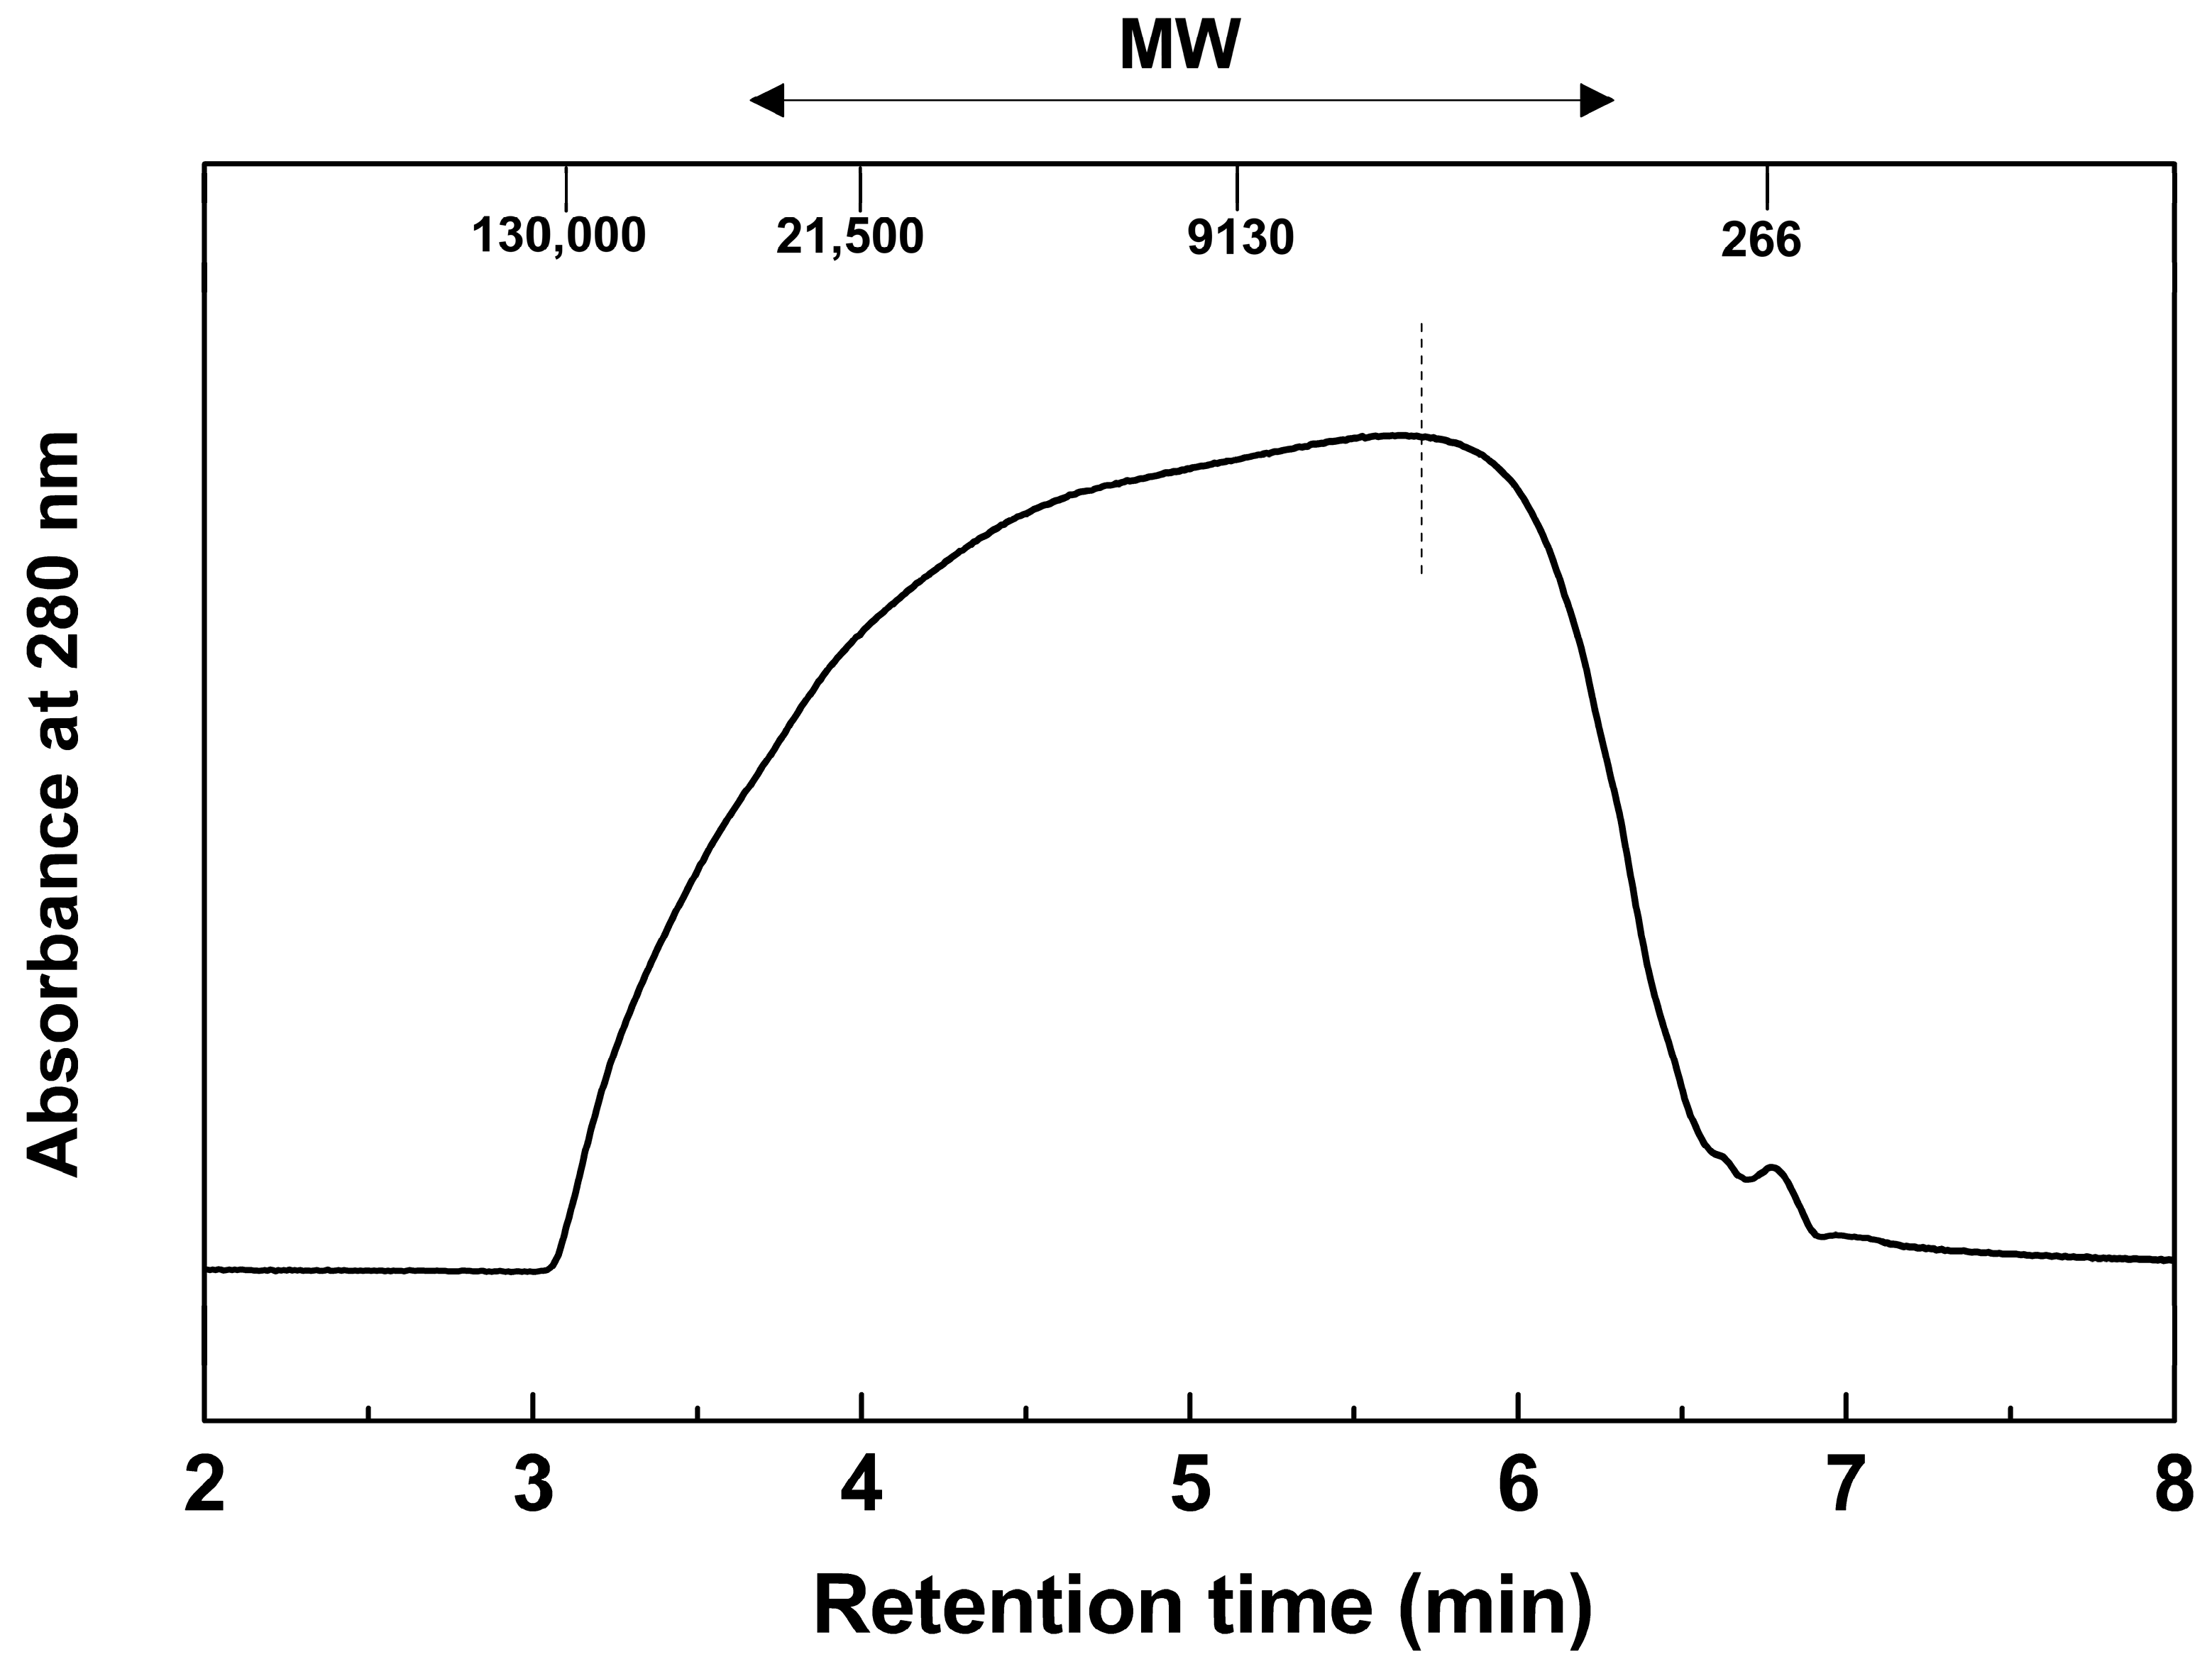
Figure 2.
FT-IR (ATR) spectrum of MWL.
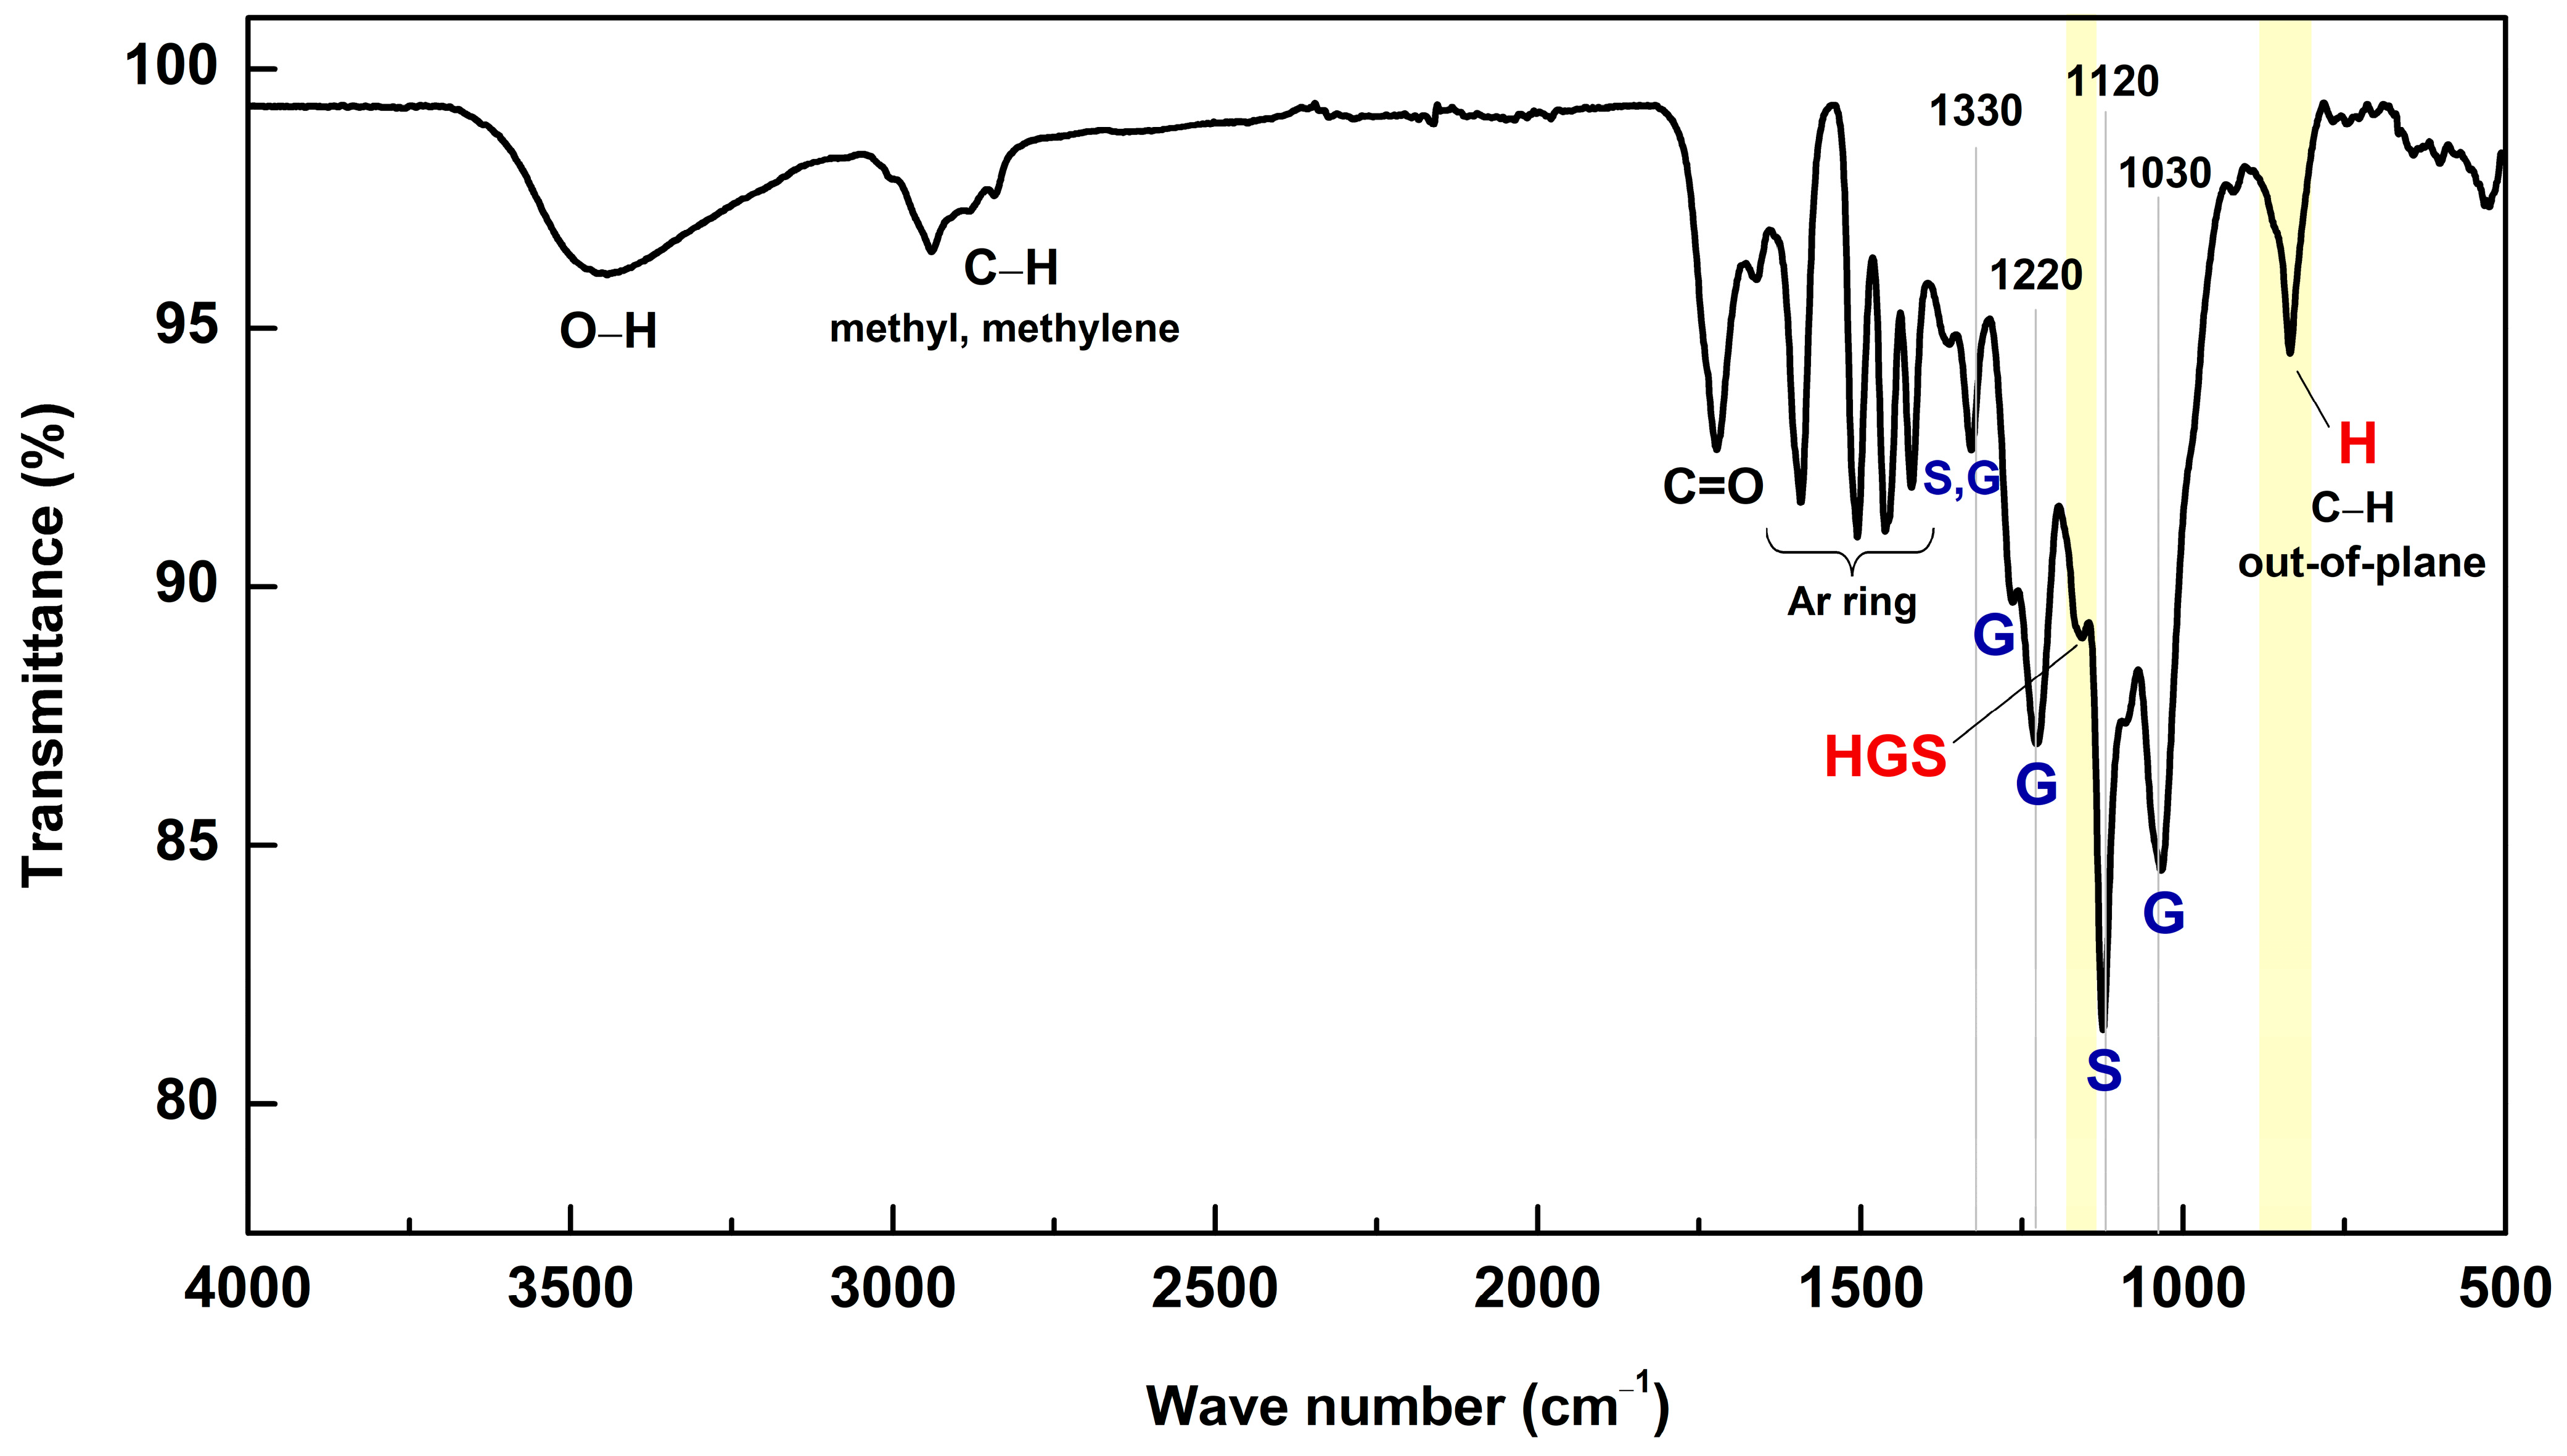
Figure 3.
1H NMR spectrum of Ac-MWL.
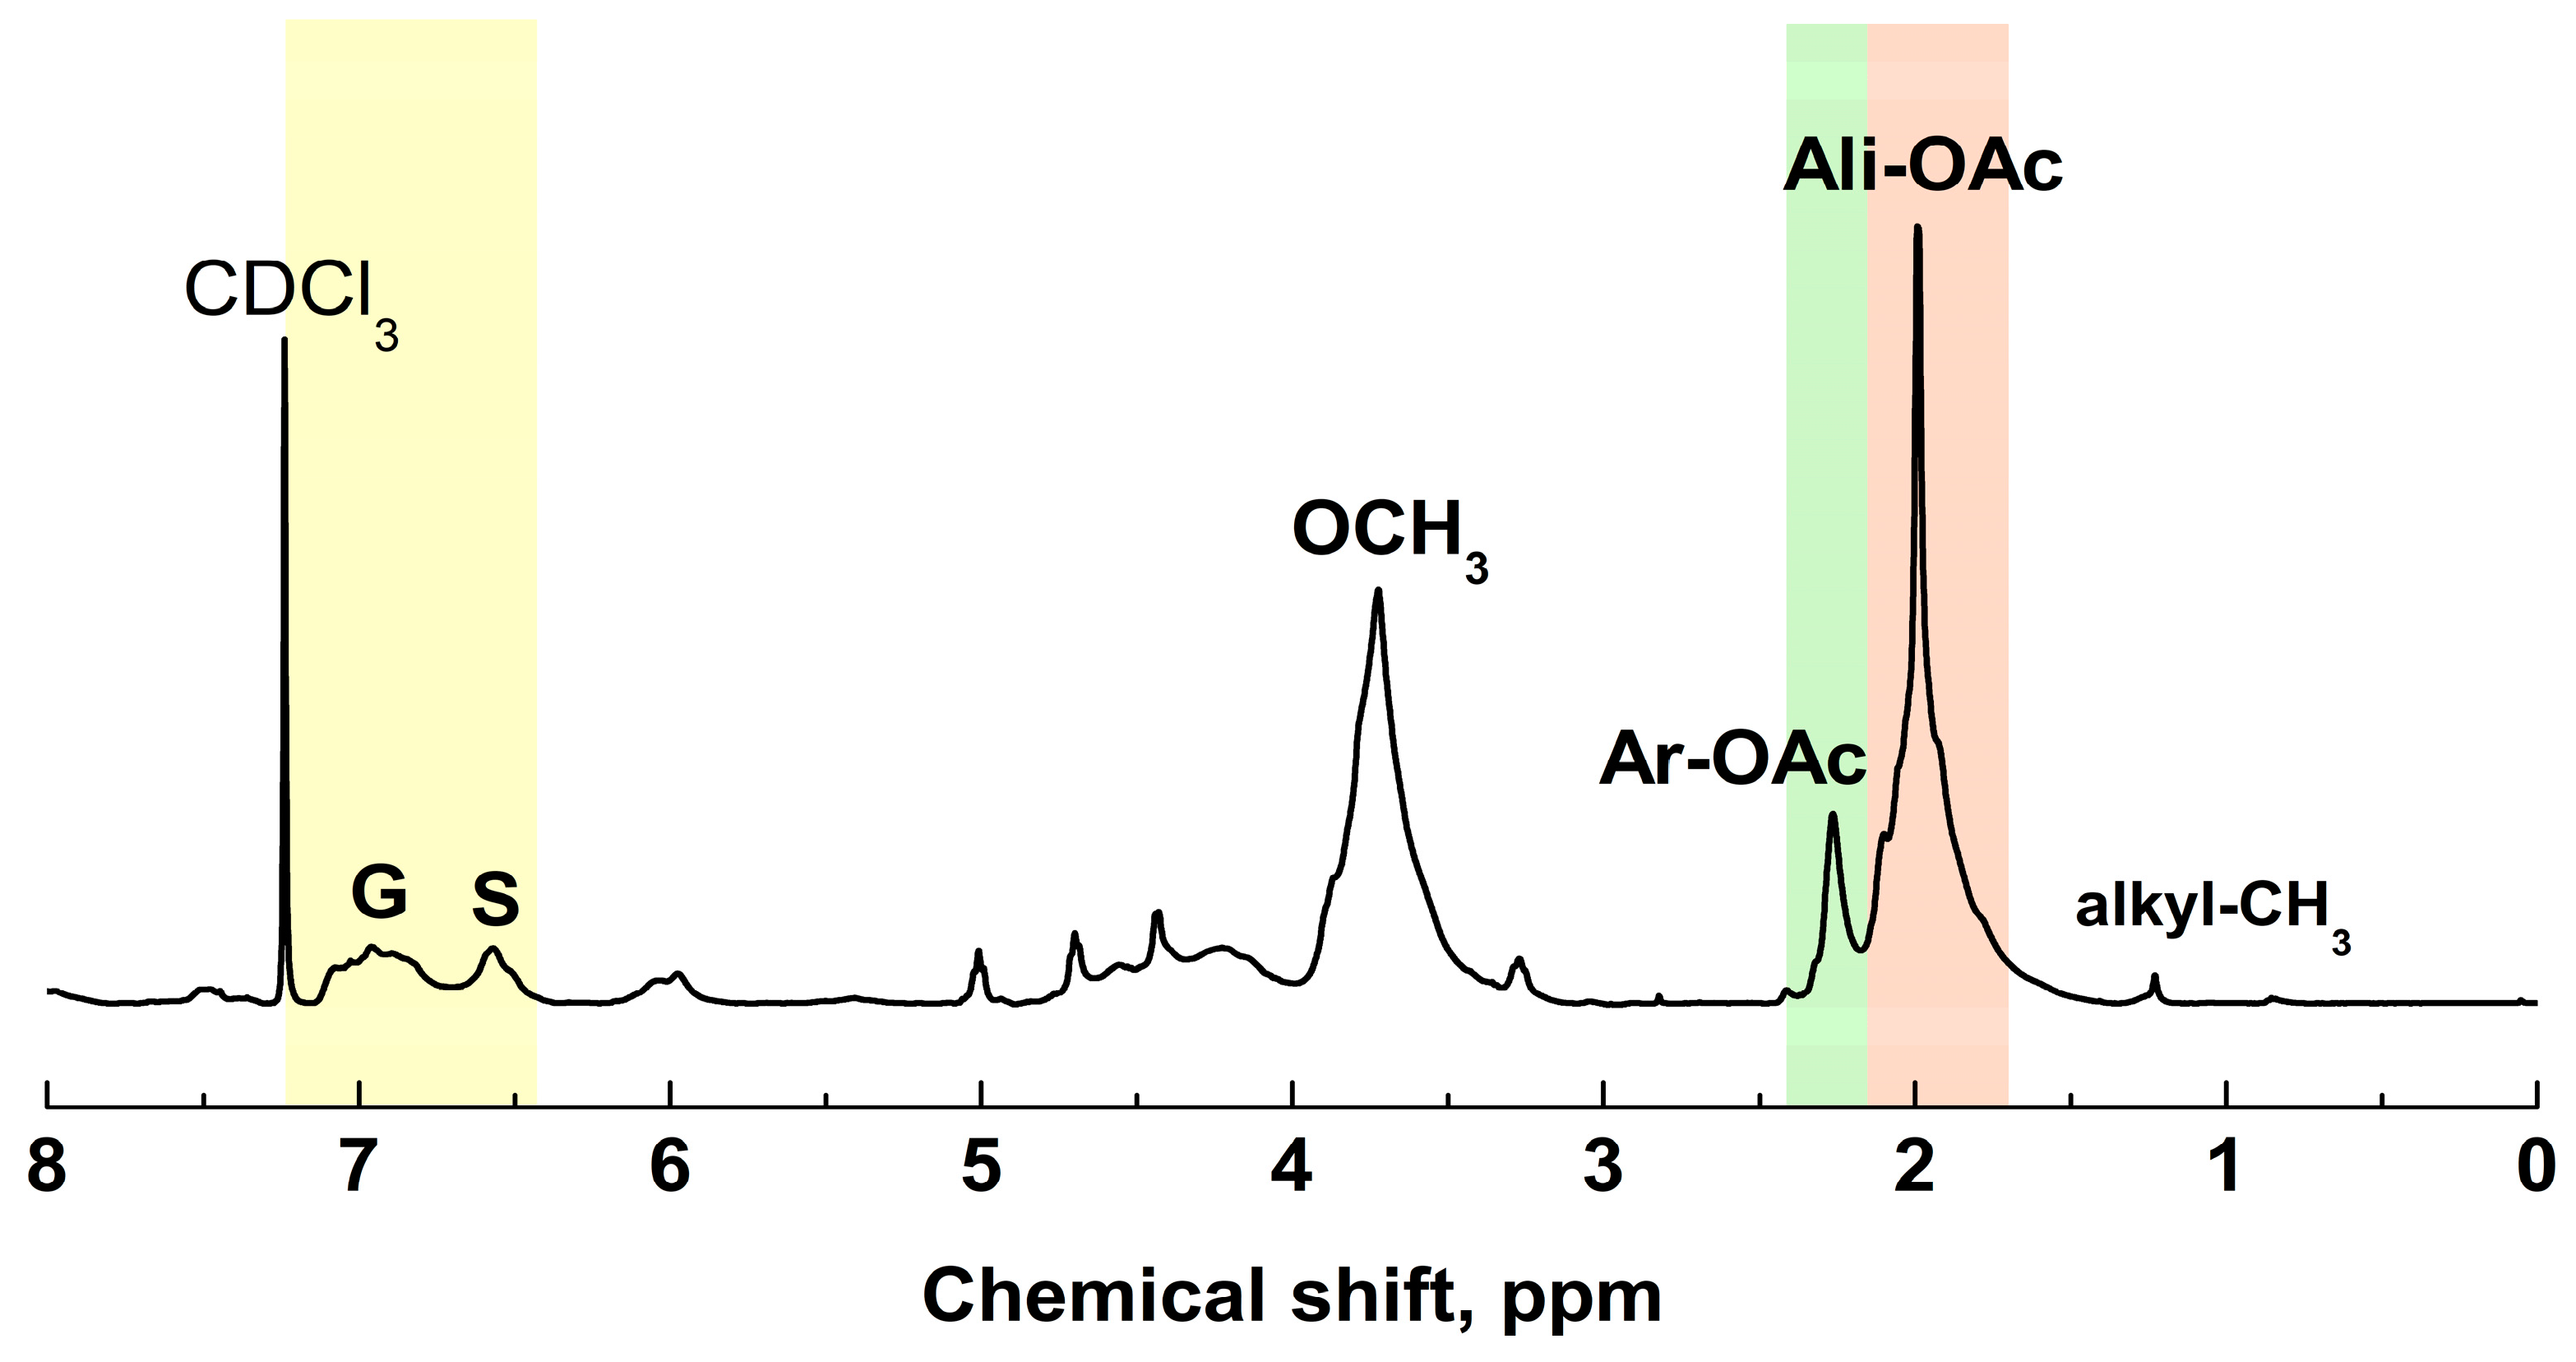
Figure 4.
13C NMR spectrum of MWL.

Figure 5.
(a) Side chain and (b) aromatic region of the HSQC spectra of MWL.
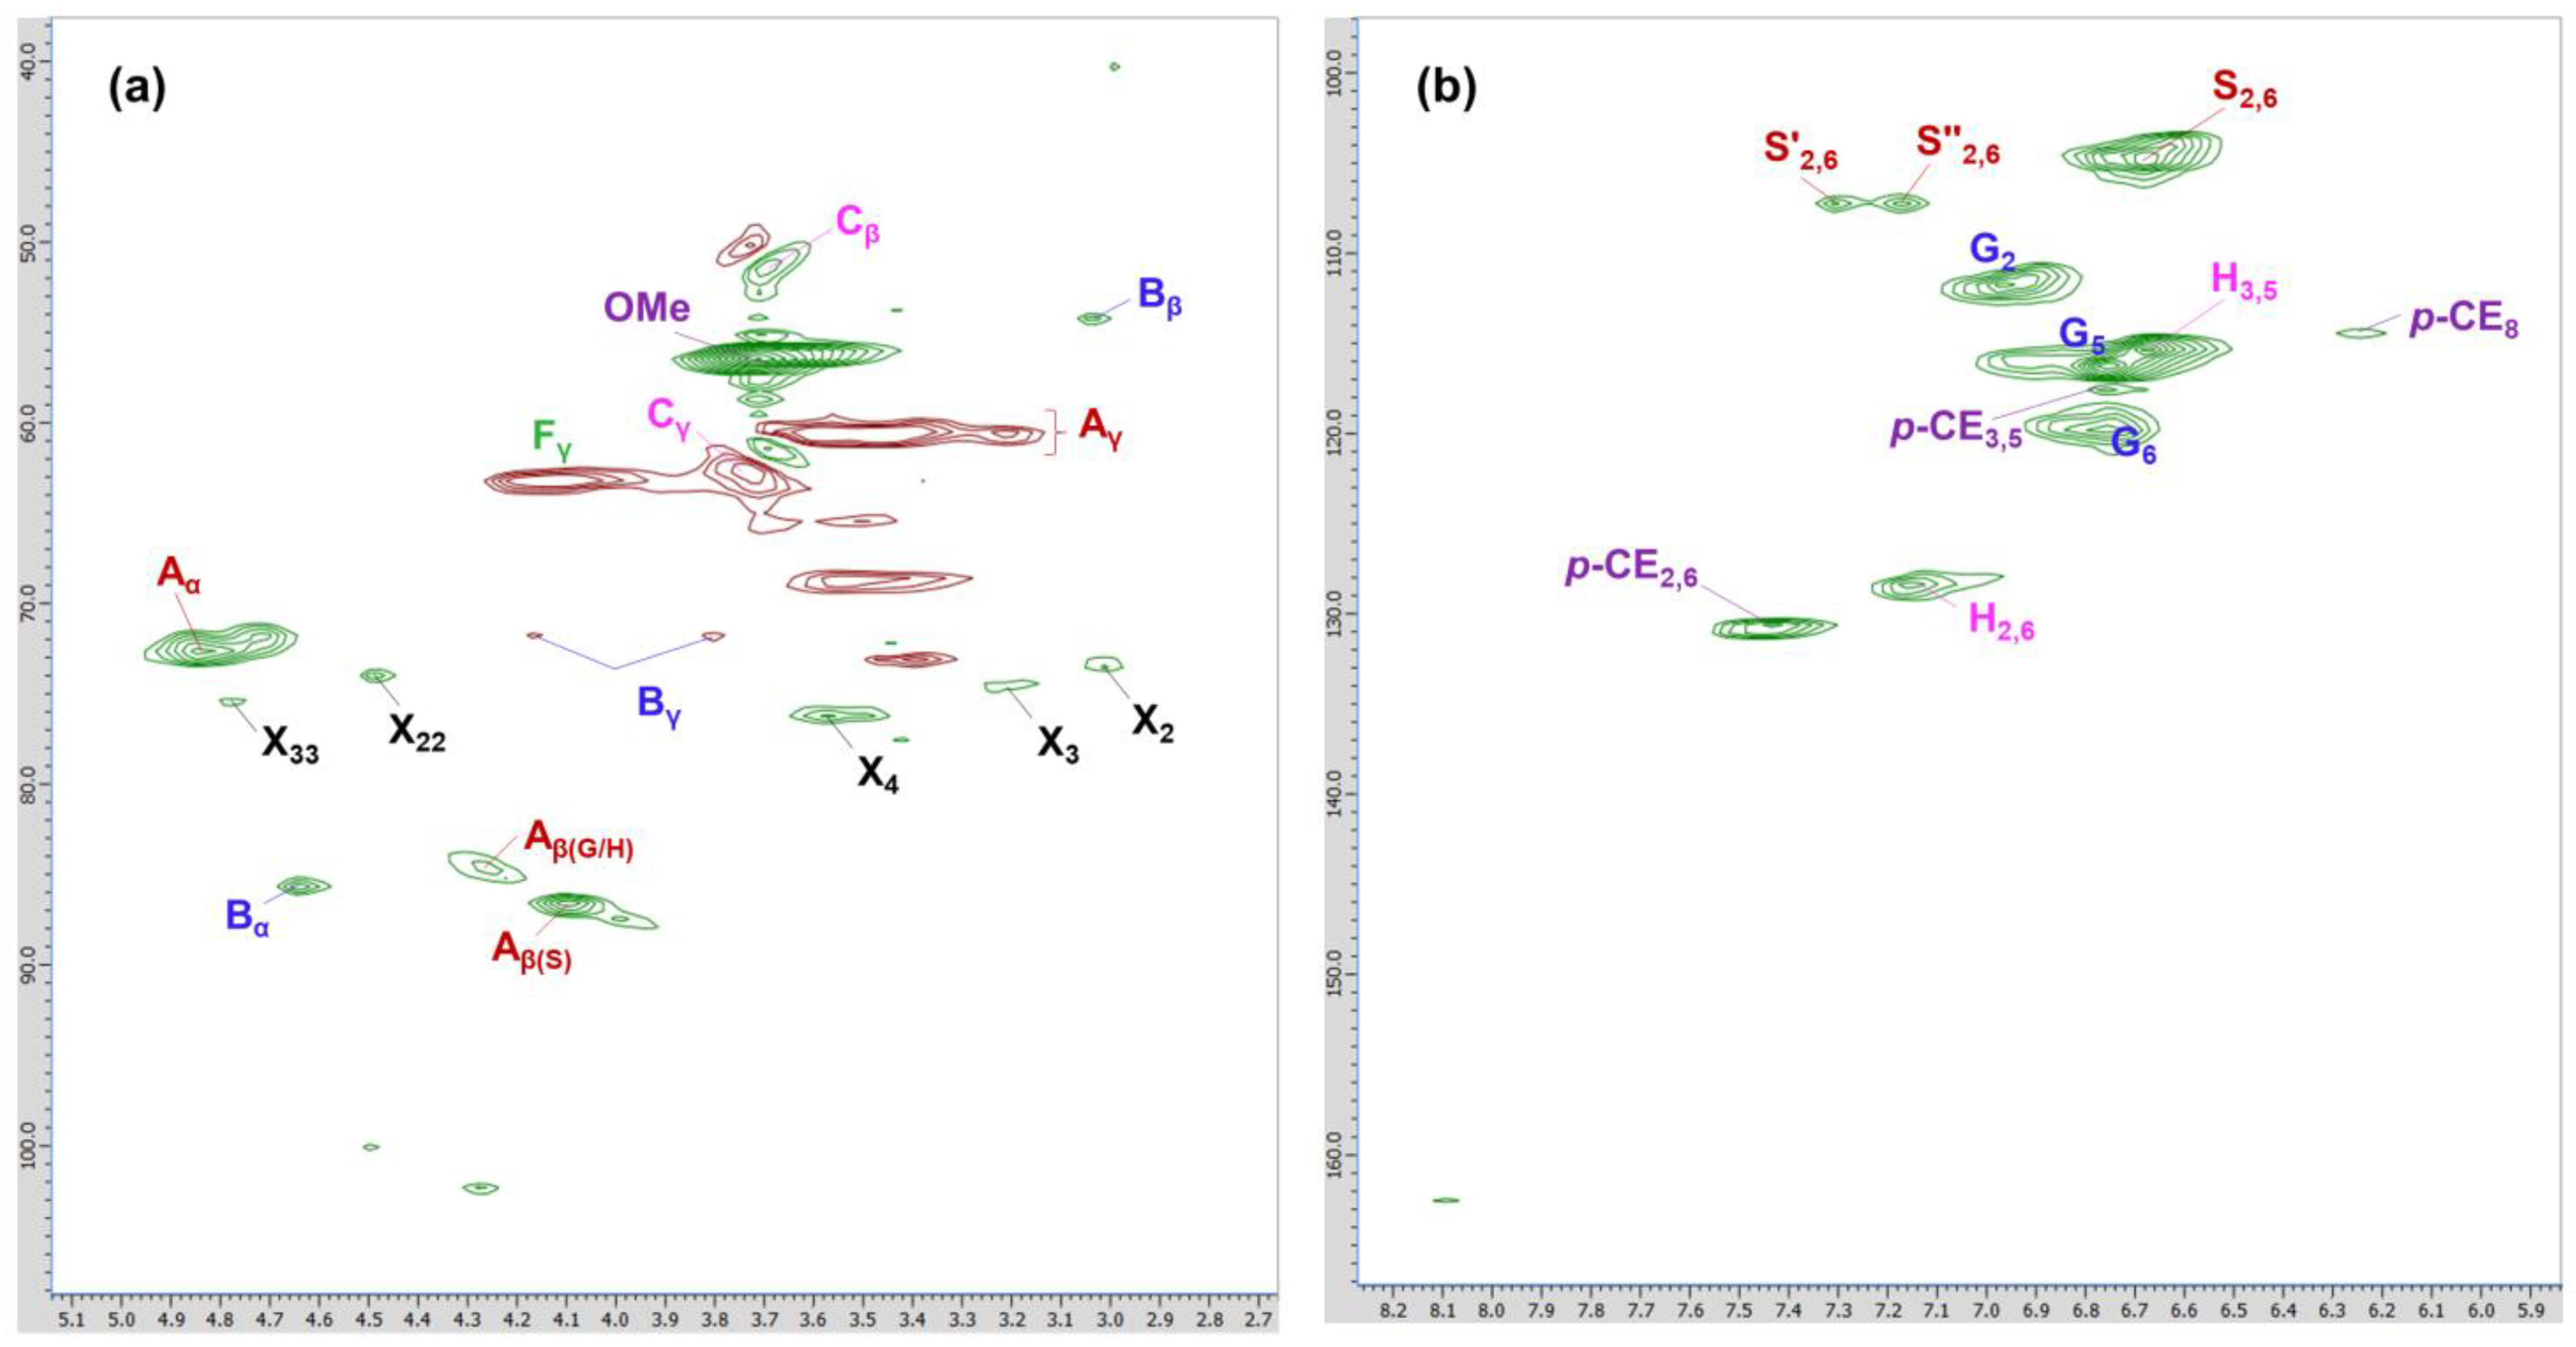
Figure 6.
Substructures present in MWL from 2D HSQC NMR.
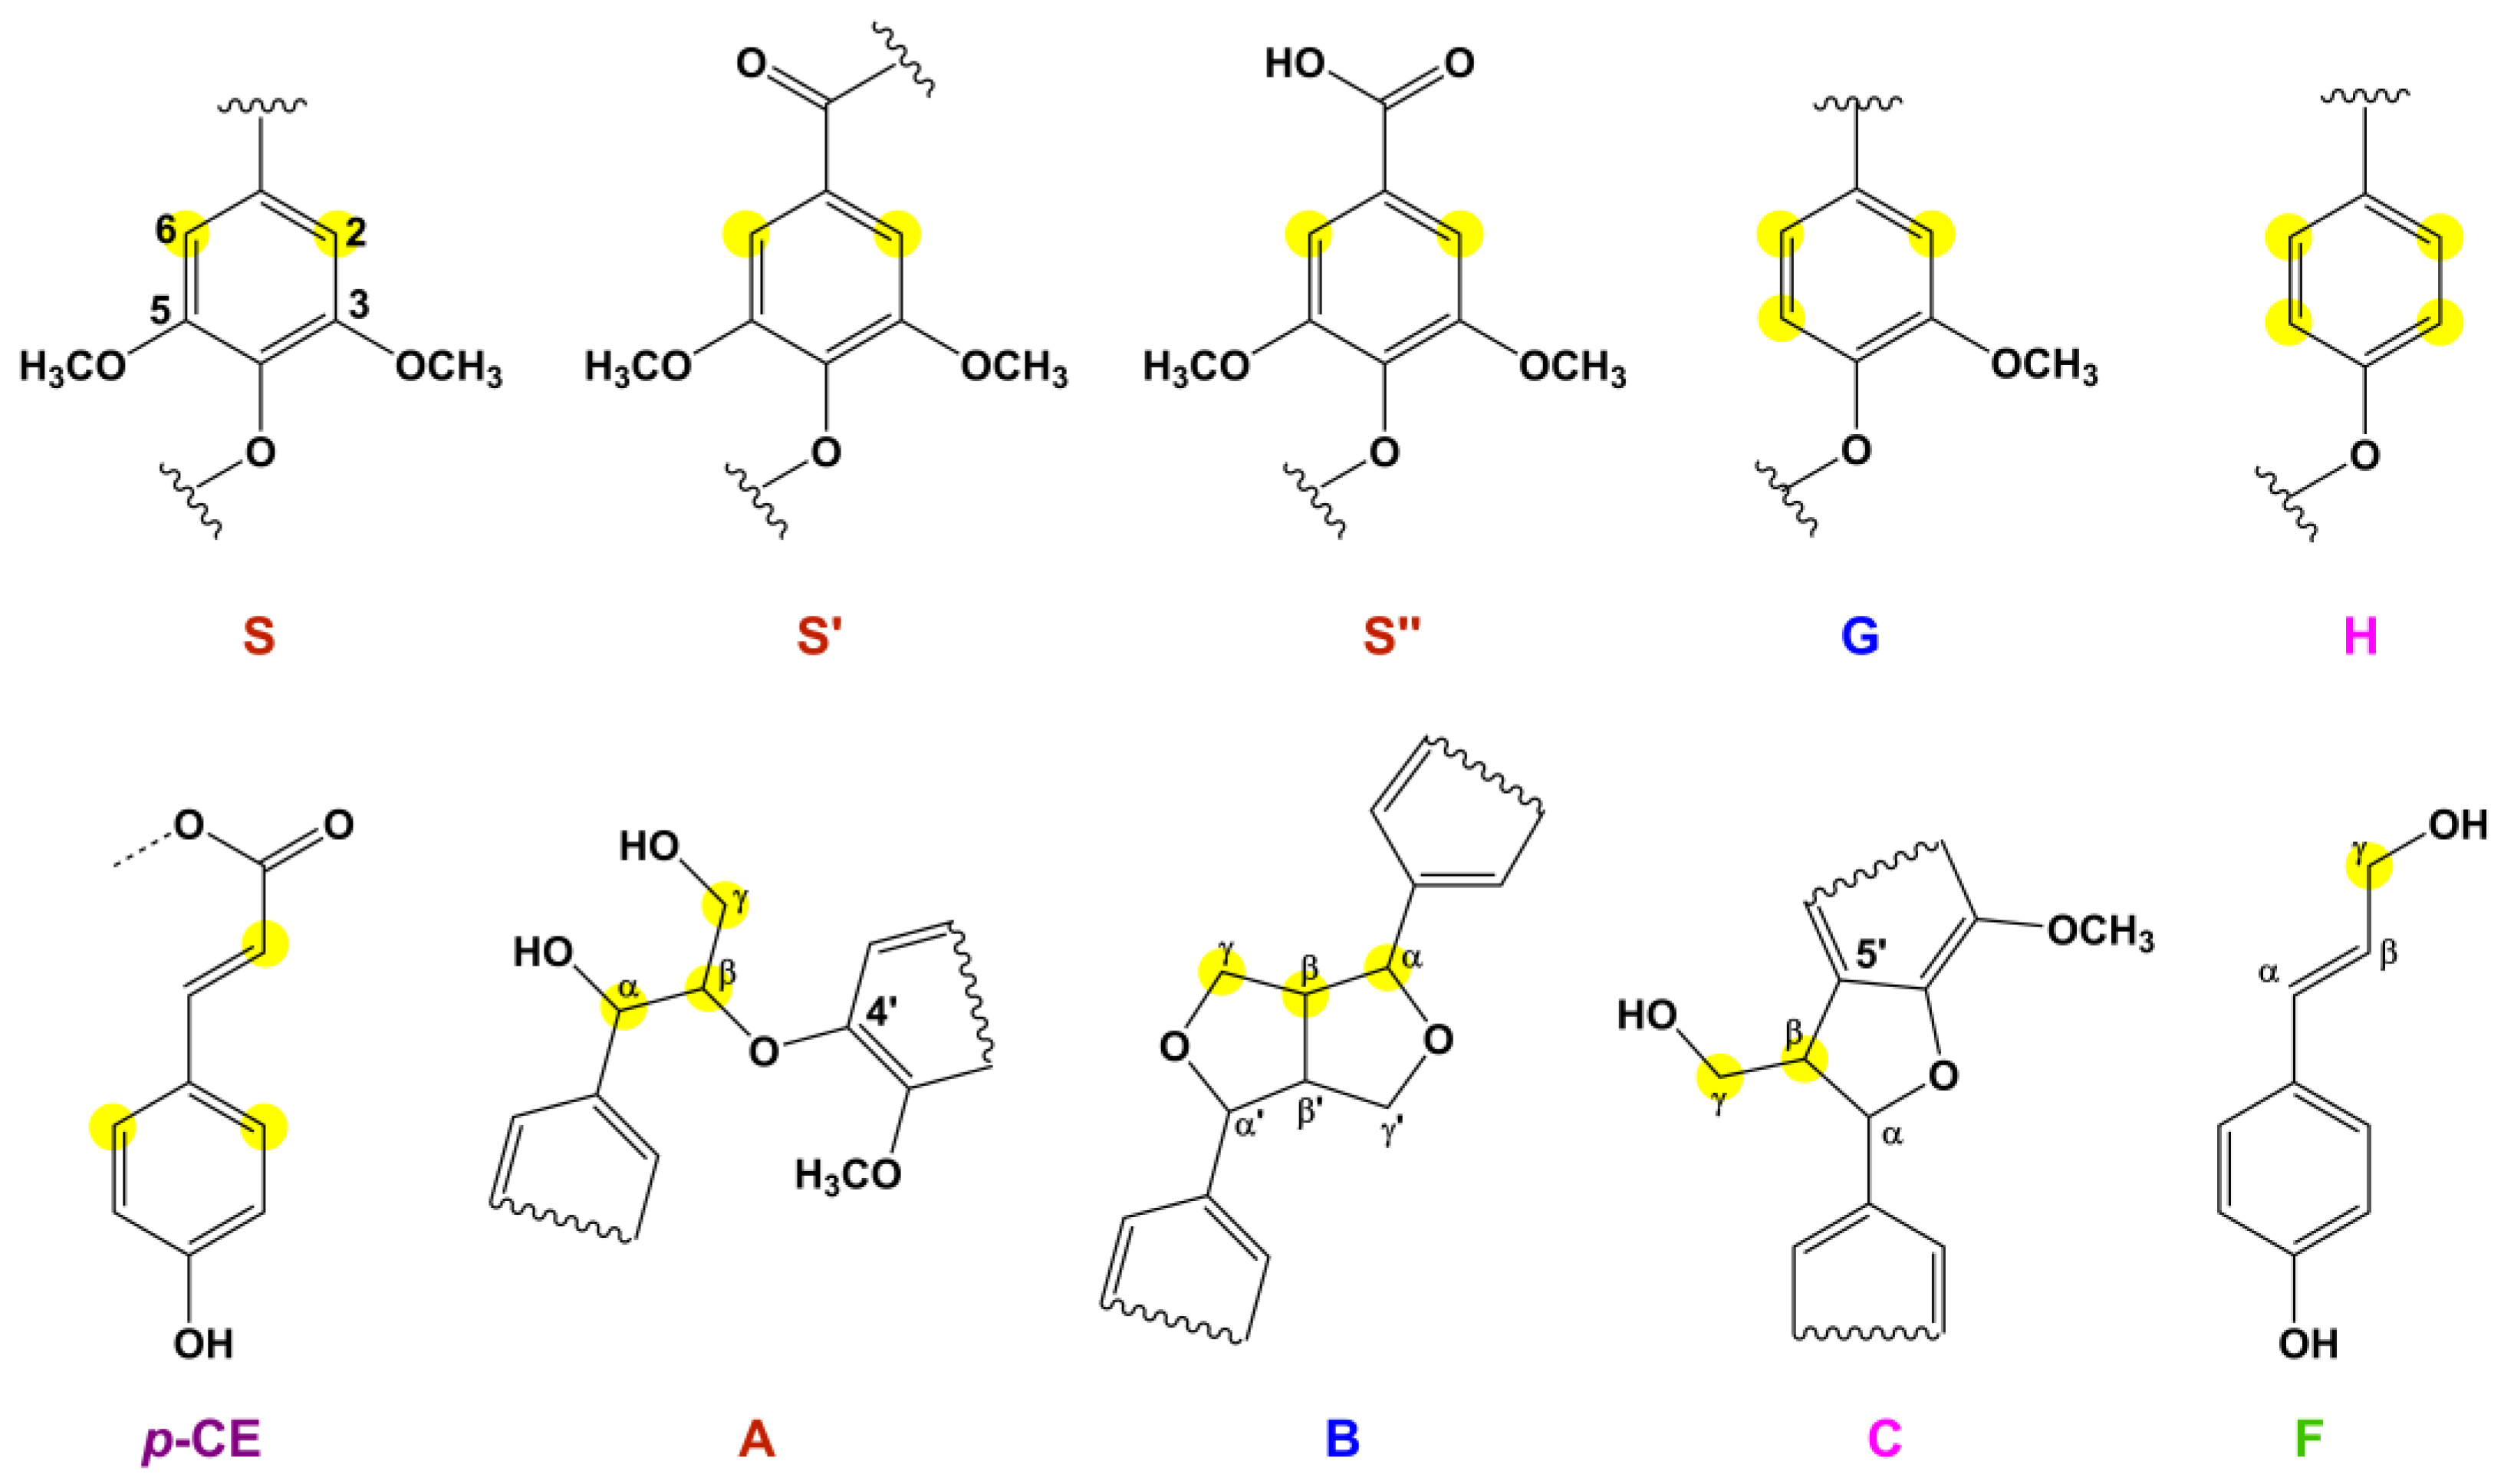
Figure 7.
(a) 31P NMR spectrum and (b) enlarged spectrum of MWL.
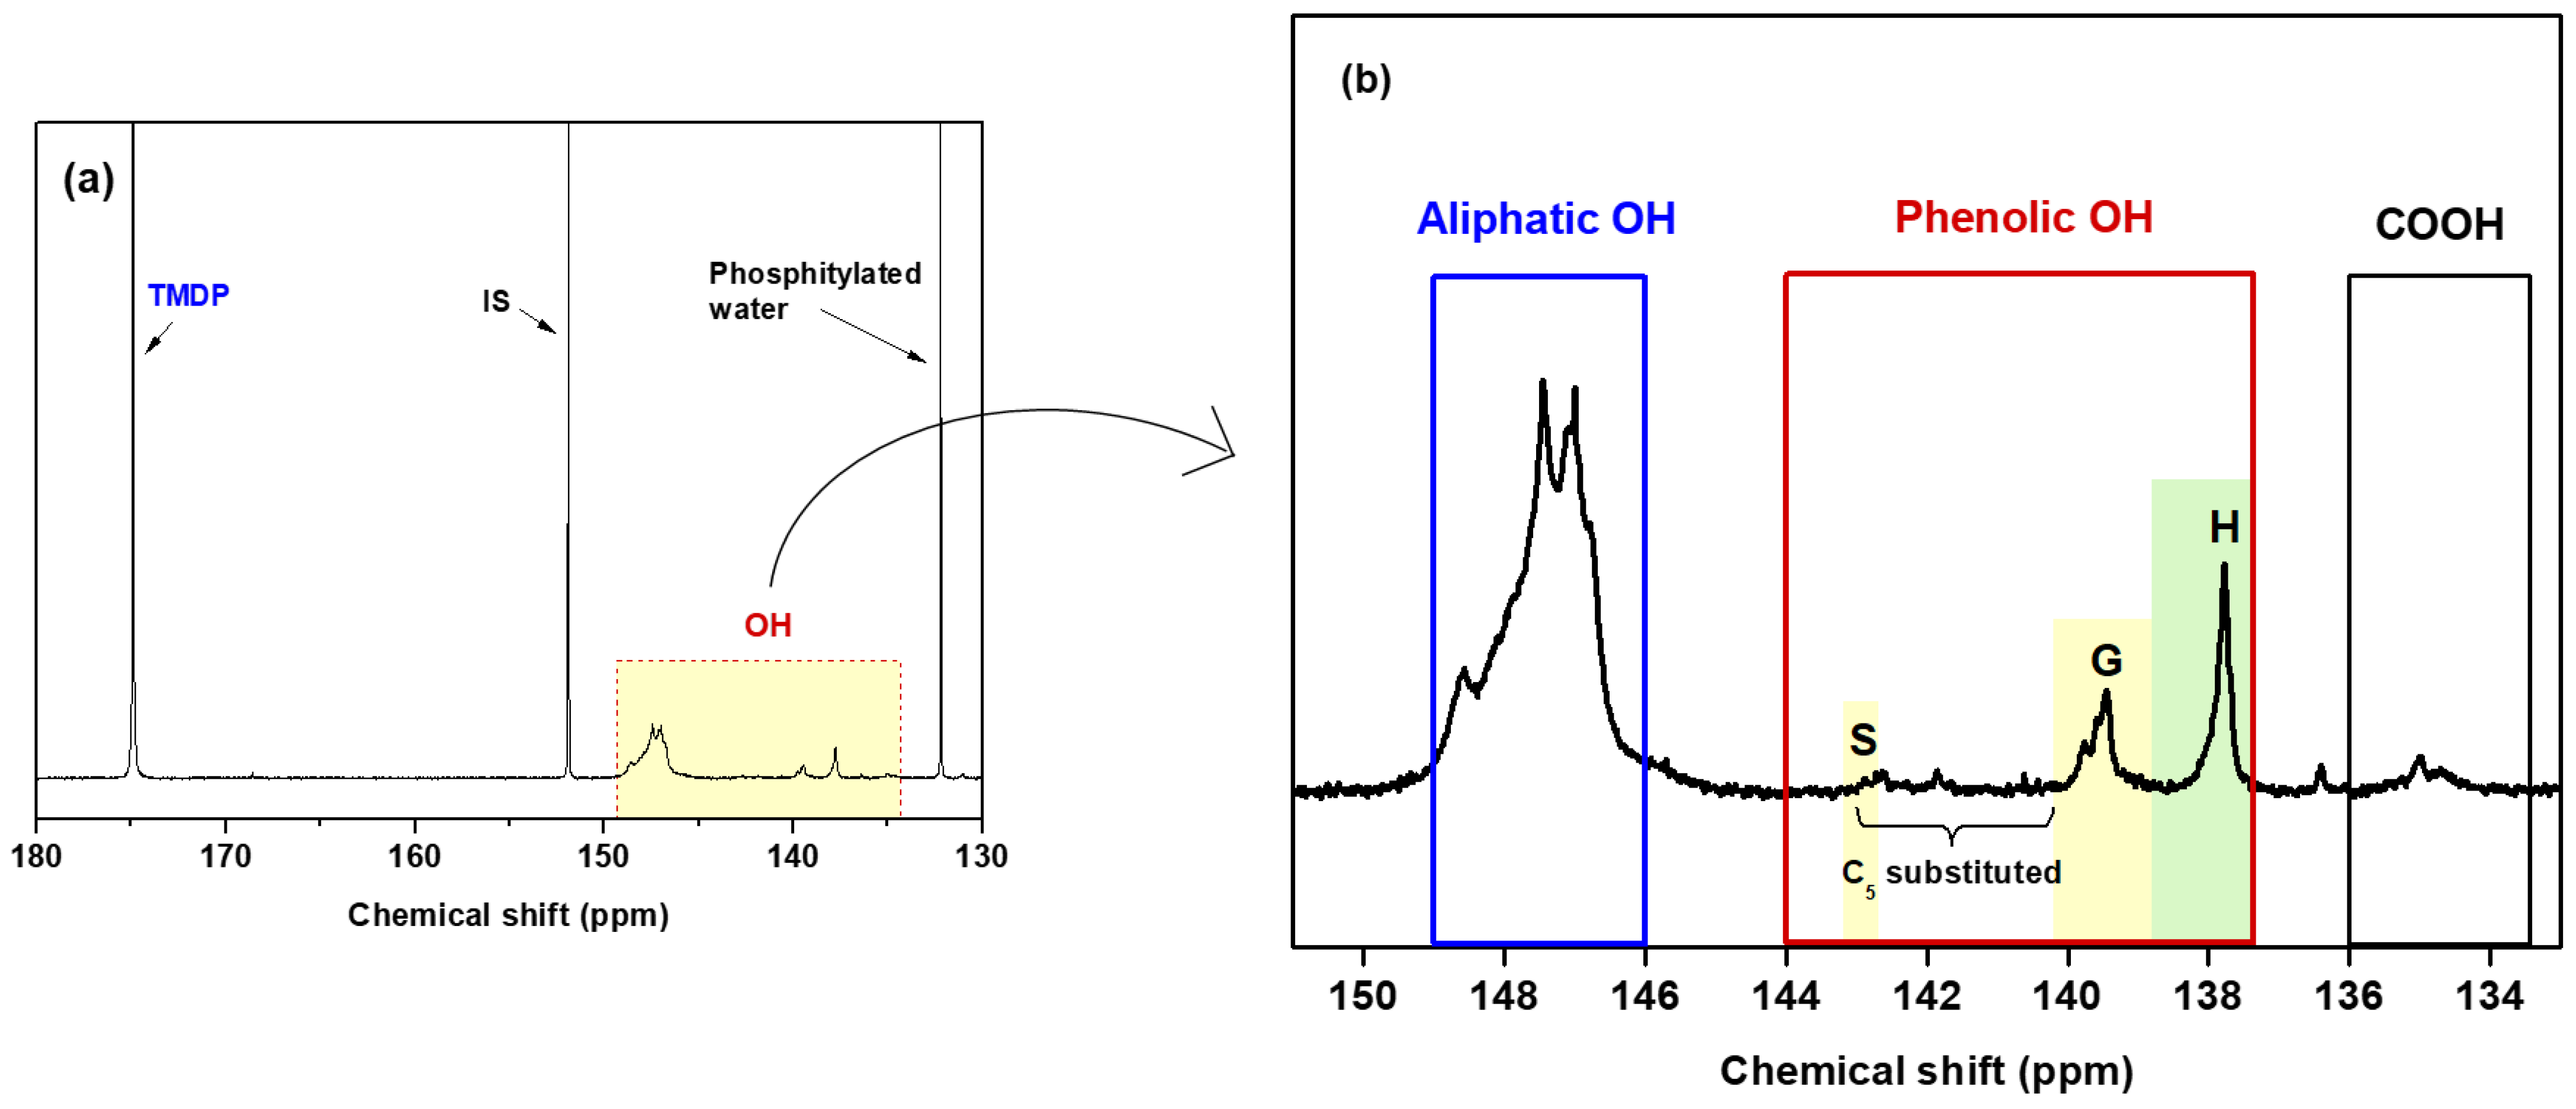
Figure 8.
(a) TG and (b) DTG curves of MWL under oxidative and inert conditions.
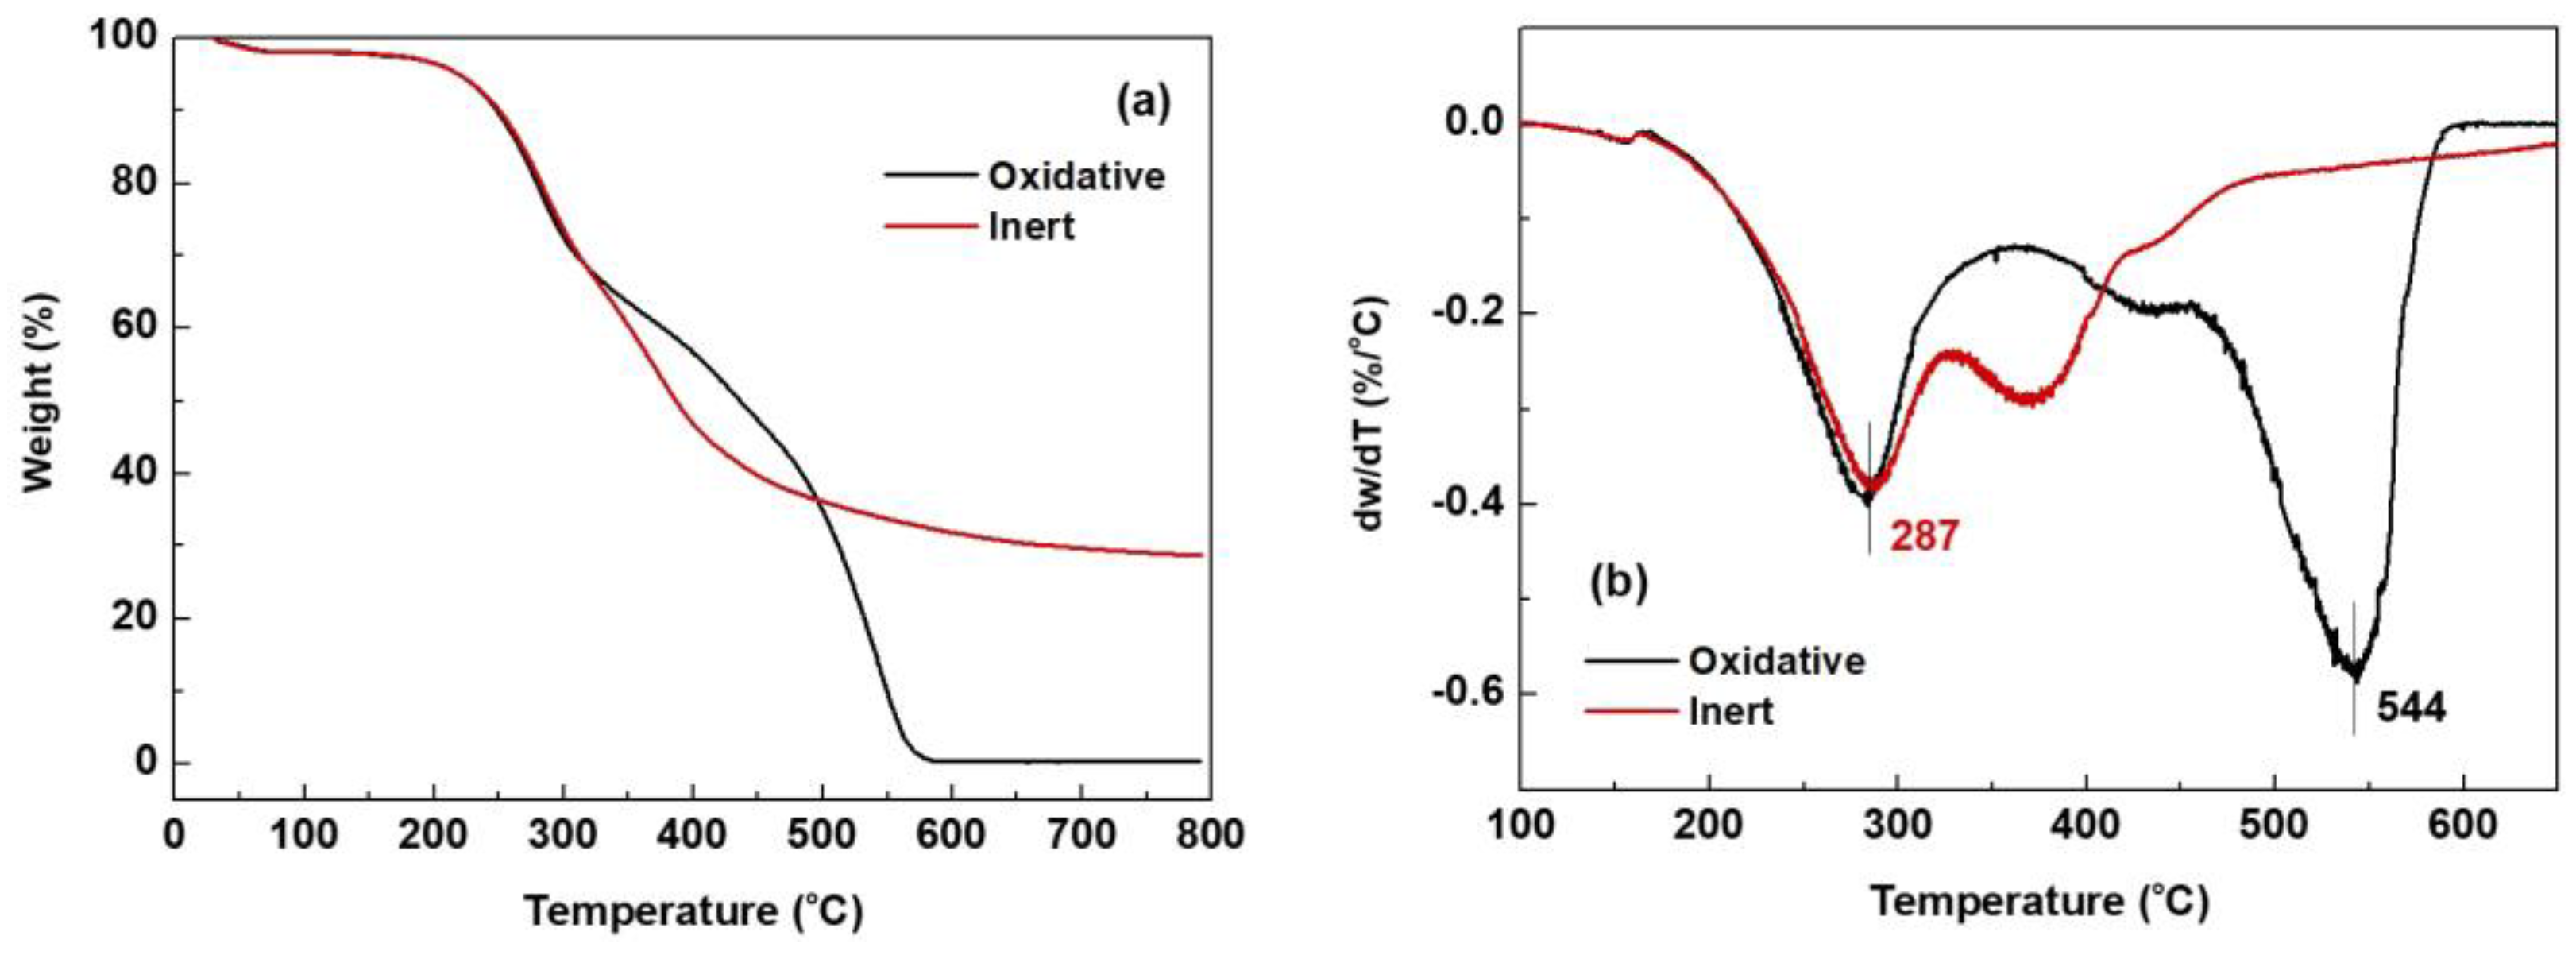
Figure 9.
DSC profile of MWL.

Figure 10.
Pyrogram of MWL at 675 °C.


Table 1.
Chemical composition of bamboo.
| Ash (%) | 1.24 ± 0.01 |
| Extracts (%) | |
| Cold water | 5.77 ± 0.02 |
| Hot water | 9.85 ± 0.04 |
| 1% NaOH | 29.69 ± 0.10 |
| Alcohol-benzene | 4.77 ± 0.07 |
| Carbohydrate (%) | |
| Holocellulose | 69.25 ± 0.44 |
| α-Cellulose | 44.31 ± 0.16 |
| Hemicellulose * | 24.94 |
| Lignin (%) | |
| Klason | 27.20 ± 0.09 |
| Acid-soluble | 0.51 ± 0.01 |
| Total | 27.71 |
* Hemicellulose (%) = holocellulose—α-cellulose.
Table 2.
Elemental analyses and methoxyl contents of MWLs.
| Elemental Analysis (%) | Reference | ||||||
|---|---|---|---|---|---|---|---|
| C | H | O | N | S | OCH3 | ||
| MWL | 58.39 | 5.66 | 34.66 | 0.12 | - | 20.47 | This study |
| MWL-A | 58.78 | 5.96 | 34.97 | 0.28 | - | 19.48 | [19] |
| MWL-X | 63.10 | 5.67 | 31.23 | - | - | 17.74 | [20] |
MWL: P. pubescens, A: P. acuta, X: unknown bamboo species. Methoxyl content was calculated by the integrations of the aromatic and methoxyl signals in 1H NMR spectrum [18].
Table 3.
C9 formula and formula weight of MWLs.
| C9 Formula | Formular Weight (Da) | Reference | |
|---|---|---|---|
| MWL | C9H7.76O3.23N0.02(OCH3)1.41 | 214.17 | This study |
| MWL-A | C9H7.67O2.72(OCH3)1.52 | 206.38 | [19] |
| MWL-X | C9H7.53O2.65(OCH3)1.10 | 191.59 | [20] |
MWL: P. pubescens, A: P. acuta, X: unknown bamboo species.
Table 4.
Average MW and PDI of Ac-MWLs.
| w (Da) | n (Da) | n) | References | |
|---|---|---|---|---|
| Ac-MWL | 13,279 | 4436 | 3.0 | This study |
| Ac-MWL-A | 12,090 | 5410 | 2.2 | [19] |
| Ac-MWL-S | 6080 | 3230 | 1.9 | [21] |
| Ac-MWL-P | 6050 | 3400 | 1.8 | [21] |
| Ac-MWL-B | 7692 | 4406 | 1.8 | [22] |
| Ac-MWL-N | 9420 | 7458 | 1.3 | [23] |
Ac-MWL: P. pubescens, A: P. acuta, S, P: stem, pith of P. pubescens, B: Dendrocalamus brandisii, N: Neosinocalamus affinis.
Table 5.
Assignment of FT-IR spectrum of MWL.
| Band (cm−1) | Assignments |
|---|---|
| 3441 | O–H stretching |
| 2843–2937 | C–H stretching in methyl, methylene groups |
| 1718 | C=O stretching in unconjugated ketone, carbonyl, and ester groups |
| 1664 | C=O stretching in conjugated p-substituted aryl ketone |
| 1594 | Aromatic skeleton vibration plus C=O stretching; S > G: Gcondensed > Getherified |
| 1503 | Aromatic skeleton vibration (G > S) |
| 1462 | C–H deformations (asymm in –CH3 and –CH2–) |
| 1419 | Aromatic skeleton vibration combined with C–H in plane deformations |
| 1365 | Aliphatic C–H stretching in CH3 and phenolic OH |
| 1330 | Condensed S and G ring (G ring bound via position 5) |
| 1266 | G ring plus C=O stretching (G-methoxyl C–O) |
| 1222 | C–O + C–O + C=O stretching (Gcondensed > Getherified) |
| 1160 | Typical for HGS lignins; C=O in ester groups (conj.) |
| 1123 | Aromatic C–H in-plane deformation (S) |
| 1089 | C–O deformation in sec-alcohols and aliphatic ethers |
| 1033 | Aromatic C–H in-plane deformation (G > S) + C–O deformation in primary alcohols + C–H stretching (unconjugated) |
| 921 | C–H out of plane (aromatic ring) |
| 834 | C–H out of plane in positions (2 and 6 of S + in all positions of H units) |
Table 6.
1H NMR assignments and distribution of protons per C9 structural unit of Ac-MWL.
| Ppm | Main Assignments | Ac-MWL |
|---|---|---|
| 7.20–6.80 * | Aromatic proton in G units | 1.05 |
| 6.80–6.25 | Aromatic proton in S units | 0.93 |
| 6.25–5.75 | Hα of β-O-4 and β-1 structures | 0.47 |
| 5.75–5.24 | Hα of β-5 structures | 0.24 |
| 5.20–4.90 | H of xylan residues | 0.29 |
| 4.90–4.30 | Hα and Hβ of β-O-4 structures | 1.47 |
| 4.30–4.00 | Hα of β-β structures, H of xylan residues | 0.88 |
| 4.00–3.48 | H of methoxyl groups | 4.23 |
| 2.50–2.22 | H of aromatic acetates | 0.76 |
| 2.22–1.60 | H of aliphatic acetates | 4.38 |
* From reference, it was 7.25–6.80, but CDCl3 solvent peak was detected at 7.24, thus, the chemical shift was adjusted.
Table 7.
13C NMR assignment of MWL.
| Signal No. | ppm | Assignments |
|---|---|---|
| 1 | 170.1 | Acetyl C=O in alcohols/phenols |
| 2 | 169.5 | |
| 3 | 166.3 | C-9 in p-CE |
| 4 | 162.0 | C-4 in H |
| 5 | 159.9 | C-4 in p-CE |
| 6 | 152.2 | C-3/C-5 in etherified S |
| 7 | 149.2 | C-4 in etherified G, C-3 in etherified G with α-CO |
| 8 | 147.1 | C-3 in G, C-3/C-5 in nonetherified S, C-3 in 5-5 biphenyl |
| 9 | 145.4 | C-4 in nonetherified G, Cα in p-CE |
| 10 | 138.0 | C-4 in etherified S |
| 11 | 134.9 | C-1 in etherified S, C-4 in nonetherified S |
| 12 | 134.4 | C-1 in etherified G |
| 13 | 133.3 | C-1 in nonetherified G |
| 14 | 132.3 | C-1 in nonetherified S |
| 15 | 130.2 | C-2/C-6 in p-CE |
| 16 | 127.9 | C-2/C-6 in H |
| 17 | 125.0 | C-1 in p-CE |
| 18 | 119.1 | C-6 in G |
| 19 | 115.8 | C-3/C-5 in p-CE |
| 20 | 115.2 | C-5 in G, C-3/C-5 in H, C-8 in p-CE |
| 21 | 111.2 | C-2 in G |
| 22 | 106.5 | C-2/C-6 in S with α-CO |
| 23 | 104.2 | C-2/C-6 in S, C-4 in β-β resinol |
| 24 | 103.4 | C-2/C-6 in S |
| 25, 26 | 101.8, 99.5 | Residual carbohydrates |
| 27 | 86.9 | C-α in β-5 phenylcoumaran |
| 28 | 86.1 | C-β in β-O-4 |
| 29 | 85.0 | C-α in β-β resinol |
| 30 | 84.5–81.3 | C-β in β-O-4 |
| 31 | 75.6 | Residual carbohydrates |
| 32 | 75.3 | C-α in β-1, residual carbohydrates |
| 33 | 73.4 | C-α in β-O-4, residual carbohydrates |
| 34 | 72.2 | C-α in β-O-4 |
| 35 | 71.7 | C-γ in β-β resinol |
| 36 | 68.2 | NA * |
| 37 | 64.9 | C-γ in β-5 phenylcoumaran |
| 38 | 62.7 | C-γ in β-5 phenylcoumaran, β-O-4 with α-CO |
| 39 | 60.1 | C-γ in β-O-4 |
| 40 | 55.8 | OCH3 in S and G |
| 41 | 29.0 | CH2 in aliphatic side chain |
| 42 | 20.9 | CH3 in acetyl |
* NA: not assigned.
Table 8.
Assignments of 13C/1H correlation signals in the HMQC spectra of MWL.
| Notation | δC/δH | Main Assignments |
|---|---|---|
| Cβ | 51.5/3.70 | Cβ–Hβ in β-5 phenylcoumaran (E) |
| Bβ | 54.1/3.04 | Cβ–Hβ in β-β resinol (B) |
| Ome | 56.6/3.71 | C–H in methoxyls |
| Aγ | 60.2/3.38–3.89 | Cγ–Hγ in β-O-4 (A) |
| Cγ | 62.8/3.73 | Cγ–Hγ in β-5 phenylcoumaran (E) |
| Fγ | 63.3/4.11 | Cγ–Hγ in p-hydroxycinnamyl alcohol end-group (F) |
| Bγ | 71.8/4.16, 72.1/3.80 | Cγ–Hγ in β-β resinol (B) |
| Aα | 72.8/4.85 | Cα–Hα in β-O-4 (A) |
| Aβ(G/H) | 82.4/4.34 | Cβ–Hβ in β-O-4 (A) linked to a G/H units |
| Bα | 85.8/4.64 | Cα–Hα in β-β resinol (B) |
| Aβ(S) | 86.6/4.10 | Cβ–Hβ in β-O-4 (A) linked to a S units |
| S2,6 | 104.8/6.69 | C2,6–H2,6 in syringyl units (S) |
| S″2,6 | 107.0/7.30 | C2,6–H2,6 in oxidized (CαOOH) syringyl units (S″) |
| S′2,6 | 107.2/7.19 | C2,6–H2,6 in oxidized (Cα=O) syringyl units (S) |
| G2 | 111.9/6.97 | C2–H2 in guaiacyl units (G) |
| H3,5 | 113.8/6.67 | C3,5–H3,5 in H units (H) |
| G5 | 115.4/6.68 | C5–H5 in guaiacyl units (G) |
| p-CE3,5 | 116.1/6.78 | C3,5–H3,5 in p-coumarate (PCE) |
| p-CE8 | 116.2/6.26 | C8–H8 in p-coumarate (PCE) |
| G6 | 119.8/6.80 | C6–H6 in guaiacyl units (G) |
| H2,6 | 128.3/7.17 | C2,6–H2,6 in H units (H) |
| p-CE2,6 | 130.6/7.48 | C2,6–H2,6 in p-coumarate (PCE) |
| X2 | 73.1/3.05 | C2–H2 in β-D-xylopyranoside |
| X3 | 74.6/3.26 | C3–H3 in β-D-xylopyranoside |
| X4 | 76.0/3.50 | C4–H4 in β-D-xylopyranoside |
| X22 | 74.0/4.49 | C2–H2 in 2-O-acetyl-β-D-xylopyranoside |
| X33 | 75.4/4.78 | C3–H3 in 3-O-acetyl-β-D-xylopyranoside |
Table 9.
Hydroxyl and carboxyl contents of MWLs.
| Amount (mmol/g MWL) | References | |||||||
|---|---|---|---|---|---|---|---|---|
| Ali OH | Ph OH | C5-sub OH + S OH | G OH | H OH | Total OH * | COOH | ||
| MWL | 6.74 | 1.45 | 0.18 | 0.51 | 0.76 | 8.19 | 0.23 | This study |
| MWL-N | 4.52 | 1.50 | 0.28 | 0.48 | 0.74 | 6.02 | 0.24 | [23] |
| MWL-Y | 3.71 | 1.93 | 0.59 | 0.58 | 0.76 | 5.64 | 0.30 | [39] |
MWL: P. pubescens, N: Neosinocalamus affinis, Y: unknown bamboo species. Ali: aliphatic, Ph: phenolic, C5-sub: C5-substituted; * Total OH = aliphatic OH + aromatic OH.
Table 10.
Composition, onset temperature, and DTGmax of MWL (oxidative, inert).
| Condition | Composition (%) | Temperature (°C) | Reference | |||||
|---|---|---|---|---|---|---|---|---|
| 120 °C (Volatiles) | 400 °C | 500 °C | 800 °C (Ash/Residue) | Onset | DTGmax | |||
| MWL | Oxidative | 1.9 | 56.7 | 34.9 | 0.3 | 234 | 544 | This study |
| MWL | Inert | 1.8 | 89.4 | 63.9 | 28.7 | 235 | 287 | |
| MWL-N | - | - | - | 32.9 | - | 367 | [23] | |
| MWL-Y | - | - | - | 21.0 | - | 360 | [39] | |
MWL: P. pubescens, N: Neosinocalamus affinis, Y: unknown bamboo species.
Table 11.
Pyrolysis products and relative composition at 675 °C.
| No. | Compound | Type | Formula | RRT a | MW | m/z b | Relative Composition (%) |
|---|---|---|---|---|---|---|---|
| 1 | 2-Methylphenol | H | C7H8O | 0.91 | 108 | 108, 77 | 3.5 |
| 2 | 4-Methylphenol | H | C7H8O | 0.96 | 107 | 107, 77 | 7.0 |
| 3 | Guaiacol (G) | G | C7H8O2 | 1.00 | 124 | 124, 109, 81 | 10.3 |
| 4 | 4-Ethylphenol | H | C8H10O | 1.17 | 122 | 122, 107 | 4.5 |
| 5 | 4-Methylguaiacol | G | C8H10O2 | 1.24 | 138 | 138, 123, 95 | 3.4 |
| 6 | 4-Vinylphenol | H/PCA | C8H8O | 1.29 | 120 | 120, 91 | 31.7 |
| 7 | 3-Methoxycatechol | S | C7H8O3 | 1.39 | 140 | 140, 125, 97 | 1.4 |
| 8 | 4-Vinylguaiacol | G/FA | C9H10O2 | 1.50 | 150 | 150, 135 | 11.3 |
| 9 | Syringol (S) | S | C8H10O3 | 1.57 | 154 | 154, 139, 93 | 7.3 |
| 10 | Vanillin | G | C8H8O3 | 1.66 | 152 | 152, 151 | 5.2 |
| 11 | (E)-Isoeugenol | G | C10H12O2 | 1.76 | 164 | 164, 149 | 2.9 |
| 12 | 4-Propylguaiacol | G | C10H14O2 | 1.77 | 166 | 166, 137 | 1.5 |
| 13 | Acetylguaiacol | G | C9H12O2 | 1.82 | 166 | 166, 151 | 2.6 |
| 14 | 4-Allylsyringol | S | C11H14O3 | 2.02 | 194 | 194, 91 | 1.2 |
| 15 | Syringaldehyde | S | C9H10O4 | 2.11 | 182 | 182, 181 | 4.1 |
| 16 | Acetosyringone | S | C10H12O4 | 2.23 | 196 | 196, 181 | 2.0 |
PCA: p-coumaric acid, and FA: ferulate; a RRT: relative retention time, guaiacol as the reference; b m/z values in bold: base peak; only m/z values > 30% of the base peak are included.
Table 12.
Analysis conditions for GPC.
| GPC Configuration | Waters (Acquity APC) System, USA |
|---|---|
| Columns | Acquity APC 2.5 µm XT 125, Acquity APC 1.7 µm XT 200 (4.6 × 150 mm, Waters, Wexford, Ireland) |
| Flow rate | 0.6 mL/min |
| Sample injection volume | 10 μL |
| Eluent | THF |
| Column oven temperature | 30 °C |
| Detector | UV (254 nm: polystyrene standards; 280 nm: sample) |
| Analysis time | 10 min |
| MW polystyrene standards | Red: 130,000-21,500-6540-1250 Da White: 35,500-9130-2280-266 Da |
Table 13.
Analysis conditions for Py-GC/MS.
| Stage | Equipment/Condition | |
|---|---|---|
| Pyrolysis | Equipment | Curie-point pyrolyzer (JCI-21, Japan Analytical Industry), pyrofoil (F670, JAI) |
| GC/MS | GCMS-QP2010 Ultra, Shimadzu | |
| GC | Pyrolysis temp. | 670 °C for 5 s |
| Interface temp. | 300 °C | |
| GC | Column | J & W DB-5MS (30 m × 0.25 mm ID × 0.25 μm, Agilent Techn.) |
| Carrier gas | He, 1 mL/min | |
| Injector/Detector temp. | 250 °C | |
| Split ratio | 1:30 | |
| Oven temp. | 50 °C (1 min) → ramping (5 °C/min) → 320 °C (5 min) | |
| MS | Ionization | Electron impact method, 70 eV |
Disclaimer/Publisher’s Note: The statements, opinions and data contained in all publications are solely those of the individual author(s) and contributor(s) and not of MDPI and/or the editor(s). MDPI and/or the editor(s) disclaim responsibility for any injury to people or property resulting from any ideas, methods, instructions or products referred to in the content. |
© 2023 by the authors. Licensee MDPI, Basel, Switzerland. This article is an open access article distributed under the terms and conditions of the Creative Commons Attribution (CC BY) license (https://creativecommons.org/licenses/by/4.0/).
Share and Cite
MDPI and ACS Style
Mun, J.-S.; Mun, S.-P. Structural and Thermal Characterization of Milled Wood Lignin from Bamboo (Phyllostachys pubescens) Grown in Korea. Molecules 2024, 29, 183. https://doi.org/10.3390/molecules29010183
AMA Style
Mun J-S, Mun S-P. Structural and Thermal Characterization of Milled Wood Lignin from Bamboo (Phyllostachys pubescens) Grown in Korea. Molecules. 2024; 29(1):183. https://doi.org/10.3390/molecules29010183
Chicago/Turabian StyleMun, Ji-Sun, and Sung-Phil Mun. 2024. "Structural and Thermal Characterization of Milled Wood Lignin from Bamboo (Phyllostachys pubescens) Grown in Korea" Molecules 29, no. 1: 183. https://doi.org/10.3390/molecules29010183