Article

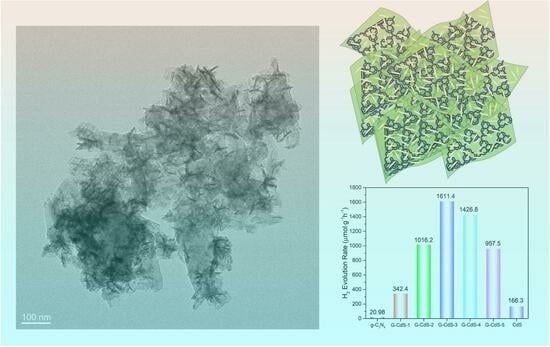
CdS Deposited In Situ on g-C3N4 via a Modified Chemical Bath Deposition Method to Improve Photocatalytic Hydrogen Production

1
School of Electronic Engineering, Nanjing Xiaozhuang University, Nanjing 211171, China
2
School of Physics and Information Engineering, Jiangsu Province Engineering Research Center of Basic Education Big Data Application, Jiangsu Second Normal University, Nanjing 210013, China
*
Author to whom correspondence should be addressed.
Molecules 2023, 28(23), 7846; https://doi.org/10.3390/molecules28237846
Submission received: 10 November 2023 / Revised: 26 November 2023 / Accepted: 28 November 2023 / Published: 29 November 2023
(This article belongs to the Special Issue Photocatalytic Materials and Photocatalytic Reactions)

Abstract

:
Ultra-thin two-dimensional materials are attracting widespread interest due to their excellent properties, and they are becoming ideal candidates for a variety of energy and environmental photocatalytic applications. Herein, CdS nanorods are successfully grown in situ between a monolayer of g-C3N4 using a chemical water bath method. Continuous ultrasound is introduced during the preparation process, which effectively prevents the accumulation of a g-C3N4 layer. The g-C3N4@CdS nanocomposite exhibits significantly enhanced photocatalytic activity for hydrogen production under visible-light irradiation, which is attributed to a well-matched band structure and an intimate van der Waals heterojunction interface. The mechanism of photocatalytic hydrogen production is discussed in detail. Moreover, our work can serve as a basis for the construction of other highly catalytically active two-dimensional heterostructures.

Graphical Abstract

1. Introduction

With the rapid development of global industry, various problems, for example, climate warming, energy crisis, and environmental pollution, come along [1]. Using catalysts to harness inexhaustible solar energy is a green, sustainable, and promising method [2,3,4,5]. Under the irradiation of sunlight, a photocatalyst is excited to produce electron–hole pairs, and the electrons and holes undergo the reduction reaction and oxidation reaction, respectively, which can decompose organic pollutants into hydrocarbons [6,7,8], split water to produce hydrogen and oxygen [9], and reduce CO2 to fuels such as CO and CH4 [10]. In addition, excited electrons reduce nitrogen gas to ammonia, which is an important chemical feedstock and is widely used in agricultural waste [11]. In the photocatalytic reaction, the most critical choice is the photocatalyst, which determines the concentration of the electron–hole pairs produced under light irradiation.
In recent years, many semiconductor materials and nanocomposites have been developed in the field of photocatalysis, for example, CdS [12], ZnIn2S4 [13], PdS [14], and TiO2 [15], among others [16]. Among the many semiconductors, graphite-like carbon nitride (g-C3N4) has become a research hotspot because of its suitable band structure and unique electric, optical, structural, and photochemical properties [17,18,19,20]. It is a non-metallic inorganic n-type semiconductor polymer composed of C and N elements, in which both C and N atoms are hybridized in the form of sp2 and are connected to form a ring by the σ covalent bond, and, between the rings, they are connected by amino groups to form a π electron conjugated structure. Therefore, these unique structures of g-C3N4 can be applied to many fields. In 2009, Wang and his colleagues [21] first discovered that g-C3N4 produces hydrogen and oxygen under light irradiation, and this application for hydrogen evolution has attracted wide attention. Since then, a wide variety of g-C3N4-based photocatalysts have been designed to drive various reduction and oxidation reactions under light irradiation [17,22,23,24,25]. Here, the CdS materials have a suitable bandgap width of 2.4 eV and a good visible-light response, but there is serious photo-corrosion, which leads to a severe recombination of photogenerated carriers [6]. If CdS and g-C3N4 combine to form a heterojunction, there will inevitably be a photocatalytic performance of 1 plus 1 is greater than 2. Therefore, nanocomposites of g-C3N4 and CdS have been widely reported and studied [22,26,27]. The combination of excellent single-layer g-C3N4 and CdS will form a fast electron transport channel, and the separation efficiency of photogenerated electrons and holes can be greatly improved, thus showing an excellent rate of photohydrogen production. Jianjun Liu [28] systematically calculated the energy band structure and charge transfer of the heterojunction between g-C3N4 and CdS using the hybrid density functional approach. They suggested that the contact between CdS and monolayer g-C3N4 forms a van der Waals heterojunction, which will have an internal electric field that facilitates the separation of the electron–hole pair at the interface. Researchers [18,29] obtained a monolayer of g-C3N4 using ultrasound, and then they grew CdS using solvothermal, hydrothermal, and other methods. Although monolayer g-C3N4 obtained via ultrasound is easy to agglomerate to form bulk g-C3N4 in the process of the hydrothermal growth of other semiconductors, thus improving photocatalytic performance, there are still some limitations.
In this paper, CdS were grown in situ on monolayer g-C3N4, which is equivalent to a substrate. In order to better obtain monolayer g-C3N4, ultrasound was consistently maintained during the chemical bath deposited method, which is a method that has simple equipment and a low cost and allows for easy large-area preparation. Consequently, intimate contact interfaces between g-C3N4 and CdS were also obtained, which could accelerate the separation of photogenerated carriers. The experimental results show that the photocatalytic performance of the composites improved. The crystal structure, microstructure, and morphology of the composite were analyzed in detail. Moreover, photocatalytic mechanisms were also proposed, and they were demonstrated using characterization methods.

2. Results and Discussion

The crystal structures of the CdS, g-C3N4, and G-CdS nanocomposites were characterized using an X-ray diffractometer (XRD), as shown in Figure 1a. For pure g-C3N4, two diffraction peaks were found at 12.9° and 27.6°, which can be indexed as (100) and (002) diffraction planes for graphitic materials (JCPDS 87-1526) [21]. The (100) diffraction peaks and (002) diffraction peaks are associated with the in-plane repeated units and periodic graphitic stacking of the conjugated aromatic system [30,31], respectively, which indicates the existence of graphite-like layer structures. The obtained composite photocatalyst exhibited gradually appearing diffraction peaks at 25.1, 26.6, 44.1, and 52.1°, while the intensity of the diffraction peaks related to g-C3N4 gradually weakened with increasing concentrations of Cd and S. A comparison with the standard PDF card (65-3414) showed that these diffraction peaks are (100), (002), (110), and (112) of the CdS hexagonal wurtzite structure, respectively. The results of XRD indicate that the CdS of the hexagonal wurtzite structure was grown in situ on the g-C3N4 nanosheets through the CBD process, and the concentration of CdS gradually increased with the increase in Cd and S sources. The characteristic functional groups of the photocatalysts were analyzed using Fourier Transform Infrared (FTIR) spectroscopy. For g-C3N4, the spectrum reveals several notable features. The prominent absorption peak at 807 cm−1 can be attributed to the stretching vibration of heptazine ring units [32], as depicted in Figure 1b. Additionally, the broad band observed in the range of 1100–1700 cm−1 corresponds to the stretching vibration mode of the aromatic C-N heterocyclic skeleton, which is characteristic of the typical structure of g-C3N4. The spectrum for g-C3N4 also shows peaks in the range of 3000–3400 cm−1, indicating the N-H bond stretching vibration of -NHx [33], while the weak peak observed at 3437 cm−1 was attributed to the O-H stretching vibration, likely due to the presence of hydroxyl groups or the physical adsorption of H2O molecules [34]. As for CdS, the spectrum exhibits distinct peaks at 3437 cm−1 and 1622 cm−1, corresponding to the surface-adsorbed water molecules [35]. Additionally, the peaks at 1333 cm−1 and 1167 cm−1 are associated with the stretching vibration peak of Cd-S bonds. The peaks at 2924 cm−1 are attributable to the bending vibration of -CH2 and -CH3 groups [36,37]. Furthermore, in the G-CdS nanocomposites, both partial CdS vibration peaks and partial g-C3N4 vibration peaks were observed, indicating the successful combination of the two materials without impurities.
The microstructures and morphologies of the samples were characterized and analyzed using transmission electron microscopy (TEM), as shown in Figure 2. Both the amorphous and crystalline g-C3N4 exhibited an exceptionally thin nanosheet morphology. In contrast, the TEM morphology of pure CdS showed significant agglomeration (Figure 2b). Moreover, in the high-resolution TEM (HRTEM) images of the edge nanoparticles, lattice fringes with spacings of 0.351, 0.337, 0.2065, and 0.292 nm could be observed. The lattice fringes at 0.351 nm, 0.337 nm, and 0.2065 nm correspond to the hexagonal wurtzite structure of CdS, while the lattice fringe at 0.292 nm corresponds to the cubic structure of CdS. This indicates that CdS, in the absence of g-C3N4, consists of both hexagonal and cubic structures, which is consistent with the XRD results. For the G-CdS nanocomposites, many amorphous quantum dots with sizes around 8 nm emerged on the g-C3N4 nanosheet structures. This observation is consistent with the amorphous CdS results obtained from the XRD pattern. As the concentration of Cd and S further increased, nanorod-shaped nanowire structures with a length of approximately 50 nm and a width of around 4 nm emerged on the g-C3N4 nanosheet layer. Further confirmation through HRTEM revealed that these needle-shaped nanowire structures were composed of CdS material with a hexagonal wurtzite structure (the lattice fringes are marked in red in Figure 2). A clear and tight contact interface between g-C3N4 and CdS was achieved, which implies an intimate heterojunction between the two components, as indicated by the green dashed box in Figure 2g. Compared with Figure 2a, it can be seen that the thickness of the g-CN nanosheets is significantly thinner. This facilitated the effective transfer of charge carriers between the two semiconductors. This indicates that the CdS nanowire structures were grown in situ on g-C3N4 rather than being a mere physical mixture of the two materials. The high-resolution lattice stripe on the CdS nanorods was 0.333 nm, which means that the nanorods were preferentially grown in the (002) direction. For the G-CdS-5 nanocomposites, the nanorod-shaped CdS nanowire structures further grew in both length and width (Figure 2h). Therefore, according to the TEM morphology, it could be concluded that the concentrations of Cd and S sources influence the morphological evolution of CdS.
Moreover, elemental mapping techniques were utilized to investigate the elemental compositions of the G-CdS-3 nanocomposites. As depicted in Figure 3, it was observed that the G-CdS nanocomposites contained C, N, Cd, and S elements with no other impurities detected, which further confirms the successful synthesis of the composite samples. The results also show a uniform spatial distribution of C, N, Cd, and S elements, indicating the homogeneous distribution of the CdS nanowire structures on the surface of g-C3N4 or between the layers of g-C3N4.
The element compositions and chemical states in the samples were further investigated through X-ray photoelectron spectra (XPS). As shown in Figure 4a, in comparison to the CdS and g-C3N4 samples, the G-CdS nanocomposites contained Cd, S, C, N, and O elements, and the presence of a slight amount of O element may be attributed to the absorbed oxygen (such as H2O and CO2) on the surface of the sample, in good agreement with the elemental mapping results. All the high-resolution spectra were calibrated by setting the binding energy of the C-C peak to 284.8 eV. Figure 4b shows the C1s spectrum, which was fitted using Gaussian functions to analyze the types and quantities of functional groups present in the sample. In g-C3N4, the C1s core-level spectra consisted of four peaks located at 284.8, 286.3, 288.2, and 293.6 eV, which could be attributed to C=C, N≡C- groups [38], N-C=N in typical s-triazine rings [39], and the carbon attached to uncondensed -NH2 groups [40], respectively. The strength of the N-C=N bond gradually weakened, which was attributed to the increasing concentration of CdS. At the same time, the position of the bond energy also shifted, indicating that the coupling between g-C3N4 and CdS became stronger. Figure 4e shows that the N 1s spectrum has three peaks at 398.6 and 400.8 eV, which were attributed to the bi-coordinated N (C=N-C) and N-H bonds, respectively. These peaks also gradually weakened and shifted. With the increase in the CdS concentration, two distinct peaks with binding energies of 404.9 and 411.7 eV appeared, corresponding to the Cd 3d5/2 and Cd 3d3/2 states, respectively, of the Cd atoms in the Cd-S bonds [6,41,42]. At the same time, the S 2p peak gradually emerged, which could be deconvoluted into two doublets using Gaussian fitting, as displayed in Figure 4e. These two peaks were located at 161.3 (S 2p 3/2) and 162.3 (S 2p1/2), which are characteristic of S species from CdS. It could clearly be seen that the two peaks moved towards a higher binding energy with the increase in the CdS concentration, which means that the crystallization quality and the coupling of the heterojunction further improved. These pieces of evidence, combined with the results of XRD, the FTIR spectra, and TEM, prove that there was a significant heterojunction between CdS and g-C3N4 in the G-CdS nanocomposites. This indicates that the G-CdS nanocomposite will exhibit excellent performance in terms of charge carrier transport. To determine the band structure, the valence band (VB) spectrum of XPS was measured to obtain the balance band potential (Evb, XPS) using VB-XPS plots, as shown in Figure 4f. The intersection of the epitaxial linear part with the x-axis provides the EVB, XPS of CdS, and g-C3N4 with values of 0.4 and 1.23 eV, respectively. Then, the EVB of the corresponding standard hydrogen electrode (EVB, NHE) could be calculated as follows [43]: EVB, NHE = ϕ + EVB, XPS-4.44, where ϕ is the work function of the instrument (4.258 eV). Therefore, the EVB, NHE of CdS and g-C3N4 were calculated as 1.05 and 0.22 eV, respectively.
The optical bandgap of a material determines the range of solar light absorption. Therefore, the optical properties were investigated using UV-vis diffuse reflectance spectra (Figure 5a). g-C3N4 and CdS exhibited sharp absorption band edges at 456 nm and 560 nm, respectively. Compared to g-C3N4, G-CdS exhibited a slight red shift in its diffuse reflectance spectrum, and the samples appeared darker in color, suggesting the formation of a composite structure of g-C3N4 and CdS in G-CdS. The redshift observed in the absorption spectra indicates a modification in the electronic band structure of g-C3N4, resulting from the formation of cyano group defects [38]. Consequently, the absorption edges of the G-CdS samples extend into the visible light region, enhancing the light absorption capability. According to the Tauc formula, the optical bandgap of the samples was calculated. The Tauc formula is as follows [6]: αhv = A(hvEg)n, where Eg, α, h, v, A, and n represent the optical bandgap, absorption coefficient, Planck’s constant, incident light frequency, a constant, and n = 1/2 for CdS, respectively. The fitting results, as shown in Figure 5b, indicate that the intersection between the linear extrapolation and the x-axis represents the optical bandgap. The optical bandgaps of g-C3N4, G-CdS-1, G-CdS-2, G-CdS-3, G-CdS-4, G-CdS-5, and CdS were 2.86, 2.8, 2.49, 2.45, 2.4, 2.36, and 2.29 eV, respectively.
Figure 6 shows the photocatalytic hydrogen generation rate of the g-C3N4, CdS, and G-CdS nanocomposites. It can be seen from the figure that the hydrogen production of all the samples was linear with respect to the time of light irradiation. The g-C3N4 sample exhibited the lowest hydrogen production performance (20.98 μmol·g−1·h−1). Moreover, the hydrogen production performance gradually increased with the increase in CdS loading, and the hydrogen production performance of G-CdS-3 reached the maximum (1611.4 μmol·g−1·h−1), while the performance gradually decayed with the further increase in CdS loading. The hydrogen production of the G-CdS-3 was 76 times higher than that of g-C3N4 and 10 times higher than that of CdS. It is well known that the photogenerated electrons and holes produced by CdS under light irradiation are inherently strong recombination phenomena. Therefore, when CdS was grown in situ in the interlayer of g-C3N4, the aggregation of g-C3N4 decreased, and the specific surface area could be increased at an appropriate concentration, exposing more active sites, effectively increasing the photogenerated carrier separation rate and improving the photocatalytic performance of the nanocomposite. The photocatalytic hydrogen production properties of related g-C3N4@CdS nanocomposites were investigated, and a comparison of these properties is shown in Table 1. As shown in Table 1, the G-CdS nanocatalysts in this paper demonstrated excellent performance. Furthermore, by measuring the XRD patterns of the G-CdS-3 nanocomposites after the hydrogen production experiment, it was found that the diffraction patterns were basically unchanged compared with those of the fresh sample, as shown in Figure 7.
By adding a certain amount of cadmium acetate and ammonia water into the ultrasonic g-C3N4 nanosheet aqueous solution, a cadmium complex, [Cd(NH3)4]2+, was formed in the alkaline environment. Under the action of ultrasound, the [Cd(NH3)4]2+ was uniformly attached to the g-C3N4 nanosheet. With the addition of thiourea, S2- formed in the alkaline solution, where ammonium acetate acted as a buffer to control the release rate of S. In this way, Cd and S heteronucleated in the layer of g-C3N4 to form CdS. When the accumulation of Cd and S ions exceeded the solubility of CdS, CdS nanoparticles were deposited on g-C3N4. In the XRD pattern (Figure 1), the (002) diffraction peak of g-C3N4 could be significantly shifted to the lower diffraction angle, which means that the layer spacing of g-C3N4 becomes larger. With the progress of the reaction, CdS grew along the (002) crystal planes, and CdS nanorods were formed. The chemical equation of the reaction is as follows:
Cd + NH3 → [Cd(NH3)4]2+
SC(NH2)2 + 3OH → 2NH3 + CO32− + HS
HS + OH → S2− + H2O
Cd2+ + S2− → CdS
Based on the results of XPS and the UV-vis absorption spectrum analysis, the band structures of the G-CdS nanocomposites are illustrated in Scheme 1. It can be seen that a Type Ⅱ heterojunction formed between CdS and g-C3N4, which is consistent with the band structure calculated theoretically in the literature [28]. Under light irradiation, electron hole pairs were generated, and the well-matched Type Ⅱ g-C3N4/CdS heterojunction could realize the positive synergistic effect of accelerating carrier separation and inhibiting CdS corrosion. In addition, during the preparation process, accompanied by ultrasound, g-C3N4 presented a monolayer or several layer structures, which had a van der Waals heterojunction with CdS. Therefore, the presence of an internal electric field in the heterojunction further promoted the separation of electron–hole pairs at the g-C3N4/CdS interface [28]. The separation of charge carriers in the G-CdS heterojunctions was also confirmed by photoluminescence and a photochemical test.
In order to further investigate the luminescent properties of the composite related to the recombination of photogenerated charge carriers under light irradiation, the photoluminescence spectra were measured with an excitation wavelength of 370 nm, as shown in Figure 8. It can be observed in the figure that g-C3N4 and CdS exhibited strong photoluminescence peaks, while the intensity of the photoluminescence peak in the G-CdS-3 nanocomposites was the weakest. This suggests that the G-CdS-3 sample has a lower probability of photogenerated carrier recombination under light irradiation, indicating higher photocatalytic efficiency.
In addition, the interfacial charge transfer and separation capabilities of the g-C3N4, CdS, and G-CdS nanocomposites were also investigated in photoelectric chemistry experiments. As shown in Figure 9, the photoelectric response of the G-CdS nanocomposites was higher than that of g-C3N4 and CdS. Moreover, G-CdS-3 exhibited the best photocurrent density, which had high hydrogen production performance. Furthermore, electrochemical impedance spectroscopy (EIS) was employed to delineate the carrier transport and separation processes, as illustrated in Figure 10. Within EIS spectroscopy, the arc radius serves as a gauge for electron transfer capacity and efficiency in separating photogenerated carriers, and it expedites interfacial charge transfer [48]. Our experimental findings reveal the G-CdS-3 sample exhibits the smallest arc radius, underscoring its superior charge transfer and photogenerated electron–hole pair separation capabilities. This underscores an accelerated interface charge transfer rate within the sample.

3. Experimental Section

3.1. Materials

Melamine (99%), cadmium acetate dihydrate (Cd(CH3COO)·H2O), 99.99%), ammonium acetate (CH3COONH4, 99%), ammonia solution (NH3·H2O, AR, 25–28%), and Thiourea (CH4N2S, 99%) were purchased from Aladdin Reagent Co., Ltd. (Shanghai, China), and they were used directly without further purification. Deionized water with 18 MΩ cm was used in our experiment.

3.2. Synthesis of g-C3N4 Nanosheets

Firstly, 5g melamine powder was heated to 550 °C in an alumina crucible with a lid using a tube furnace at a heating rate of 5 °C/min and kept in the air for 2 h. The collected yellow bulk g-C3N4 was ground into a fine powder in an agate mortar. Secondly, g-C3N4 nanosheets were obtained via the thermal etching of bulk g-C3N4 at 500 °C in the air for 2 h. Finally, the g-C3N4 nanosheets were washed in deionized water and ethanol three to four times in sequence.

3.3. Synthesis of G-CdS Heterojunction

A schematic diagram of the deposition process of CdS on g-C3N4 is shown in Scheme 2. The g-C3N4@CdS (G-CdS) heterojunction was prepared using a modified chemical bath deposition (CBD) method [49] with ultrasonic microwave photocatalytic synthesis. In brief, 500 mg g-C3N4 and a certain amount of Cd(CH3COO)·H2O were mixed in 200 mL of deionized water for ultrasonic dispersion. Two hours later, 0.03 M CH3COONH4 was added, and NH3·H2O was added to adjust the pH to 11. The abovementioned mixed solution was heated to 60 °C for 30 min. Then, 0.004 M CH4N2S was added to the solution and heated to 90 °C for 30 min. When the reaction was over, the solution naturally cooled to room temperature. After the reaction, the solution was washed with deionized water and ethanol, and then it was filtered to obtain heterojunction materials. Finally, the obtained nanocomposites were dried at 60 °C for 12 h. The prepared samples were marked as G-CdS-1, G-CdS-2, G-CdS-3, G-CdS-4, and G-CdS-5, indicating the amount of Cd(CH3COO)·H2O as 0.002 M, 0.004 M, 0.006 M, 0.008 M, and 0.01 M, respectively. As a reference, the synthesis process of CdS is similar to that of G-CdS-3, except that g-C3N4 is not added.

3.4. Characterization

The crystal structures of the g-C3N4, CdS, and G-CdS nanocomposites were characterized using an XRD with Cu Kα radiation, which operated at a voltage and current of 40 KV and 80 mA, respectively. The morphologies and microstructures of the nanocomposites were measured using TEM, Talos F200X G2, and HRTEM with an accelerated voltage of 200 KV, and super-X model energy dispersive spectroscopy was used to analyze the element distribution. For the TEM test, the ethanol solution containing 1 mg catalyst was dispersed evenly using ultrasound for 10 min, then dropped on the copper net, dried naturally, and measured. The characteristics of the functional groups in the synthetic materials were analyzed using FTIR, Thermo Scientific Nicolet iS20. The changes in the valence state and band structure of the elements in the nanocomposite were measured using XPS on a PHI 5000 Versaprobe Ⅲ spectroscopy instrument with monochromatic Al Kα radiation. Ultraviolet-visible diffuse reflectance spectra were obtained using a Hitachi UH4150 equipped with an integrating sphere. The steady-state photoluminescence was detected using a Hitachi F7000 spectrofluorometer with an excitation wavelength of 385 nm. The photocurrent performance and EIS spectroscopy were examined using a three-electrode electrochemical workstation (CHI660E, ChenHua Instrument Co., LTD, Shanghai, China). The reference electrode was Ag/AgCl, the counter electrode was a Pt plate, and the working electrode was an FTO glass with a catalyst. The electrolyte was a 0.5 M aqueous solution of Na2SO4.

3.5. Evaluation of Photocatalytic H2 Production Activity

For the measurement of photocatalytic H2 production, a reaction flask was filled with 50 mg photocatalyst, 20% lactic acid aqueous solution (10 mL) as a sacrificial agent, 100 mL of deionized water, and 3% wt Pt as a co-catalyst, using chloroplatinic acid as a Pt source. The mixed solution was ultrasonically dispersed for 30 min to obtain a uniformly dispersed suspension, which was then transferred to a quartz reactor connected to an online trace gas analysis system (Labsolar-6A, Perfectlight, Beijing, China). The system and the reactor were evacuated several times to ensure that the air was completely removed. The reactor was irradiated using a 300 W Xe arc lamp source, and the wavelength of the incident light was regulated by using a 420 nm long pass cut-off filter. The temperature of the reaction solution was maintained at 5 °C with a constant temperature water cooling system. The concentration of photocatalytic H2 production after light irradiation was analyzed using an online gas chromatograph (GC9720PLUS, Fuli instruments, Zhejiang, China) with a thermal conductive detector. After the photocatalysis, the photocatalyst was centrifuged, washed several times, and then vacuum dried at 60 °C.

4. Conclusions

In summary, a van der Waals heterojunction was successfully fabricated by introducing a continuous ultrasonic step in the process of the chemical bath deposition method. Continuous ultrasound prevented g-C3N4 from agglomerating, and it remained in a monolayer or ultra-thin state. The microstructure, morphology, and optical properties of the G-CdS heterojunction were characterized using XRD, SEM, TEM, and UV absorption spectra. The results show that CdS of a hexagonal wurtzite structure grew preferentially on g-C3N4, showing a nanorod structure. Moreover, there was a clear and tight contact interface between g-C3N4 and CdS, as well as a tight heterojunction between the two components, which helped to efficiently transfer charge carriers between the two semiconductors. Photocatalytic H2 production was also studied, and G-CdS-3 showed excellent photocatalytic performance; the catalytic mechanism was revealed using a Type Ⅱ mechanism. PL and photocurrent spectra proved that a Type Ⅱ heterojunction can accelerate carrier separation, reduce recombination, and improve photocatalytic H2 production.

Author Contributions

Conceptualization, L.M. and X.A.; methodology, W.J. and C.L.; validation, L.M., W.J. and C.L.; formal analysis, L.M., T.Z. and X.A.; investigation, W.J., C.L. and L.X.; resources, L.M. and X.A.; data curation, L.M. and W.J.; writing—original draft preparation, L.M., W.J., C.L., L.X., T.Z. and X.A.; writing—review and editing, L.M., W.J., C.L., L.X., T.Z. and X.A.; supervision, L.M. and X.A.; project administration, L.M. and X.A.; funding acquisition, L.M. and X.A. All authors have read and agreed to the published version of the manuscript.

Funding

This work was jointly supported by the National Natural Science Foundation of China (No. 12204245) and the Natural Science Foundation of the Jiangsu Higher Education Institutions of China (Nos. 21KJB140018, 21KJD430006, and 22KJB510030).

Institutional Review Board Statement

Not applicable.

Informed Consent Statement

Not applicable.

Data Availability Statement

Data are contained within the article.

Conflicts of Interest

The authors declare no conflict of interest.

References

  1. Dillon, M.E.; Wang, G.; Huey, R.B. Global metabolic impacts of recent climate warming. Nature 2010, 467, 704–706. [Google Scholar] [CrossRef] [PubMed]
  2. Zhang, L.; Zhang, J.J.; Yu, H.G.; Yu, J.G. Emerging S-scheme photocatalyst. Adv. Mater. 2022, 34, 2107668. [Google Scholar] [CrossRef]
  3. Lee, K.M.; Lai, C.W.; Ngai, K.S.; Juan, J.C. Recent developments of zinc oxide based photocatalyst in water treatment technology: A review. Water Res. 2016, 88, 428–448. [Google Scholar] [CrossRef] [PubMed]
  4. Maeda, K.; Teramura, K.; Lu, D.; Takata, T.; Saito, N.; Inoue, Y.; Domen, K. Photocatalyst releasing hydrogen from water. Nature 2006, 440, 295. [Google Scholar] [CrossRef] [PubMed]
  5. Zhao, Y.; Zhang, S.; Shi, R.; Waterhouse, I.; Tang, J.; Zhang, T. Two-dimensional photocatalyst design: A critical review of recent experimental and computational advances. Mater. Today 2020, 34, 78–91. [Google Scholar] [CrossRef]
  6. Ma, L.; Ai, X.; Yang, X.; Cao, X.; Han, D.; Song, X.; Jiang, H.; Yang, W.; Yan, S.; Wu, X. Cd (II)-based metal-organic framework-derived CdS photocatalysts for enhancement of photocatalytic activity. J. Mater. Sci. 2021, 56, 8643–8657. [Google Scholar] [CrossRef]
  7. Ma, L.; Ai, X.; Jiang, W.; Liu, P.; Chen, Y.; Lu, K.; Song, X.; Wu, X. Zn/Ce metal-organic framework-derived ZnO@CeO2 nano-heterojunction for enhanced photocatalytic activity. Colloid Interface Sci. Commun. 2022, 49, 100636. [Google Scholar] [CrossRef]
  8. Ma, L.; Ai, X.; Chen, Y.; Liu, P.; Lin, C.; Lu, K.; Jiang, W.; Wu, J.; Song, X. Improved photocatalytic activity via N-Type ZnO/p-Type NiO heterojunctions. Nanomaterials 2022, 12, 3665. [Google Scholar] [CrossRef]
  9. Xiao, N.; Li, S.; Li, X.; Ge, L.; Gao, Y.; Li, N. The roles and mechanism of cocatalysts in photocatalytic water splitting to produce hydrogen. Chin. J. Catal. 2020, 41, 642–671. [Google Scholar] [CrossRef]
  10. Modak, A.; Bhanja, P.; Dutta, S.; Chowdhury, B.; Bhaumik, A. Catalytic reduction of CO2 into fuels and fine chemicals. Green Chem. 2020, 22, 4002–4033. [Google Scholar] [CrossRef]
  11. Song, Y.; Johnson, D.; Peng, R.; Hensley, D.K.; Bonnesen, P.V.; Liang, L.; Huang, J.; Yang, F.; Zhang, F.; Qiao, R.; et al. A physical catalyst for the electrolysis of nitrogen to ammonia. Sci. Adv. 2018, 4, e1700336. [Google Scholar] [CrossRef] [PubMed]
  12. Cheng, L.; Xiang, Q.; Liao, Y.; Zhang, H. CdS-based photocatalysts. Energy Environ. Sci. 2018, 11, 1362–1391. [Google Scholar] [CrossRef]
  13. Wang, L.; Cheng, B.; Zhang, L.; Yu, J. In situ irradiated XPS investigation on S-scheme TiO2@ ZnIn2S4 photocatalyst for efficient photocatalytic CO2 reduction. Small 2021, 17, 2103447. [Google Scholar] [CrossRef] [PubMed]
  14. Li, X.-L.; Yang, G.; Li, S.; Xiao, N.; Li, N.; Gao, Y.; Lv, D.; Ge, L. Novel dual co-catalysts decorated Au@ HCS@ PdS hybrids with spatially separated charge carriers and enhanced photocatalytic hydrogen evolution activity. Chem. Eng. J. 2020, 379, 122350. [Google Scholar] [CrossRef]
  15. Guo, Q.; Zhou, C.; Ma, Z.; Yang, X. Fundamentals of TiO2 photocatalysis: Concepts, mechanisms, and challenges. Adv. Mater. 2019, 31, 1901997. [Google Scholar] [CrossRef]
  16. Mamiyev, Z.; Balayeva, N.O. Metal sulfide photocatalysts for hydrogen generation: A review of recent advances. Catalysts 2022, 12, 1316. [Google Scholar] [CrossRef]
  17. Fu, J.; Yu, J.; Jiang, C.; Cheng, B. g-C3N4-Based heterostructured photocatalysts. Adv. Energy Mater. 2018, 8, 1701503. [Google Scholar] [CrossRef]
  18. Lu, M.; Pei, Z.; Weng, S.; Feng, W.; Fang, Z.; Zheng, Z.; Huang, M.; Liu, P. Constructing atomic layer g-C3N4-CdS nanoheterojunctions with efficiently enhanced visible light photocatalytic activity. Phys. Chem. Chem. Phys. 2014, 16, 21280–21288. [Google Scholar] [CrossRef]
  19. Soheila, A.; Aziz, H. g-C3N4/carbon dot-based nanocomposites serve as efficacious photocatalysts for environmental purification and energy generation: A review. J. Clean. Prod. 2020, 276, 124319. [Google Scholar]
  20. Wen, J.; Xie, J.; Chen, X.; Li, X. A review on g-C3N4-based photocatalysts. Appl. Surf. Sci. 2017, 391, 72–123. [Google Scholar] [CrossRef]
  21. Wang, X.; Maeda, K.; Thomas, A.; Takanabe, K.; Xin, G.; Carlsson, J.; Domen, K.; Antonietti, M. A metal-free polymeric photocatalyst for hydrogen production from water under visible light. Nat. Mater. 2009, 8, 76–80. [Google Scholar] [CrossRef] [PubMed]
  22. Wang, Y.; Zhang, X.; Liu, Y.; Zhao, Y.; Xie, C.; Song, Y. Crystallinity and phase controlling of g-C3N4/CdS hetrostructures towards high efficient photocatalytic H2 generation. Int. J. Hydrogen Energy 2019, 44, 30151–30159. [Google Scholar] [CrossRef]
  23. Ghosh, U.; Majumdar, A.; Pal, A. Photocatalytic CO2 reduction over g-C3N4 based heterostructures: Recent progress and prospects. J. Environ. Chem. Eng. 2021, 9, 104631. [Google Scholar] [CrossRef]
  24. Kadi, M.W.; Mohamed, R.; Ismail, A.; Bahnemann, D. Soft and hard templates assisted synthesis mesoporous CuO/g-C3N4 heterostructures for highly enhanced and accelerated Hg (II) photoreduction under visible light. J. Colloid Interface Sci. 2020, 580, 223–233. [Google Scholar] [CrossRef]
  25. Zhu, Q.; Xu, Z.; Qiu, B.; Xing, M.; Zhang, J. Emerging cocatalysts on g-C3N4 for photocatalytic hydrogen evolution. Small 2021, 17, 2101070. [Google Scholar] [CrossRef]
  26. Ran, Y.; Cui, Y.; Zhang, Y.; Fang, Y.; Zhang, W.; Yu, X.; Lan, H.; An, X. Assembly-synthesis of puff pastry-like g-C3N4/CdS heterostructure as S-junctions for efficient photocatalytic water splitting. Chem. Eng. J. 2022, 431, 133348. [Google Scholar] [CrossRef]
  27. Zhao, Y.-F.; Sun, Y.; Yin, X.; Chen, R.; Yin, G.; Sun, M.; Liu, B. The 2D porous g-C3N4/CdS heterostructural nanocomposites with enhanced visible-light-driven photocatalytic activity. J. Nanosci. Nanotechnol. 2020, 20, 1098–1108. [Google Scholar] [CrossRef]
  28. Liu, J. Origin of high photocatalytic efficiency in monolayer g-C3N4/CdS heterostructure: A hybrid DFT study. J. Phys. Chem. C 2015, 119, 28417–28423. [Google Scholar] [CrossRef]
  29. Rong, X.; Qiu, F.; Zhao, H.; Yan, J.; Zhu, X.; Yang, D. Fabrication of single-layer graphitic carbon nitride and coupled systems for the photocatalytic degradation of dyes under visible-light irradiation. Eur. J. Inorg. Chem. 2015, 2015, 1359–1367. [Google Scholar] [CrossRef]
  30. Zhao, D.; Wang, Y.; Dong, C.; Huang, Y.; Chen, J.; Xue, F.; Shen, S.; Guo, L. Boron-doped nitrogen-deficient carbon nitride-based Z-scheme heterostructures for photocatalytic overall water splitting. Nat. Energy 2021, 6, 388–397. [Google Scholar] [CrossRef]
  31. Wang, Y.; Liu, X.; Liu, J.; Han, B.; Hu, X.; Yang, F.; Xu, Z.; Li, Y.; Jia, S.; Li, Z.; et al. Carbon quantum dot implanted graphite carbon nitride nanotubes: Excellent charge separation and enhanced photocatalytic hydrogen evolution. Angew. Chem. 2018, 130, 5867–5873. [Google Scholar] [CrossRef]
  32. Tan, M.; Ma, Y.; Yu, C.; Luan, Q.; Li, J.; Liu, C.; Dong, W.; Su, Y.; Qiao, L.; Gao, L.; et al. Boosting photocatalytic hydrogen production via interfacial engineering on 2D ultrathin Z-scheme ZnIn2S4/g-C3N4 heterojunction. Adv. Funct. Mater. 2022, 32, 2111740. [Google Scholar] [CrossRef]
  33. Qin, Y.; Li, H.; Lu, J.; Feng, Y.; Meng, F.; Ma, C.; Yan, Y.; Meng, M. Synergy between van der waals heterojunction and vacancy in ZnIn2S4/g-C3N4 2D/2D photocatalysts for enhanced photocatalytic hydrogen evolution. Appl. Catal. B Environ. 2020, 277, 119254. [Google Scholar] [CrossRef]
  34. Gao, B.; Liu, L.; Liu, J.; Yang, F. Photocatalytic degradation of 2, 4, 6-tribromophenol over Fe-doped ZnIn2S4: Stable activity and enhanced debromination. Appl. Catal. B Environ. 2013, 129, 89–97. [Google Scholar] [CrossRef]
  35. Devamani, R.H.P.; Kiruthika, R.; Mahadevi, P.; Sagithapriya, S. Synthesis and characterization of cadmium sulfide nanoparticles. Int. J. Innov. Sci. Eng. Technol. 2017, 4, 181–185. [Google Scholar]
  36. Dastan, D.; Panahi, S.L.; Chaure, N.B. Characterization of titania thin films grown by dip-coating technique. J. Mater. Sci. Mater. Electron. 2016, 27, 12291–12296. [Google Scholar] [CrossRef]
  37. Dastan, D.; Chaure, N.; Kartha, M. Surfactants assisted solvothermal derived titania nanoparticles: Synthesis and simulation. J. Mater. Sci. Mater. Electron. 2017, 28, 7784–7796. [Google Scholar] [CrossRef]
  38. Wang, Z.; Wang, Z.; Zhu, X.; Ai, C.; Zeng, Y.; Shi, W.; Zhang, X.; Zhang, H.; Si, H.; Li, J.; et al. Photodepositing CdS on the active cyano groups decorated g-C3N4 in Z-scheme manner promotes visible-light-driven hydrogen evolution. Small 2021, 17, 2102699. [Google Scholar] [CrossRef]
  39. Li, H.; An, M.; Zhao, Y.; Pi, S.; Li, C.; Sun, W.; Wang, H. Co nanoparticles encapsulated in N-doped carbon nanofibers as bifunctional catalysts for rechargeable Zn-air battery. Appl. Surf. Sci. 2019, 478, 560–566. [Google Scholar] [CrossRef]
  40. Madhurima, V.; Kumari, K.; Jain, P. A facile single-step approach to achieve in situ expanded g-C3N4 for improved photodegradation performance. Polym. Adv. Technol. 2023, 34, 578–586. [Google Scholar] [CrossRef]
  41. Ma, L.; Liu, W.; Cai, H.; Zhang, F.; Wu, X. Catalyst-and template-free low-temperature in situ growth of n-type CdS nanowire on p-type CdTe film and p-n heterojunction properties. Sci. Rep. 2016, 6, 38858. [Google Scholar] [CrossRef] [PubMed]
  42. Jiang, N.; Xiu, Z.; Xie, Z.; Li, H.; Zhao, G.; Wang, W.; Wu, Y.; Hao, X. Reduced graphene oxide-CdS nanocomposites with enhanced visible-light photoactivity synthesized using ionic-liquid precursors. New J. Chem. 2014, 38, 4312–4320. [Google Scholar] [CrossRef]
  43. Li, X.; Kang, B.; Dong, F.; Zhang, Z.; Luo, X.; Han, L.; Huang, J.; Feng, Z.; Chen, Z.; Xu, J.; et al. Enhanced photocatalytic degradation and H2/H2O2 production performance of S-pCN/WO2.72 S-scheme heterojunction with appropriate surface oxygen vacancies. Nano Energy 2021, 81, 105671. [Google Scholar] [CrossRef]
  44. Güy, N. Directional transfer of photocarriers on CdS/g-C3N4 heterojunction modified with Pd as a cocatalyst for synergistically enhanced photocatalytic hydrogen production. Appl. Surf. Sci. 2020, 522, 146442. [Google Scholar] [CrossRef]
  45. Jiang, W.; Zong, X.; An, L.; Hua, S.; Miao, X.; Luan, S.; Wen, Y.; Tao, F.; Sun, Z. Consciously constructing heterojunction or direct Z-scheme photocatalysts by regulating electron flow direction. ACS Catal. 2018, 8, 2209–2217. [Google Scholar] [CrossRef]
  46. Ding, X.; Li, Y.; Zhao, J.; Zhu, Y.; Li, Y.; Deng, W.; Wang, C. Enhanced photocatalytic H2 evolution over CdS/Au/g-C3N4 composite photocatalyst under visible-light irradiation. APL Mater. 2015, 3, 104410. [Google Scholar] [CrossRef]
  47. Ji, C.; Du, C.; Steinkruger, J.; Zhou, C.; Yang, S. In-situ hydrothermal fabrication of CdS/g-C3N4 nanocomposites for enhanced photocatalytic water splitting. Mater. Lett. 2019, 240, 128–131. [Google Scholar] [CrossRef]
  48. Wu, H.; Meng, S.; Zhang, J.; Zhang, X.; Wang, Y.; Chen, S.; Qi, G.; Fu, X. Construction of two-dimensionally relative p-n heterojunction for efficient photocatalytic redox reactions under visible light. Appl. Surf. Sci. 2020, 505, 144638. [Google Scholar] [CrossRef]
  49. Ma, L.; Ai, X.; Wu, X. Effect of substrate and Zn doping on the structural, optical and electrical properties of CdS thin films prepared by CBD method. J. Alloys Compd. 2017, 691, 399–406. [Google Scholar] [CrossRef]
Figure 1. (a) XRD patterns and (b) FTIR patterns of CdS, g-C3N4, and G-CdS nanocomposites.
Molecules 28 07846 g001
Figure 2. TEM images of (a) g-C3N4 without ultrasound, (b) CdS, (d) G-CdS-1, (f) G-CdS-3, and (h) G-CdS-5. HRTEM images (c) CdS, (e) G-CdS-1, (g) G-CdS-3, and (i) G-CdS-5. The red circled areas and green circled areas correspond to CdS and g-C3N4.
Molecules 28 07846 g002
Figure 3. Element mapping of G-CdS-3 nanocomposites: (a) high-angle annular dark-field image, (b) C element, (c) N element, (d) Cd element, (e) S element, and (f) overlay diagram of element mapping.
Molecules 28 07846 g003
Figure 4. XPS spectra of g-C3N4, CdS, and G-CdS nanocomposites: (a) survey spectrum, (b) C 1s, (c) N 1s, (d) Cd 3d, (e) S 2p, and (f) valence-band spectra. (b,e) are the results of Gaussian fitting.
Molecules 28 07846 g004
Figure 5. (a) UV-vis diffuse reflection spectra, and (b) the corresponding Tauc plots of (αhv)2 versus hv for the g-C3N4, CdS, and G-CdS nanocomposites.
Molecules 28 07846 g005
Figure 6. (a,b) Visible-light photocatalytic H2 production rate of g-C3N4, CdS, and G-CdS nanocomposites.
Molecules 28 07846 g006
Figure 7. XRD patterns of G-CdS-3 before and after hydrogen production experiments.
Molecules 28 07846 g007
Scheme 1. Diagram of the band edge positions G-CdS nanocomposites.
Molecules 28 07846 sch001
Figure 8. Photoluminescence emission spectra of CdS, g-C3N4, and G-CdS.
Molecules 28 07846 g008
Figure 9. Photocurrent response curves of g-C3N4, CdS, and G-CdS nanocomposites.
Molecules 28 07846 g009
Figure 10. ESI Nyquist plots of g-CN, G-CdS, and CdS.
Molecules 28 07846 g010
Scheme 2. Schematic diagram of the formation process of G-CdS heterostructure.
Molecules 28 07846 sch002
Table 1. Comparison of H2 evolution performance between G-CdS-3 and other reported photocatalysts.
CatalystSynthesis MethodDosage (mg)Type of Light SourceSacrificial ReagentH2 Evolution Rate (μmol·g−1·h−1)Refs.
Pd-CdS/g-C3N4hydrothermal method and
borohydride
reduction method
50300 W Xe arc Lamp
(λ > 400 nm)
0.5 M Na2S and 0.5 M
Na2SO3
293.0[44]
CdS/g-C3N4photodeposited
method
10300 W Xe arc Lamp
(λ > 420 nm)
0.5 M Na2S and 0.5 M
Na2SO3
56.9[45]
CdS/Au/g-C3N4photodeposited
method
100Xenon Lamp
(λ > 420 nm)
10 mL methanol19.02[46]
CdS/g-C3N4hydrothermal
synthesis
10300 W Xe arc Lamp
(λ > 400 nm)
20 mL triethanolamine216.48[47]
G-CdSmodified CBD
method
50300 W Xe arc Lamp
(λ > 420 nm)
20% lactic acid aqueous
solution
1611.4 μmol·g−1·h−1This work
Disclaimer/Publisher’s Note: The statements, opinions and data contained in all publications are solely those of the individual author(s) and contributor(s) and not of MDPI and/or the editor(s). MDPI and/or the editor(s) disclaim responsibility for any injury to people or property resulting from any ideas, methods, instructions or products referred to in the content.

