Article

Development of a Ratiometric Fluorescent Cu(II) Indicator Based on Poly(N-isopropylacrylamide) Thermal Phase Transition and an Aminopyridyl Cu(II) Ligand

by
Lea Nyiranshuti
1,†,
Emily R. Andrews
1,‡,
Leonid I. Povolotskiy
1,‡,§,
Frances M. Gomez
1,
Nathan R. Bartlett
1,
Arun Timothy Royappa
2,
Arnold L. Rheingold
3,
William Rudolf Seitz
1 and
Roy P. Planalp
1,*
1
Department of Chemistry, University of New Hampshire, Durham, NH 03824, USA
2
Department of Chemistry, University of West Florida, Pensacola, FL 32514, USA
3
Department of Chemistry, University of California San Diego, La Jolla, CA 92093, USA
*
Author to whom correspondence should be addressed.
Current address: Rayzebio, Inc., San Diego, CA 92121, USA.
These authors contributed equally to this work.
§
Current address: Cambridge Isotope Laboratories, Inc., Andover, MA 01810, USA.
Molecules 2023, 28(20), 7097; https://doi.org/10.3390/molecules28207097
Submission received: 24 December 2022 / Revised: 30 September 2023 / Accepted: 9 October 2023 / Published: 15 October 2023
(This article belongs to the Special Issue Fluorescence Chemosensors: Design, Synthesis, and Application)

Abstract

:
An aqueous Cu2+ and Zn2+ indicator is reported based on copolymerizing aminopyridine ligands and the environment-sensitive dansyl fluorophore into the responsive polymer poly(N-isopropylacrylamide) (PNIPAm). The metal ion binding creates charge and solvation that triggers PNIPAm’s thermal phase transition from hydrophobic globule to hydrophilic open coil. As a basis for sensing the metal-binding, the dansyl fluorescence emission spectra provide a signal at ca. 530 nm and a signal at 500 nm for the hydrophobic and hydrophilic environment, respectively, that are ratiometrically interpreted. The synthesis of the title pyridylethyl-pyridylmethyl-amine ligand (acronym PEPMA) with a 3-carbon linker to the copolymerizable group, aminopropylacrylamide (PEPMA-C3-acrylamide), is reported, along with a nonpolymerizable model ligand derivative. The response of the polymer is validated by increasing temperature from 25 °C to 49 °C, which causes a shift in maximum emission wavelength from 536 nm to 505 nm, along with an increase in the ratio of emission intensity of 505 nm/536 nm from 0.77 to 1.22 (λex = 330 nm) as the polymer releases water. The addition of divalent Cu or Zn to the indicator resulted in a dansyl emission shift of 10 nm to a longer wavelength, accompanied by fluorescence quenching in the case of Cu2+. The addition of EDTA to the Cu2+-loaded indicator reversed the fluorescence shift at 25 °C to 35 °C. The affinities of Cu2+ and Zn2+ for the PEPMA derivatives are log Kf = 11.85 and log Kf = 5.67, respectively, as determined by potentiometric titration. The single-crystal X-ray structure of the Cu2+-PEPMA derivative is five-coordinate, of-geometry intermediate between square-pyramidal and trigonal-bipyramidal, and is comparable to that of Cu2+ complexes with similar formation constants.

Graphical Abstract

1. Introduction

Water contamination due to industrial and agricultural development is a growing problem. Framed in terms of planetary boundaries [1], freshwater use is presently at a level of ca. 2600 km3 year–1, which is below an estimated boundary of 4000 km3 year–1; however, freshwater use is exceeding local boundaries at parts of the planet in North America, Asia, and Europe [1]. Contaminants that threaten the freshwater supply include aqueous copper, for which the US Environmental Protection Agency’s accepted maximum level in drinking water is 1.3 mg/L [2], and in wastewater effluents, no more than 6.5 mg/L [3]. Cu2+ in amounts of 10–100 µg/L are essential for life [4,5]; however, amounts over the EPA limits cause human illness, and the death of aquatic organisms [6]. It is therefore important to develop methods to monitor Cu2+ in natural waters.
To detect low copper concentrations from small samples, fluorescent indicators are most desirable [7]. However, Cu2+ is a paramagnetic ion that quenches fluorescence when bound near a fluorophore [8,9]. The mode of detection is therefore a loss of fluorescence upon binding, or “turn-off” response [10,11]. A turn-off response cannot be distinguished from other processes that diminish fluorescence, such as indicator degradation or photobleaching. We have approached the challenges of paramagnetic ion sensing by designing ratiometric fluorescent Cu2+ indicators that are based on polymer phase transitions monitored by a fluorophore that is remote from the Cu2+-binding site [12,13,14,15]. The indicator structure and its synthesis is shown in Figure 1a, and its mode of action in Figure 1b. Poly(N-isopropylacrylamide) (PNIPAm) is soluble in water below its LCST due to the hydrogen bonding between water and the amide group, and it exists in a coiled form. Hydrogen bonds are broken at the lower critical solution temperature (LCST) of 32 °C, and the polymer precipitates out of solution as a globule form. Complexation of a metal ion to the polymer at a temperature above LCST makes the polymeric environment more solvated, which drives the polymer to the soluble coiled form. The environment-sensitive fluorophore dansyl provides a readout of polymer coil/globule status indicated by a fluorescence shift. As dansyl is subjected to the more hydrophilic coil environment, emission intensity increases and maximum emission wavelength decreases, which is due to an increase in hydrogen bonding to the dimethylanilino group of dansyl.
Through the design of appropriate Cu2+ ligands, incorporated in the structure of Figure 1a, we seek to detect specific ranges of Cu2+ concentration. The range to be monitored is determined by the concentration of aqueous, unligated Cu2+, and is prescribed by Cu2+ speciation in natural waters and the uptake of copper by aquatic organisms [16]. Current theories of environmental copper toxicity focus on its bioavailability, referred to as the biotic ligand model (Figure 2). The copper in natural waters is usually bound to natural aqueous ligands, particularly to the carboxylate groups of humic and fulvic acid. Referred to as “dissolved organic carbon” (DOC), these acids’ affinity for Cu2+ yields an approximate concentration of free Cu2+ in the 100 nM range. In the example of toxicity to fish species, copper binds to carboxylate groups of membrane glycolipids, which thereby fatally disrupts the Na+ ion regulatory process [17,18,19]. The toxicity of copper is therefore a question of competition for copper between the natural ligands in water and the ligands of the organism, both of which contain carboxylate ligands.
Herein, we report indicator development using the ligand (PEPMA-C3-acrylamide) (Scheme 1) and the methodology of Figure 1b. The design of the base Cu2+–ligand, PEPMA, was inspired by the desire to create an asymmetric bonding environment for Cu2+. PEPMA binds Cu2+ providing two different ring sizes, one five-membered and one six-membered, which can accommodate the differences in Cu2+–ligand bond lengths in accord with the Jahn–Teller effect.

2. Results and Discussion

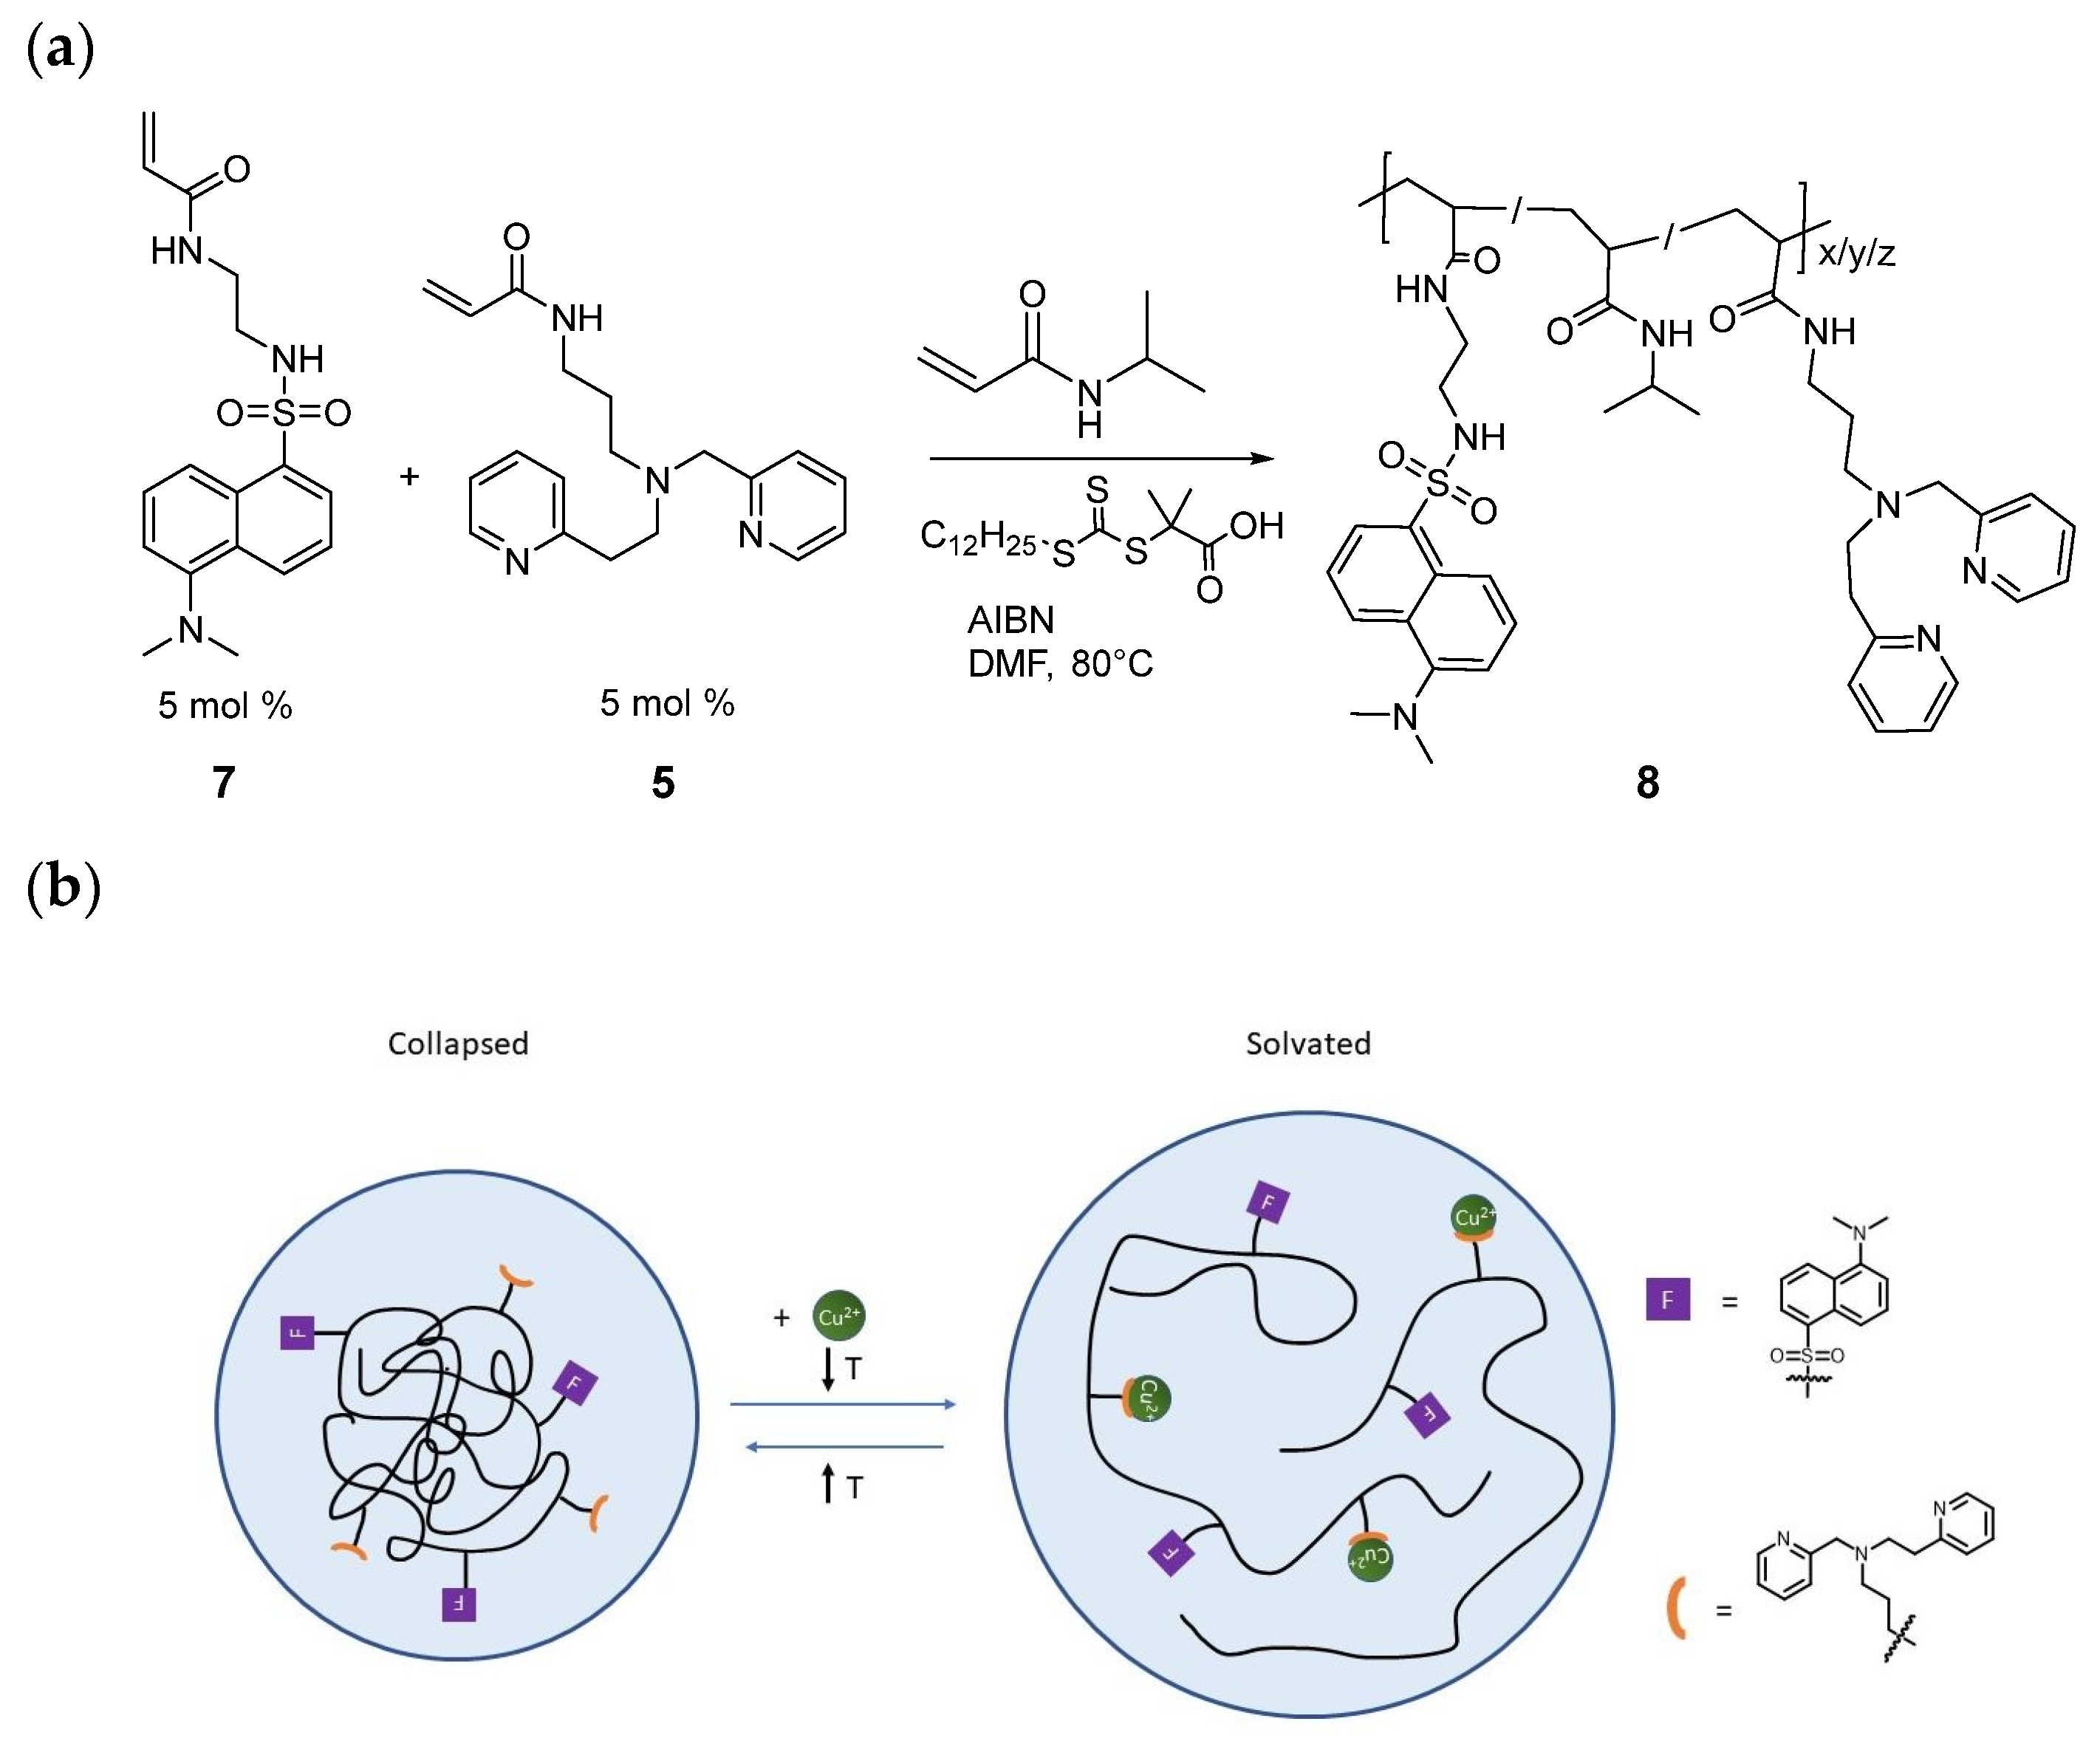
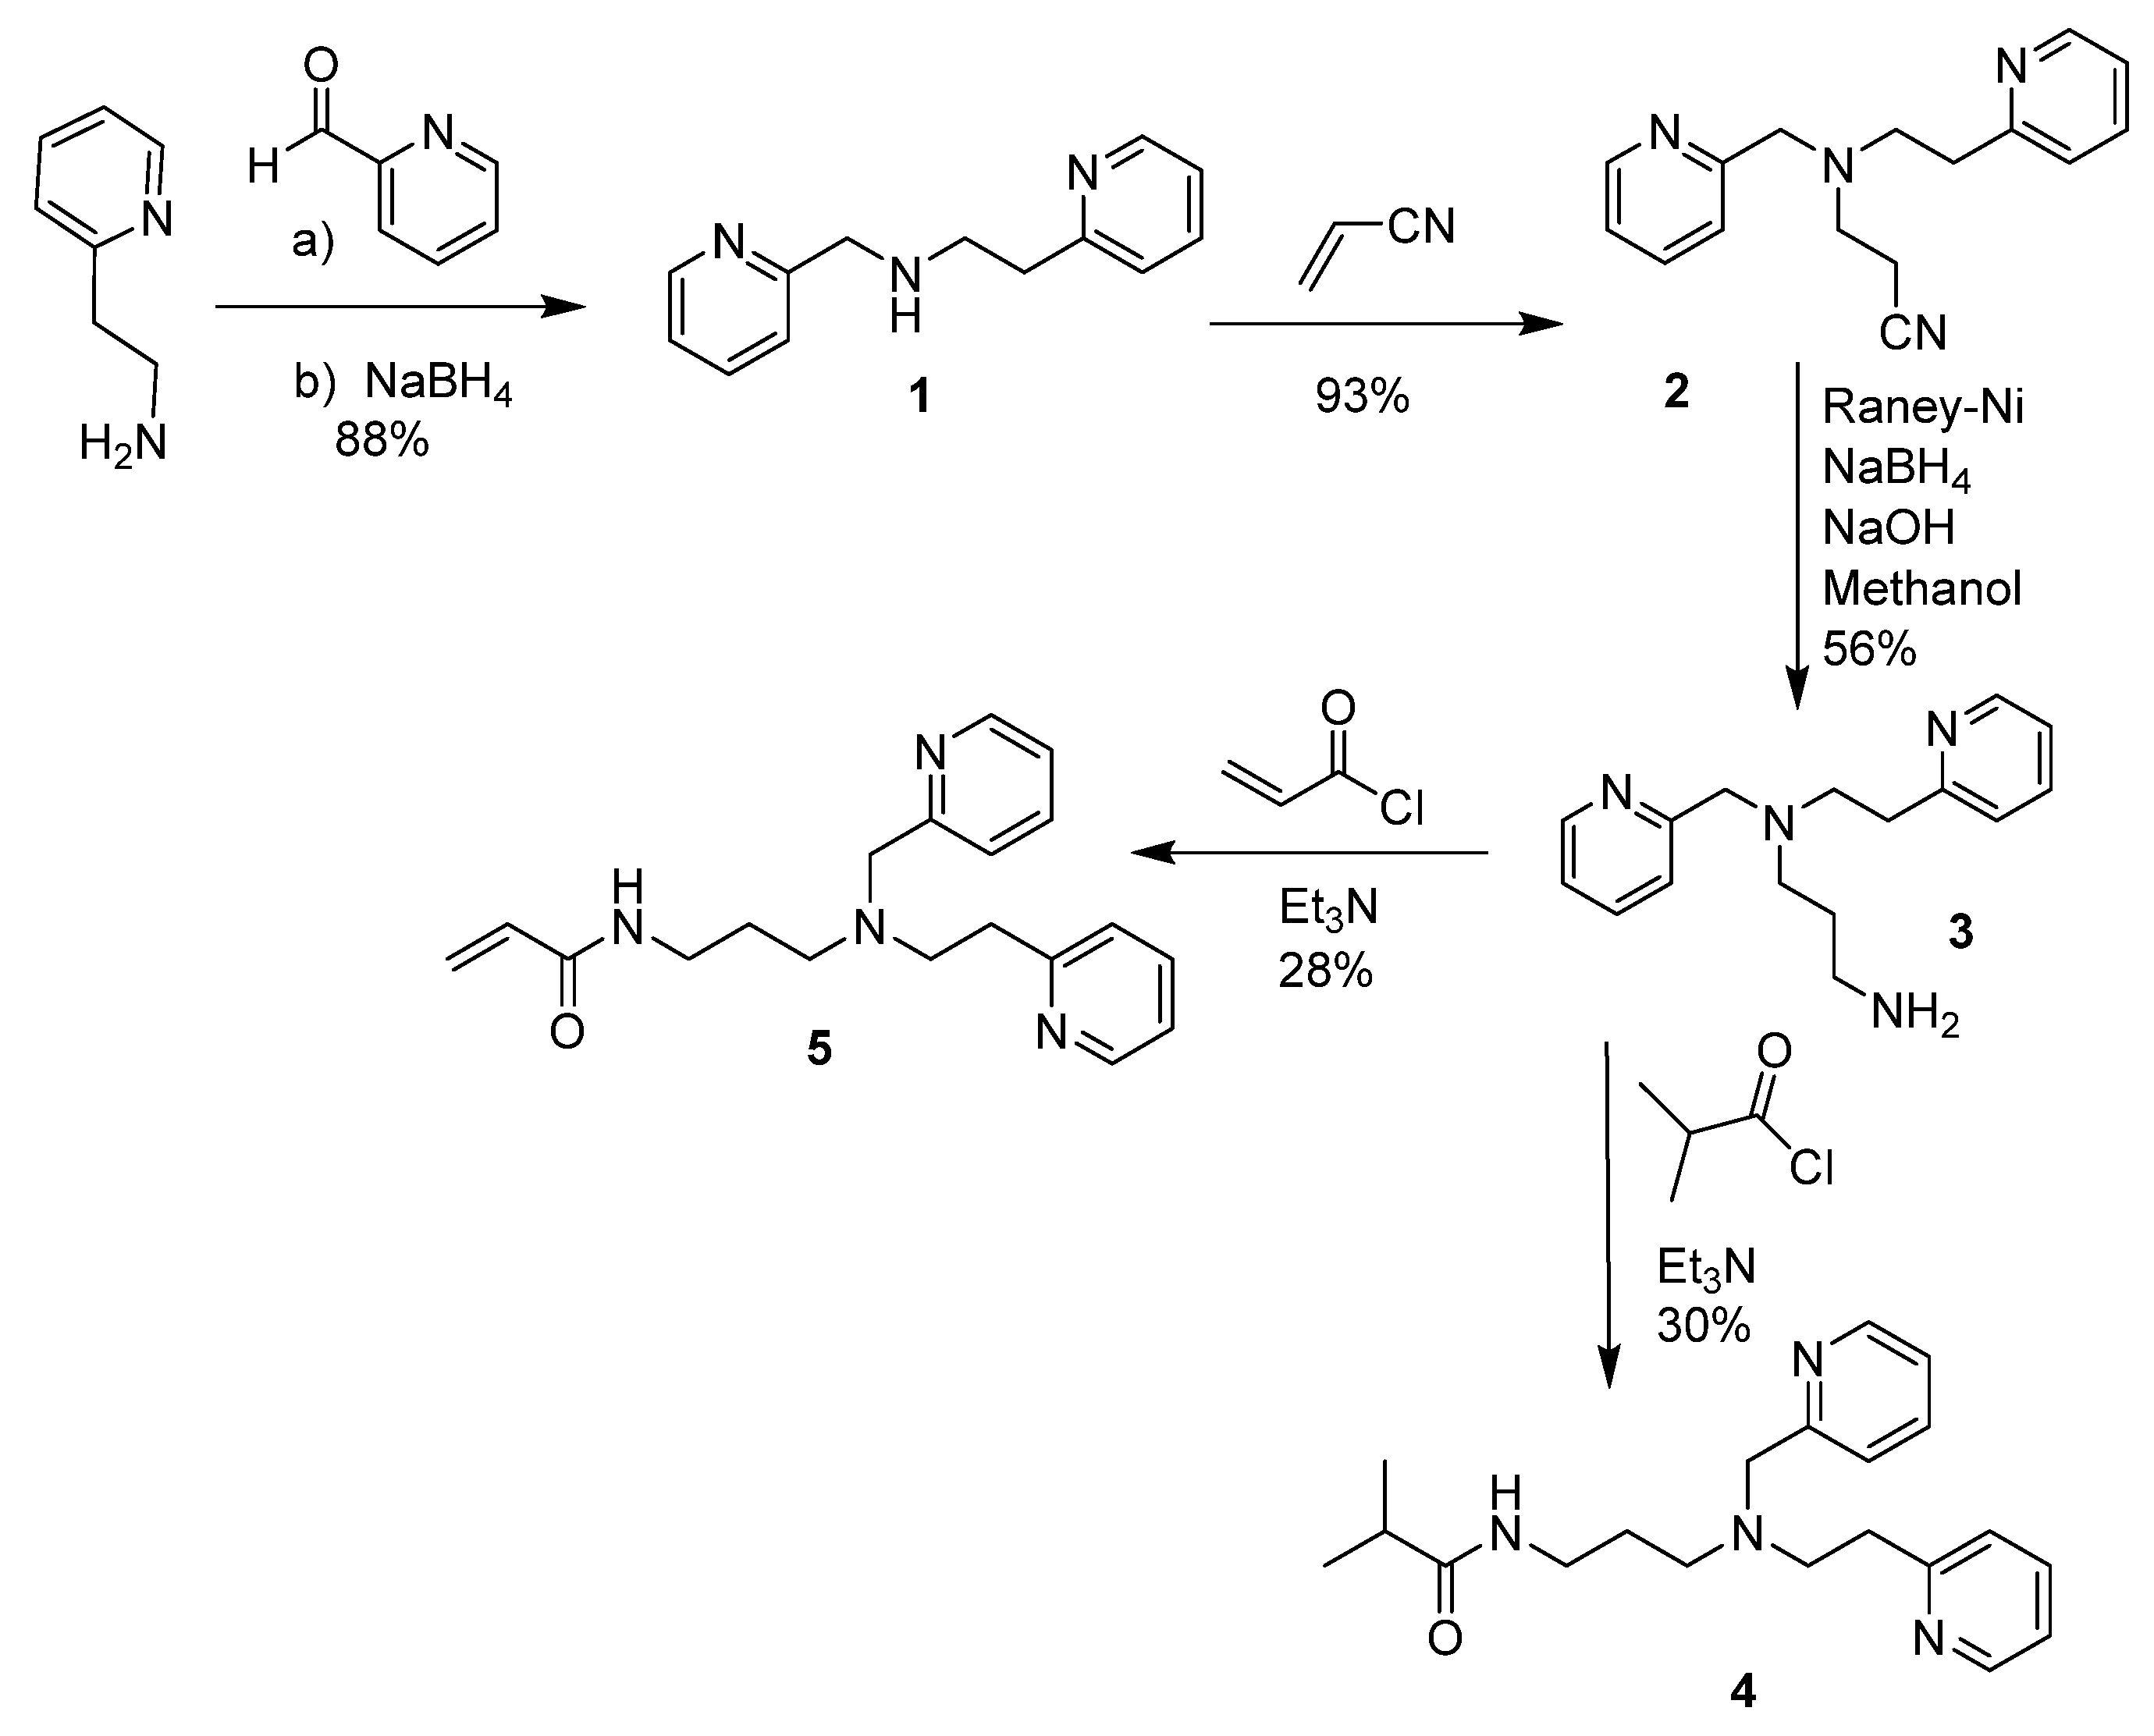
2.1. Synthesis and Characterization of PEPMA-C3-Acrylamide, the PEPMA-C3-Isobutyramide Model Ligand, and the Indicator Polymer 8

In order to use PEPMA in a polymeric indicator, it was necessary to prepare PEPMA-C3-acrylamide 5. Acrylamide 5 was synthesized via condensation of 2-(2-ethylamino) pyridine and 2-pyridinecarboxyaldehyde followed by in situ reduction with NaBH4 to obtain the corresponding secondary amine 1 (Scheme 1). Because the attachment of the coordinating N to the carbonyl of the acryloyl group would reduce its basicity and therefore the ligand affinity for Cu2+, a three-carbon spacer unit was incorporated between the metal-coordinating motif and the acrylamide group. Michael addition between 1 and acrylonitrile afforded 2, which was then reduced to primary amine 3 with Raney-Ni and NaBH4. The addition of isobutyryl chloride or acryloyl chloride to 3 afforded the PEPMA-C3-isobutyramide model ligand 4 or the PEPMA-C3-acrylamide ligand 5, respectively. Ligand 4 was prepared for structural studies because the acryloyl group present in 5 would be unstable during metal complexation studies. The Cu2+-complexation properties of PEPMA in ligand 4 were verified by a Job’s plot study, which indicated maximum absorbance at approximately 1:1 metal:ligand ratio (Supplementary Materials).
To incorporate the fluorescent group dansyl into the indicator, a polymerizable derivative was prepared by the addition of ethylenediamine to dansyl chloride, followed by amidation with acryloyl chloride to afford 7. Copolymerization of ligand 5 and fluorophore 7 with N-isopropylacrylamide afforded the target metal ion indicator 8 (Figure 1a). The indicator was prepared with 4.3 mol % of PEPMA-C3-acrylamide and 2.35 mol % of the dansyl fluorophore, as informed by 1H NMR (Supplementary Materials). Monomer incorporation percentages of PEPMA ligand 5 and dansyl fluorophore 7 were determined as 4.1% and 2.1%, respectively, as determined with 1H-NMR (Supplemental Materials). An average molecular weight of 34,000 g/mol was determined via diffusion order spectroscopy (DOSY) NMR (Supplementary Materials) [19].

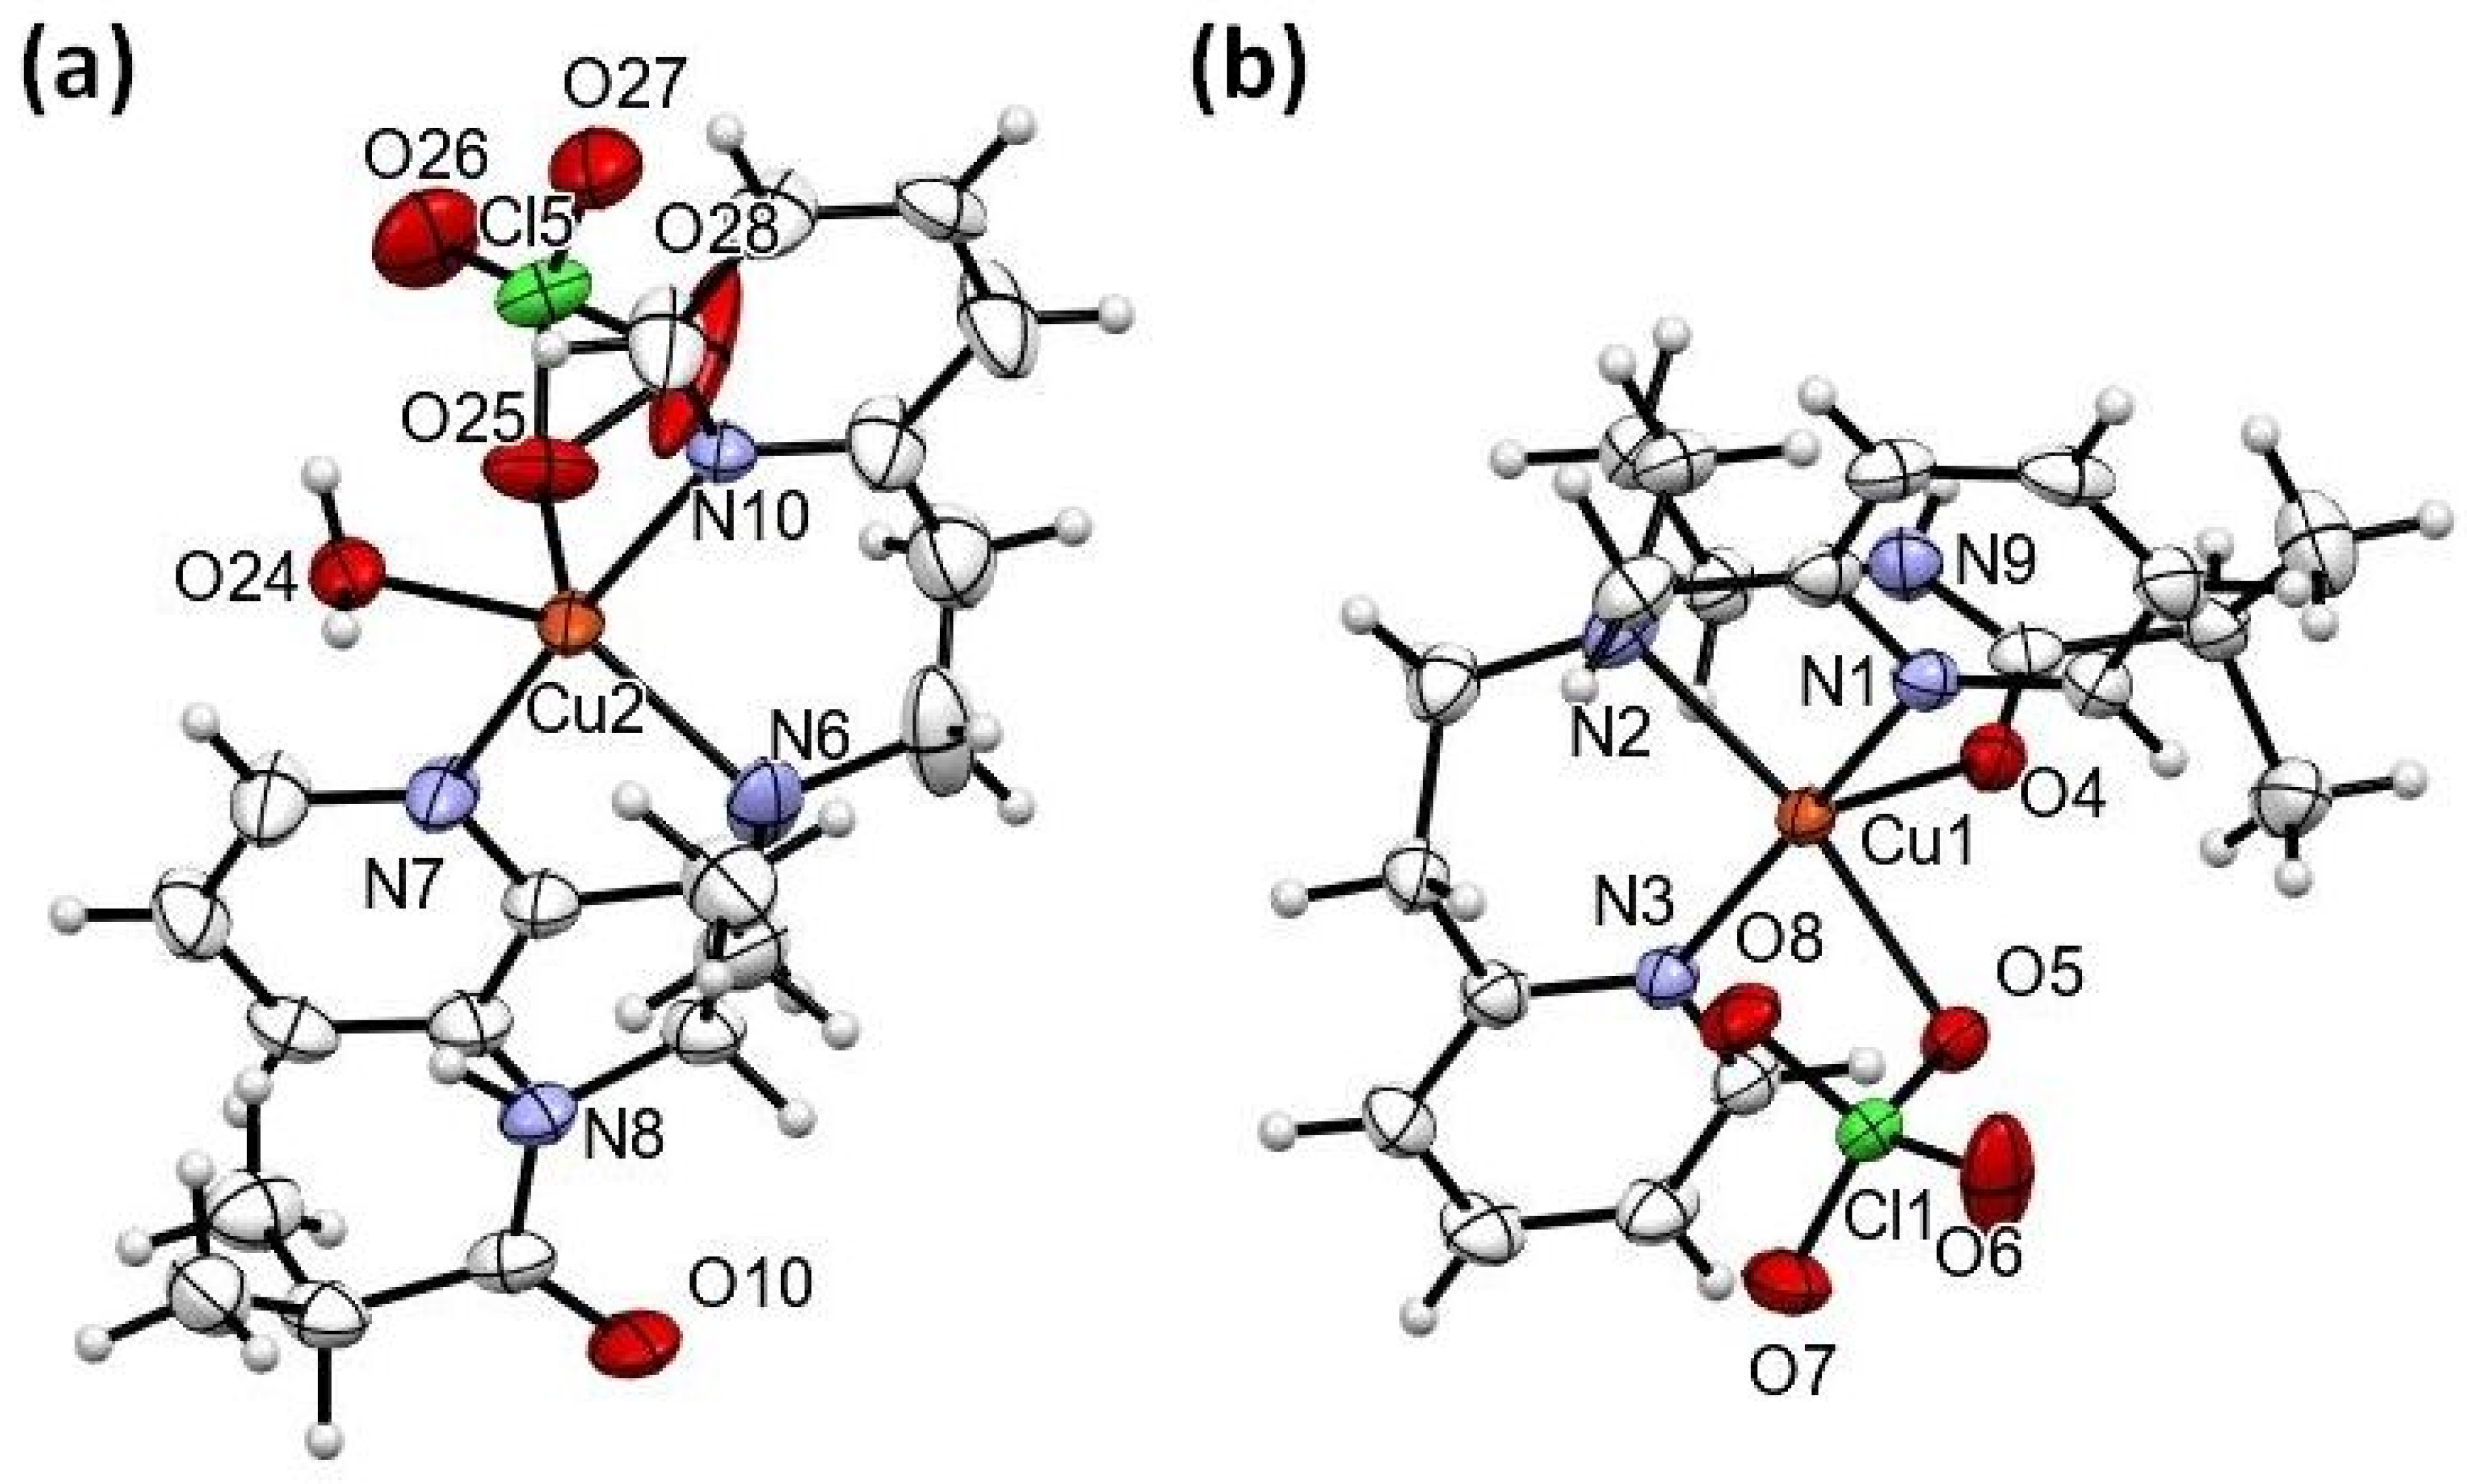
2.2. Structural Studies

To determine bonding modes of the PEPMA-C3-amide motif with Cu2+, a complex was formed between the PEPMA model ligand 4 and Cu(ClO4)2, isolated as single crystals, and subjected to single-crystal X-ray crystallographic study. We observe two independent complexes, (a) and (b), of Cu bound to 4 and to one ClO4 counterion in the asymmetric unit (Figure 3). In both complexes, a distorted trigonal-bipyramidal coordination geometry obtains. In form a, Cu2+ is coordinated to the three nitrogen donor atoms of PEPMA with bond distances Cu2-N6 = 2.037(5) Å, Cu2-N7 = 1.991(4) Å, and Cu2-N10 = 1.979(3) Å. Copper is also coordinated to water and one perchlorate molecule, where the bond lengths for Cu2-O24 and Cu2-O25 are 2.055(3) Å and 2.128(6), respectively. Form b is also coordinated to the three nitrogen atoms from the PEPMA-C3-model ligand, but contrasts to a because the oxygen of the amide group, O4, is coordinated to copper in place of water. The bond lengths for Cu1-N1, Cu1-N2, Cu2-N3, Cu1-O4, and Cu1-O5 are 1.962(3) Å, 2.042(4) Å, 1.956(3) Å, 2.097(3) Å, and 2.164(3) Å, respectively.
Interestingly, the coordination sphere of form b reveals the flexibility of the three-carbon spacer unit that can allow coordination of the amide oxygen, which may also occur in the polymeric indicator 8. Flexibility in the coordination sphere of form a is also seen in the disorder of oxygens in the coordinated perchlorate anion. In other aspects, the distortions from the ideal trigonal-bipyramid are seen in both the a and b forms of [Cu(8)(ClO4)]+, marked by the angles N10-Cu2-N7 = 171.9(2)° and N6-Cu2-N7 = 83.8(2)° in a compared with N1-Cu1-N2 = 82.6(1)° and N1-Cu1-N3 = 168.3(1)° in b, similarly distorted from the values of 180° and 90°. These are typical behaviors of Cu2+ coordination complexes [20].

2.3. Formation Constants of PEPMA-C3-Isobutyramide (4) with Cu2+ and Zn2+

To estimate the working concentration of indicator 8 for Cu2+ and its selectivity for Cu2+ vs. the other transition metal dication in wastewater, Zn2+, we measured formation constants of 4 for Cu2+ and Zn2+. Potentiometric titrations to measure pKas and formation constants were performed on the PEPMA-C3-isobutyramide 4 rather than 5 because it more closely resembles the ligand substituents once polymerized. Because this technique is based on the competition of H+(aq) for M2+, pKas were measured first. The pKa1 and pKa2 of 4 were 3.84 and 7.45, respectively (Figure 4A). Because of the weak basicity (pKa1 = 3.84) of 4 and its relatively high affinity for Cu2+, 4 makes a complex with Cu2+ as soon their solutions are mixed. To allow for competition between protons and metal ions, the more basic ligand tris(2-aminoethyl) amine (TREN) was used as a competing Cu2+ ligand for the potentiometric titrations (Figure 4B) [21].
Distribution analysis revealed that Cu(PEPMA-C3)2+ is the dominant species at acidic pH (below pH 6), followed by formation of Cu(TREN)2+ and copper hydroxide species at higher pH values (Figure 4C). The data were fitted via least squares analysis to afford a Cu2+ affinity of log Kf = 11.65. To assess competition between Zn2+ and Cu2+ for the indicator ligand, we performed a potentiometric titration to determine the formation constant of 4 for Zn2+. The speciation diagram (Figure 4D) of Zn2+ and 4 showed that free Zn2+ ions are the dominant species at acidic pHs. Increasing pH resulted in the formation of [Zn(L)]2+ with a log Kf of 5.67 at approximately pH 6, followed by formation of Zn(TREN)2+ and ZnOHTREN+ at higher pH. These studies showed that 4 is selective for Cu2+ relative to Zn2+ in accordance with the Irving–Williams series [22].

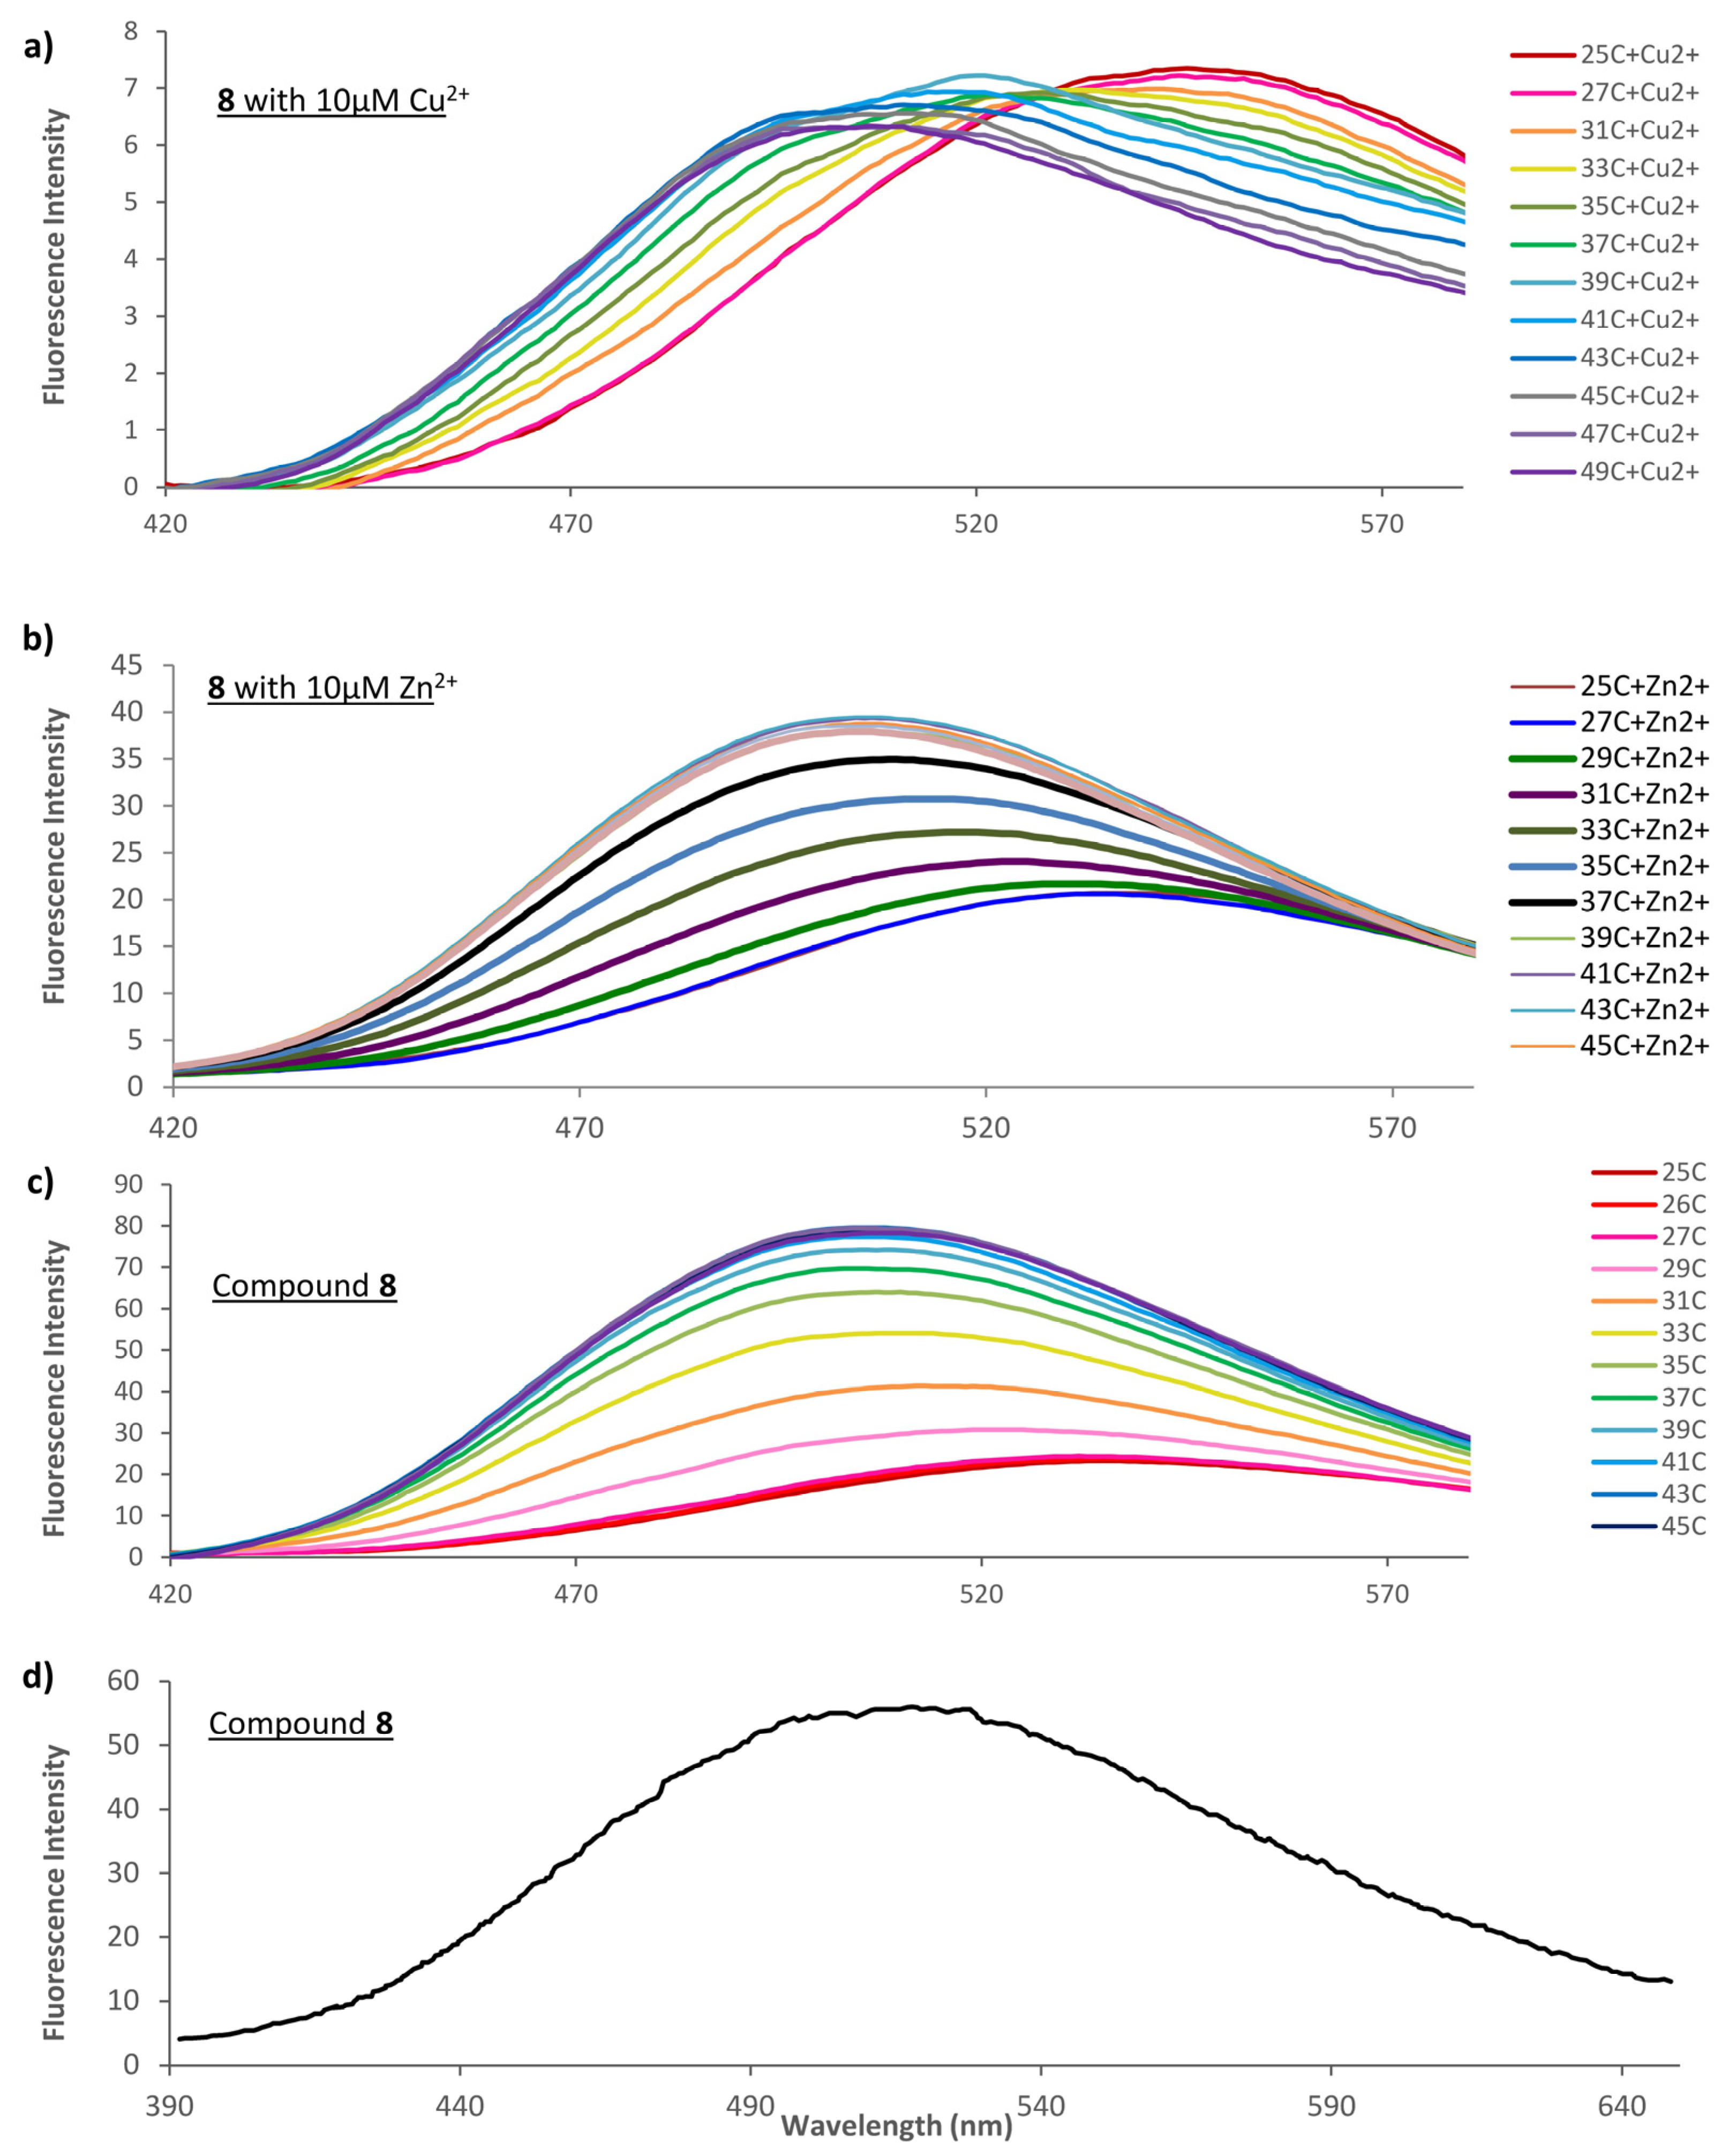
2.4. Thermally Dependent Fluorescence of Indicator 8 Alone and in Presence of Metal Ion

To evaluate the indicator 8, the phase transition LCST behavior of the PNIPAm copolymer was first measured in the absence of metal ion using the shift of the dansyl fluorophore’s maximum emission intensity upon increasing temperature (Figure 5). A solution containing 0.005 g/L of 8 in 0.1 M 2-(N-morpholino)ethanesulfonic acid (MES) buffer at pH 6.0 was analyzed for its emission properties. The ratio of emission intensity at 536 nm and 505 nm was monitored to observe the relationship between intensity ratio and temperature (Supplementary Materials, Figure S1). Upon increasing temperature from 25 °C to 49 °C, we observed a blue shift in maximum emission wavelength from 536 nm to 505 nm and an increase in the ratio of emission intensity (I505 nm/I536 nm) from 0.77 to 1.23. This corresponds to the expected PNIPAm thermal phase transition, whereby increasing temperature drives the polymer toward the globule state and results in a more hydrophobic environment around the dansyl fluorophore.
The response of indicator 8 to Cu2+ was obtained at 0.01 mM Cu2+ added to 0.005 g/L of 8 in MES buffer at pH 6.0 (Figure 5). A red shift of approximately 40 nm in the maximum emission wavelength with increasing temperature from 25 °C to 49 °C is observed, indicating that Cu2+ produces the desired ratiometric response. Relative to the measured Cu2+ formation constant for the model ligand 4 of log Kf = 11.65, the amount of Cu2+ required for a response in these studies seems high because the corresponding dissociation constant Kd of 10−11.65 would indicate binding of submicromolar Cu2+. However, we have observed in the past that binding affinities are decreased for polymer-bound ligands, likely because a more hydrophobic environment exists which destabilizes the formation of catalytic complexes [13]. Addition of 0.01 mM Zn2+ to the aqueous indicator (0.005 g/L) at 25 °C yields a lesser red shift of 10 nm, consistent with our observation of a smaller Kf for [ZnPEPMA]2+ relative to [CuPEPMA]2+ (Figure 5).

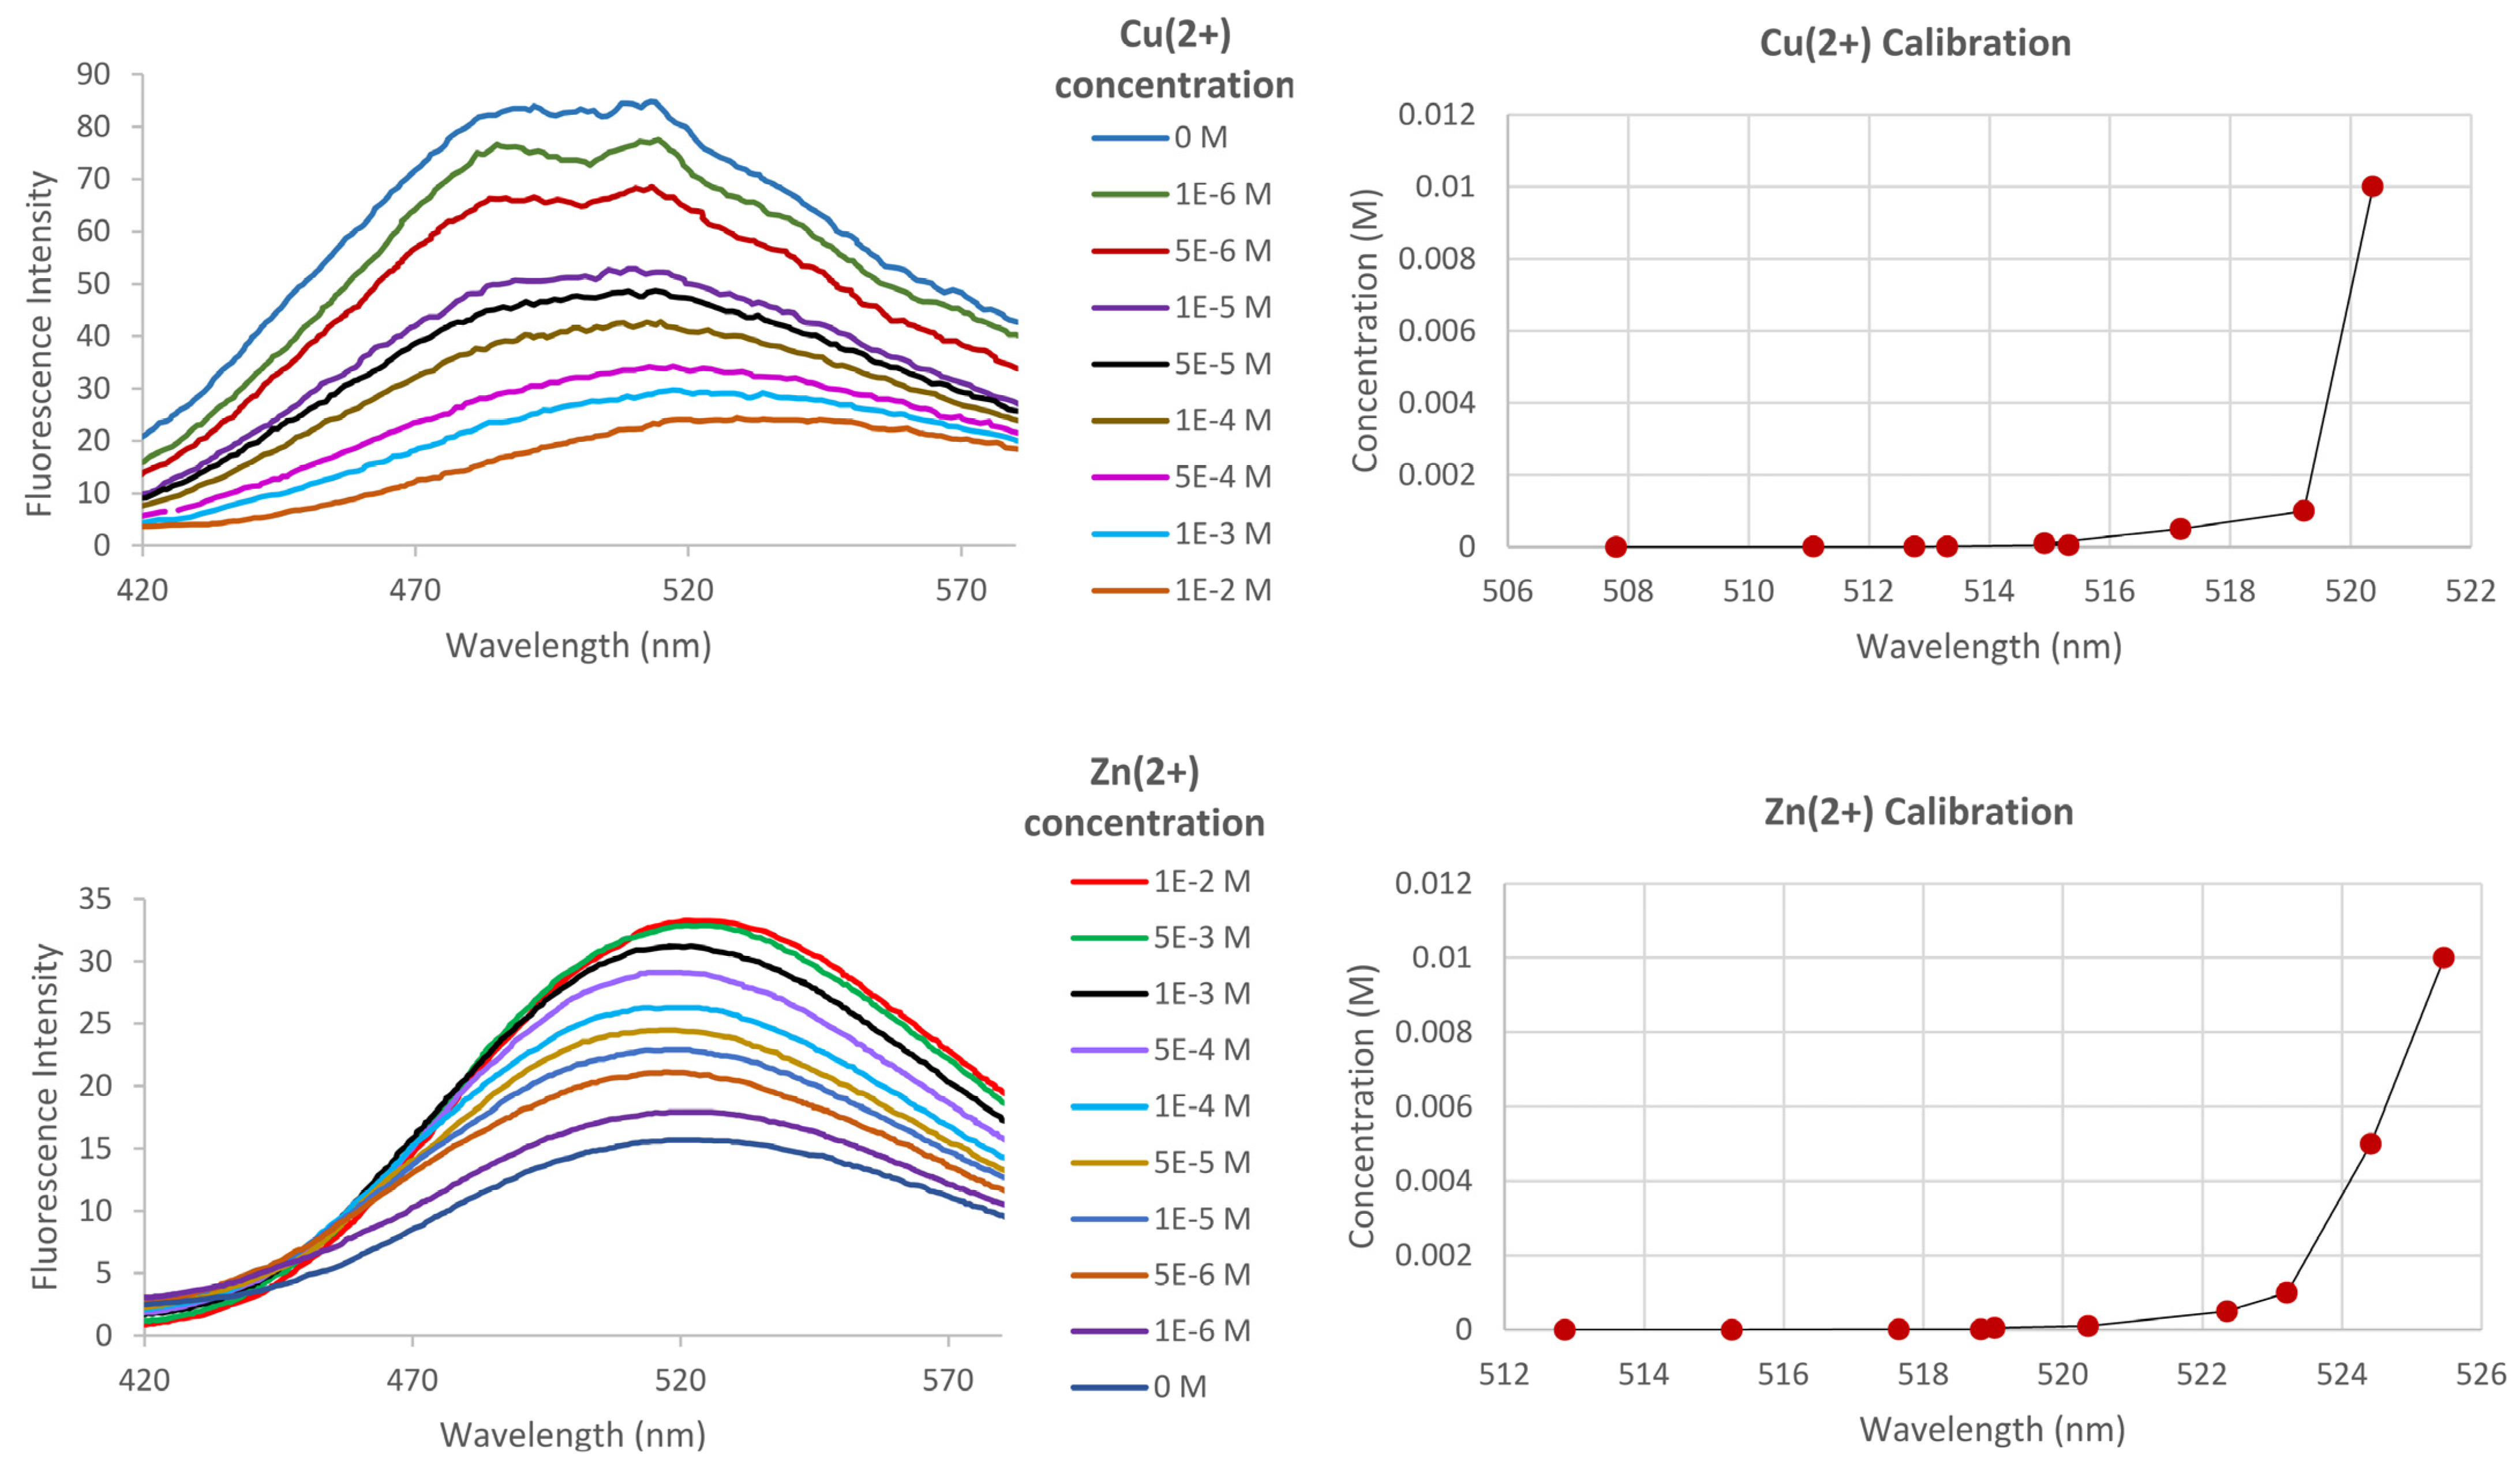
2.5. Indicator Response to Aqueous Cu2+and Zn2 at Fixed Temperature+

The indicator 8 response to added Cu2+ and Zn2+ was determined via fluorescence titration at 45 °C (Figure 6). The shift of the dansyl fluorescence maxima was used to obtain calibration curves for the metal ions. The approximate limit of detection (LOD) for either metal ion is 500 µM, or approximately 31 µg/mL.

2.6. Selectivity of the Metal Indicator for Cu2+ Relative to Ni2+, Fe2+, and Zn2+

Indicator selectivity for Cu2+ was studied via addition of a competing metal ion to the Cu2+-indicator bound form. First, the ability of the indicator to respond to Ni2+ and Fe2+ was checked (Figure 7A), indicating that the fluorescence maximum of Ni2+ was similar to Zn2+ at ca. 540 nm and the maximum of Fe2+ at 550 nm. Next, a solution of the Cu2+-complexed indicator was treated with an equal concentration of one of the ions Fe2+, Ni2+, or Zn2+. No change in the fluorescence response of the indicator was observed, consistent with the inability of these ions to compete with or disturb the response to copper(II).

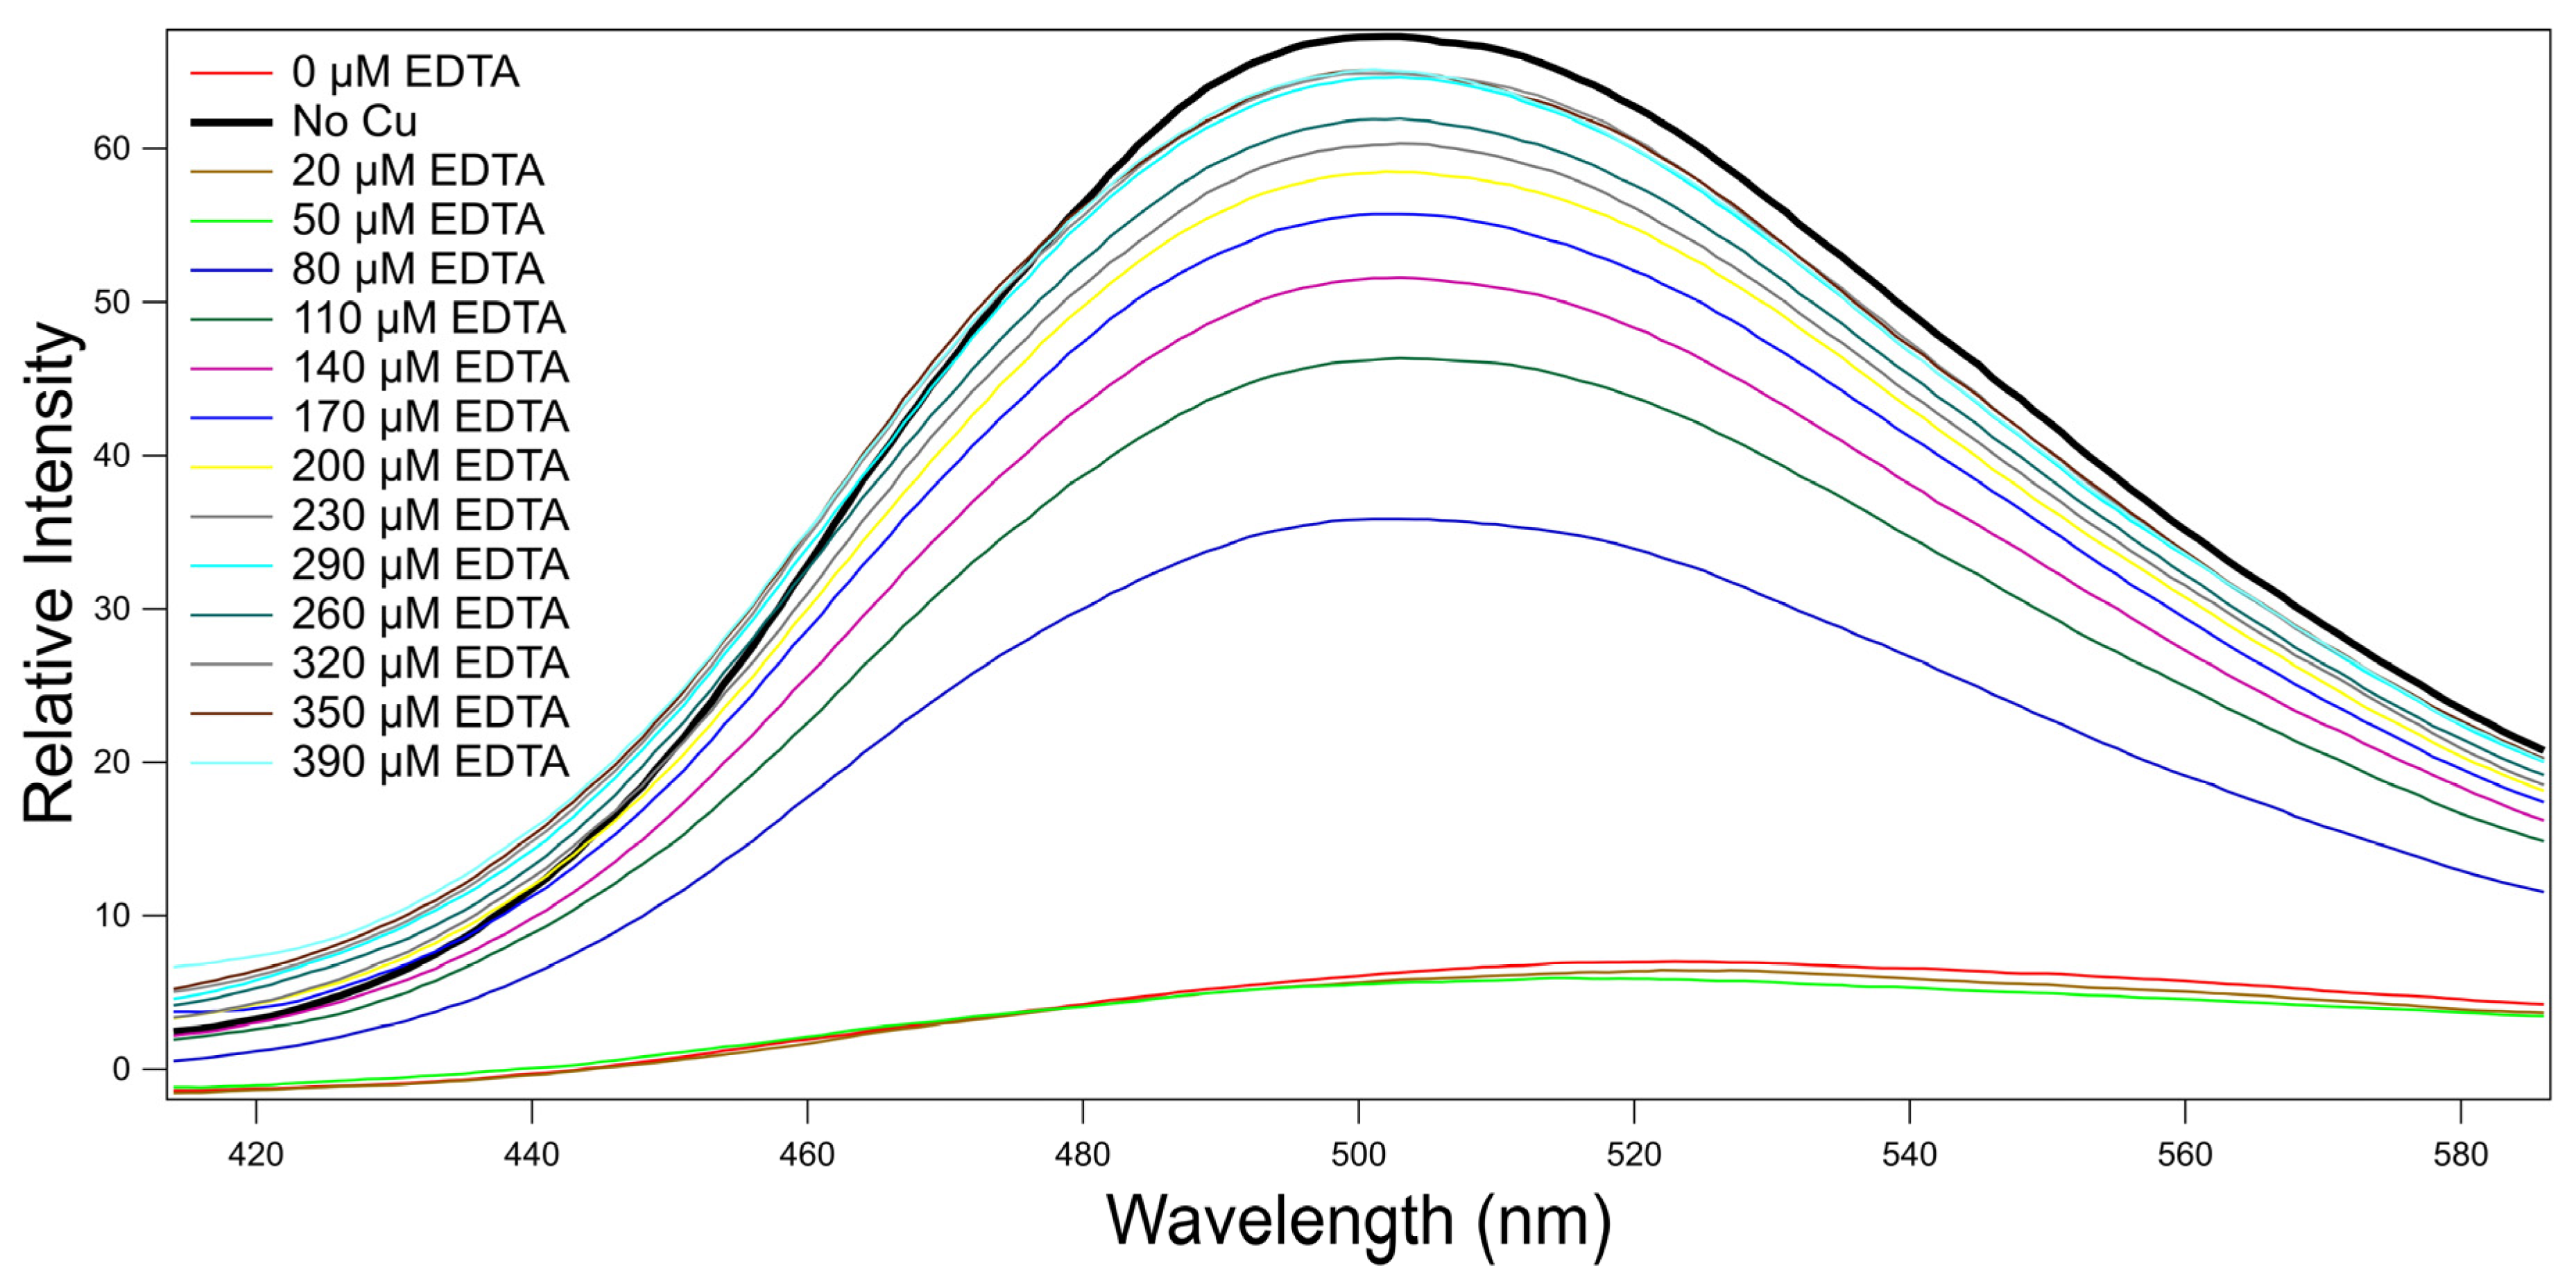
2.7. Reversibility of the Metal Indicator

To assess the suitability of this indicator for dynamic measurements of metal ion concentration, reversibility of the response was studied. Ethylenediaminetetraacetic acid (EDTA), a Cu2+ chelating agent, was added to 0.005 g/L 8 containing 10 μM Cu2+. Below the LCST, one equivalent of EDTA was able to essentially quantitatively remove the Cu2+ from 8 (Supplementary Materials, Figure S1) within a time frame of 5 min. However, at and above the LCST, an excess concentration of about 15-fold EDTA was needed in order to regain comparable fluorescence emission intensities, for which a time of about 25 min was required (Figure 8). This was expected because the globular polymer form can present a great kinetic barrier to Cu2+ removal relative to the coiled form. This demonstrates the reversibility of Cu2+ binding and suggests that the system may be used to detect slow changes in Cu2+ concentrations at 35 °C and more rapid changes at 25 °C. Additionally, this supports the hypothesis that 8 may be regenerated with EDTA treatment and used for subsequent testing.

3. Discussion and Conclusions

This work has demonstrated a novel ratiometric indicator of Cu2+ and Zn2+ based on a high-affinity ligand that modulates polymer conformation upon metal binding, resulting in a shift in maximum fluorescence. Due to the quenching nature of the Cu2+ ion, many studies have sought to create turn-on sensors based on structural changes in the sensor. Thus, for example, a BODIPY-adamantyl fluorophore is quenched via self-assembly with bovine serum albumin (BSA) into nanoparticles, which, in turn, are decomplexed by Cu2+, resulting in a turn-on response to copper(II) [23]. This unique system is of interest for biological environments which do not denature BSA. Another useful strategy is an activity-based one, in which Cu2+ causes or allows a chemical transformation that may lead to a fluorescence enhancement. Fluorescent spirobifluorenes form complexes with borderline-to-soft bases, including Cu2+, Hg+, and Pb2+, with resultant quenching that can be reversed by competitive complexation with cyanide, which allows nonselective Cu2+ sensing but requires (or also detects) the cyanide ion [24]. Unlike many irreversible copper-mediated reactions, the complexation in this system is reversible, allowing for dynamic concentration sensing.
Our PEPMA-C3-ligand-based indicator 8 has a measured Cu2+ affinity of ca. log 11, which is compatible with amounts of bioavailable Cu2+ in natural waters and the expected preference for Cu2+ over Zn2+. The present work studied zinc detection only as a control metal ion for the sensor, but many turn-on zinc sensors exist because Zn2+ does not quench fluorescence [25,26,27]. The present sensor is reversible, and therefore can be viable for use in various aqueous Cu2+ systems where concentrations can fluctuate. The suitability for use in natural waters will require possible adjustments to this system; for example, an increase in the amount of chelator in the PNIPAm framework may yield greater sensitivity and a more rapid response. The present studies give insight towards the design of an indicator with potential application in monitoring Cu2+ concentration in diverse systems, and with the potential to regenerate the system through treatment with a small molecule chelator.

4. Materials and Methods

4.1. General

All materials listed below were of research grade or a spectro grade in the highest purity available and were generally used without purification except 2-pyridinecarboxaldehyde, which was distilled, and acrylonitrile, which was passed through a plug of basic alumina. 1H and proton-decoupled 13C NMR were obtained using a Varian Mercury 400 MHz NMR instrument, and chemical shifts are reported in ppm relative to the deuterated solvent used. Elemental analysis was performed by Atlantic Microlabs (Atlanta, GA, USA). Mass spectral data were obtained on a Bruker AmaZon SL ion trap LC/MS (Northwestern University). X-ray crystallography was performed on a Bruker APEX-II CCD Diffractometer (UC San Diego). Potentiometric titrations were performed using a 785 DMP Titrino equipped with an Accumet double injection pH electrode and thermally regulated titration vessel. Formation-constant data were evaluated using the Hyperquad2008 program suite [28]. The fluorescence spectra were recorded using a Cary Eclipse fluorescence spectrophotometer with 3 cm3 quartz cuvette (1 cm pathlength).
Caution! Perchlorates of metal complex cations have been known to explode. No explosions occurred during this work.

4.2. Synthesis of Compounds

4.2.1. N-(2-pyridinylethyl)-2-pyridinemethanamine (PEPMA) (1)

2-(2-ethylamino)pyridine (2.10 g, 17.2 mmol) and 2-pyridinecarboxaldehyde (2.018 g, 18.87 mmol) were combined in MeOH (30 mL) and stirred at room temperature under nitrogen atmosphere for 2 h. Then, sodium borohydride (0.705 g, 18.6 mmol) was added slowly and the mixture was stirred at room temperature for 24 h. After 24 h, the yellow solution was concentrated under reduced pressure and the resulting yellow residue was dissolved in water (ca. 20 mL). The obtained solution was acidified to pH ca. 4 via dropwise addition of 6 M HCl. The aqueous layer was extracted with CHCl3 (2 × 20 mL). Then, the aqueous layer was basified to pH ca. 11 via dropwise addition of 2 M NaOH. The basic solution was extracted with CHCl3 (3 × 15 mL). The extracted organic layer was dried over magnesium sulfate, vacuum filtered, concentrated via rotary evaporator, and dried to yield the product as a brown oil (3.223 g, 15.11 mmol, 88%). 1H NMR (400 MHz, CDCl3) δ 8.54 (d, J = 4.9 Hz, 2H), 7.60 (d, J = 7.78 Hz, 2H), 7.34 (m, 1H), 7.30 (m, 3H), 3.95 (s, 2H), 3.06 (m, 4H), 2.14 (s, N,H 1H).13C NMR (101 MHz, CDCl3): 160.40, 160.10, 149.50, 149.43, 136.54, 136.46, 123.43, 123.31, 121.99, 121.37, 55.24, 49.14, 38.72; Exact mass calculated for C13H15N3 [M-H], 213.13. Found, 213.98.

4.2.2. 3-((2-(pyridin-2-yl)ethyl)(pyridin-2-ylmethyl)amino)propionitrile (2)

Acrylonitrile (0.687 g, 12.8 mmol) was filtered through a plug of basic alumina and added to a 100 mL round bottom flask equipped with a Teflon-coated stir bar. Ligand 1 (1.3702 g, 6.14 mmol) and MeOH (30 mL) were added to the flask, respectively. The reaction mixture was refluxed under N2 atmosphere for 72 h. After cooling, the resulting mixture was concentrated via rotary evaporator and vacuum dried to yield the product as a brown oil (1.524 g, 5.726 mmol, 93%). 1H NMR (400 MHz, CDCl3): 8.51 (2H, m), 7.61 (2H, m), 7.39 (1H, m), 7.15 (3H, m), 3.87 (2H, s), 3.02 (4H, m), 2.89 (2H, t, J = 6.8 Hz), 2.45 (2H, t, J = 6.9 Hz). 13C NMR (101 MHz, CDCl3): 160.05, 159.25, 149.76, 149.45, 149.12, 136.82, 136.55, 123.72, 123.11, 122.40, 119.04, 64.55, 60.30, 54.11, 49.81, 36.25, and 16.67; Exact mass calculated for C16H18N4 [M-H], 266.15. Found, 266.07.

4.2.3. N-(2-(pyridin-2-yl)ethyl)-N-(pyridin-2-ylmethyl)propane-1,3-diamine (3)

To a 50% suspension of active Raney-Ni (8.1 g) in water (ca. 190 mL), we added a solution of 2 (13.84 g, 52 mmol) in MeOH (225 mL). The resulting mixture was vigorously stirred and NaBH4 (4.04 g, 106 mmol) in 8 M of NaOH (57 mL) was added at such a rate as to maintain temperature at 60 °C. After the addition, the reaction was stirred overnight at room temperature. Raney-Ni catalyst was removed via filtration through Celite and the solvent was removed under reduced pressure. A portion of 8 M NaOH (57 mL) was added subsequently to the residue, which was then extracted with CH2Cl2 (5 × 50 mL). The organic layers were combined and dried over anhydrous Na2SO4. After filtration, the organic layer was concentrated via rotary evaporator and vacuum dried to yield the product as brown oil (7.500 g, 27.73 mmol, 53.35%). 1H NMR (400 MHz, CDCl3): 8.51 (2H, d, J = 5.0 Hz), 7.57 (2H, d, J = 7.6 Hz), 7.33 (1H, m), 7.11 (3H, t, J = 7.4 Hz), 3.80 (2H, s), 2.94 (4H, m), 2.61 (4H, m), 1.61 (2H, m). 13C NMR (101 MHz, CDCl3): 160.82, 160,52, 149.34, 149.02, 136.44, 136.28, 123.46, 122.89, 121.913, 121.21, 60.71, 54.49, 51.85, 40.35, 36.07, 31.32; Exact mass calculated for C16H22N4 [M − H], 270.18. Found, 271.09.

4.2.4. N-(3-((2-(pyridin-2-yl)ethyl)(pyridin-2-ylmethyl)aminopropylisobutyramide (4)

Triethylamine (8.0 mL, 56 mmol) and 3 (4.0 g, 12 mmol) were dissolved in CH2Cl2 (80 mL). The resulting mixture was stirred in at 0 °C for 10 min. Isobutyryl chloride (1.36 mL, 13.0 mmol) was then added slowly and the reaction was stirred at room temperature. After 24 h, the reaction mixture was dissolved in 0.1 M HCl (150 mL) and extracted with CH2Cl2 (3 × 50 mL). The organic layers were combined, dried with anhydrous Na2SO4, filtered, and concentrated via rotary evaporator to yield crude product, which was then purified with alumina column chromatography (EtOAc:hexanes 9:1) to afford the product as a yellow oil (1.787 g, 30%). TLC (alumina), Rf = 0.30. 1H NMR (400 MHz, CDCl3): 8.48 (2H, m), 7.66 (1H, t, J = 5.7 Hz), 7.56 (1H, t, J = 7.7 Hz), 7.47 (1H, m), 7.14 (2H, m), 7.05 (1H, d, J = 7.8 Hz), 6.97 (1H, d, J = 7.8 Hz) 3.70 (2H, s,), 3.25 (2H, t, J = 5.9 Hz), 2.95 (2H, t, J = 6.6 Hz), 2.85 (2H, t, J = 6.6 Hz), 2.66 (2H, t, J = 6.2 Hz), 2.43 (1H, m), 1.70 (2H, t, J = 6.2 Hz), 1.15 (6H, d, J = 6.9 Hz). 13C NMR (101 MHz, CDCl3): 177.20, 160.63, 159.65, 148.89, 148.67, 136.38, 136.26, 123.33, 122.76, 121.88, 121.18, 59.90, 54.65, 51.24, 37.40, 35.67, 35.36, 26.11, 19.79; Exact mass calculated for C20H28N4O [M − H], 340.23. Found, 340.19.

4.2.5. N-(3-((2-(pyridin-2-yl)ethyl)(pyridin-2-ylmethyl)aminopropylacrylamide (PEPMA-C3-acrylamide) (5)

Triethylamine (7.0 mL, 51 mmol) and 3 (3.00 g, 11 mmol) were dissolved in CH2Cl2 (75 mL) and stirred at 0 °C for 10 min before adding acryloyl chloride (1.07 g, 11.88 mmol). The resulting mixture was stirred at room temperature for 24 h. The solvent was removed under reduced pressure and the resulting crude mixture was washed with 0.1 M HCl (150 mL). The aqueous layer was extracted with CH2Cl2 (3 × 50 mL), and the organic layers were dried with anhydrous Na2SO4. After filtration, the organic layer was concentrated via rotary evaporator to yield crude product, which was then purified by alumina column chromatography (EtOAc, 100%) to afford the product as a yellow oil (1.32 g, 37%). TLC (alumina) Rf = 0.38. 1H NMR (400 MHz, CDCl3): 8.47 (2H, d, J = 4.9 Hz), 7.55 (1H, t, J = 7.7 Hz), 7.43 (1H, t, J = 7.7 Hz), 7.12 (2H, m), 7.03 (1H, d, J = 7.8 Hz), 6.88 (1H, d, J = 7.8 Hz), 6.29 (2H, m), 5.57 (1H, dd, J = 8.7 Hz), 3.65 (2H, s), 3.35 (2H, t, J = 5.9), 2.93 (2H, m), 2.82 (2H, t, J = 6.7), 2.69 (2H, t, J = 6.0 Hz), 1.76 (2H, t, J = 6.0 Hz). 13C NMR (101 MHz, CDCl3): 165.94, 160.85, 159.70, 149.14, 148.74, 136.45, 136.45, 131.82, 125.32, 123.57, 122.91, 122.09, 121.42, 59.97, 55.04, 51.58, 37.84, 35.91, 25.88; Exact mass calculated for C19H24N4O [M − H], 324.20. Found, 324.16.

4.2.6. N-(2-aminoethyl)-5-(dimethylamino)naphthalene-1-sulfonamide (6)

A solution of ethylenediamine (5.560 mL, 83.00 mmol) and dry THF (20 mL) was cooled at 0 °C. After 10 min, dansyl chloride (0.500 g, 1.85 mmol) in dry THF (5 mL) was added dropwise over a period of 1.5 h. After stirring at room temperature for 2 h, 1.0 M NaOH (5 mL) was added. THF was removed on the rotary evaporator and the aqueous solution was extracted with CH2Cl2 (3 × 20 mL). The combined organic extracts were dried over anhydrous Na2SO4 and filtered. The solvent was removed under reduced pressure and the resulting crude material was recrystallized from a 1:1 benzene: hexanes mixture to afford a light-yellow solid (0.187 g, 34%). 1H NMR (400 MHz, CDCl3) δ 8.54 (dt, J = 8.5, 1.1 Hz, 1H), 8.34–8.22 (m, 2H), 7.55 (m, 2H), 7.19 (dd, J = 7.6, 0.9 Hz, 1H), 2.89 (m, 8H), 2.70 (m, 2H). 13C NMR (101 MHz, CDCl3) δ 152.25, 134.86, 130.65, 130.11, 129.92, 129.83, 128.62, 123.42, 118.90, 115.42, 45.73, 45.64, 41.00.

4.2.7. N-(2-(5-(dimethylamino)naphthalene-1-sulfonamido)ethyl)acrylamide (7)

Ligand 6 (0.1868 g, 0.605 mmol) and triethylamine (0.0677 g, 0.670 mmol) were dissolved in dry CH2Cl2 (50 mL). The resulting mixture was cooled at 0 °C, and acryloyl chloride (0.0606 g, 0.669 mmol) was added dropwise. After stirring for 5 h at room temperature, the precipitate was removed by filtration and the filtrate was concentrated under reduced pressure to yield crude product, which was then purified via silica gel column chromatography (EtOAc, 100%) to afford a yellow solid (0.1425 g, 68%). 1H NMR (400 MHz, CDCl3) δ 8.54 (d, J = 8.9 Hz, 1H), 8.25 (d, J = 8.9 Hz, 2H), 7.60–7.47 (m, 2H), 7.17 (d, J = 7.6 Hz, 1H), 6.34 (t, NH, J = 5.8 Hz, 1H), 6.16 (dt, J = 16.9, 0.9 Hz, 1H), 5.97–5.85 (m, 2H), 5.58–5.50 (m, 1H), 3.38 (dt, J = 5.7 Hz, 2H), 3.07 (dt, J = 5.8 Hz, 2H), 2.88 (d, J = 0.5 Hz, 6H). 13C NMR (101 MHz, CDCl3) δ 166.53, 152.31, 134.44, 130.94, 130.61, 130.15, 129.89, 129.68, 128.85, 126.95, 123.42, 118.80, 115.52, 45.64, 43.28, 39.58.

4.2.8. [Cu(4)](ClO4)2•0.5 H2O

Cu(ClO4)2•6H2O (0.025 g, 0.067 mmol) in MeOH (2 mL) was added to ligand 4 (0.023 g, 0.068 mmol) in MeOH (2 mL), causing a color change from pale blue to deep blue. Vapor diffusion of Et2O into this solution (24 h) afforded blue crystals. These were isolated via decantation of solvent and air-dried at ambient temperature, yield 0.029 g (70%). Anal. Calcd (%) for C20H29Cl2CuN4O9.5: C, 39.25; H, 4.74; N, 9.16. Found: C, 39.01; H, 4.52; N, 9.01. UV (MeOH) 698 nm (ε = 110.5) MS m/z 503.32 (M-ClO4-0.5 H2O).

4.3. Polymer Synthesis

General procedure for polymerization: NIPAM (0.9261 g, 8.184 mmol), PEPMA-C3-acrylamide 5 (0.1427 g, 0.44 mmol), dansyl acrylamide 7 (0.06115 g, 0.176 mmol), 2-(dodecylthiocarbonothioylthio)-2-methylpropionic acid (3.21 mg, 8.8 μmol), and azobisisobutyronitrile (AIBN) (0.1445 mg, 0.88 μmol) were dissolved in DMF (5 mL). The resulting solution was purged with N2 for 30 min at room temperature and brought to 70 °C for 24 h. The resulting polymer was dialyzed in water for 3 days. Water was removed and the polymer was dried on the vacuum before characterization with 1H NMR and DOSY [19] NMR.

4.4. Structural Studies

Single crystals of C40H58Cl4Cu2N8O19 were obtained by vapor-phase diffusion of Et2O into a MeOH solution of the complex. A suitable crystal was selected and mounted on a Bruker APEX-II CCD diffractometer. The crystal was kept at 100.0 K during data collection. Using Olex2 [29], the structure was solved with the ShelXS [30] structure solution program using direct methods and refined with the ShelXL [31] refinement package using least squares minimization.

Supplementary Materials

The following supporting information can be downloaded at https://www.mdpi.com/article/10.3390/molecules28207097/s1: 1H NMR, 13C NMR, and DOSY spectral plots; fluorescence spectra, and crystal structure data. The structure data are also deposited with The Cambridge Crystallographic Data Centre: CCDC 2221208 contains the supplementary crystallographic data for this paper. The data can be obtained free of charge from The Cambridge Crystallographic Data Centre via www.ccdc.cam.ac.uk/structures, accessed 14 October 2023.

Author Contributions

Conceptualization, W.R.S. and R.P.P.; Investigation, L.N., F.M.G., N.R.B., A.T.R. and A.L.R.; Methodology, L.N., F.M.G. and N.R.B.; Supervision, R.P.P.; Writing—review and editing, R.P.P., E.R.A. and L.I.P.; Funding acquisition, R.P.P. and W.R.S. All authors have read and agreed to the published version of the manuscript.

Funding

This research was funded by the National Science Foundation (R.P.P., W.R.S.) (CHE-1012897).

Institutional Review Board Statement

Not applicable.

Informed Consent Statement

Not applicable.

Data Availability Statement

Conflicts of Interest

The authors declare no conflict of interest.

Sample Availability

Not applicable.

References

  1. Steffen, W.; Richardson, K.; Rockstrom, J.; Cornell, S.E.; Fetzer, I.; Bennett, E.M.; Biggs, R.; Carpenter, S.R.; de Vries, W.; de Wit, C.A.; et al. Planetary boundaries: Guiding human development on a changing planet. Science 2015, 347, 1259855. [Google Scholar] [CrossRef]
  2. Song, H.D.; Choi, I.; Lee, S.; Yang, Y.I.; Kang, T.; Yi, J. On-chip colorimetric detection of Cu2+ ions via density-controlled plasmonic core–satellites nanoassembly. Anal. Chem. 2013, 85, 7980–7986. [Google Scholar] [CrossRef] [PubMed]
  3. Besser, J.M.; Ivey, C.D.; Steevens, J.A.; Cleveland, D.; Soucek, D.; Dickinson, A.; Van Genderen, E.J.; Ryan, A.C.; Schlekat, C.E.; Garman, E.; et al. Modeling the Bioavailability of Nickel and Zinc to Ceriodaphnia dubia and Neocloeon triangulifer in Toxicity Tests with Natural Waters. Environ. Toxicol. Chem. 2021, 40, 3049–3062. [Google Scholar] [CrossRef] [PubMed]
  4. Crichton, R.R. Biological Inorganic Chemistry: A New Introduction to Molecular Structure and Function, 3rd ed.; Academic Press: London, UK, 2019. [Google Scholar]
  5. Knobeloch, L.; Ziarnik, M.; Howard, J.; Theis, B.; Farmer, D.; Anderson, H.; Proctor, M. Gastrointestinal upsets associated with ingestion of copper-contaminated water. Environ. Health Perspect. 1994, 102, 958–961. [Google Scholar] [CrossRef] [PubMed]
  6. Santore, R.C.; Di Toro, D.M.; Paquin, P.R.; Allen, H.E.; Meyer, J.S. Biotic ligand model of the acute toxicity of metals. 2. Application to acute copper toxicity in freshwater fish and Daphnia. Environ. Toxicol. Chem. 2001, 20, 2397–2402. [Google Scholar] [CrossRef] [PubMed]
  7. Prodi, L.; Bolletta, F.; Montalti, M.; Zaccheroni, N. Luminescent chemosensors for transition metal ions. Coord. Chem. Rev. 2000, 205, 59–83. [Google Scholar] [CrossRef]
  8. de Silva, A.P.; Gunaratne, H.Q.N.; Gunnlaugsson, T.; Huxley, A.J.M.; McCoy, C.P.; Rademacher, J.T.; Rice, T.E. Signaling Recognition Events with Fluorescent Sensors and Switches. Chem. Rev. 1997, 97, 1515–1566. [Google Scholar] [CrossRef]
  9. Valeur, B.; Leray, I. Design principles of fluorescent molecular sensors for cation recognition. Coord. Chem. Rev. 2000, 205, 3–40. [Google Scholar] [CrossRef]
  10. Xie, J.; Ménand, M.; Maisonneuve, S.; Métivier, R. Synthesis of bispyrenyl sugar-aza-crown ethers as new fluorescent molecular sensors for Cu(II). J. Org. Chem. 2007, 72, 5980–5985. [Google Scholar] [CrossRef]
  11. Li, Q.; Guo, Y.; Shao, S. A BODIPY based fluorescent chemosensor for Cu(II) ions and homocysteine/cysteine. Sens. Actuators B Chem. 2012, 171, 872–877. [Google Scholar] [CrossRef]
  12. Du, J.; Yao, S.; Seitz, W.R.; Bencivenga, N.E.; Massing, J.O.; Planalp, R.P.; Jackson, R.K.; Kennedy, D.P.; Burdette, S.C. A ratiometric fluorescent metal ion indicator based on dansyl labeled poly(N-isopropylacrylamide) responds to a quenching metal ion. Analyst 2011, 136, 5006–5011. [Google Scholar] [CrossRef] [PubMed]
  13. Yao, S.; Jones, A.M.; Du, J.; Jackson, R.K.; Massing, J.O.; Kennedy, D.P.; Bencivenga, N.E.; Planalp, R.P.; Burdette, S.C.; Seitz, W.R. Intermolecular approach to metal ion indicators based on polymer phase transitions coupled to fluorescence resonance energy transfer. Analyst 2012, 137, 4734–4741. [Google Scholar] [CrossRef]
  14. Osambo, J.; Seitz, W.; Kennedy, D.; Planalp, R.; Jones, A.; Jackson, R.; Burdette, S. Fluorescent Ratiometric Indicators Based on Cu(II)-Induced Changes in Poly(NIPAM) Microparticle Volume. Sensors 2013, 13, 1341–1352. [Google Scholar] [CrossRef] [PubMed]
  15. Yin, J.; Guan, X.; Wang, D.; Liu, S. Metal-Chelating and Dansyl-Labeled Poly(N-isopropylacrylamide) Microgels as Fluorescent Cu2+ Sensors with Thermo-Enhanced Detection Sensitivity. Langmuir 2009, 25, 11367–11374. [Google Scholar] [CrossRef] [PubMed]
  16. Nor, Y.M. Ecotoxicity of copper to aquatic biota: A review. Environ. Res. 1987, 43, 274–282. [Google Scholar] [CrossRef]
  17. Di Toro, D.M.; Allen, H.E.; Bergman, H.L.; Meyer, J.S.; Paquin, P.R.; Santore, R.C. Biotic ligand model of the acute toxicity of metals. 1. Technical basis. Environ. Toxicol. Chem. 2001, 20, 2383–2396. [Google Scholar] [CrossRef]
  18. Allen, H.E.; Hall, R.H.; Brisbin, T.D. Metal speciation. Effects on aquatic toxicity. Environ. Sci. Technol. 1980, 14, 441–443. [Google Scholar] [CrossRef]
  19. Li, W.; Chung, H.; Daeffler, C.; Johnson, J.A.; Grubbs, R.H. Application of 1H DOSY for Facile Measurement of Polymer Molecular Weights. Macromolecules 2012, 45, 9595–9603. [Google Scholar] [CrossRef]
  20. Hathaway, B.J.; Billing, D.E. The electronic properties and stereochemistry of mono-nuclear complexes of the copper(II) ion. Coord. Chem. Rev. 1970, 5, 143–207. [Google Scholar] [CrossRef]
  21. Massing, J.O.; Planalp, R.P. Influence of PNIPAm on log Kf of a copolymerized 2,2′-bipyridine: Revised bifunctional ligand design for ratiometric metal-ion sensing. Dalton Trans. 2015, 44, 11887–11892. [Google Scholar] [CrossRef]
  22. Irving, H.; Williams, R.J.P. 637. The stability of transition-metal complexes. J. Chem. Soc. 1953, 3192–3210. [Google Scholar] [CrossRef]
  23. Zhang, P.-L.; Shao, J.; Li, X.-T.; Chen, Q.-Y.; Qu, L.-L. A protein amantadine-BODIPY assembly as a turn-on sensor for free copper(ii). Anal. Methods 2019, 11, 827–831. [Google Scholar] [CrossRef]
  24. Silpcharu, K.; Soonthonhut, S.; Sukwattanasinitt, M.; Rashatasakhon, P. Fluorescent Sensor for Copper(II) and Cyanide Ions via the Complexation–Decomplexation Mechanism with Di(bissulfonamido)spirobifluorene. ACS Omega 2021, 6, 16696–16703. [Google Scholar] [CrossRef]
  25. Wan, J.; Duan, W.; Che~n, K.; Tao, Y.; Dang, J.; Zeng, K.; Ge, Y.; Wu, J.; Liu, D. Selective and sensitive detection of Zn(II) ion using a simple peptide-based sensor. Sens. Actuators B Chem. 2018, 255, 49–56. [Google Scholar] [CrossRef]
  26. Slocum, J.D.; Palmer, A.E.; Jimenez, R. Intramolecular Fluorescent Protein Association in a Class of Zinc FRET Sensors Leads to Increased Dynamic Range. J. Phys. Chem. B 2019, 123, 3079–3085. [Google Scholar] [CrossRef] [PubMed]
  27. Yun, D.; Chae, J.B.; So, H.; Lee, H.; Kim, K.-T.; Kim, C. Sensing of zinc ions and sulfide using a highly practical and water-soluble fluorescent sensor: Applications in test kits and zebrafish. New J. Chem. 2020, 44, 442–449. [Google Scholar] [CrossRef]
  28. Gans, P.; Sabatini, A.; Vacca, A. Hyperquad2008-Equilibrium Constants from Potentiometric Data. Available online: http://www.hyperquad.co.uk/HQ2008.htm (accessed on 8 October 2023).
  29. Dolomanov, O.V.; Bourhis, L.J.; Gildea, R.J.; Howard, J.A.K.; Puschmann, H. OLEX2: A complete structure solution, refinement and analysis program. J. Appl. Cryst. 2009, 42, 339–341. [Google Scholar] [CrossRef]
  30. Sheldrick, G. A short history of SHELX. Acta Cryst. 2008, A64, 112–122. [Google Scholar] [CrossRef] [PubMed]
  31. Sheldrick, G. Crystal structure refinement with SHELXL. Acta Cryst. 2015, C71, 3–8. [Google Scholar] [CrossRef]
Figure 1. (a) Synthesis of the indicator 8 from PNIPAm, PEPMA-C3-acryamide (7), and dansyl-en-acrylamide (5). (b) Pictorial representation of the sensor design with change in temperature and addition of metal ion: ligand (orange), fluorophore (purple), polymer backbone (black), and metal ion (green).
Molecules 28 07097 g001
Figure 2. The biotic ligand model (BLM) illustrating metal complexation on chelants (DOC = dissolved organic carbon) and on the gill surface, referred to as a biotic ligand.
Molecules 28 07097 g002
Scheme 1. Synthesis of PEPMA-C3-acrylamide 5 and PEPMA-C3-model ligand 4. Step (a): 2-pyridinecarboxaldehyde, methanol, 2 h; step (b): NaBH4, methanol, 24 h.
Molecules 28 07097 sch001
Figure 3. ORTEP plot (50% probability) for (a,b).
Molecules 28 07097 g003
Figure 4. Speciation plots for formation constant determinations of the PEPMA-C3 model ligand 4 with I = 0.1 NaNO3 at 25 °C. (A): pKa determination of the PEPMA-C3-model ligand 4 (here denoted as PEPMA-C3 or i-BuPEPMA-C3) with 2 mol equiv. of HNO3. [ML] = 1.86 mM and I = 0.1 NaNO3 at 25 °C. (B) Equation for formation constant determination; here, 4, denoted as L. TREN, is used as a competing ligand: [M(L)x]2+ + [TRENH3]3+. Ý [M(TREN)]2+ + LH+ + 2H+. (C): Distribution diagram of the PEPMA-C3-model ligand 4 with Cu2+ and TREN species. [Cu2+] = [4] = [TREN•3HCl] = 1.86 mM. (D): Distribution diagram of PEPMA-C3 model ligand 4 with Zn2+ and TREN species. [Zn2+] = [4]= [TREN•3HCl] = 1.86 mM.
Molecules 28 07097 g004
Figure 5. Fluorescence spectra of the indicator 8 (0.1 M MES buffer, pH 6.0) as a function of increasing temperature. λex = 330 nm; excitation slit width = 10; and emission width = 10. (a) Addition of 0.01 mM of Cu2+ to 8, 0.005 g/L; (b) addition of 0.01 mM of Zn2+ to 8, 0.005 g/L; (c) temperature-range fluorescence spectrum of indicator only, 0.005 g/L; (d) full scale fluorescence spectrum of indicator only, 0.005 g/L, 31 °C.
Molecules 28 07097 g005
Figure 6. Concentration response of indicator 8 (0.1 M MES buffer, pH 6.0, 0.005 g/L) to aqueous Cu2+ and Zn2+, 45 °C. λex = 330 nm; excitation slit width = 10; and emission width = 10.
Molecules 28 07097 g006
Figure 7. Response of indicator 8 (0.1 M MES buffer, pH 6.0, 0.005 g/L) to other metal ions in presence of Cu2+. (A) response to Zn2+, Ni2+, and Fe2+ alone (10 µM each). (B) response of competing metal ions against Cu2+, showing response to Cu2+ and response from addition of Fe2+, Ni2+, or Zn2+, each 10 µM. λex = 330 nm; excitation slit width = 10; and emission width = 10.
Molecules 28 07097 g007
Figure 8. Fluorescence spectra of the polymer sample with 10 μM Cu2+ titrated with different concentration of EDTA. λex = 330 nm; excitation slit width = 10; and emission width = 10. Concentration of the sample: 0.005 g/L in 0.1M MOPS buffer pH 7.0, 35 °C.
Molecules 28 07097 g008
Disclaimer/Publisher’s Note: The statements, opinions and data contained in all publications are solely those of the individual author(s) and contributor(s) and not of MDPI and/or the editor(s). MDPI and/or the editor(s) disclaim responsibility for any injury to people or property resulting from any ideas, methods, instructions or products referred to in the content.

