

Photophysical Exploration of Alectinib and Rilpivirine: Insights from Theory and Experiment
 and
and
Abstract
:
1. Introduction
2. Results and Discussion
2.1. Molecular Structural Characteristics
2.2. Molecular Electrostatic Potential
2.3. UV-vis Experiments and One-Photon Absorption (OPA) Spectral Properties
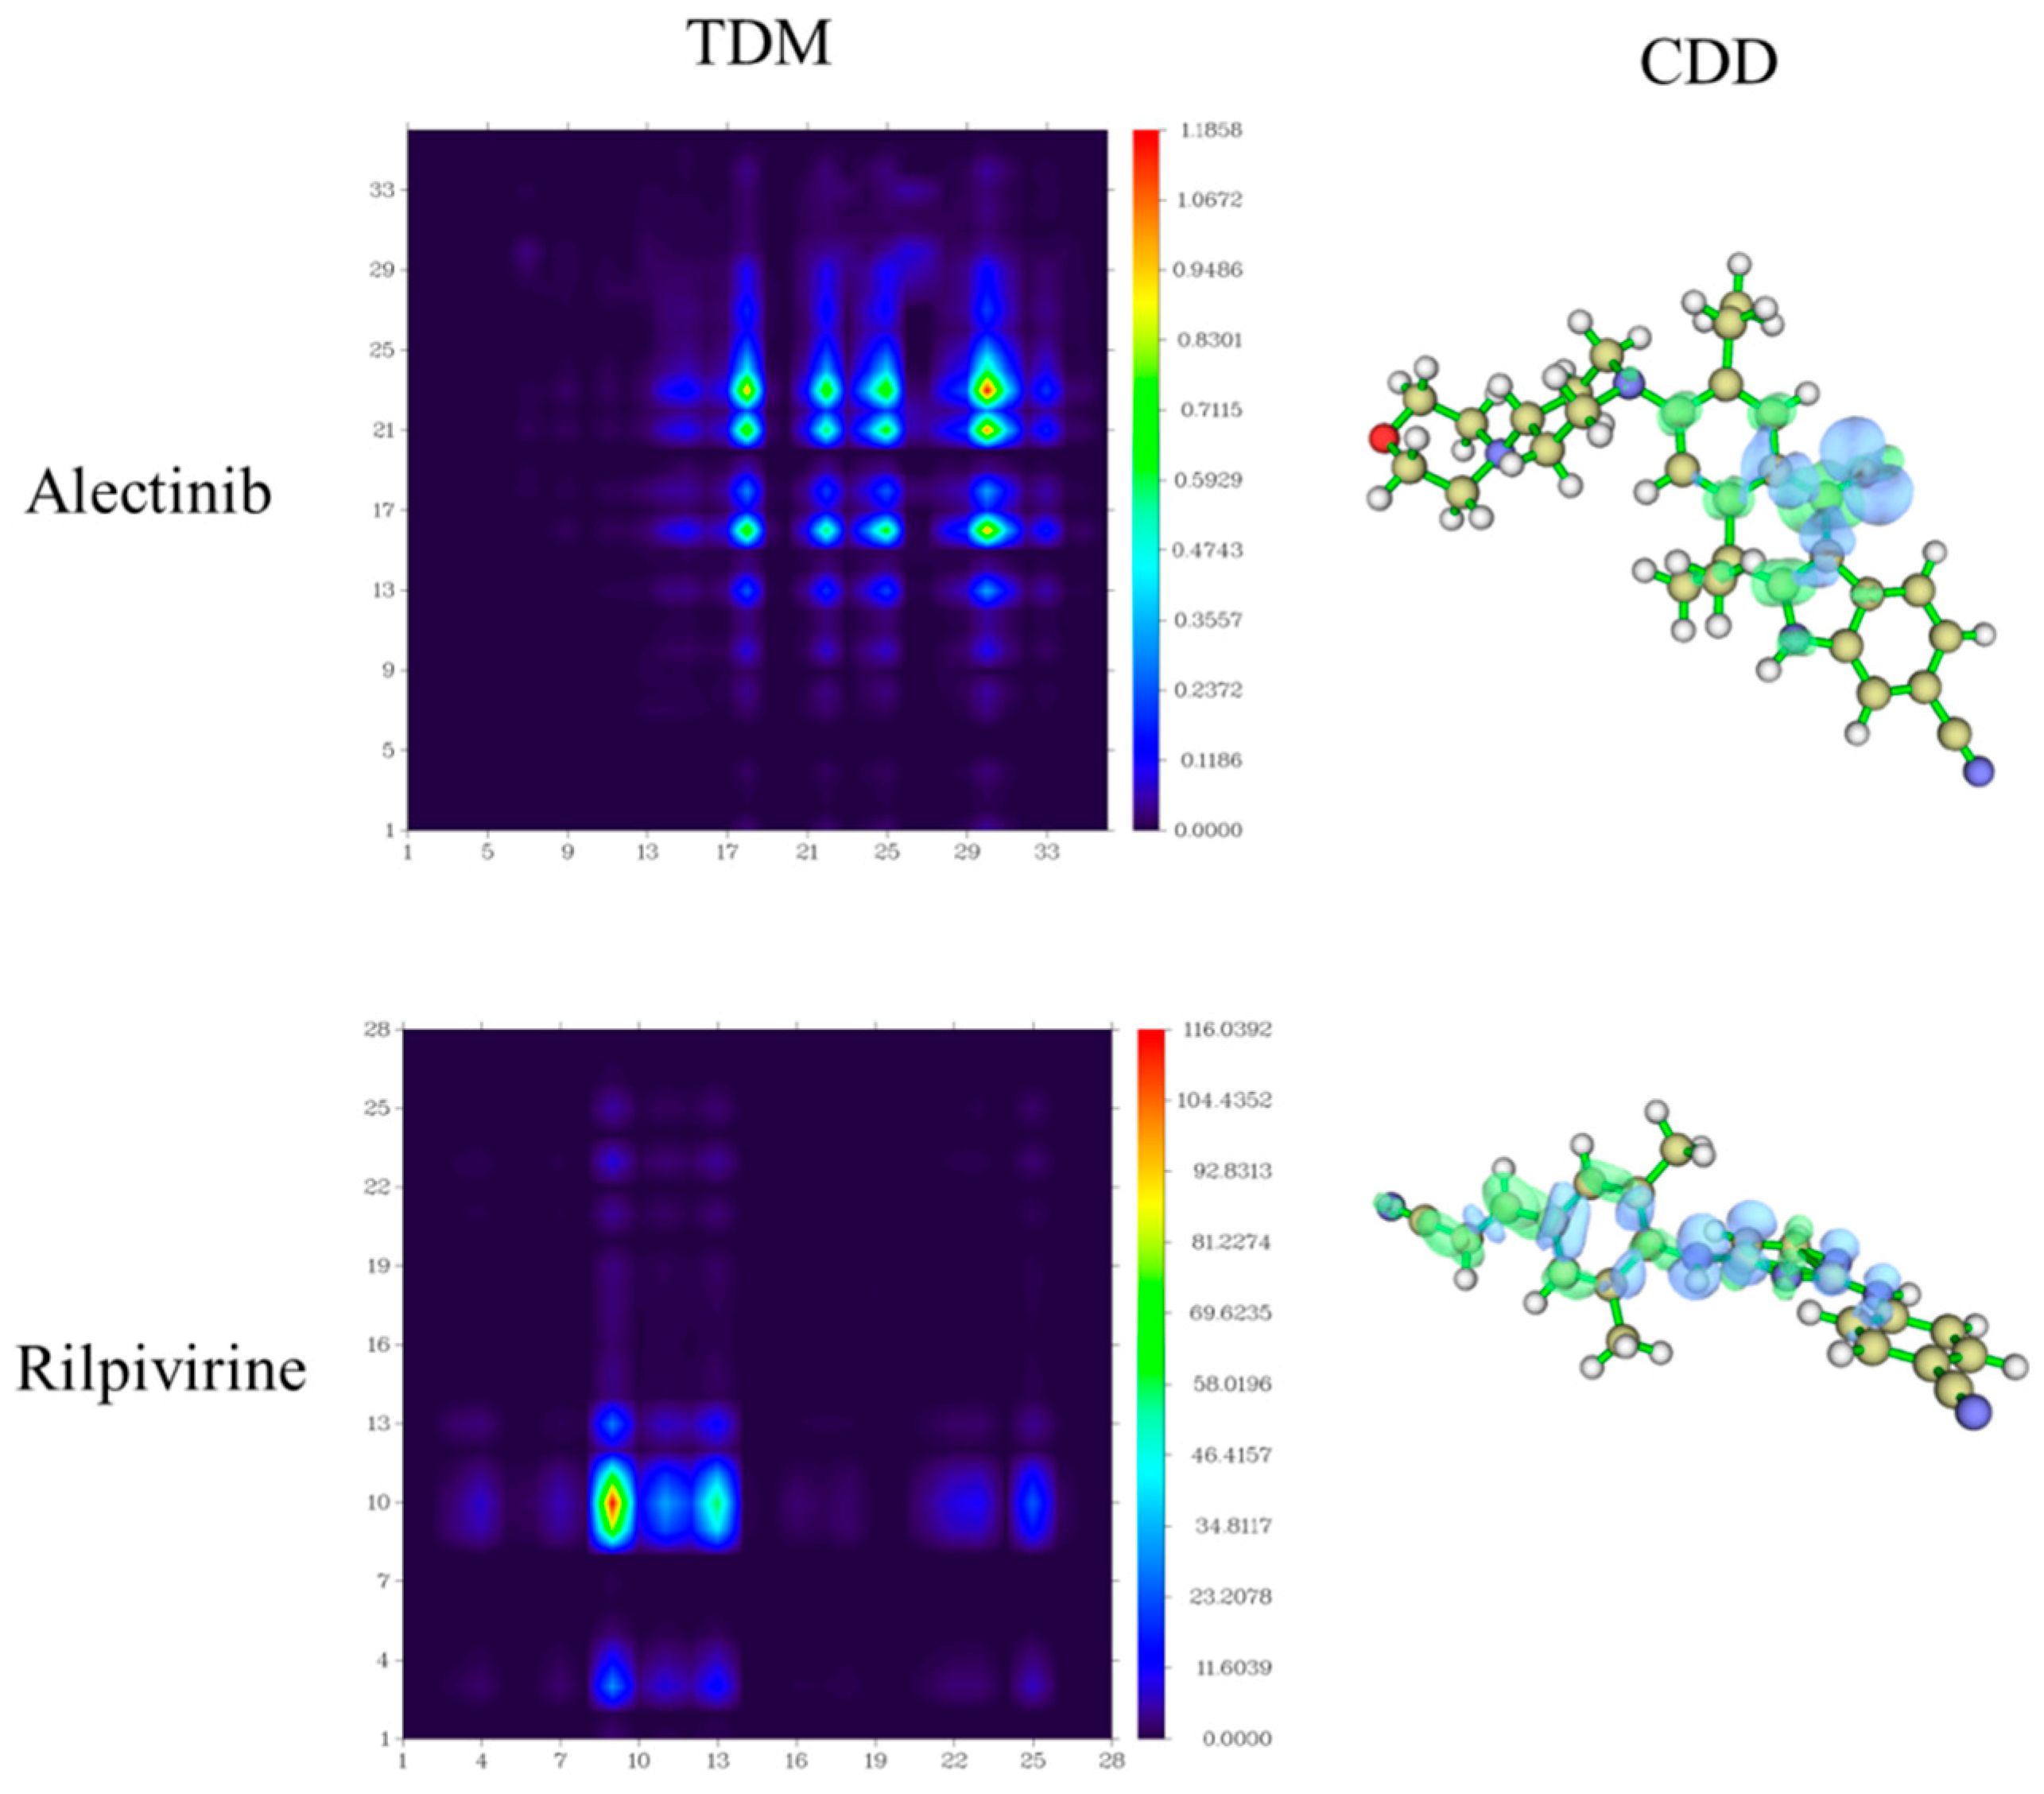
2.4. TPA Spectral Properties
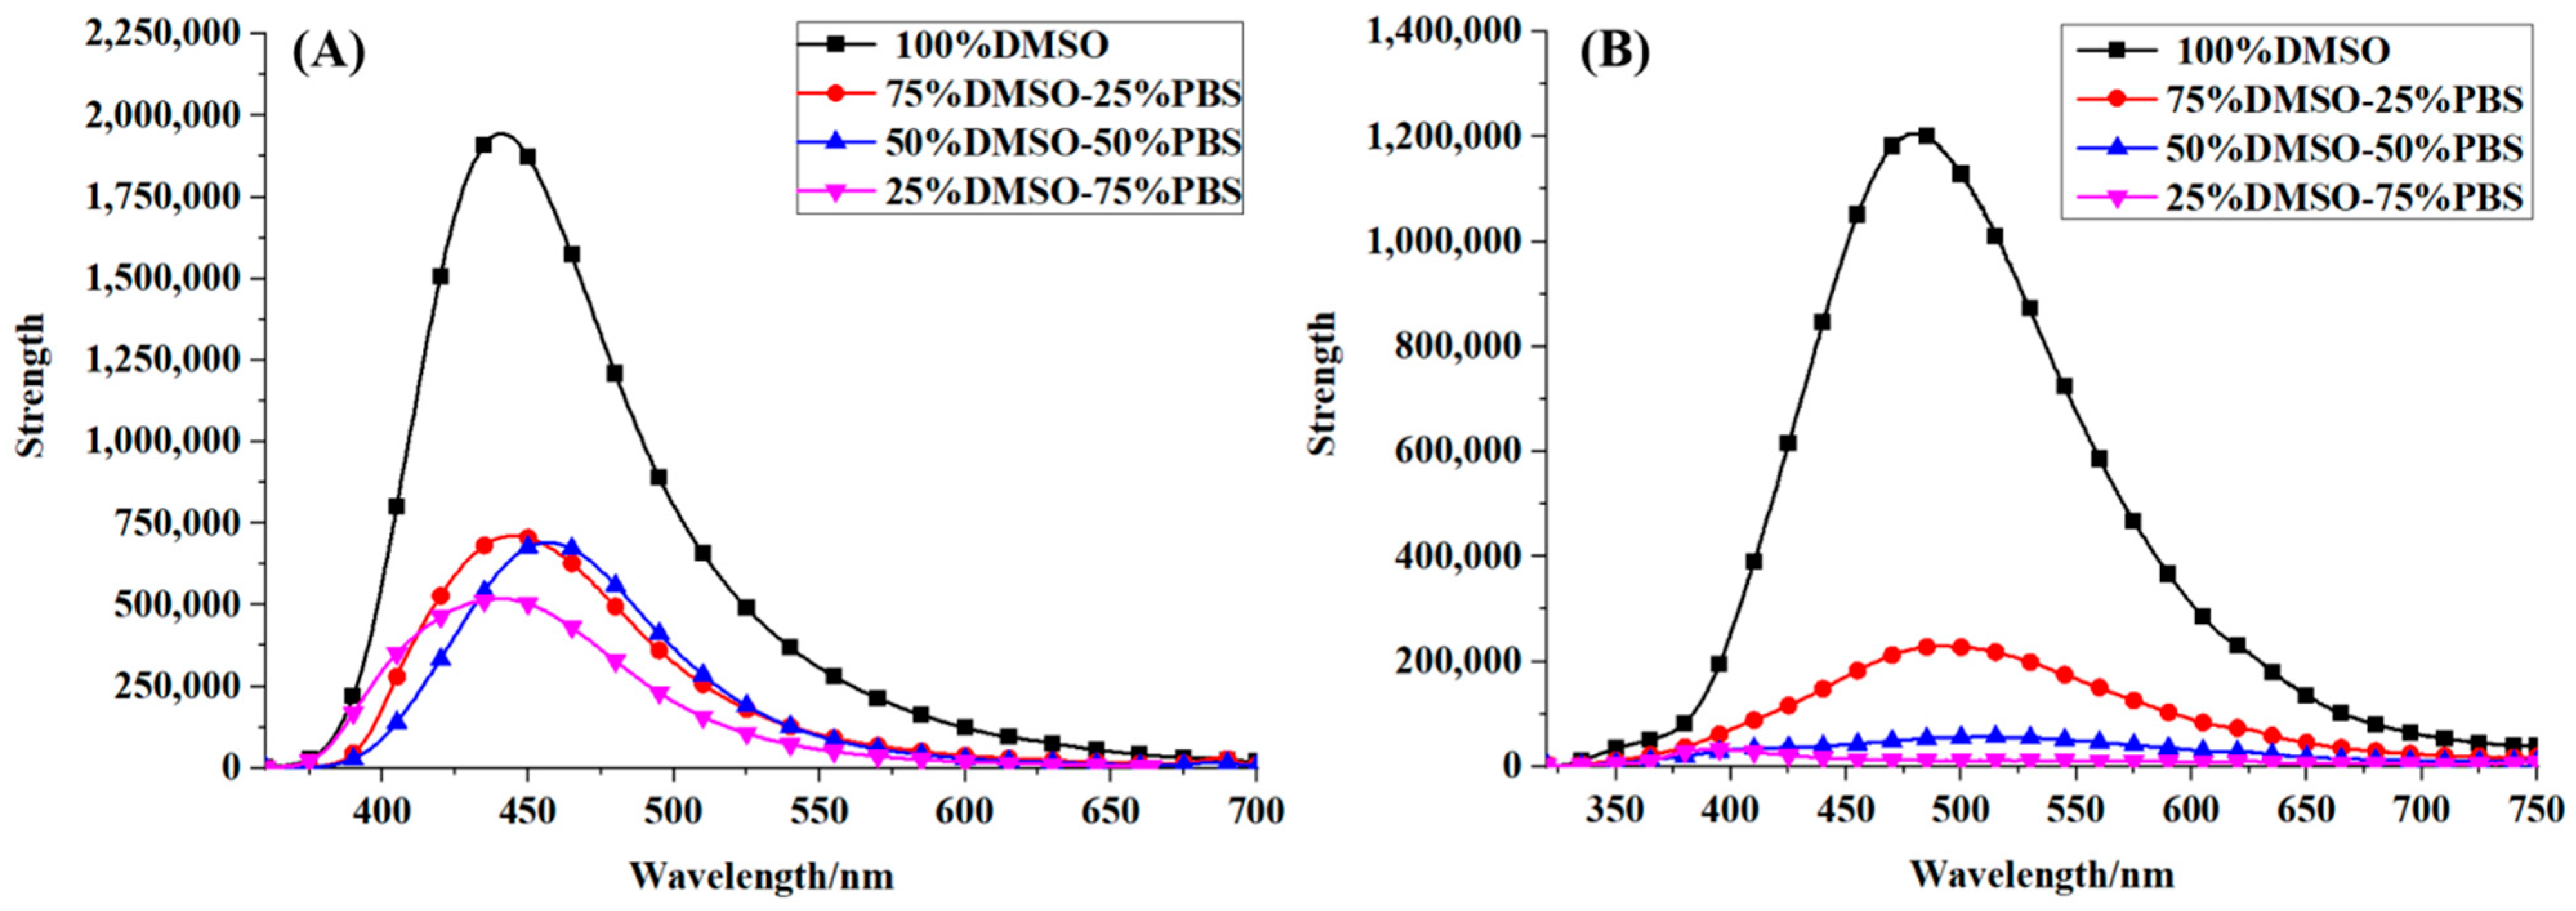
2.5. Fluorescence Spectral Properties
2.6. Cell Imaging Application
3. Material and Methods
4. Conclusions
Supplementary Materials
Author Contributions
Funding
Institutional Review Board Statement
Informed Consent Statement
Data Availability Statement
Acknowledgments
Conflicts of Interest
Sample Availability
References
- Han, H.H.; Tian, H.; Zang, Y.; Sedgwick, A.C.; Li, J.; Sessler, J.L.; He, X.P.; James, T.D. Small-molecule fluorescence-based probes for interrogating major organ diseases. Chem. Soc. Rev. 2021, 50, 9391–9429. [Google Scholar] [CrossRef] [PubMed]
- Singh, A.K.; Nair, A.V.; Singh, N.D.P. Small Two-Photon Organic Fluorogenic Probes: Sensing and Bioimaging of Cancer Relevant Biomarkers. Anal. Chem. 2022, 94, 177–192. [Google Scholar] [CrossRef] [PubMed]
- Gao, M.; Yu, F.; Lv, C.; Choo, J.; Chen, L. Fluorescent chemical probes for accurate tumor diagnosis and targeting therapy. Chem. Soc. Rev. 2017, 46, 2237–2271. [Google Scholar] [CrossRef] [PubMed]
- Nguyen, Q.T.; Tsien, R.Y. Fluorescence-guided surgery with live molecular navigation—A new cutting edge. Nature reviews. Cancer 2013, 13, 653–662. [Google Scholar] [PubMed]
- Wu, L.; Liu, J.; Li, P.; Tang, B.; James, T.D. Two-photon small-molecule fluorescence-based agents for sensing, imaging, and therapy within biological systems. Chem. Soc. Rev. 2021, 50, 702–734. [Google Scholar] [CrossRef] [PubMed]
- Wu, X.; Sun, X.; Guo, Z.; Tang, J.; Shen, Y.; James, T.D.; Tian, H.; Zhu, W. In vivo and in situ tracking cancer chemotherapy by highly photostable NIR fluorescent theranostic prodrug. J. Am. Chem. Soc. 2014, 136, 3579–3588. [Google Scholar] [CrossRef] [PubMed]
- Sun, C.-L.; Li, J.; Wang, X.-Z.; Shen, R.; Liu, S.; Jiang, J.-Q.; Li, T.; Song, Q.-W.; Liao, Q.; Fu, H.-B.; et al. Rational Design of Organic Probes for Turn-On Two-Photon Excited Fluorescence Imaging and Photodynamic Therapy. Chem 2019, 5, 600–616. [Google Scholar] [CrossRef]
- Wang, X.; Li, S.; Wang, S.; Zheng, S.; Chen, Z.; Song, H. Protein Binding Nanoparticles as an Integrated Platform for Cancer Diagnosis and Treatment. Adv. Sci. 2022, 9, e2202453. [Google Scholar] [CrossRef]
- Yuan, J.; Zhou, Q.-H.; Xu, S.; Zuo, Q.-P.; Li, W.; Zhang, X.-X.; Ren, T.-B.; Yuan, L.; Zhang, X.-B. Enhancing the Release Efficiency of a Molecular Chemotherapeutic Prodrug by Photodynamic Therapy. Angew. Chem. Int. Ed. 2022, 61, e202206169. [Google Scholar] [CrossRef]
- Hosseini Motlagh, N.S.; Parvin, P.; Ghasemi, F.; Atyabi, F.; Jelvani, S.; Abolhosseini, S. Laser induced fluorescence spectroscopy of chemo-drugs as biocompatible fluorophores: Irinotecan, gemcitabine and navelbine. Laser Phys. Lett. 2016, 13, 075604. [Google Scholar] [CrossRef]
- Motlagh, N.S.; Parvin, P.; Ghasemi, F.; Atyabi, F. Fluorescence properties of several chemotherapy drugs: Doxorubicin, paclitaxel and bleomycin. Biomed. Opt. Express 2016, 7, 2400–2406. [Google Scholar] [CrossRef] [PubMed]
- Zhang, C.; Sun, Y.T.; Gao, L.X.; Feng, B.; Yan, X.; Guo, X.H.; Ren, A.M.; Zhou, Y.B.; Li, J.; Wang, W.L. Theoretical study and application of 2-phenyl-1,3,4-thiadiazole derivatives with optical and inhibitory activity against SHP1. Phys. Chem. Chem. Phys. 2022, 24, 861–874. [Google Scholar] [CrossRef] [PubMed]
- Kim, K.H.; Singha, S.; Jun, Y.W.; Reo, Y.J.; Kim, H.R.; Ryu, H.G.; Bhunia, S.; Ahn, K.H. Far-red/near-infrared emitting, two-photon absorbing, and bio-stable amino-Si-pyronin dyes. Chem. Sci. 2019, 10, 9028–9037. [Google Scholar] [CrossRef] [PubMed]
- He, L.; Xiong, H.; Wang, B.; Zhang, Y.; Wang, J.; Zhang, H.; Li, H.; Yang, Z.; Song, X. Rational Design of a Two-Photon Ratiometric Fluorescent Probe for Hypochlorous Acid with a Large Stokes Shift. Anal. Chem. 2020, 92, 11029–11034. [Google Scholar] [CrossRef] [PubMed]
- Haziq, Q.M. Top 200 Small Molecules Pharmaceuticals by Retail Sales in 2020. Available online: https://njardarson.lab.arizona.edu/sites/njardarson.lab.arizona.edu/files/Top%20200%20Pharmaceuticals%20Small%20Molecule%202020New.pdf (accessed on 3 August 2023).
- Kinoshita, K.; Asoh, K.; Furuichi, N.; Ito, T.; Kawada, H.; Hara, S.; Ohwada, J.; Miyagi, T.; Kobayashi, T.; Takanashi, K.; et al. Design and synthesis of a highly selective, orally active and potent anaplastic lymphoma kinase inhibitor (CH5424802). Bioorganic Med. Chem. 2012, 20, 1271–1280. [Google Scholar] [CrossRef]
- Peters, S.; Camidge, D.R.; Shaw, A.T.; Gadgeel, S.; Ahn, J.S.; Kim, D.W.; Ou, S.I.; Perol, M.; Dziadziuszko, R.; Rosell, R.; et al. Alectinib versus Crizotinib in Untreated ALK-Positive Non-Small-Cell Lung Cancer. N. Engl. J. Med. 2017, 377, 829–838. [Google Scholar] [CrossRef]
- Hida, T.; Nokihara, H.; Kondo, M.; Kim, Y.H.; Azuma, K.; Seto, T.; Takiguchi, Y.; Nishio, M.; Yoshioka, H.; Imamura, F.; et al. Alectinib versus crizotinib in patients with ALK-positive non-small-cell lung cancer (J-ALEX): An open-label, randomised phase 3 trial. Lancet 2017, 390, 29–39. [Google Scholar] [CrossRef] [PubMed]
- Hui, B.; Zhang, J.; Shi, X.; Xing, F.; Shao, Y.W.; Wang, Y.; Zhang, X.; Wang, S. EML4-ALK, a potential therapeutic target that responds to alectinib in ovarian cancer. Jpn. J. Clin. Oncol. 2020, 50, 1470–1474. [Google Scholar] [CrossRef]
- Cohen, C.J.; Andrade-Villanueva, J.; Clotet, B.; Fourie, J.; Johnson, M.A.; Ruxrungtham, K.; Wu, H.; Zorrilla, C.; Crauwels, H.; Rimsky, L.T.; et al. Rilpivirine versus efavirenz with two background nucleoside or nucleotide reverse transcriptase inhibitors in treatment-naive adults infected with HIV-1 (THRIVE): A phase 3, randomised, non-inferiority trial. Lancet 2011, 378, 229–237. [Google Scholar] [CrossRef]
- Molina, J.M.; Cahn, P.; Grinsztejn, B.; Lazzarin, A.; Mills, A.; Saag, M.; Supparatpinyo, K.; Walmsley, S.; Crauwels, H.; Rimsky, L.T.; et al. Rilpivirine versus efavirenz with tenofovir and emtricitabine in treatment-naive adults infected with HIV-1 (ECHO): A phase 3 randomised double-blind active-controlled trial. Lancet 2011, 378, 238–246. [Google Scholar] [CrossRef]
- Hayashida, T.; Hachiya, A.; Ode, H.; Nishijima, T.; Tsuchiya, K.; Sugiura, W.; Takiguchi, M.; Oka, S.; Gatanaga, H. Rilpivirine resistance mutation E138K in HIV-1 reverse transcriptase predisposed by prevalent polymorphic mutations. J. Antimicrob. Chemother. 2016, 71, 2760–2766. [Google Scholar] [CrossRef]
- Ali, J.; Camilleri, P.; Brown, M.B.; Hutt, A.J.; Kirton, S.B. Revisiting the general solubility equation: In silico prediction of aqueous solubility incorporating the effect of topographical polar surface area. J. Chem. Inf. Model. 2012, 52, 420–428. [Google Scholar] [CrossRef] [PubMed]
- Marenich, A.V.; Cramer, C.J.; Truhlar, D.G. Universal Solvation Model Based on Solute Electron Density and on a Continuum Model of the Solvent Defined by the Bulk Dielectric Constant and Atomic Surface Tensions. J. Phys. Chem. B 2009, 113, 6378–6396. [Google Scholar] [CrossRef] [PubMed]
- Marenich, A.V.; Cramer, C.J.; Truhlar, D.G. Performance of SM6, SM8, and SMD on the SAMPL1 Test Set for the Prediction of Small-Molecule Solvation Free Energies. J. Phys. Chem. B 2009, 113, 4538–4543. [Google Scholar] [CrossRef] [PubMed]
- Lu, T.; Chen, F. Multiwfn: A multifunctional wavefunction analyzer. J. Comput. Chem. 2012, 33, 580–592. [Google Scholar] [CrossRef] [PubMed]
- Mu, X.; Wang, X.; Quan, J.; Sun, M. Photoinduced Charge Transfer in Donor-Bridge-Acceptor in One- and Two-photon Absorption: Sequential and Superexchange Mechanisms. J. Phys. Chem. C 2020, 124, 4968–4981. [Google Scholar] [CrossRef]
- Lu, C.; Li, N.; Jin, Y.; Sun, Y.; Wang, J. Physical Mechanisms of Intermolecular Interactions and Cross-Space Charge Transfer in Two-Photon BDBT-TCNB Co-Crystals. Nanomaterials 2022, 12, 2757. [Google Scholar] [CrossRef] [PubMed]
- Lu, C.; Yu, J.; Sheng, H.; Jiang, Y.; Zhao, F.; Wang, J. Linear and Nonlinear Photon-Induced Cross Bridge/Space Charge Transfer in STC Molecular Crystals. Nanomaterials 2022, 12, 525. [Google Scholar] [CrossRef]
- Wei, J.; Li, Y.; Song, P.; Yang, Y.; Ma, F. Enhancement of one- and two-photon absorption and visualization of intramolecular charge transfer of pyrenyl-contained derivatives. Spectrochim. Acta. Part A Mol. Biomol. Spectrosc. 2021, 245, 118897. [Google Scholar] [CrossRef] [PubMed]
- Juvekar, V.; Lee, H.W.; Lee, D.J.; Kim, H.M. Two-photon fluorescent probes for quantitative bio-imaging analysis in live tissues. Trends Anal. Chem. 2022, 157, 116787. [Google Scholar] [CrossRef]
- Kim, H.M.; Cho, B.R. Small-Molecule Two-Photon Probes for Bioimaging Applications. Chem. Rev. 2015, 115, 5014–5055. [Google Scholar] [CrossRef] [PubMed]
- Göppert-Mayer, M. Über Elementarakte mit zwei Quantensprüngen. Ann. Der Phys. 1931, 401, 273–294. [Google Scholar] [CrossRef]
- Denk, W.; Strickler, J.H.; Webb, W.W. Two-Photon Laser Scanning Fluorescence Microscopy. Science 1990, 248, 73–76. [Google Scholar] [CrossRef] [PubMed]
- Jin, H.; Yang, M.; Sun, Z.; Gui, R. Ratiometric two-photon fluorescence probes for sensing, imaging and biomedicine applications at living cell and small animal levels. Coord. Chem. Rev. 2021, 446, 214114. [Google Scholar] [CrossRef]
- Shaya, J.; Corridon, P.R.; Al-Omari, B.; Aoudi, A.; Shunnar, A.; Mohideen, M.I.H.; Qurashi, A.; Michel, B.Y.; Burger, A. Design, photophysical properties, and applications of fluorene-based fluorophores in two-photon fluorescence bioimaging: A review. J. Photochem. Photobiol. C Photochem. Rev. 2022, 52, 100529. [Google Scholar] [CrossRef]
- Xu, L.; Lin, W.; Huang, B.; Zhang, J.; Long, X.; Zhang, W.; Zhang, Q. The design strategies and applications for organic multi-branched two-photon absorption chromophores with novel cores and branches: A recent review. J. Mater. Chem. C 2021, 9, 1520–1536. [Google Scholar] [CrossRef]
- Wei, X.; Cui, W.B.; Qin, G.Y.; Zhang, X.E.; Sun, F.Y.; Li, H.; Guo, J.F.; Ren, A.M. Theoretical Investigation of Ru(II) Complexes with Long Lifetime and a Large Two-Photon Absorption Cross-Section in Photodynamic Therapy. J. Med. Chem. 2023, 66, 4167–4178. [Google Scholar] [CrossRef]
- Zhang, C.; Ren, A.M.; Guo, J.F.; Wang, D.; Yu, L.Y. Theoretical design and investigation of 1,8-naphthalimide-based two-photon fluorescent probes for detecting cytochrome P450 1A with separated fluorescence signal. Phys. Chem. Chem. Phys. 2018, 20, 13290–13305. [Google Scholar] [CrossRef]
- Aidas, K.; Angeli, C.; Bak, K.L.; Bakken, V.; Bast, R.; Boman, L.; Christiansen, O.; Cimiraglia, R.; Coriani, S.; Dahle, P.; et al. The Dalton quantum chemistry program system. WIREs Comput. Mol. Sci. 2014, 4, 269–284. [Google Scholar] [CrossRef]
- Hao, X.L.; Guo, J.F.; Ren, A.M.; Zhou, L. Persistent and Efficient Multimodal Imaging for Tyrosinase Based on Two-Photon Excited Fluorescent and Room-Temperature Phosphorescent Probes. J. Phys. Chemistry. A 2022, 126, 7650–7659. [Google Scholar] [CrossRef]
- Guo, X.-H.; Yu, L.-B.; Hao, X.-L.; He, T.-F.; Guo, J.-F.; Wei, X.; Cui, W.-B.; Yu, L.-Y.; Qu, Z.-X.; Ren, A.-M. Theoretical Study of a Two-Photon Fluorescent Probe Based on Nile Red Derivatives with Controllable Fluorescence Wavelength and Water Solubility. J. Chem. Inf. Model. 2021, 61, 5082–5097. [Google Scholar] [CrossRef] [PubMed]
- Luo, Y.; Rubio-Pons, O.; Guo, J.D.; Agren, H. Charge-transfer Zn-porphyrin derivatives with very large two-photon absorption cross sections at 1.3-1.5 microm fundamental wavelengths. J. Chem. Phys. 2005, 122, 096101. [Google Scholar] [CrossRef] [PubMed]
- Guo, J.-D.; Wang, C.-K.; Luo, Y.; Ågren, H. Influence of electron-acceptor strength on the resonant two-photon absorption cross sections of diphenylaminofluorene-based chromophores. Phys. Chem. Chem. Phys. 2003, 5, 3869–3873. [Google Scholar] [CrossRef]
- Bavali, A.; Parvin, P.; Mortazavi, S.Z.; Mohammadian, M.; Mousavi Pour, M.R. Red/blue spectral shifts of laser-induced fluorescence emission due to different nanoparticle suspensions in various dye solutions. Appl. Opt. 2014, 53, 5398. [Google Scholar] [CrossRef] [PubMed]
- Mardani, K.; Parvin, P.; Bavali, A.; Ehtesham, A.; Moafi, A. Angular study of laser induced fluorescence emission of hybrid media based on Stern-Volmer formalism. OSA Contin. 2021, 4, 15. [Google Scholar] [CrossRef]
- Chen, T.; Xiao, G.; Wang, Z.; Zou, J.; Wang, J.; Hu, W.; Liu, Y.A.; Yang, H.; Wen, K. s-Tetrazine-Bridged Photochromic Aromatic Framework Material. ACS Omega 2022, 7, 11276–11284. [Google Scholar] [CrossRef] [PubMed]
- Zhao, Y.; Truhlar, D.G. The M06 suite of density functionals for main group thermochemistry, thermochemical kinetics, noncovalent interactions, excited states, and transition elements: Two new functionals and systematic testing of four M06-class functionals and 12 other functionals. Theor. Chem. Acc. 2008, 120, 215–241. [Google Scholar]
- Frisch, M.J.T.; Trucks, G.W.; Schlegel, H.B.; Scuseria, G.E.; Robb, M.A.; Cheeseman, J.R.; Scalmani, G.; Barone, V.; Petersson, G.A.; Nakatsuji, H.; et al. Gaussian 16, Revision C.01; Gaussian, Inc.: Wallingford, CT, USA, 2019. [Google Scholar]
- Shuai, Z. Thermal Vibration Correlation Function Formalism for Molecular Excited State Decay Rates. Chin. J. Chem. 2020, 38, 1223–1232. [Google Scholar] [CrossRef]
- Shuai, Z.; Peng, Q.; Niu, Y.; Geng, H. MOMAP—Molecular Material Property Prediction Package. Available online: http://www.momap.net.cn (accessed on 3 August 2023).
- Hilborn, R.C. Einstein coefficients, cross sections, f values, dipole moments, and all that. Am. J. Phys. 1982, 50, 982–986. [Google Scholar] [CrossRef]
- Beerepoot, M.T.; Friese, D.H.; List, N.H.; Kongsted, J.; Ruud, K. Benchmarking two-photon absorption cross sections: Performance of CC2 and CAM-B3LYP. Phys. Chem. Chem. Phys. 2015, 17, 19306–19314. [Google Scholar] [CrossRef]
- Friese, D.H.; Beerepoot, M.T.; Ruud, K. Rotational averaging of multiphoton absorption cross sections. J. Chem. Phys. 2014, 141, 204103. [Google Scholar] [CrossRef]
- Zhang, C.; Guo, J.-F.; Ren, A.-M.; Wang, D. A theoretical investigation of the two-photon absorption and fluorescent properties of coumarin-based derivatives for Pd2+ detection. RSC Adv. 2017, 7, 49505–49517. [Google Scholar] [CrossRef]
- Hao, X.L.; Ren, A.M.; Zhou, L. Theoretical Studies and Design Strategies of Highly Efficient Two-Photon Excited Fluorescent Probes for Hydrogen Sulfide Detection through Simulation of Excited-State Dynamics. J. Chem. Inf. Model. 2023, 63, 2409–2418. [Google Scholar] [CrossRef]
- Englman, R.; Jortner, J. The energy gap law for radiationless transitions in large molecules. Mol. Phys. 1970, 18, 145–164. [Google Scholar] [CrossRef]
- Tarai, A.; Huang, M.; Das, P.; Pan, W.; Zhang, J.; Gu, Z.; Yang, Z. ICT and AIE characteristics two cyano-functionalized probes and their photophysical properties, DFT calculations, cytotoxicity, and cell imaging applications. Molecules 2020, 25, 585. [Google Scholar] [CrossRef] [PubMed]


| Molecules | S0 | S1 |
|---|---|---|
 Alectinib |  Top view 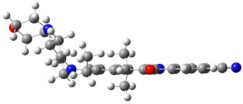 Side view |  Top view 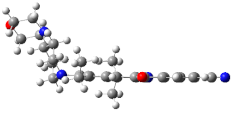 Side view |
 Rilpivirine | 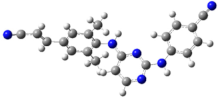 Top view  Side view | 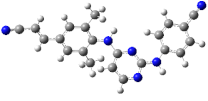 Top view 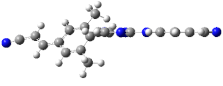 Side view |
| Molecule | /nm | Transition Characteristics | |||
|---|---|---|---|---|---|
| Alectinib | 318.0 a (349 Exp.) | 0.7456 a | 3.90 a | 1.1 a | S0 → S1 (HOMO → LUMO 88.1%) a |
| Rilpivirine | 298.6 a (311 Exp.) | 1.4836 a | 4.15 a | 1.5 a | S0 → S1 (HOMO-1 → LUMO 56.7%) a |
| Molecules | Transition Nature | |||
|---|---|---|---|---|
| Alectinib | 44.8 a 269.0 b | 700.5 a 772.5 b | S0→S1 a (HOMO → LUMO) S0→S1 b (HOMO → LUMO) | 0.723 b |
| Rilpivirine | 21.8 a 159.0 b | 756.0 a 744.6 b | S0→S1 a (HOMO → LUMO) S0→S1 b (HOMO → LUMO) | 0.546 b |
| Molecules | Excited State | |||||
|---|---|---|---|---|---|---|
| Alectinib | S1 | 10.96 | 13.44 | 2.48 | 2.99 | 3.83 |
| Rilpivirine | S1 | 9.32 | 10.54 | 1.22 | 2.00 | 3.99 |
| Molecules | Excited State | |||||||
|---|---|---|---|---|---|---|---|---|
| Alectinib | S1 | 422.7 | −31.7 | 7.5 | 6.6 | 63.2 | −1.0 | 1,068,860.6 |
| Rilpivirine | S1 | 286.6 | 18.5 | −2.9 | 2.5 | 4.7 | 95.6 | 590,613.0 |
| Molecule | λEMI/nm | fE | Transition Characteristics | /%Exp | |||
|---|---|---|---|---|---|---|---|
| Alectinib | 456.7 450Exp. | 0.7469 | 8.41 | 0.682 | 2.568 | S1 → S0 (LUMO → HOMO 98.3%) | 7.5 |
| Rilpivirine | 435.4 500Exp. | 1.3784 | 6.33 | 0.502 | 2.627 | S1 → S0 (LUMO → HOMO 97.6%) | 1.1 |
Disclaimer/Publisher’s Note: The statements, opinions and data contained in all publications are solely those of the individual author(s) and contributor(s) and not of MDPI and/or the editor(s). MDPI and/or the editor(s) disclaim responsibility for any injury to people or property resulting from any ideas, methods, instructions or products referred to in the content. |
© 2023 by the authors. Licensee MDPI, Basel, Switzerland. This article is an open access article distributed under the terms and conditions of the Creative Commons Attribution (CC BY) license (https://creativecommons.org/licenses/by/4.0/).
Share and Cite
Zhang, C.; Yang, Y.; Gan, S.; Ren, A.; Zhou, Y.-B.; Li, J.; Xiang, D.-J.; Wang, W.-L. Photophysical Exploration of Alectinib and Rilpivirine: Insights from Theory and Experiment. Molecules 2023, 28, 6172. https://doi.org/10.3390/molecules28166172
Zhang C, Yang Y, Gan S, Ren A, Zhou Y-B, Li J, Xiang D-J, Wang W-L. Photophysical Exploration of Alectinib and Rilpivirine: Insights from Theory and Experiment. Molecules. 2023; 28(16):6172. https://doi.org/10.3390/molecules28166172
Chicago/Turabian StyleZhang, Chun, Yuting Yang, Suya Gan, Aimin Ren, Yu-Bo Zhou, Jia Li, Da-Jun Xiang, and Wen-Long Wang. 2023. "Photophysical Exploration of Alectinib and Rilpivirine: Insights from Theory and Experiment" Molecules 28, no. 16: 6172. https://doi.org/10.3390/molecules28166172