
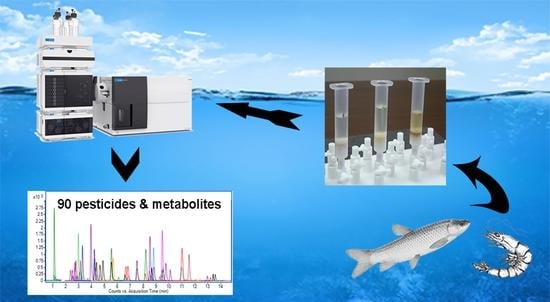
Highly-Selective Analytical Strategy for 90 Pesticides and Metabolites Residues in Fish and Shrimp Samples
Abstract
:
1. Introduction

| Category | Compound | Aquatic Biota | Analysis Time | Extraction | Cleanup | Instrument | LOQ (µg/kg) | References |
|---|---|---|---|---|---|---|---|---|
| 42 7 | pesticides PCBs | fish | 38 | ACN | MSPE: mZrO2@Fe3O4) | GC-MS/MS | 0.02–4.40 * | [14] |
| 18 37 13 | pesticides PCB/PAH/PDBE flame retardants | catfish | 9.025 | ACN | dSPE: Z-Sep | GC-MS/MS | 0.5–5.0 | [16] |
| 15 | pyrethroids | tilapia, tainha | 25 | ACN | dSPE:C18, PSA and Z-Sep | GC-MS | 5.0 or 10.0 | [24] |
| 6 | organofluorine | grass carp, white shrimp, European eel | 14.5 | ACN | SPE: NH2 | LC-MS/MS | 0.3–0.5 | [25] |
| 14 | triazine | bivalves | 20.5 | 4% acidic ACN | d-SPE:MIPs | GC-MS/MS | 0.1–1.59 | [26] |
| 32 | pesticides | flatfish, eel, oyster, and shrimp | 27 | 1% FA/ACN | d-SPE: PSA, C18 | LC-HRMS | 0.5–5.0 | [27] |
| 52 | pesticides | fish | 25 | ACN | d-SPE: PSA, C18 | LC-MS/MS | 0.04–49.8 | [28] |
| 13 | pesticides | roach, perch and carp | 17 | ACN | Hexane LLE | LC-MS/MS | 1.0–7.4 | [29] |
| 33 | pesticides | Cyprinus carpio | 20 | Ethylacetate/ACN(1:1) | GPC | LC-MS/MS | 0.003–0.247 | [30] |
| 22 | pesticides and metabolites | freshwater fish marine fish | 8 | 1%acetic acid/ACN. | SPE+dSPE | LC-MS/MS | 0.5–5.0 | [22] |
| 20 | pesticides | Eel and shrimp | 30 | ACN | d-SPE: PSA, C18 | LC-MS/MS | <5.0 | [31] |
| 67 | pesticides | fish | 33 | 1% acidic ACN | d-SPE: PSA, C18 | LC-MC/MC | 1.0–15.0 | [32] |
| 90 | pesticides and metabolites | fish, shrimp | 17 | 0.2% FA/ACN | SPE: PRiME HLB | LC-MS/MS | 0.05–5.0 | this method |
2. Results and Discussion
2.1. Optimization of the LC–MS/MS
2.2. Optimization of Sample Preprocessing
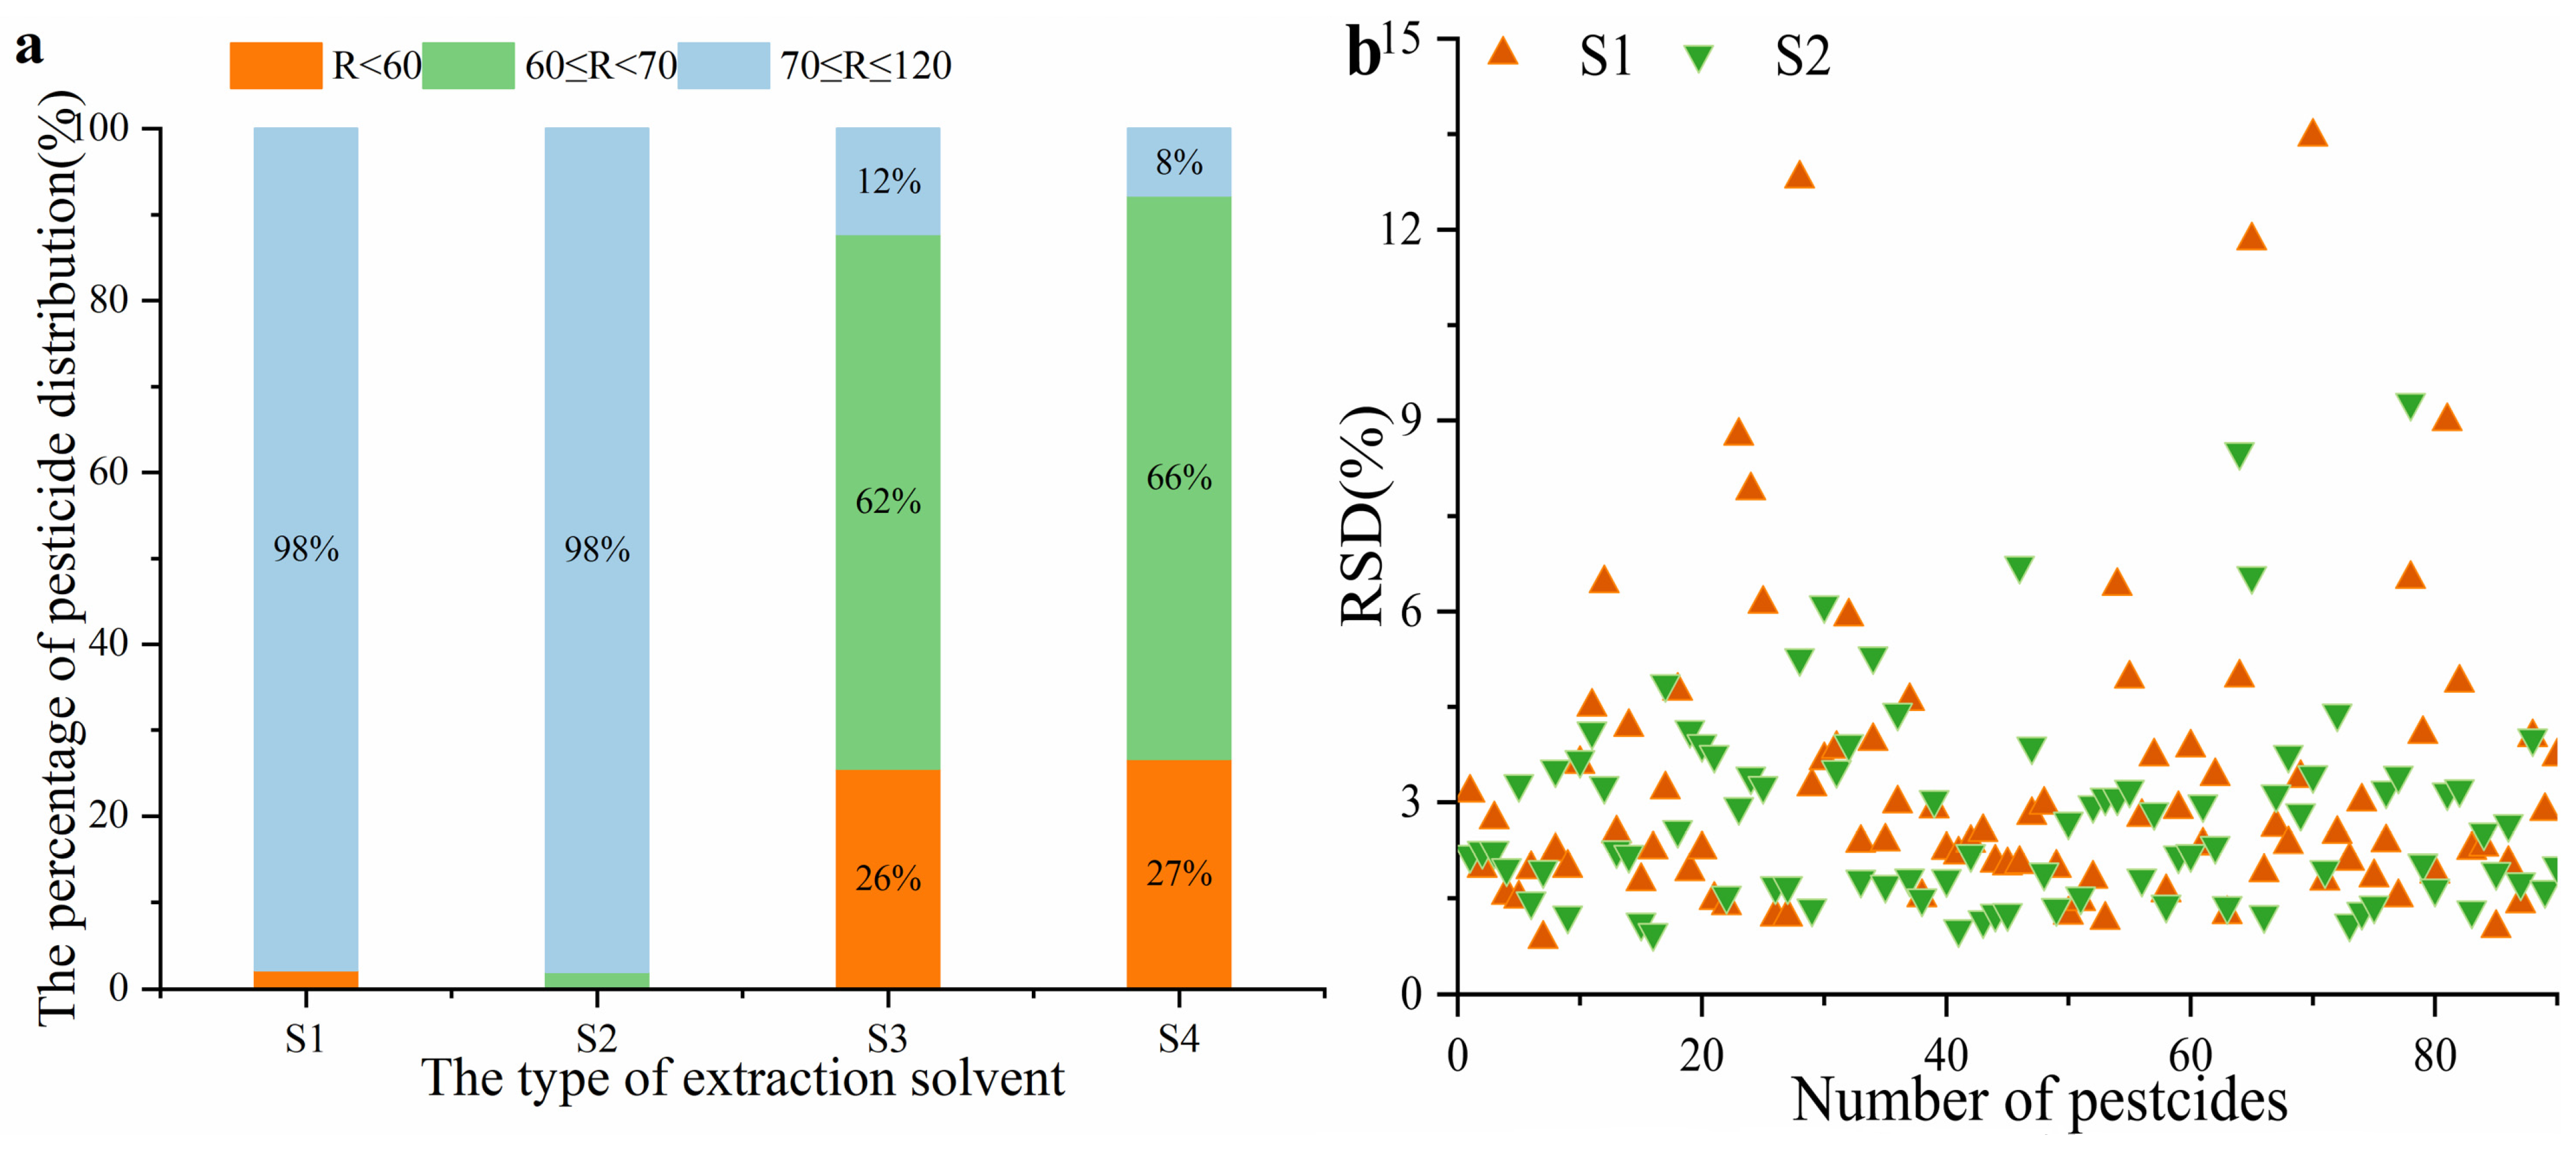
2.2.1. Extracting Procedure
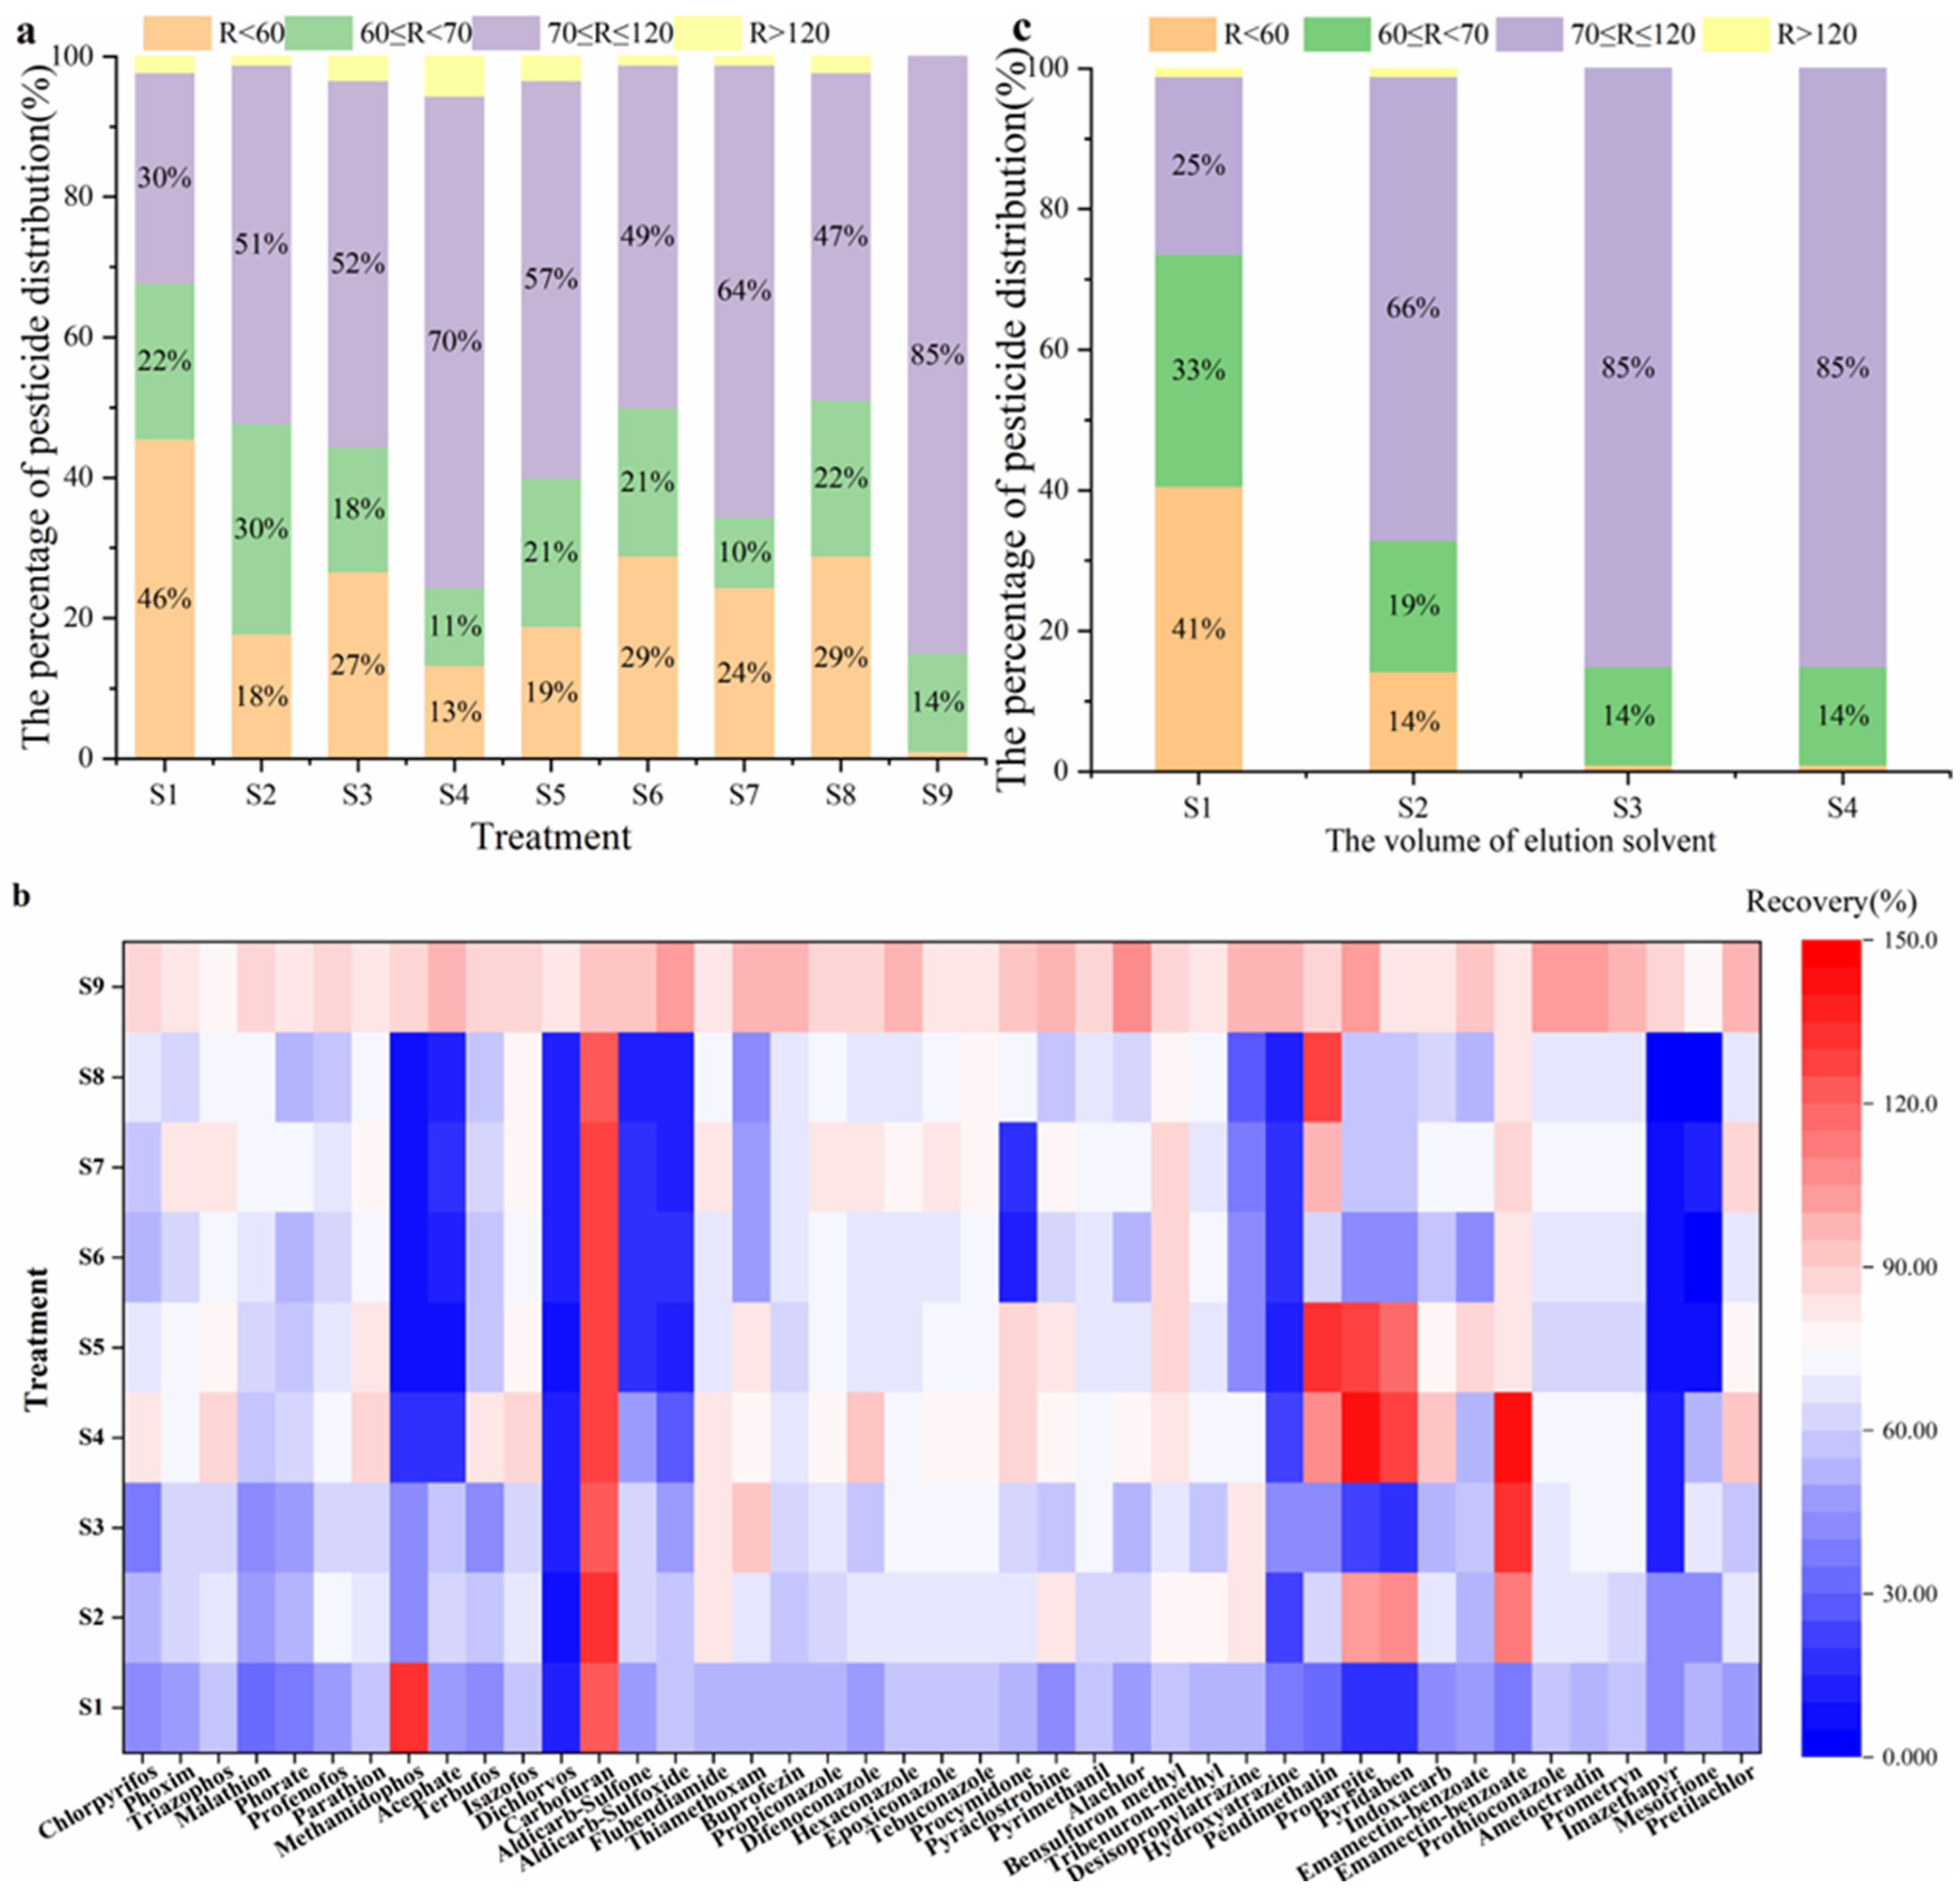
2.2.2. Clean-Up Conditions
2.3. Validation of the Proposed Method
2.4. Real Samples Analysis and Health Risk Assessment
3. Materials and Methods
3.1. Reagents and Chemicals
3.2. Sample Preparation
3.3. Extraction and Cleanup
3.4. LC-MS/MS Analysis
3.5. Method Validation
3.6. Risk Assessment
4. Conclusions
Supplementary Materials
Author Contributions
Funding
Institutional Review Board Statement
Informed Consent Statement
Data Availability Statement
Conflicts of Interest
Sample Availability
References
- Tang, F.H.M.; Lenzen, M.; McBratney, A.; Maggi, F. Risk of pesticide pollution at the global scale. Nat. Geosci. 2021, 14, 206–210. [Google Scholar] [CrossRef]
- Kalyabina, V.P.; Esimbekova, E.N.; Kopylova, K.V.; Kratasyuk, V.A. Pesticides: Formulants, distribution pathways and effects on human health—a review. Toxicol. Rep. 2021, 8, 1179–1192. [Google Scholar] [CrossRef] [PubMed]
- Stanley, J.; Preetha, G. Pesticide Toxicity to Fishes: Exposure, Toxicity and Risk Assessment Methodologies. In Pesticide Toxicity to Non-Target Organisms; Springer: Dordrecht, The Netherlands, 2016; pp. 411–497. [Google Scholar] [CrossRef]
- Álvarez-Ruiz, R.; Picó, Y. Analysis of emerging and related pollutants in aquatic biota. Trends Environ. Anal. Chem. 2020, 25, e00082. [Google Scholar] [CrossRef]
- Mohanty, B.P.; Mahanty, A.; Ganguly, S.; Mitra, T.; Karunakaran, D.; Anandan, R. Nutritional composition of food fishes and their importance in providing food and nutritional security. Food Chem. 2019, 293, 561–570. [Google Scholar] [CrossRef]
- Li, N.; Wu, X.; Zhuang, W.; Xia, L.; Chen, Y.; Wu, C.; Rao, Z.; Du, L.; Zhao, R.; Yi, M.; et al. Fish consumption and multiple health outcomes: Umbrella review. Trends Food Sci. Technol. 2020, 99, 273–283. [Google Scholar] [CrossRef]
- Arisekar, U.; Shakila, R.J.; Shalini, R.; Jeyasekaran, G.; Arumugam, N.; Almansour, A.I.; Keerthana, M.; Perumal, K. Bioaccumulation of organochlorine pesticide residues (OCPs) at different growth stages of pacific white leg shrimp (Penaeus vannamei): First report on ecotoxicological and human health risk assessment. Chemosphere 2022, 308, 136459. [Google Scholar] [CrossRef]
- Maia, M.L.; Sousa, S.; Correia-Sa, M.L.; Delerue-Matos, C.; Calhau, C.; Domingues, V.F. Organochlorine pesticides, brominated flame retardants, synthetic musks and polycyclic aromatic hydrocarbons in shrimps. An overview of occurrence and its implication on human exposure. Heliyon 2020, 6, e04870. [Google Scholar] [CrossRef]
- Chang, H.Y.; Yang, W.C.; Xue, Y.J.; Tsai, M.Y.; Wang, J.H.; Chang, G.R. Phthalates and organophosphorus insecticide residues in shrimp determined by liquid/gas chromatography-Tandem mass spectrometry and a health risk assessment. Mar. Pollut. Bull. 2019, 144, 140–145. [Google Scholar] [CrossRef]
- Núñez, M.; Borrull, F.; Pocurull, E.; Fontanals, N. Sample treatment for the determination of emerging organic contaminants in aquatic organisms. Trends Anal. Chem. 2017, 97, 136–145. [Google Scholar] [CrossRef]
- Zhao, X.; Cui, T.; Guo, R.; Liu, Y.; Wang, X.; An, Y.X.; Qiao, X.; Zheng, B. A clean-up method for determination of multi-classes of persistent organic pollutants in sediment and biota samples with an aliquot sample. Anal. Chim. Acta 2019, 1047, 71–80. [Google Scholar] [CrossRef]
- Molbert, N.; Alliot, F.; Santos, R.; Chevreuil, M.; Mouchel, J.M.; Goutte, A. Multiresidue Methods for the Determination of Organic Micropollutants and Their Metabolites in Fish Matrices. Environ. Toxicol. Chem. 2019, 38, 1866–1878. [Google Scholar] [CrossRef] [PubMed]
- Azzouz, A.; Colon, L.P.; Souhail, B.; Ballesteros, E. A multi-residue method for GC-MS determination of selected endocrine disrupting chemicals in fish and seafood from European and North African markets. Environ. Res. 2019, 178, 108727. [Google Scholar] [CrossRef] [PubMed]
- Peng, X.T.; Jiang, L.; Gong, Y.; Hu, X.Z.; Peng, L.J.; Feng, Y.Q. Preparation of mesoporous ZrO2-coated magnetic microsphere and its application in the multi-residue analysis of pesticides and PCBs in fish by GC-MS/MS. Talanta 2015, 132, 118–125. [Google Scholar] [CrossRef]
- Molinaruiz, J.M.; Cieslik, E.; Cieslik, I.; Walkowska, I. Determination of pesticide residues in fish tissues by modified QuEChERS method and dual-d-SPE clean-up coupled to gas chromatography-mass spectrometry. Environ. Sci. Pollut. Res. 2015, 22, 369–378. [Google Scholar] [CrossRef]
- Sapozhnikova, Y.; Lehotay, S.J. Multi-class, multi-residue analysis of pesticides, polychlorinated biphenyls, polycyclic aromatic hydrocarbons, polybrominated diphenyl ethers and novel flame retardants in fish using fast, low-pressure gas chromatography-tandem mass spectrometry. Anal. Chim. Acta 2013, 758, 80–92. [Google Scholar] [CrossRef]
- Nardelli, V.; dell’Oro, D.; Palermo, C.; Centonze, D. Multi-residue method for the determination of organochlorine pesticides in fish feed based on a cleanup approach followed by gas chromatography-triple quadrupole tandem mass spectrometry. J. Chromatogr. A 2010, 1217, 4996–5003. [Google Scholar] [CrossRef] [PubMed]
- Chen, S.; Shi, L.; Shan, Z.; Hu, Q. Determination of organochlorine pesticide residues in rice and human and fish fat by simplified two-dimensional gas chromatography. Food Chem. 2007, 104, 1315–1319. [Google Scholar] [CrossRef]
- FAO/WHO. Joint FAO/WHO Food Standards Programme Codex Committee on Pesticide Residues 52nd Session Maximum Residue Limits for Pesticides in Foods and Feeds; FAO: Rome, Italy, 2021; pp. 1–386.
- Li, M.; Li, P.; Wang, L.; Feng, M.; Han, L. Determination and dissipation of fipronil and its metabolites in peanut and soil. J. Agric. Food Chem. 2015, 63, 4435–4443. [Google Scholar] [CrossRef]
- Bhatti, P.; Duhan, A.; Pal, A.; Monika; Beniwal, R.K.; Kumawat, P.; Yadav, D.B. Ultimate fate and possible ecological risks associated with atrazine and its principal metabolites (DIA and DEA) in soil and water environment. Ecotoxicol. Environ. Saf. 2022, 248, 114299. [Google Scholar] [CrossRef]
- Guo, Y.; Zhang, J.; Xu, J.; Wu, X.; Dong, F.; Liu, X.; Zheng, Y. An Integrated Strategy for Purification by Combining Solid-Phase Extraction with Dispersive-Solid-Phase Extraction for Detecting 22 Pesticides and Metabolite Residues in Fish. J. Agric. Food Chem. 2021, 69, 7199–7208. [Google Scholar] [CrossRef]
- EU (Eupropean Commission). Guidance Document on Analytical Quality Control and Method Validation Procedures for Pesticide Residues and Analysis in Food and Feed (SANTE/11813/2017); EU: Brussels, Belgium, 2017. [Google Scholar]
- De Oliveira, L.G.; Kurz, M.H.S.; Guimaraes, M.C.M.; Martins, M.L.; Prestes, O.D.; Zanella, R.; Ribeiro, J.; Goncalves, F.F. Development and validation of a method for the analysis of pyrethroid residues in fish using GC-MS. Food Chem. 2019, 297, 124944. [Google Scholar] [CrossRef] [PubMed]
- Gan, J.; Lv, L.; Peng, J.; Li, J.; Xiong, Z.; Chen, D.; He, L. Multi-residue method for the determination of organofluorine pesticides in fish tissue by liquid chromatography triple quadrupole tandem mass spectrometry. Food Chem. 2016, 207, 195–204. [Google Scholar] [CrossRef] [PubMed]
- Yu, X.; Zhang, R.; Liu, H.; Zhang, Z.; Shi, X.; Sun, A.; Chen, J. Highly-selective complex matrices removal via a modified QuEChERS for determination of triazine herbicide residues and risk assessment in bivalves. Food Chem. 2021, 347, 129030. [Google Scholar] [CrossRef] [PubMed]
- Kim, K.; Choi, Y.; Mok, S.; Moon, H.B.; Jeon, J. Optimization of the QuEChERS method for multi-residue analysis of pharmaceuticals and pesticides in aquaculture products. Food Chem. 2023, 399, 133958. [Google Scholar] [CrossRef] [PubMed]
- Barbieri, M.V.; Postigo, C.; Guillemargiles, N.; Monlloralcaraz, L.S.; Simionato, J.I.; Stella, E.; Barcelo, D.; Lopez de Alda, M. Analysis of 52 pesticides in fresh fish muscle by QuEChERS extraction followed by LC-MS/MS determination. Sci. Total Environ. 2019, 653, 958–967. [Google Scholar] [CrossRef] [PubMed]
- Lazartigues, A.; Wiest, L.; Baudot, R.; Thomas, M.; Feidt, C.; Cren-Olive, C. Multiresidue method to quantify pesticides in fish muscle by QuEChERS-based extraction and LC-MS/MS. Anal. Bioanal. Chem. 2011, 400, 2185–2193. [Google Scholar] [CrossRef]
- Fu, L.; Lu, X.; Tan, J.; Wang, L.; Chen, J. Multiresidue determination and potential risks of emerging pesticides in aquatic products from Northeast China by LC-MS/MS. J. Environ. Sci. 2018, 63, 116–125. [Google Scholar] [CrossRef] [PubMed]
- Cho, H.R.; Park, J.S.; Kim, J.; Han, S.B.; Choi, Y.S. Multiresidue method for the quantitation of 20 pesticides in aquatic products. Anal. Bioanal. Chem. 2015, 407, 9043–9052. [Google Scholar] [CrossRef]
- Colazzo, M.; Alonso, B.; Ernst, F.; Cesio, M.V.; Perez-Parada, A.; Heinzen, H.; Pareja, L. Determination of multiclass, semi-polar pesticide residues in fatty fish muscle tissue by gas and liquid chromatography mass spectrometry. Methods X 2019, 6, 929–937. [Google Scholar] [CrossRef]
- Wang, Z.; Li, H.; Yun, Y.; Wang, H.; Meng, B.; Mu, Y.; Gao, S.; Tao, X.; Chen, W. A dynamic multiple reaction monitoring strategy to develop and optimize targeted metabolomics methods: Analyzing bile acids in capecitabine-induced diarrhea. J. Pharm. Biomed. Anal. 2022, 219, 114938. [Google Scholar] [CrossRef]
- Qie, M.; Zhao, Y.; Yang, S.; Wang, W.; Xu, Z. Rapid simultaneous determination of 160 drugs in urine and blood of livestock and poultry by ultra-high-performance liquid chromatography-tandem mass spectrometry. J. Chromatogr. A 2019, 1608, 460423. [Google Scholar] [CrossRef] [PubMed]
- Taujenis, L.; Olšauskaitė, V.; Padarauskas, A. Determination of nicotine and three minor alkaloids in tobacco by hydrophilic interaction chromatography-tandem mass spectrometry. Acta Chromatogr. 2015, 27, 373–385. [Google Scholar] [CrossRef]
- Dai, J.; Lin, H.; Pan, Y.; Sun, Y.; Wang, Y.; Qiao, J.Q.; Lian, H.Z.; Xu, C.X. Determination of chlorpromazine and its metabolites in animal-derived foods using QuEChERS-based extraction, EMR-Lipid cleanup, and UHPLC-Q-Orbitrap MS analysis. Food Chem. 2023, 403, 134298. [Google Scholar] [CrossRef] [PubMed]
- Wu, C.; Dong, F.; Mei, X.; Ning, J.; She, D. Isotope-labeled internal standards and grouping scheme for determination of neonicotinoid insecticides and their metabolites in fruits, vegetables and cereals—A compensation of matrix effects. Food Chem. 2020, 311, 125871. [Google Scholar] [CrossRef] [PubMed]
- Marin, J.M.; Gracia-Lor, E.; Sancho, J.V.; Lopez, F.J.; Hernandez, F. Application of ultra-high-pressure liquid chromatography-tandem mass spectrometry to the determination of multi-class pesticides in environmental and wastewater samples. Study of matrix effects. J. Chromatogr. A 2009, 1216, 1410–1420. [Google Scholar] [CrossRef] [PubMed]
- Pan, X.; Dong, F.; Xu, J.; Liu, X.; Chen, Z.; Liu, N.; Chen, X.; Tao, Y.; Zhang, H.; Zheng, Y. Simultaneous determination of chlorantraniliprole and cyantraniliprole in fruits, vegetables and cereals using ultra-high-performance liquid chromatography-tandem mass spectrometry with the isotope-labelled internal standard method. Anal. Bioanal. Chem. 2015, 407, 4111–4220. [Google Scholar] [CrossRef]
- Liu, C.; Zhu, X.; Xu, Z.; Ren, D.; Meng, Y.; Liu, Y.; Tang, J. Dynamic non-target analysis and occurrence of herbicides residues in rice-crayfish and rice-crab co-culture systems in Jiangsu province. J. Ecol. Rural Environ. 2022, 38, 933–943. [Google Scholar]
- Xue, Y.; Zhang, Z.M.; Zhang, R.R.; Li, Y.Q.; Sun, A.L.; Shi, X.Z.; Chen, J.; Song, S. Aquaculture-derived distribution, partitioning, migration, and transformation of atrazine and its metabolites in seawater, sediment, and organisms from a typical semi-closed mariculture bay. Environ. Pollut. 2021, 271, 116362. [Google Scholar] [CrossRef]
- Tao, Y.; Jia, C.; Jing, J.; Zhang, J.; Yu, P.; He, M.; Wu, J.; Chen, L.; Zhao, E. Occurrence and dietary risk assessment of 37 pesticides in wheat fields in the suburbs of Beijing, China. Food Chem. 2021, 350, 129245. [Google Scholar] [CrossRef]
- Wu, Y.; Liu, P.; Sun, J.; Li, J. Dietary Exposure Assessment and Total Diet Study; Chemical Industry Press: Beijing, China, 2019. [Google Scholar]

| Analyte | Linearity * | Grass Carp | Prawn | ||||||||||
|---|---|---|---|---|---|---|---|---|---|---|---|---|---|
| Linearity ** | Recovery (Intra-RSD, %) | LOQ | Linearity *** | Recovery (Intra-RSD, %) | LOQ | ||||||||
| 0.05 μg/kg | 0.5 μg/kg | 5 μg/kg | 50 μg/kg | 0.05 μg/kg | 0.5 μg/kg | 5 μg/kg | 50 μg/kg | ||||||
| Chlorpyrifos | 0.9995 | 0.9994 | 77.6 (9.3) | 85.3 (16.1) | 5.0 | 0.9996 | 94.1 (5.2) | 81.4 (13.8) | 5.0 | ||||
| Phoxim | 0.9998 | 0.9989 | 105.9 (9.9) | 77.7 (4.7) | 84.9 (16.9) | 0.5 | 0.9998 | 88.2 (18.5) | 85.2 (8.1) | 79.0 (14.2) | 0.5 | ||
| Triazophos | 0.9986 | 0.9999 | 88 (3.6) | 83.4 (3.5) | 79.9 (10.2) | 0.5 | 0.9960 | 90.5 (6.8) | 89.8 (4.1) | 79.6 (15.9) | 0.5 | ||
| Malathion | 0.9926 | 0.9999 | 89.7 (5.5) | 84.2 (3.3) | 89.1 (10.6) | 0.5 | 0.9954 | 60.5 (3.7) | 83.6 (7.6) | 78.7 (14.2) | 0.5 | ||
| Phorate | 0.9995 | 0.9998 | 64.2 (5.2) | 65.2 (6.1) | 84.3 (19.0) | 0.5 | 0.9997 | 79.2 (14.3) | 78.9 (3.7) | 81.2 (15.1) | 0.5 | ||
| Phorate-Sulfone | 0.9973 | 0.9919 | 76.8 (19.2) | 85.5 (14.9) | 5.0 | 0.9956 | 92.3 (10.9) | 83.6 (7.6) | 81.9 (13.2) | 0.5 | |||
| Phorate-Sulfoxide | 0.9986 | 0.9999 | 94.0 (1.2) | 94.2 (6.1) | 93.8 (2.7) | 85.9 (17.5) | 0.05 | 0.9980 | 92.4 (11.4) | 95.6 (4.6) | 78.9 (3.7) | 81.0 (14.7) | 0.05 |
| Isocarbophos | 0.9923 | 0.9998 | 102.3 (11.1) | 90.0 (5.3) | 66.9 (12.1) | 83.0 (16.4) | 0.05 | 0.9976 | 85.6 (6.3) | 87.3 (3.4) | 90.2 (3.9) | 82.1 (13.0) | 0.05 |
| Profenofos | 0.9989 | 0.9997 | 83.1 (6.1) | 70.4 (7.7) | 86.2 (17.8) | 0.5 | 0.9997 | 64.2 (9.9) | 89.5 (4.1) | 79.9 (15.2) | 0.5 | ||
| Parathion | 0.9985 | 0.997 | 93.9 (2.7) | 87.3 (3.6) | 82.8 (3.8) | 83.5 (18.7) | 0.05 | 0.9958 | 92.5 (2.7) | 98.7 (3.9) | 80.7 (14.1) | 0.5 | |
| Parathion–methyl | 0.9961 | 0.9913 | 96.3 (16.5) | 97.0 (14.8) | 5.0 | 0.9976 | 91.8 (4.2) | 81.3 (14.0) | 5.0 | ||||
| Methamidophos | 0.995 | 0.9996 | 64.5 (7.5) | 86.3 (17.5) | 5.0 | 0.9999 | 76.9 (4.1) | 112.6 (10.8) | 5.0 | ||||
| Acephate | 0.9945 | 0.9972 | 67.7 (6.1) | 98.9 (3.4) | 5.0 | 0.9972 | 98.7 (4.5) | 90.7 (1.5) | 5.0 | ||||
| Terbufos | 0.9998 | 0.9959 | 117.4 (12.3) | 85.9 (15.3) | 5.0 | 0.9994 | 85.3 (5.2) | 78.2 (13.1) | 5.0 | ||||
| Fosthiazate | 0.9943 | 0.9999 | 114.4 (3.2) | 89.6 (2.9) | 85.2 (1.5) | 87.9 (13.3) | 0.05 | 0.9989 | 103.2 (10.5) | 89.2 (2.4) | 88.9 (3.1) | 82.5 (18.5) | 0.05 |
| Isazofos | 0.9986 | 0.9999 | 88.1 (3.6) | 82.8 (3.2) | 86.8 (16.4) | 0.5 | 0.9966 | 101.4 (3) | 90.9 (4.0) | 81.8 (13.3) | 0.5 | ||
| Dichlorvos | 0.9998 | 0.9936 | 61.8 (15.9) | 85.4 (16.0) | 5.0 | 0.9996 | 84.3 (17.8) | 78.6 (8.2) | 81.6 (14.8) | 0.5 | |||
| Dipterex | 0.9992 | 0.9911 | 92.9 (8.2) | 83.7 (16.2) | 5.0 | 0.9943 | 78.9 (7.5) | 96.7 (7.0) | 101.2 (13.9) | 0.5 | |||
| Omethoate | 0.9966 | 0.9982 | 72.5 (2.1) | 92.5 (7.9) | 5.0 | 0.9957 | 88.3 (7.4) | 83.1 (15.4) | 5.0 | ||||
| Carbofuran | 0.9910 | 0.9999 | 115.9 (13.4) | 109.8 (4.0) | 115.7 (3.9) | 87.9 (13.9) | 0.05 | 0.9972 | 72.5 (8.3) | 100.9 (9.3) | 117.2 (3.4) | 90.3 (8.4) | 0.05 |
| 3–hydroxycarbofuran | 0.9957 | 0.9997 | 85.1 (13.0) | 79.4 (4.6) | 90.2 (13.8) | 0.5 | 0.9975 | 78.9 (11.5) | 87.2 (3.4) | 84.5 (12.9) | 0.5 | ||
| Aldicarb | 0.9944 | 0.9991 | 76.3 (10.7) | 77.0 (10.4) | 90.8 (6.5) | 0.5 | 0.9920 | 81.2 (12.6) | 82.3 (7.1) | 87.6 (4.3) | 82.4 (12.7) | 0.05 | |
| Aldicarb-Sulfone | 0.9986 | 0.9957 | 89.5 (11.1) | 83.8 (3.9) | 84.5 (16.5) | 0.5 | 0.9973 | 77.5 (15.3) | 70.2 (12.9) | 75.3 (3.4) | 85.3 (10.3) | 0.05 | |
| Aldicarb-Sulfoxide | 0.9947 | 0.9955 | 74.9 (8.5) | 94.8 (9.3) | 5.0 | 0.9992 | 79.5 (3.1) | 83.2 (13.3) | 5.0 | ||||
| Methomyl | 0.9948 | 0.9999 | 91.2 (7.7) | 83.6 (5.9) | 101.9 (10.7) | 0.5 | 0.9985 | 71.6 (6.5) | 82.3 (1.1) | 85.1 (3.6) | 86.4 (13.3) | 0.05 | |
| Isoprocarb | 0.9966 | 0.9999 | 87.5 (5.1) | 76.9 (6.2) | 75.4 (16.1) | 0.5 | 0.9986 | 116.2 (10.7) | 74.6 (3.7) | 84.6 (4.2) | 82.8 (13.0) | 0.05 | |
| Fenpropathrin | 0.9996 | 0.9946 | 83.6 (7.3) | 97.5 (5.9) | 5.0 | 0.9979 | 94 (8.1) | 84.3 (12.4) | 5.0 | ||||
| Chloantraniliprole | 0.9991 | 0.9988 | 78.5 (12.4) | 71.4 (4.8) | 90.8 (9.8) | 0.5 | 0.9994 | 76.7 (5.2) | 78.2 (14.8) | 92.8 (5.6) | 0.5 | ||
| Flubendiamide | 0.9998 | 0.9997 | 108.9 (9.4) | 81.9 (16.5) | 90.5 (11.4) | 0.5 | 0.9998 | 76.1 (12.3) | 92.7 (1.1) | 85.4 (11.8) | 0.5 | ||
| Acetamiprid | 0.9936 | 0.9989 | 57.5 (4.9) | 75.9 (5.8) | 81.4 (16.4) | 0.5 | 0.9974 | 83.3 (3.5) | 89.8 (13.3) | 5.0 | |||
| Imidacloprid | 0.9982 | 0.9989 | 79.9 (9.7) | 78.3 (2.7) | 95.1 (9.0) | 0.5 | 0.9997 | 89.3 (13.5) | 77.3 (7.7) | 82.1 (14.7) | 0.5 | ||
| Thiamethoxam | 0.9945 | 0.9979 | 101.8 (11.7) | 79.9 (3.6) | 75.2 (13.8) | 0.5 | 0.9994 | 77.2 (19.5) | 84.6 (6.8) | 78.5 (16.9) | 0.5 | ||
| Clothianidin | 0.9926 | 0.9945 | 63.9 (15.8) | 82.4 (1.7) | 95.1 (5.2) | 0.5 | 0.9986 | 75.5 (18.9) | 85.4 (2.9) | 82.6 (15.3) | 0.5 | ||
| Fipronil | 0.9994 | 0.9996 | 90.6 (2.9) | 80.3 (3.6) | 90.3 (12.9) | 0.5 | 0.9998 | 90.2 (2.8) | 89.9 (4.6) | 79.3 (15.1) | 0.5 | ||
| Fipronil-Sufone | 0.9973 | 0.9999 | 90.6 (4.6) | 70.8 (13.0) | 83.2 (17.2) | 0.5 | 0.9984 | 93.6 (8.6) | 90.2 (4.8) | 86.7 (14.9) | 0.5 | ||
| Fipronil-Sufoxide | 0.9997 | 0.9999 | 91.3 (7.4) | 70.2 (9.6) | 84.8 (15.1) | 0.5 | 0.9998 | 76.1 (14.9) | 83.1 (7.7) | 86.6 (12.1) | 0.5 | ||
| Buprofezin | 0.9998 | 0.9999 | 101.4 (5.2) | 84.5 (4.6) | 70.1 (7.7) | 85.9 (15.8) | 0.05 | 0.9998 | 95.2 (7.4) | 89.2 (0.2) | 87.8 (2.6) | 84.2 (13.9) | 0.05 |
| Hexaflumuron | 0.9984 | 0.9959 | 109.7 (17.4) | 97.5 (10.3) | 99.7 (14.8) | 0.5 | 0.9995 | 94.8 (9.4) | 76.9 (14.1) | 5.0 | |||
| Hydroxy Chlorothalonil | 0.9875 | 0.9948 | 83.7 (9.7) | 74.8 (10.6) | 5.0 | 0.9971 | 70.4 (4.1) | 82.1 (13.2) | 5.0 | ||||
| Tricyclazole | 0.9978 | 0.9999 | 103.0 (6.6) | 86.5 (4.0) | 75.1 (2.6) | 96.6 (10.0) | 0.05 | 0.9971 | 110.2 (4.6) | 91.5 (2.1) | 85.8 (3.8) | 87.8 (9.9) | 0.05 |
| Propiconazole | 0.9993 | 0.9999 | 94.8 (3.9) | 78.5 (6.2) | 90.6 (15.6) | 0.5 | 0.9991 | 84.5 (7.2) | 89.2 (3.1) | 82.9 (12.1) | 0.5 | ||
| Difenoconazole | 0.9995 | 0.9997 | 97.7 (6.3) | 104.2 (7.6) | 75.6 (6.1) | 88.0 (14.2) | 0.05 | 0.9997 | 108.8 (11.9) | 90.2 (3.8) | 86.6 (6.7) | 84.3 (12.6) | 0.05 |
| Triadimefon | 0.9997 | 0.9993 | 89.4 (3.4) | 87.3 (2.7) | 86.7 (13.6) | 0.5 | 0.9980 | 89.5 (4.0) | 80.5 (3.3) | 83.2 (13.4) | 0.5 | ||
| Hexaconazole | 0.9995 | 0.9999 | 90.4 (3.0) | 82.3 (5.4) | 96.0 (17.3) | 0.5 | 0.9989 | 85.2 (4.5) | 87.3 (2.7) | 78.4 (13.1) | 0.5 | ||
| Epoxiconazole | 0.9995 | 0.9999 | 97.7 (3.5) | 76.0 (10.9) | 97.2 (14.8) | 0.5 | 0.9992 | 92.5 (3.8) | 87.1 (3.3) | 84.6 (10.3) | 0.5 | ||
| Tebuconazole | 0.9995 | 0.9996 | 90.3 (4.2) | 81.6 (5.8) | 83.5 (19.8) | 0.5 | 0.9991 | 91.3 (1.2) | 86.5 (3.8) | 84.8 (13.7) | 0.5 | ||
| Carbendazim | 0.9951 | 0.9983 | 92.6 (7.6) | 65.3 (15.3) | 72.8 (9.1) | 84.7 (16.5) | 0.05 | 0.9995 | 101 (11.1) | 90.1 (18.2) | 91.6 (3.0) | 84.2 (8.3) | 0.05 |
| Procymidone | 0.9991 | 0.9975 | 81.9 (4.6) | 97.4 (2.0) | 5.0 | 0.9995 | 83.3 (10.6) | 92.7 (4.3) | 84.4 (14.7) | 0.5 | |||
| Azoxystrobin | 0.997 | 0.9999 | 85.7 (9.6) | 91.8 (2.8) | 93.1 (11.3) | 0.5 | 0.9995 | 101.3 (5.1) | 86.9 (3.1) | 90.2 (3.8) | 83.6 (19.0) | 0.05 | |
| Pyraclostrobine | 0.9945 | 0.9999 | 89.4 (8.3) | 84.4 (3.3) | 86.6 (4.8) | 84.9 (17.2) | 0.05 | 0.9999 | 89.2 (7.8) | 83.9 (14.3) | 82.8 (13.4) | 0.5 | |
| Pyrimethanil | 0.9986 | 0.9999 | 90.6 (3.2) | 80.6 (3.5) | 70.4 (6.7) | 99.1 (4.8) | 0.05 | 0.9991 | 107.5 (17.6) | 88.5 (2.9) | 88.4 (2.6) | 84.6 (15.5) | 0.05 |
| Isoprothiolane | 0.9982 | 0.9999 | 104.9 (9.5) | 94.0 (3.9) | 79.3 (6.2) | 87.5 (14.2) | 0.05 | 0.9986 | 93.1 (9.9) | 88.1 (1.9) | 88.6 (3.1) | 83.2 (13.0) | 0.05 |
| Alachlor | 0.9997 | 0.999 | 94.6 (17.5) | 62.3 (18.3) | 87.5 (14.3) | 0.5 | 0.9998 | 92.2 (15.8) | 84.9 (5.5) | 85.9 (12.5) | 0.5 | ||
| Acetochlor | 0.9971 | 0.9966 | 97.5 (8.2) | 92.3 (1.6) | 107.3 (5.5) | 0.5 | 0.9989 | 81.2 (5.1) | 87.2 (3.5) | 82.8 (14.2) | 0.5 | ||
| Bensulfuron methyl | 0.9993 | 0.9998 | 105.7 (4.2) | 89.9 (4.5) | 88.5 (18.1) | 84.8 (6.2) | 0.05 | 0.9998 | 94.2 (13.1) | 85.4 (3.7) | 85.2 (3.1) | 82.8 (2.9) | 0.05 |
| Pyrazosulfuron-ethyl | 0.9981 | 0.9999 | 86.8 (3.3) | 63.9 (16.7) | 89.3 (13.8) | 0.5 | 0.9986 | 91.6 (4.0) | 89.2 (3.4) | 78.3 (13.4) | 0.5 | ||
| Tribenuron-methyl | 0.993 | 0.9998 | 75.2 (4.9) | 65.0 (3.5) | 85.6 (17.9) | 0.5 | 0.9998 | 80.2 (11.1) | 73.2 (4.1) | 83.0 (12.7) | 0.5 | ||
| Atrazine | 0.9993 | 0.9999 | 89.9 (4.9) | 74.9 (6.1) | 84.5 (15.0) | 0.5 | 0.9992 | 95.6 (5.4) | 88.6 (1.6) | 87.8 (3.1) | 80.6 (14.1) | 0.05 | |
| Desethylatrazine | 0.9989 | 0.9997 | 91.0 (3.5) | 81.5 (2.1) | 86.5 (16.2) | 0.5 | 0.9999 | 96.2 (16.5) | 89.5 (3.7) | 84.7 (5.4) | 83.7 (12.6) | 0.05 | |
| Desisopropylatrazine | 0.998 | 0.9977 | 79.7 (14.1) | 71.7 (5.2) | 98.0 (15.3) | 0.5 | 0.9995 | 82.2 (10.7) | 83.4 (3.8) | 81.1 (15.1) | 0.5 | ||
| Hydroxyatrazine | 0.998 | 0.9992 | 70.5 (6.4) | 61.9 (2.8) | 95.6 (6.9) | 0.5 | 0.9990 | 89.5 (16.5) | 64.2 (10.1) | 68.2 (10.4) | 83.1 (13.8) | 0.05 | |
| Pendimethalin | 0.9994 | 0.9988 | 109.0 (9.6) | 71.8 (5.7) | 96.3 (9.6) | 0.5 | 0.9999 | 81.5 (15.8) | 91.5 (4.8) | 85.0 (11.6) | 0.5 | ||
| Clomazone | 0.9986 | 0.9999 | 99.5 (10.9) | 88.1 (4.7) | 79.2 (3.9) | 87.9 (12.1) | 0.05 | 0.9997 | 107 (12.4) | 84.5 (5.0) | 85.5 (3.0) | 83.9 (2.4) | 0.05 |
| Propargite | 0.9979 | 0.9924 | 79.3 (13.9) | 62.9 (12.6) | 92.6 (14.8) | 0.50 | 0.9997 | 76.8 (8.7) | 92.0 (11.4) | 5.0 | |||
| Pyridaben | 0.9907 | 0.9989 | 84.7 (17.1) | 68.8 (19.8) | 60.3 (13.4) | 104.4 (8.8) | 0.05 | 0.9993 | 115.8 (7.7) | 88.2 (8.7) | 82.9 (9.0) | 88.7 (17.8) | 0.05 |
| Paclobutrazol | 0.9998 | 0.9999 | 92.6 (19.4) | 92.9 (5.3) | 89.5 (2.2) | 83.7 (4.8) | 0.05 | 0.9995 | 98.8 (11.3) | 85.6 (5.2) | 88.2 (2.7) | 84.5 (17.6) | 0.05 |
| Forchlorfenuron | 0.9954 | 0.9999 | 95.5 (7.1) | 79.4 (3.2) | 73.0 (3.3) | 100.8 (16.9) | 0.05 | 0.9949 | 76.5 (4.5) | 74.2 (1.8) | 77.4 (2.8) | 84.4 (12.9) | 0.05 |
| Carbaryl | 0.9951 | 0.9999 | 82.1 (4.9) | 86.9 (5.8) | 88.9 (12.1) | 0.5 | 0.9976 | 68.5 (4.4) | 86.1 (3.1) | 88.0 (13.3) | 0.5 | ||
| Indoxacarb | 0.9995 | 0.9998 | 99.7 (6.0) | 60.7 (10.3) | 98.3 (17.9) | 0.5 | 0.9995 | 90.2 (7.7) | 95.9 (4.0) | 78.0 (12.8) | 0.5 | ||
| Dinotefuran | 0.998 | 0.9987 | 98.2 (19.4) | 74.9 (3.4) | 84.6 (17.3) | 0.5 | 0.9999 | 76.1 (17.8) | 70.5 (5.7) | 82.5 (13.9) | 0.5 | ||
| Emamectin-benzoate b1a | 0.9996 | 0.9997 | 99.2 (18.2) | 72.8 (10.3) | 96.0 (14.0) | 0.5 | 0.9999 | 79.2 (6.5) | 70.2 (5.8) | 84.6 (14.6) | 0.5 | ||
| Emamectin-benzoate b1b | 0.9983 | 0.9992 | 91.6 (10.5) | 77.3 (8.7) | 90.6 (14.2) | 0.5 | 0.9993 | 74.6 (6.3) | 82.6 (12.2) | 5.0 | |||
| Methoxyfenozide | 0.9993 | 0.9999 | 94.2 (12.8) | 82.1 (3.4) | 90.2 (3.8) | 0.5 | 0.9991 | 92.3 (1.8) | 90.7 (3.4) | 75.2 (16.8) | 0.5 | ||
| Prothioconazole | 0.9995 | 0.9933 | 82.8 (9.1) | 84 (17.4) | 5.0 | 0.9997 | 80.9 (6.2) | 84.5 (11.5) | 5.0 | ||||
| Ametoctradin | 0.9996 | 0.9999 | 88.4 (3.3) | 73.5 (4.8) | 103.5 (8.9) | 0.5 | 0.9997 | 85.6 (3.5) | 87.8 (2.9) | 113.4 (13.6) | 0.5 | ||
| Boscalid | 0.9901 | 0.9947 | 72.7 (17.3) | 101.4 (8.8) | 5.0 | 0.9933 | 83.5 (7.4) | 85.9 (3.1) | 83.6 (12.3) | 0.5 | |||
| Flutolanil | 0.9975 | 0.9999 | 92.8 (4.2) | 85.7 (3.6) | 90.5 (10.1) | 0.5 | 0.9996 | 82.6 (5.5) | 86.9 (2.0) | 86.3 (10.4) | 0.5 | ||
| Fomesafen | 0.9992 | 0.9991 | 105.4 (13.2) | 62.2 (19.1) | 99.8 (15.5) | 0.5 | 0.9995 | 92.1 (4.4) | 83.3 (12.8) | 5.0 | |||
| Prometryn | 0.9997 | 0.9999 | 103.6 (6.4) | 86.4 (3.9) | 72.6 (8.5) | 91.9 (7.6) | 0.05 | 0.9998 | 93.4 (7.5) | 87.2 (1.1) | 87.7 (3.2) | 84.9 (16.3) | 0.05 |
| Imazethapyr | 0.9997 | 0.9998 | 76.8 (4.3) | 66.8 (3.3) | 97.1 (5.5) | 0.5 | 0.9981 | 60.9 (8.0) | 61.8 (5.4) | 82.2 (13.9) | 0.5 | ||
| Nicosulfuron | 0.9994 | 0.9998 | 105.7 (4.2) | 89.8 (3.6) | 87.7 (6.5) | 85.3 (14.6) | 0.05 | 0.9998 | 94.2 (13.1) | 85.2 (3.7) | 86.0 (2.6) | 83.1 (13.6) | 0.05 |
| Sulfometuron-methyl | 0.9989 | 0.9999 | 87.1 (3.4) | 82.6 (1.8) | 89.3 (13.8) | 0.5 | 0.9994 | 112 (14.9) | 82.1 (1.4) | 84.9 (3.6) | 97.4 (13.4) | 0.05 | |
| Mesotrione | 0.9919 | 0.995 | 60.3 (16.9) | 75.6 (6.8) | 100 (13.3) | 0.5 | 0.9839 | 62.5 (5.6) | 63.3 (8.2) | 82.2 (13.6) | 0.5 | ||
| Diuron | 0.9948 | 0.9999 | 80.7 (5.6) | 73.3 (10.5) | 76.5 (15.6) | 0.5 | 0.9939 | 108.5 (7.2) | 87.6 (1.1) | 88.7 (2.9) | 81.1 (12.8) | 0.05 | |
| Quinclorac | 0.9996 | 0.9993 | 50.4 (15.3) | 52.5 (2.6) | 88.9 (12.3) | 0.5 | 0.9974 | 75.7 (11.7) | 77.2 (5.9) | 87.9 (10.5) | 0.5 | ||
| Pretilachlor | 0.9988 | 0.9982 | 100.2 (8.1) | 84.8 (3.7) | 87.6 (3.5) | 98.4 (13.2) | 0.05 | 0.9990 | 105.4 (10.8) | 88.2 (3.4) | 87.9 (2.1) | 75.5 (12.8) | 0.05 |
| Metolachlor | 0.9983 | 0.9998 | 105.0 (4.6) | 87.5 (2.2) | 71.1 (11.8) | 85.3 (17.5) | 0.05 | 0.9996 | 118.6 (9.1) | 90.1 (3.8) | 88.8 (2.8) | 84.3 (12.7) | 0.05 |
| Flumetsulam | 0.9938 | 0.9999 | 100.3 (9.2) | 89.3 (4.5) | 77.5 (4.9) | 86.4 (16.5) | 0.05 | 0.9864 | 97.7 (6.8) | 82.4 (4.7) | 83.2 (4.4) | 85.9 (8.3) | 0.05 |
| Penoxsulam | 0.9972 | 0.9999 | 104.5 (6.3) | 93.3 (1.7) | 83.8 (3.1) | 88.7 (13.1) | 0.05 | 0.9990 | 109.9 (7.6) | 91.8 (2.3) | 89.6 (4.1) | 86.0 (10.5) | 0.05 |
| Saflufenacil | 0.9991 | 0.9992 | 86.9 (4.2) | 70.6 (14.6) | 100.3 (16.7) | 0.5 | 0.9995 | 85.2 (1.6) | 91.9 (4.9) | 98.9 (12.5) | 0.5 | ||
Disclaimer/Publisher’s Note: The statements, opinions and data contained in all publications are solely those of the individual author(s) and contributor(s) and not of MDPI and/or the editor(s). MDPI and/or the editor(s) disclaim responsibility for any injury to people or property resulting from any ideas, methods, instructions or products referred to in the content. |
© 2023 by the authors. Licensee MDPI, Basel, Switzerland. This article is an open access article distributed under the terms and conditions of the Creative Commons Attribution (CC BY) license (https://creativecommons.org/licenses/by/4.0/).
Share and Cite
Guo, Y.; Xie, J.; Dong, F.; Wu, X.; Pan, X.; Liu, X.; Zheng, Y.; Zhang, J.; Xu, J. Highly-Selective Analytical Strategy for 90 Pesticides and Metabolites Residues in Fish and Shrimp Samples. Molecules 2023, 28, 4235. https://doi.org/10.3390/molecules28104235
Guo Y, Xie J, Dong F, Wu X, Pan X, Liu X, Zheng Y, Zhang J, Xu J. Highly-Selective Analytical Strategy for 90 Pesticides and Metabolites Residues in Fish and Shrimp Samples. Molecules. 2023; 28(10):4235. https://doi.org/10.3390/molecules28104235
Chicago/Turabian StyleGuo, Yage, Jun Xie, Fengshou Dong, Xiaohu Wu, Xinglu Pan, Xingang Liu, Yongquan Zheng, Jie Zhang, and Jun Xu. 2023. "Highly-Selective Analytical Strategy for 90 Pesticides and Metabolites Residues in Fish and Shrimp Samples" Molecules 28, no. 10: 4235. https://doi.org/10.3390/molecules28104235