
Head-to-Tail and Head-to-Head Molecular Chains of Poly(p-Anisidine): Combined Experimental and Theoretical Evaluation

 , , ,
, , ,  , ,
, ,  , , , and
Abstract
:1. Introduction
2. Materials and Methods
2.1. Polymer Synthesis
2.2. XRD Analysis and Percentage of Crystallinity
2.3. SEM Analysis
Multifractal Analysis
2.4. 13C NMR Spectroscopy
2.5. Computational Method
2.6. FTIR Analysis
2.7. Electrical Conductivity
3. Results and Discussion
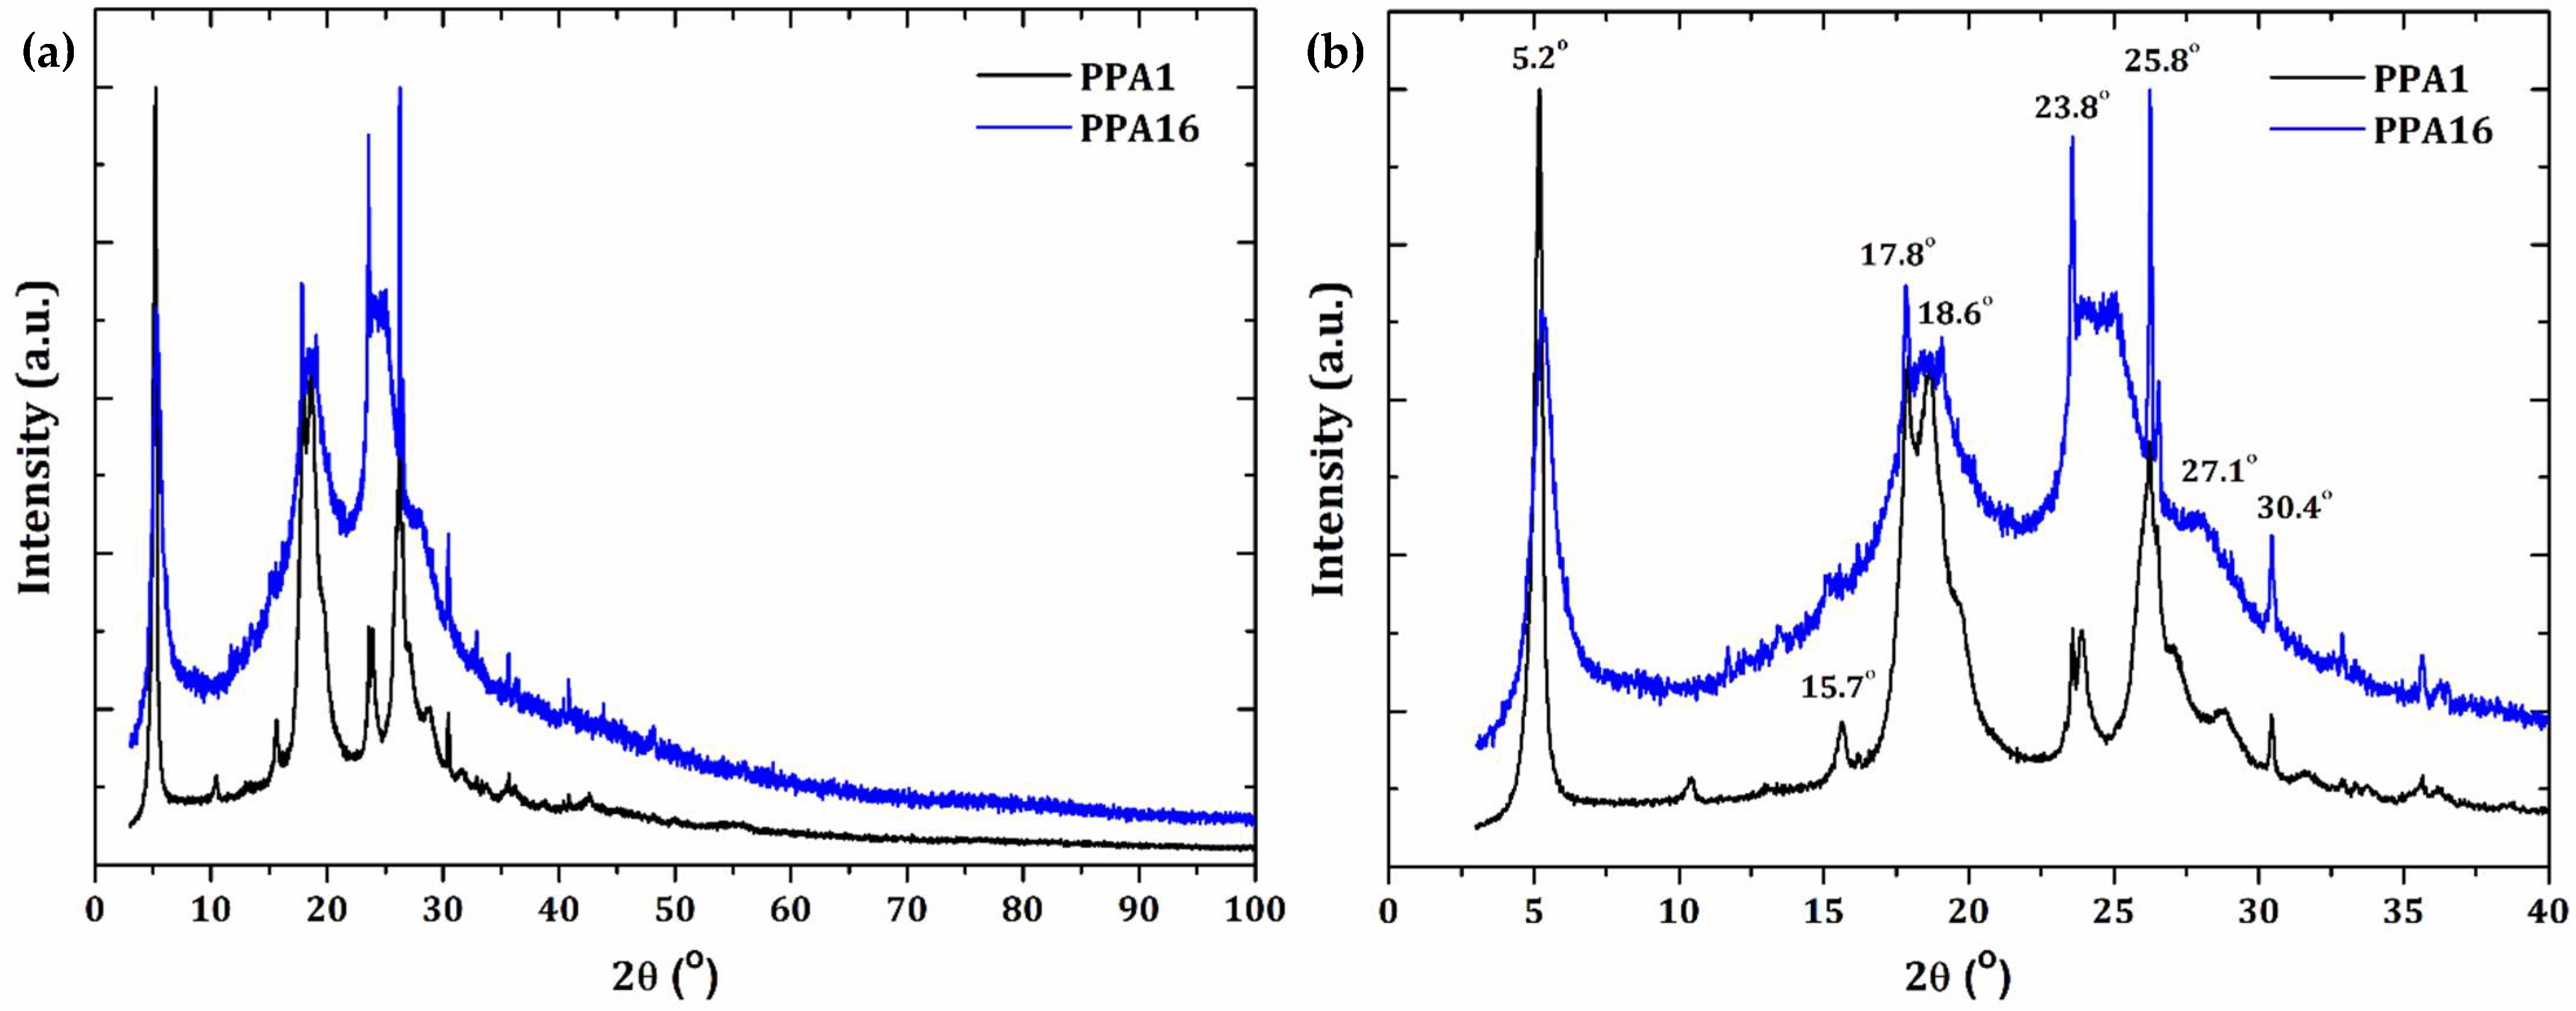
3.1. Percentage of Crystallinity and XRD Analysis
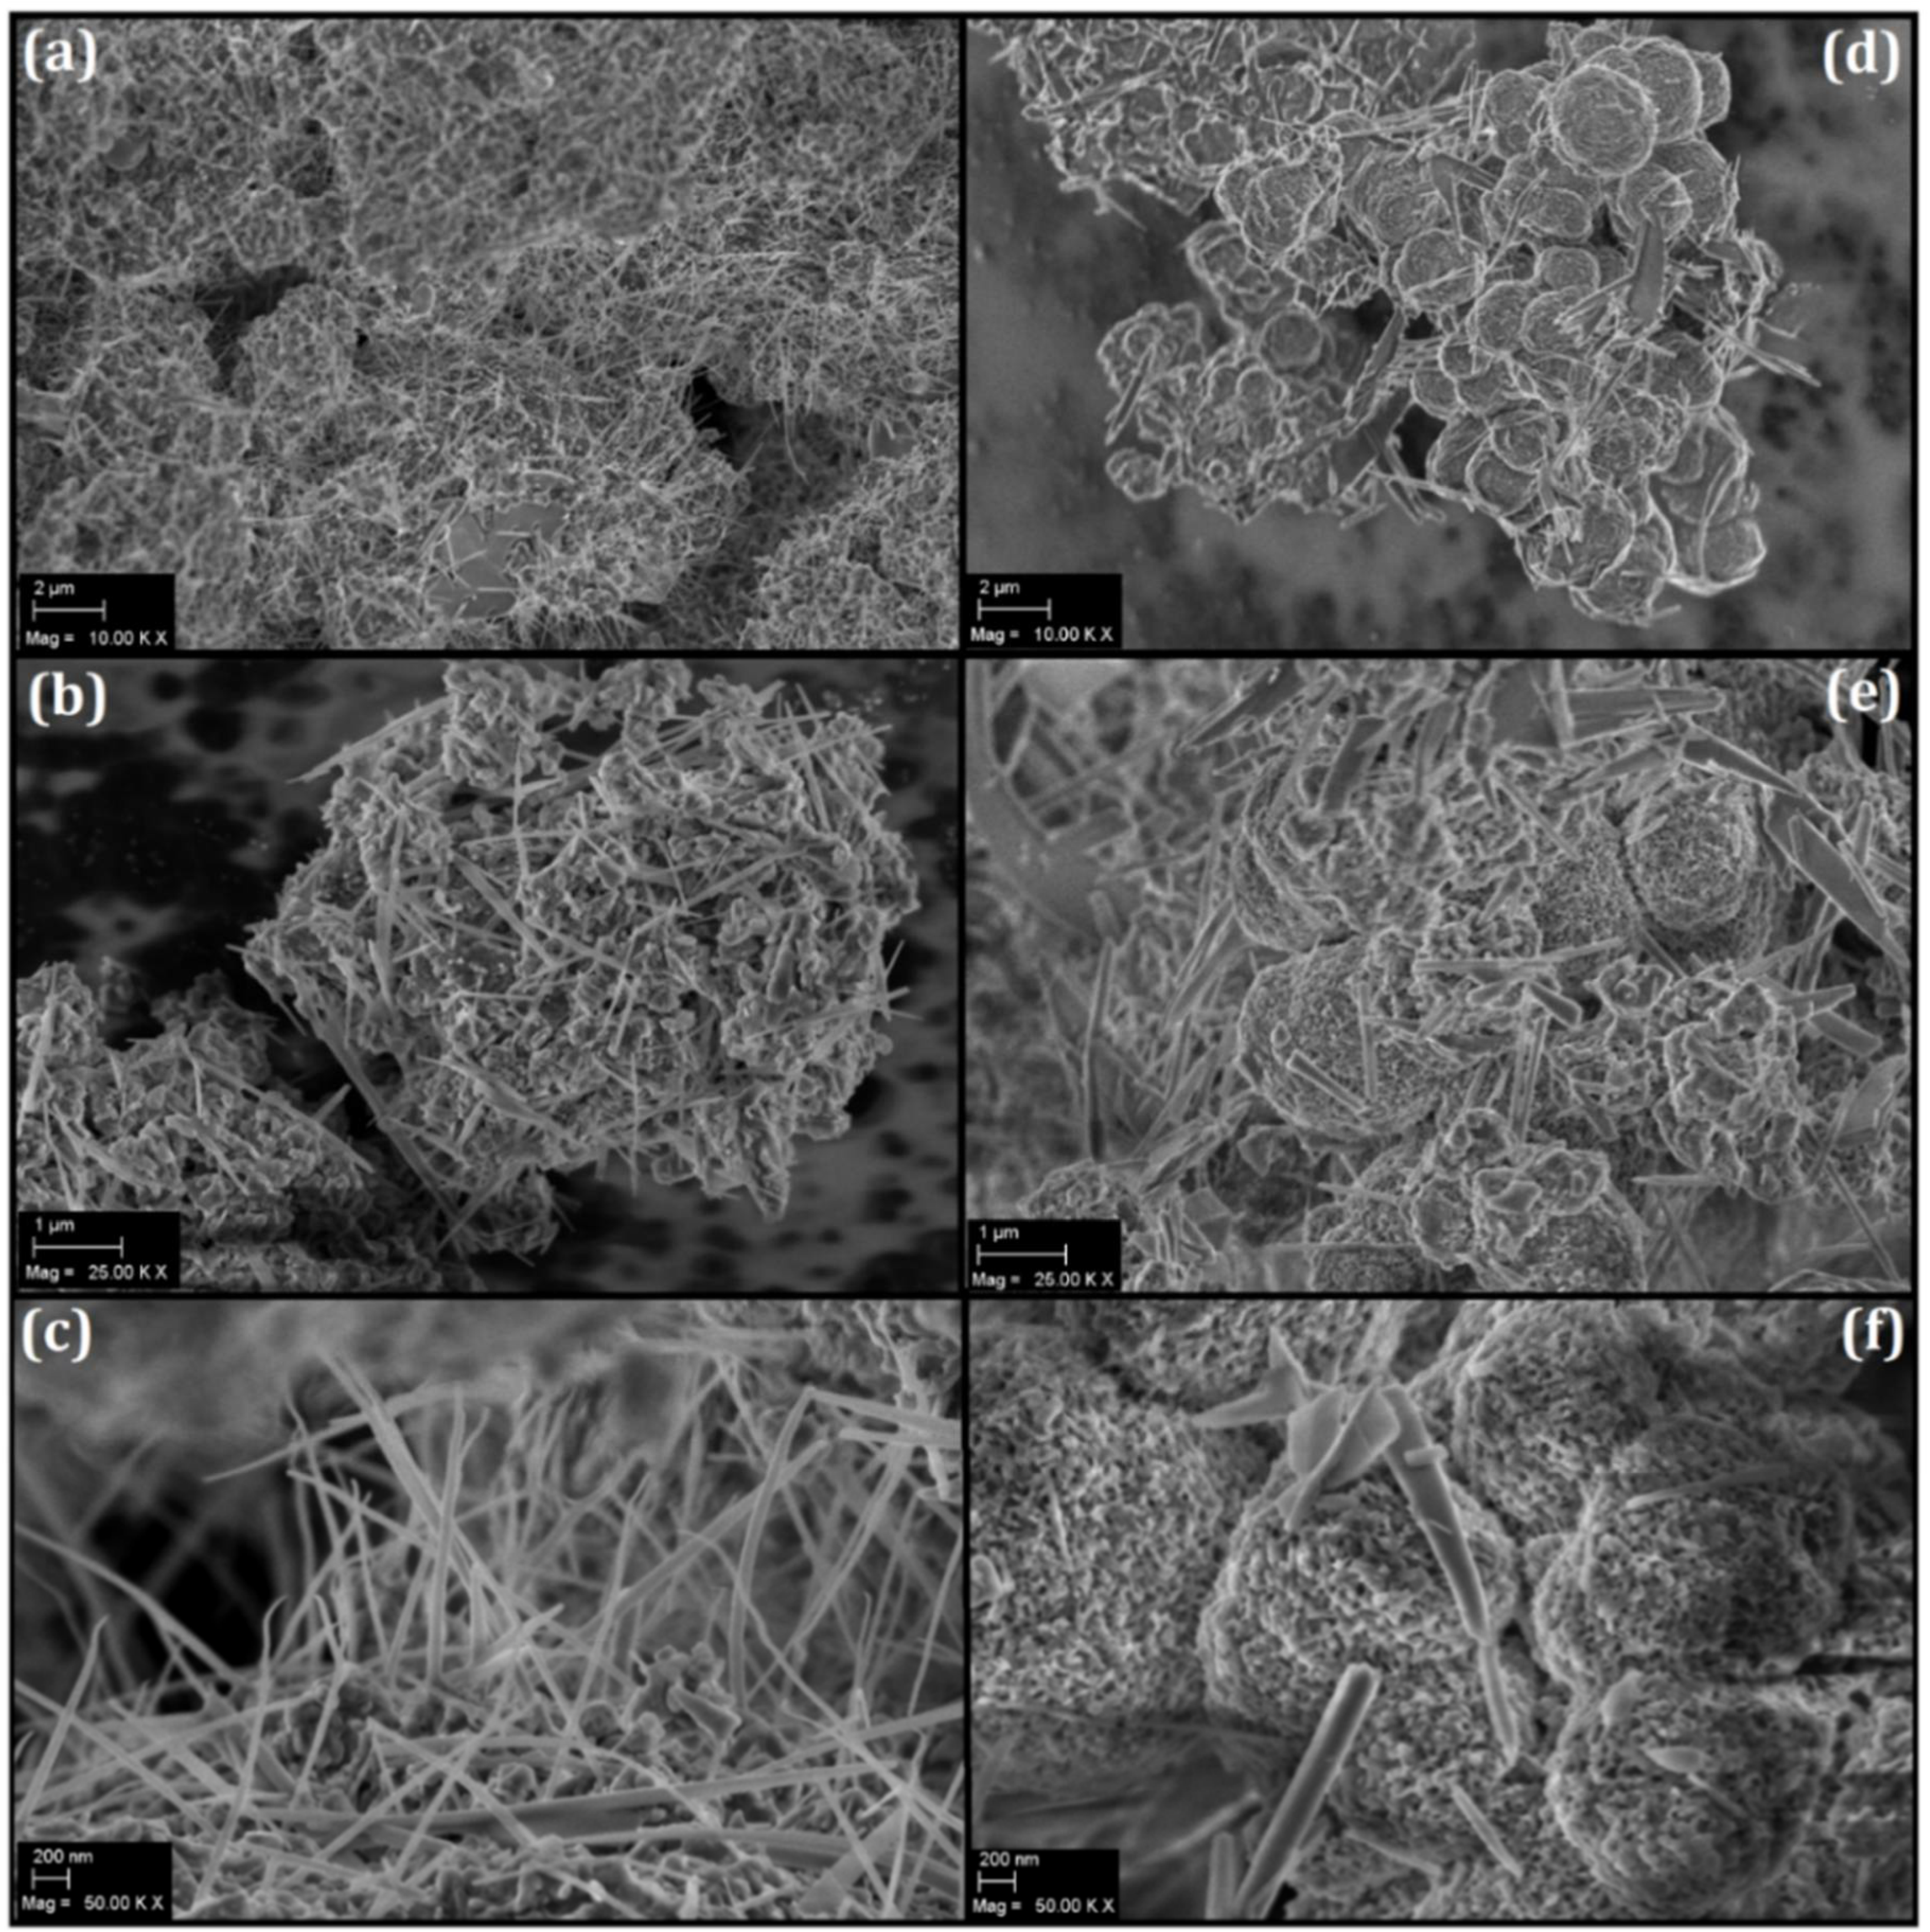
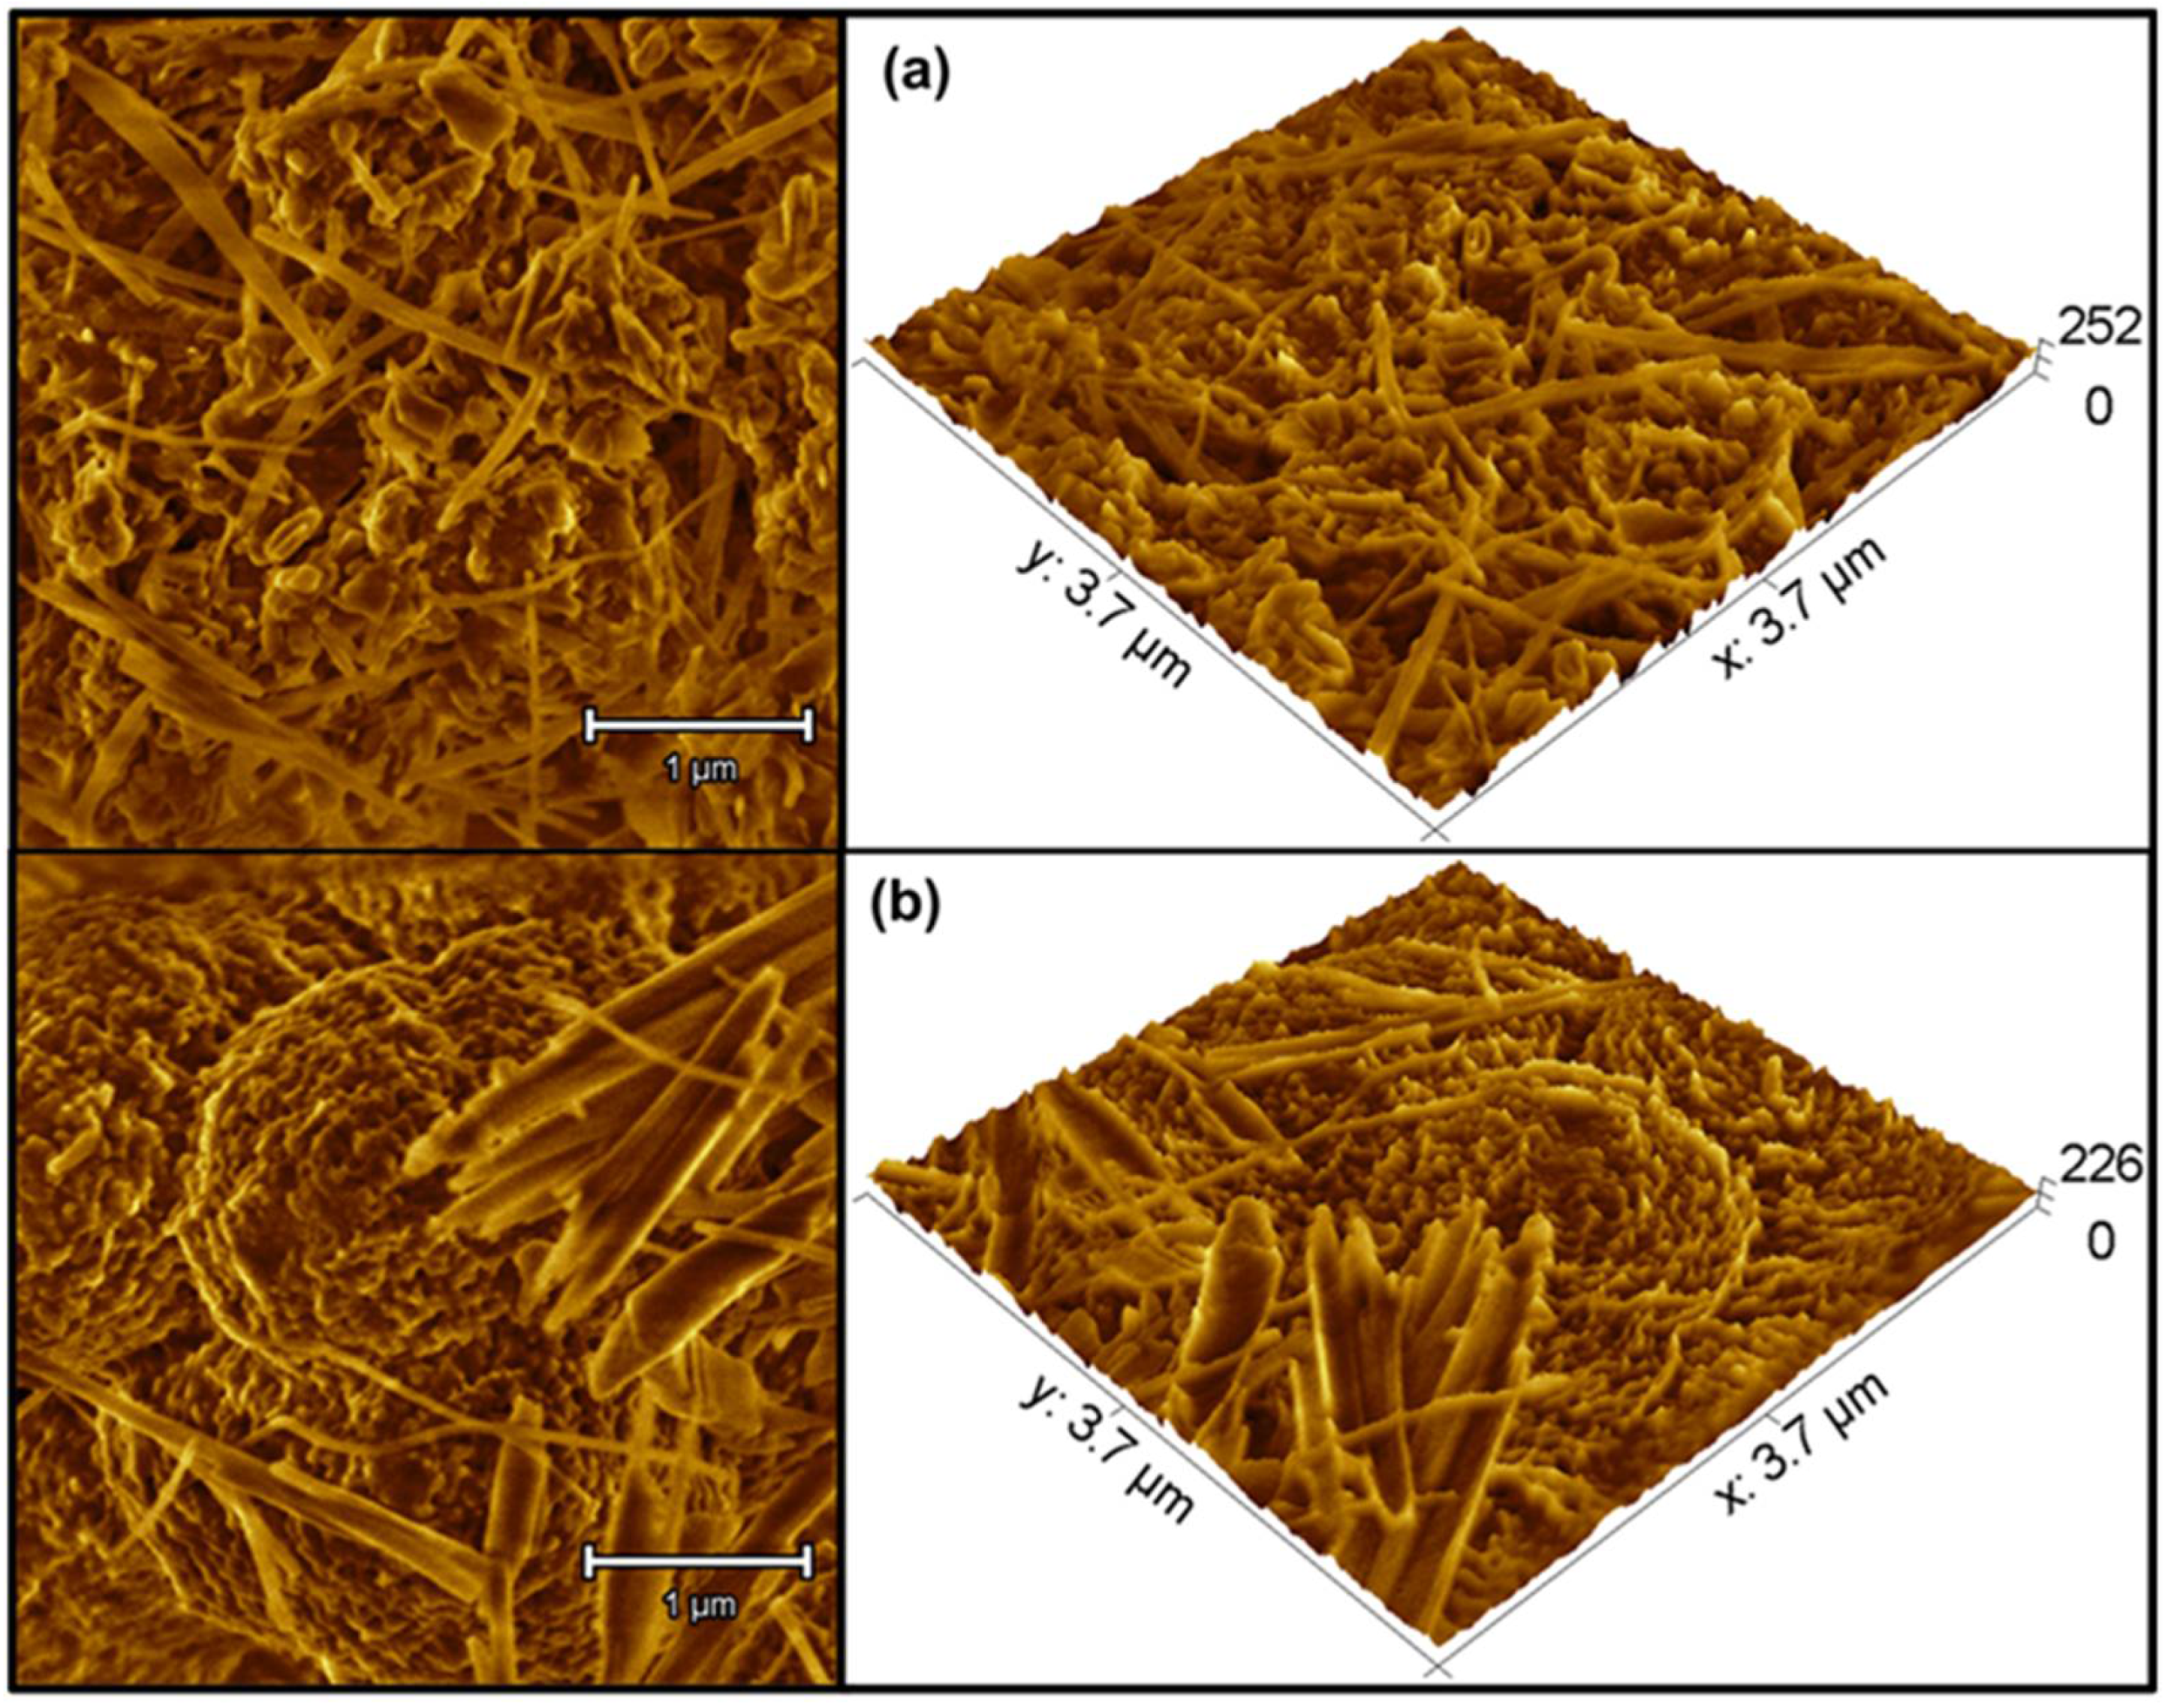
3.2. Morphological Evaluation
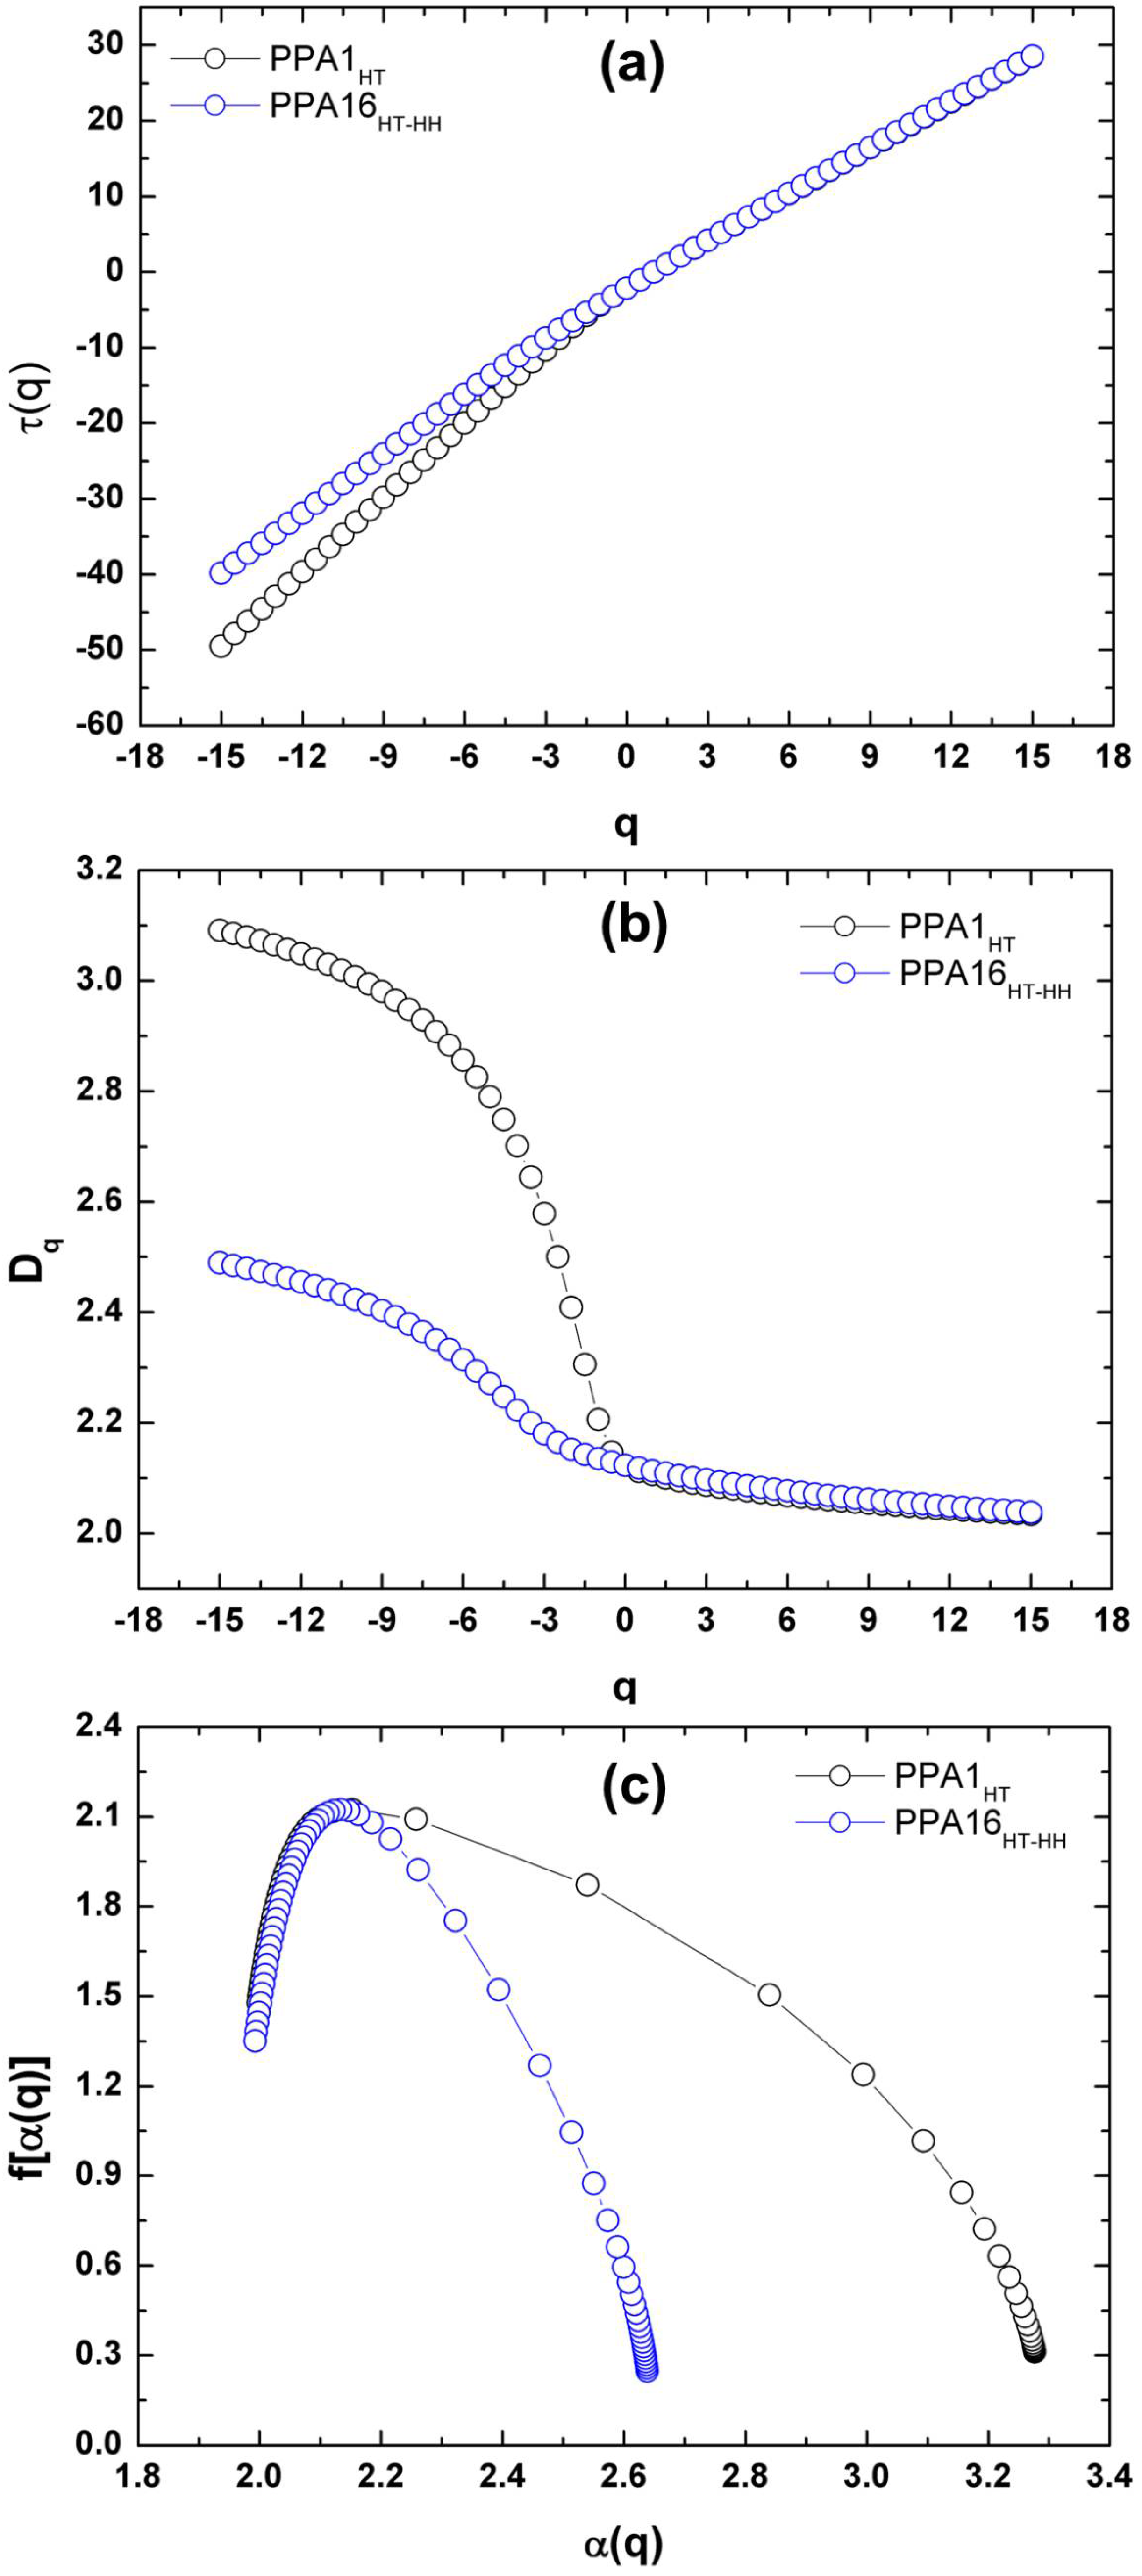
Multifractal Analysis
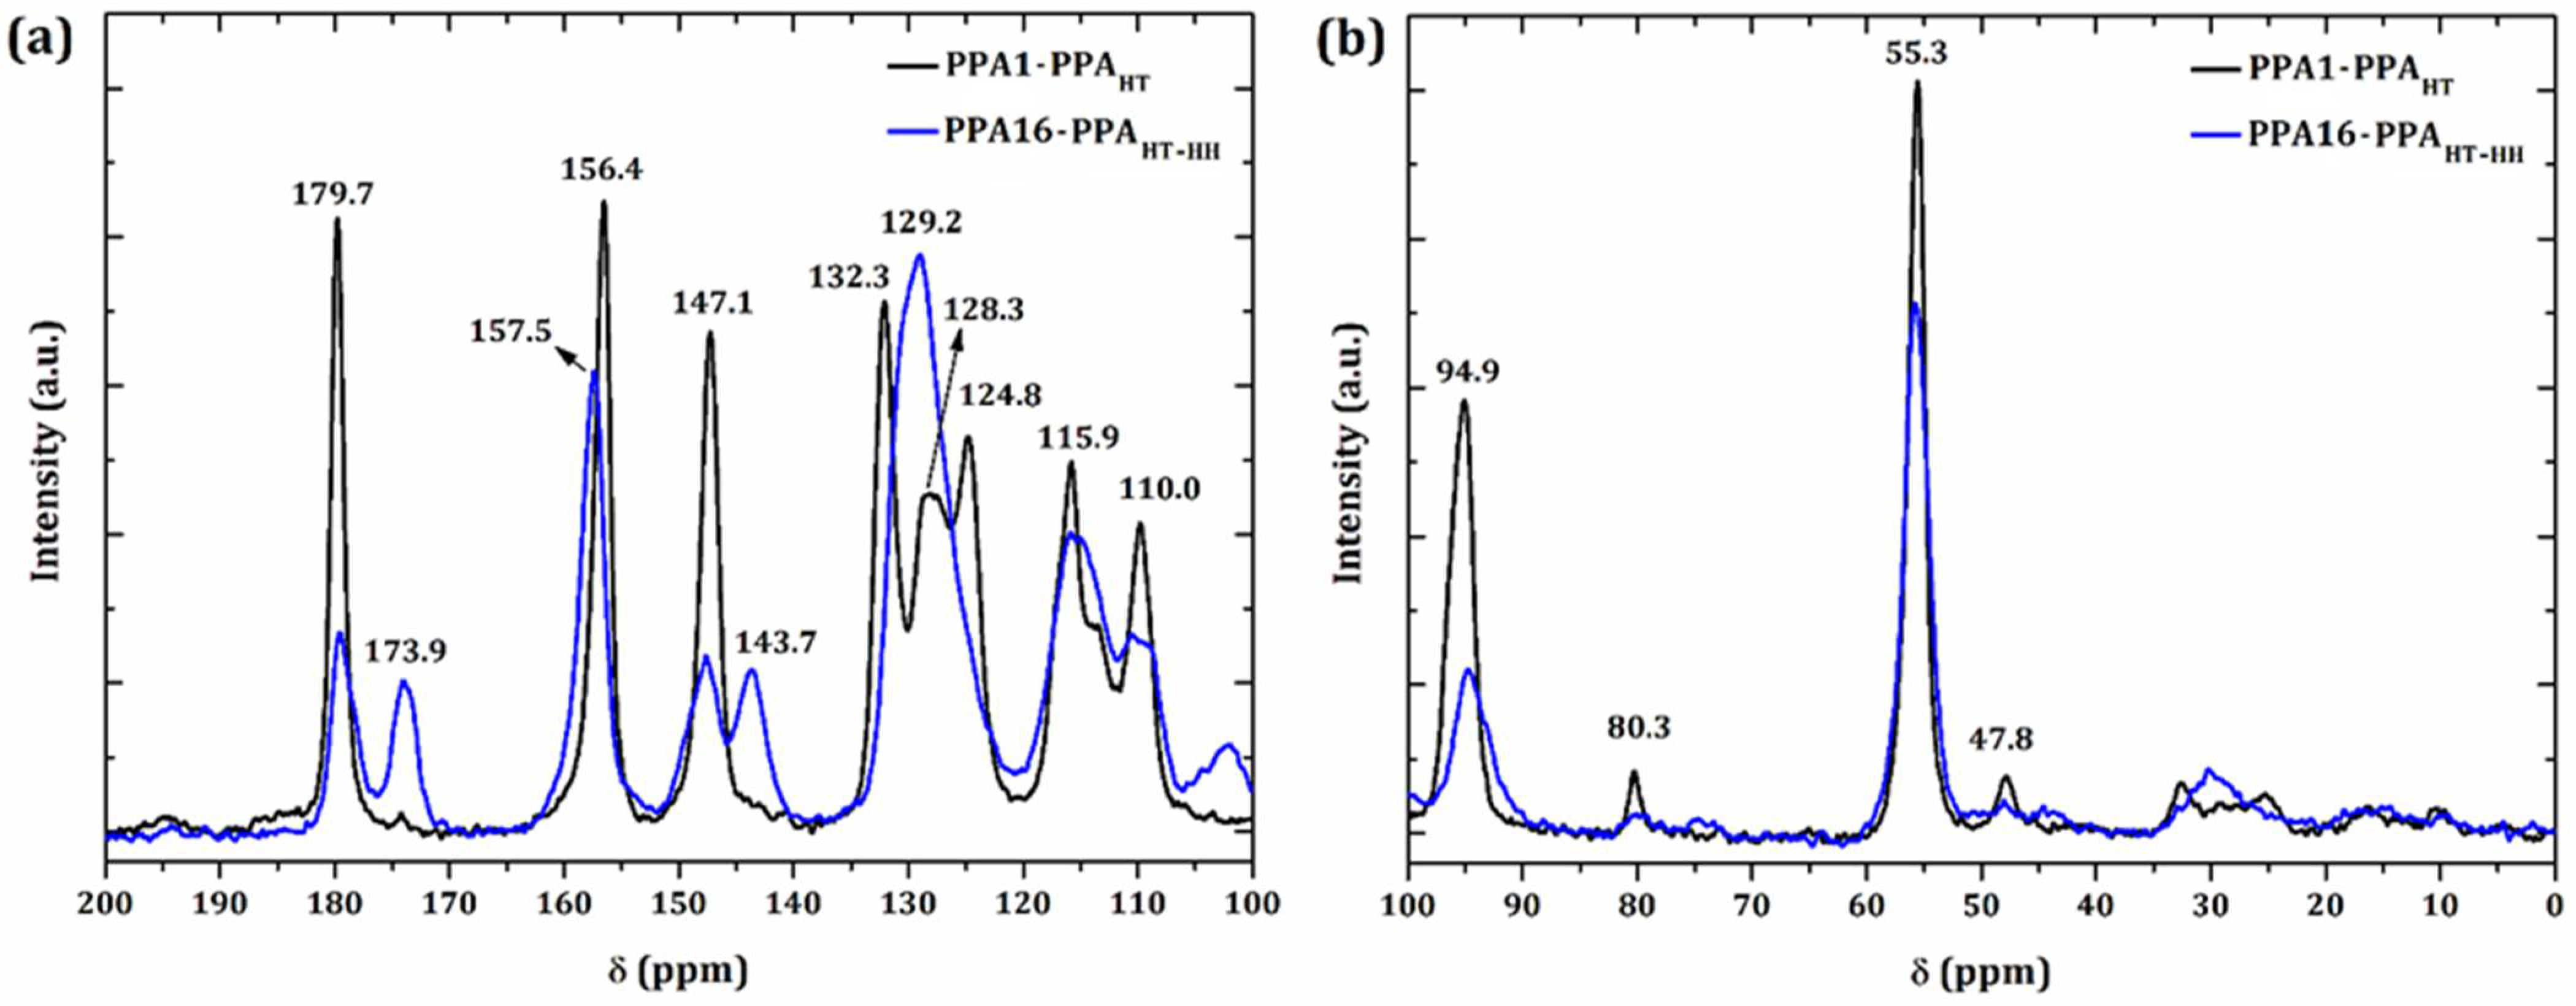
3.3. 13C NMR Spectroscopy
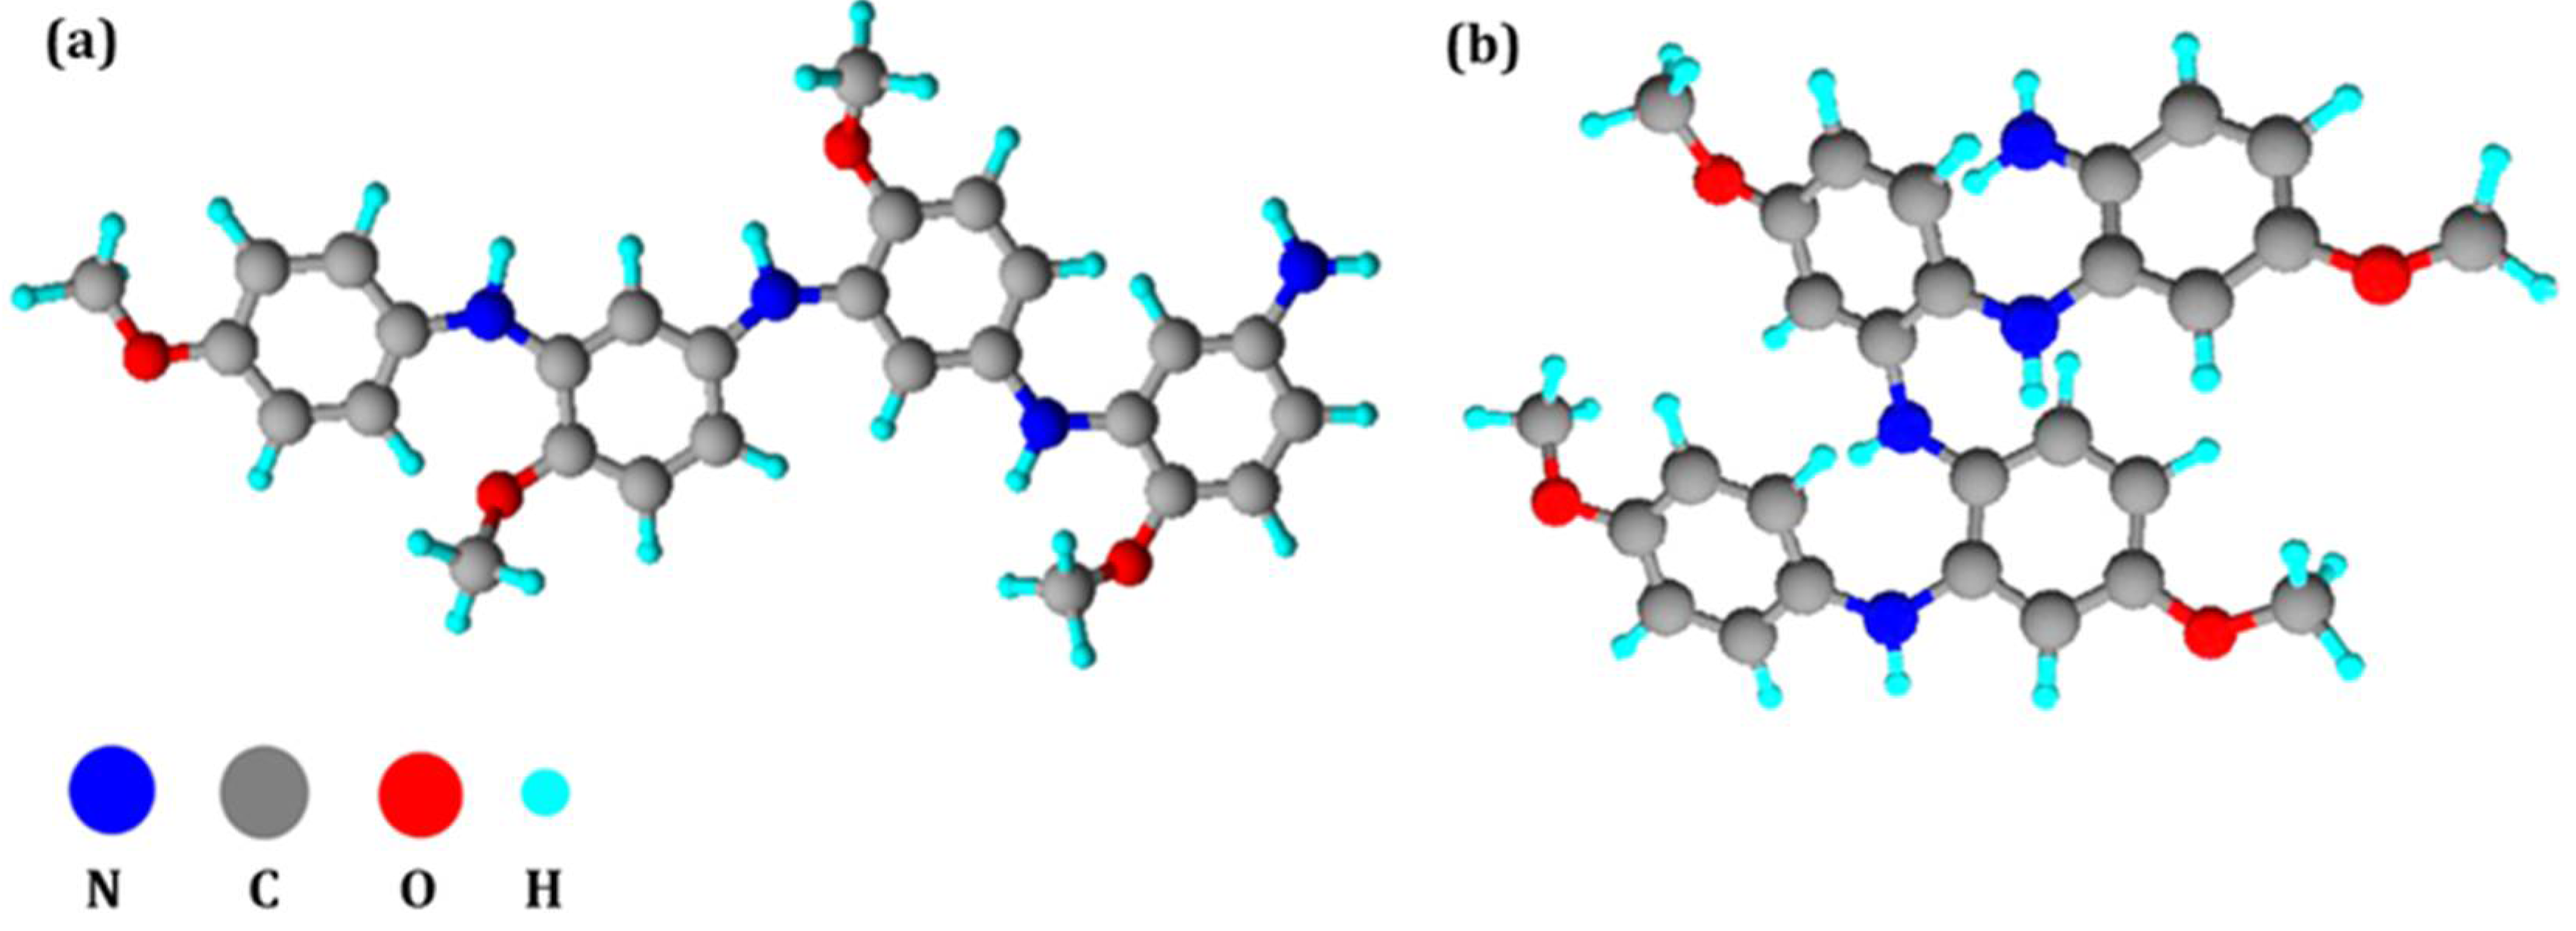
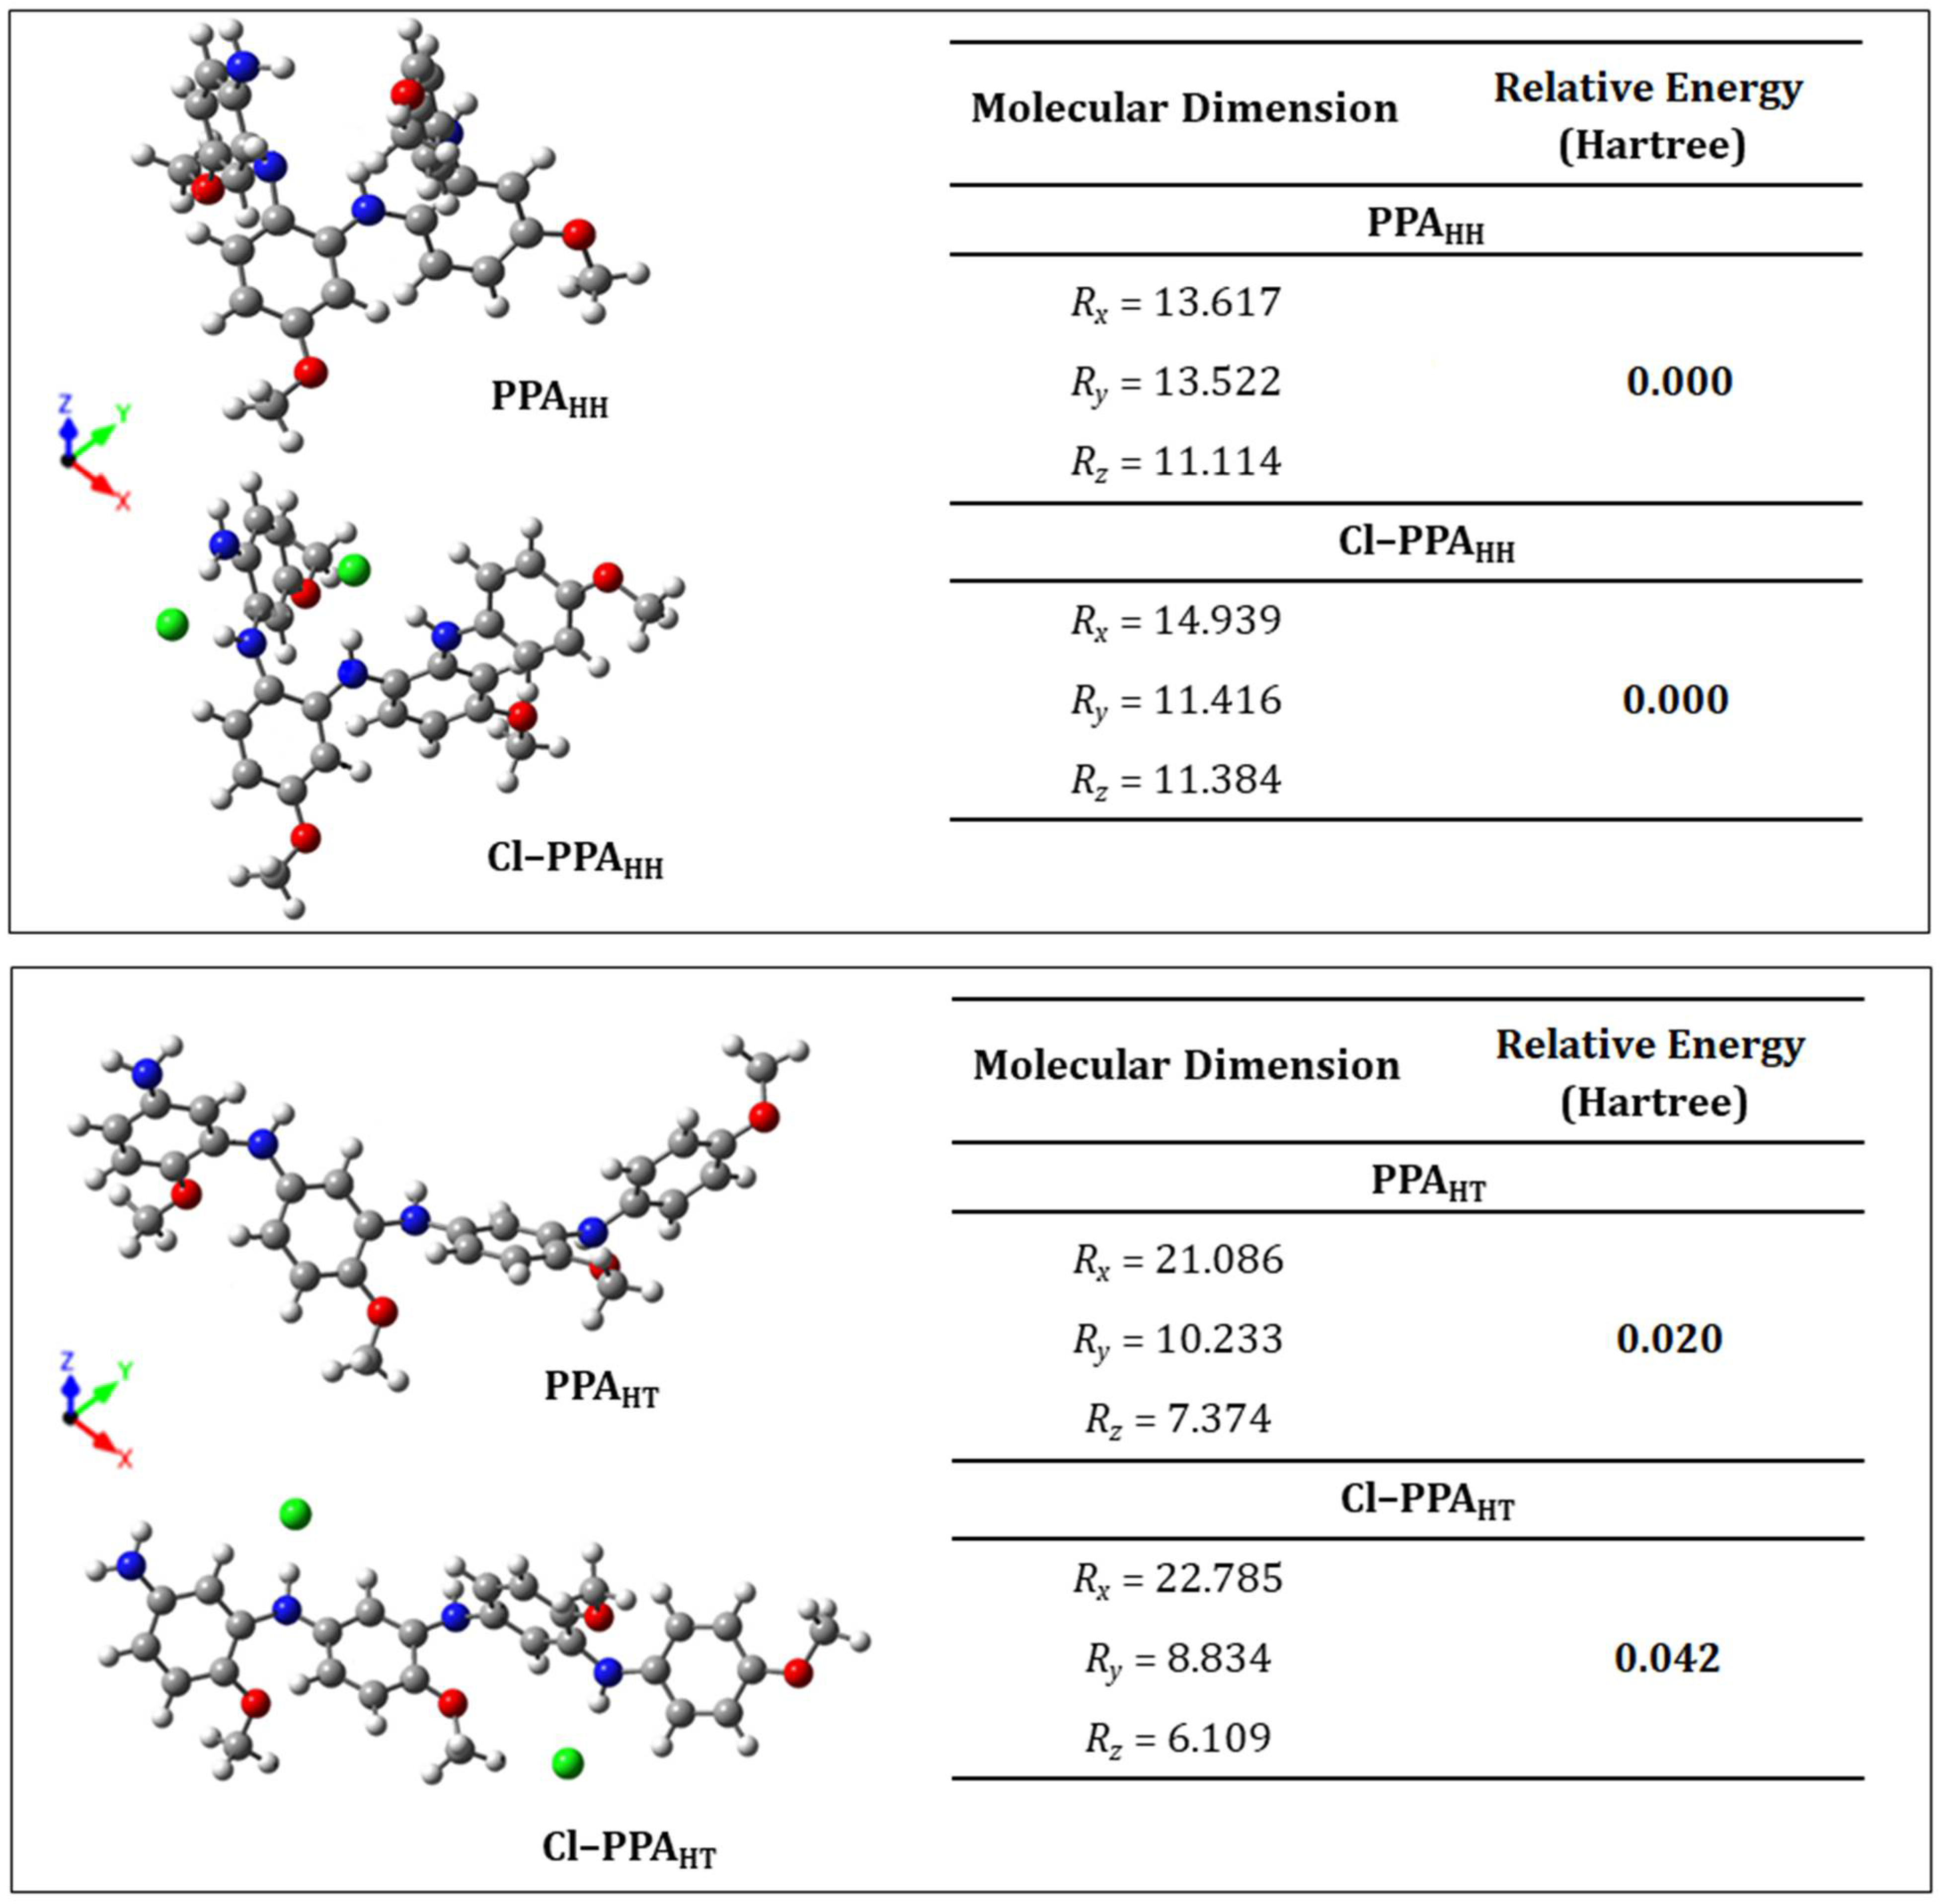
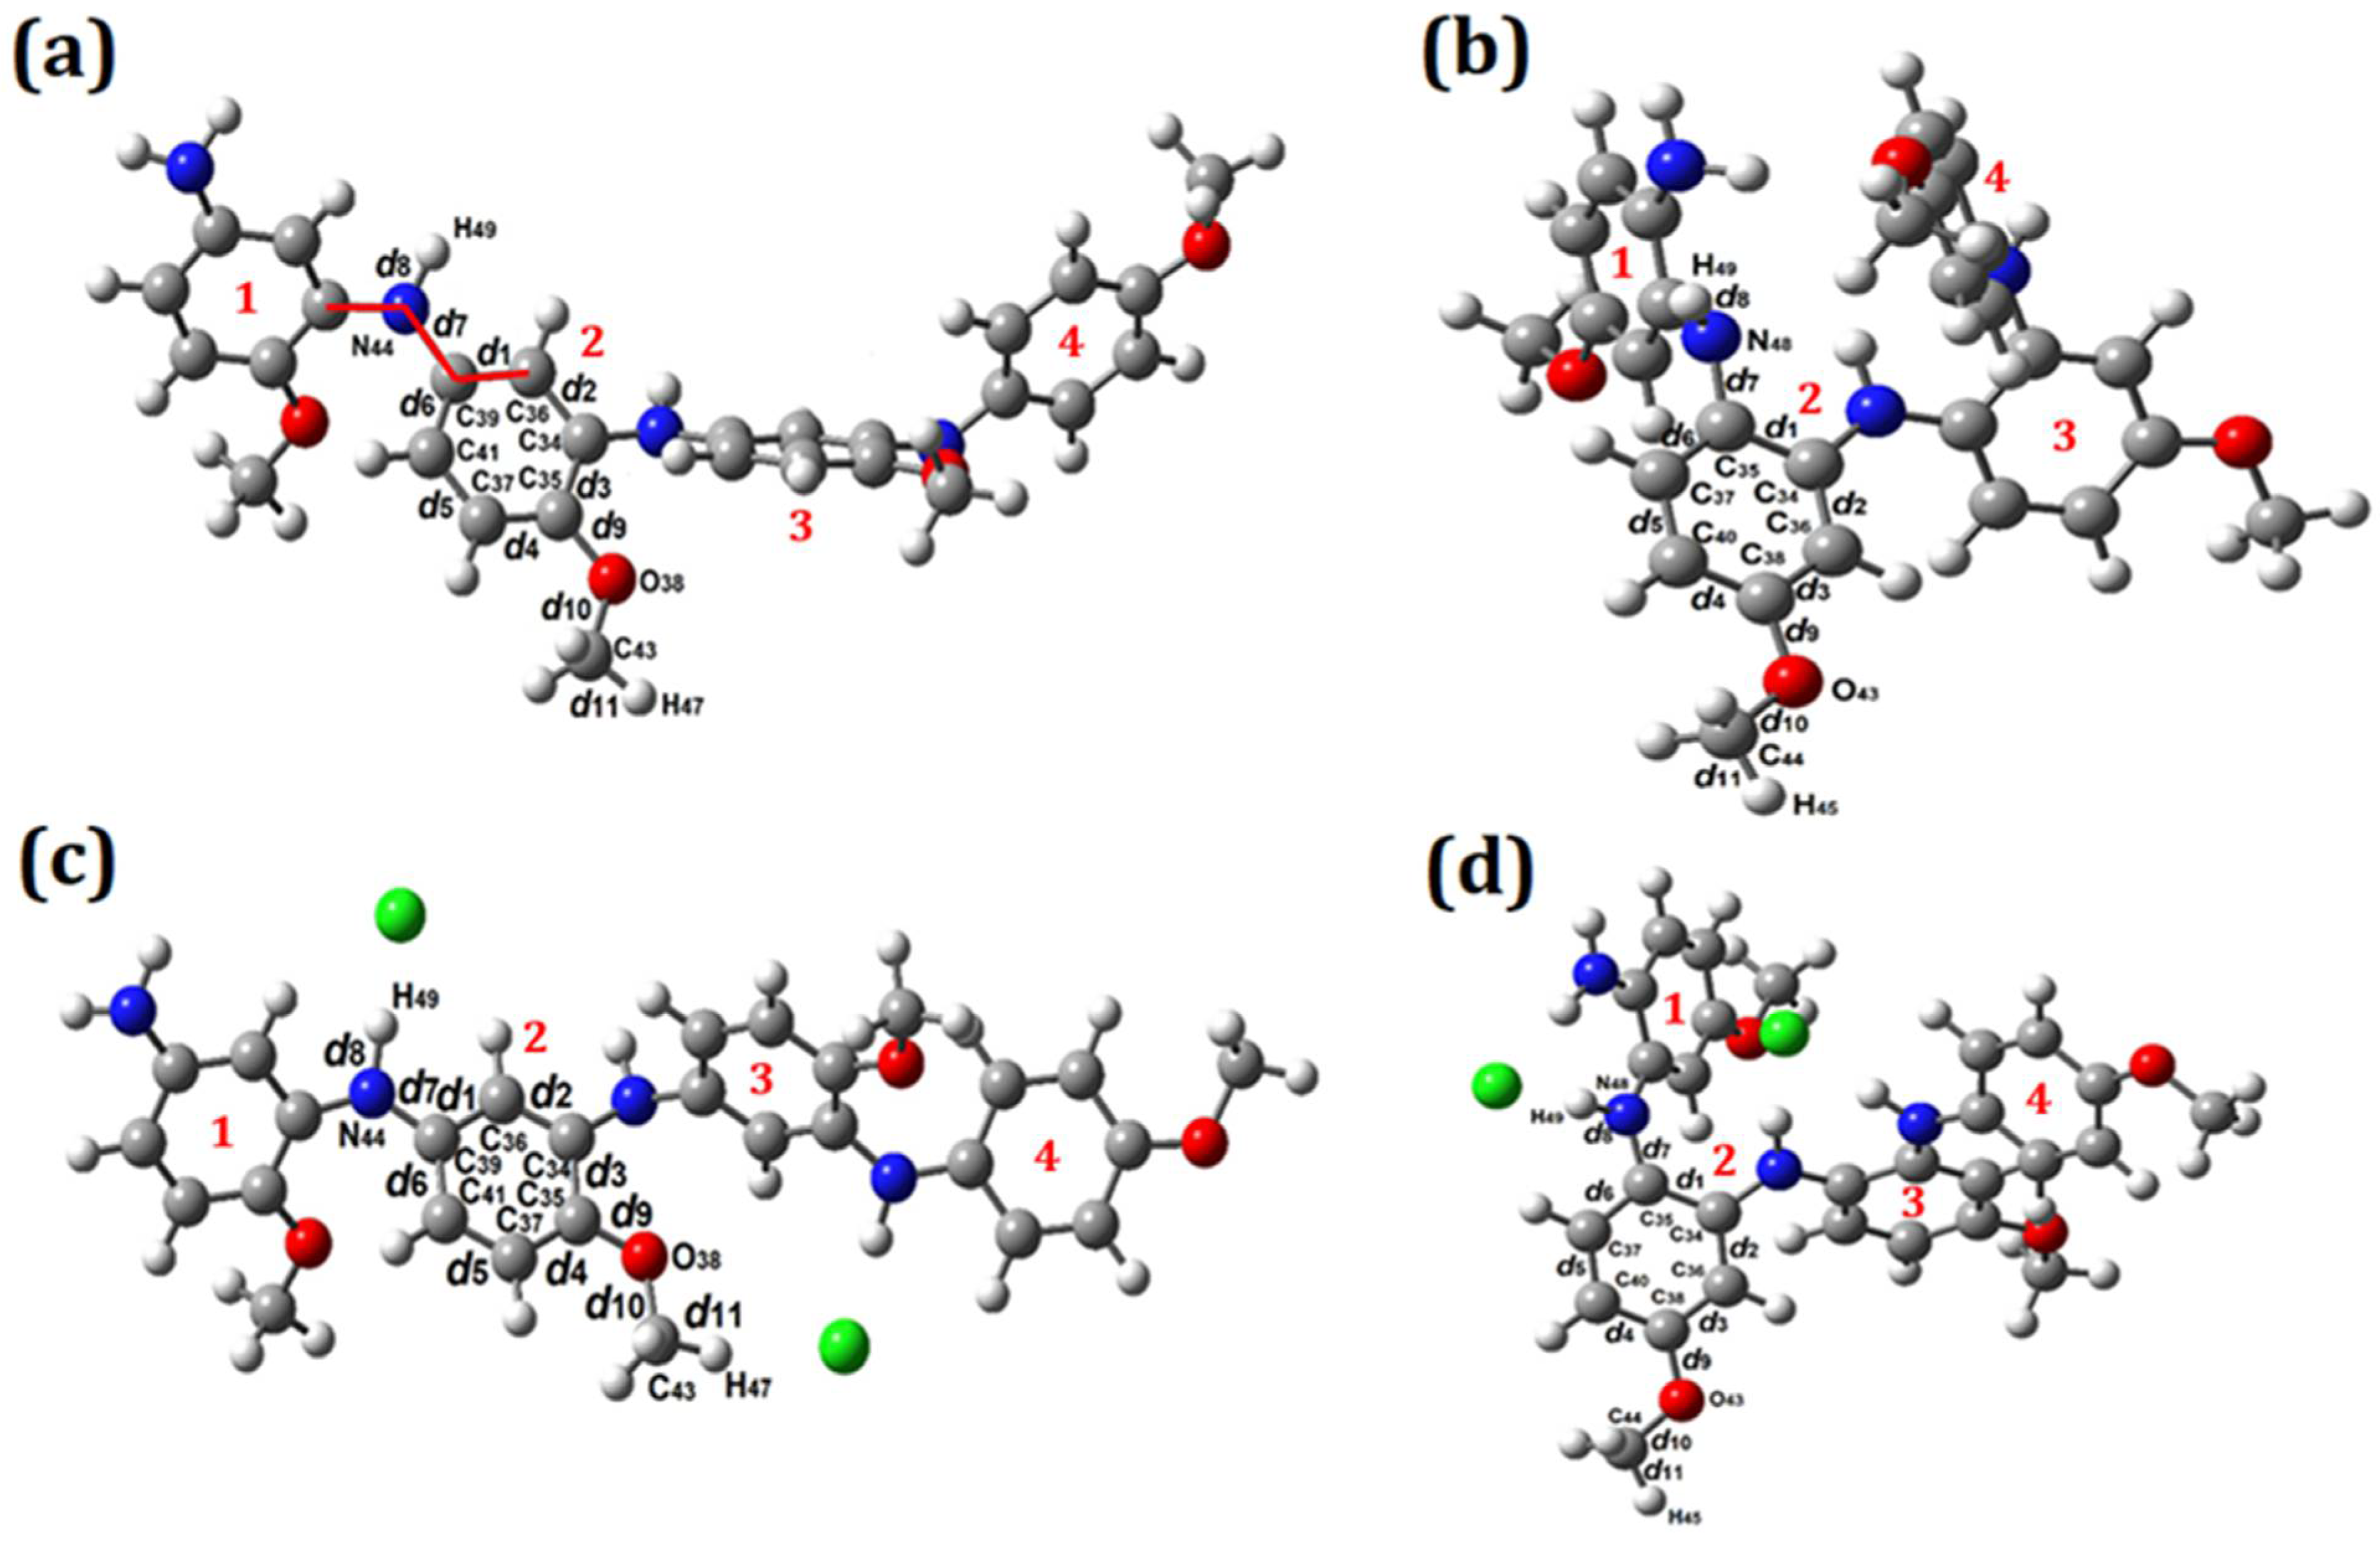
3.4. Geometry Optimization
3.5. FTIR Analysis
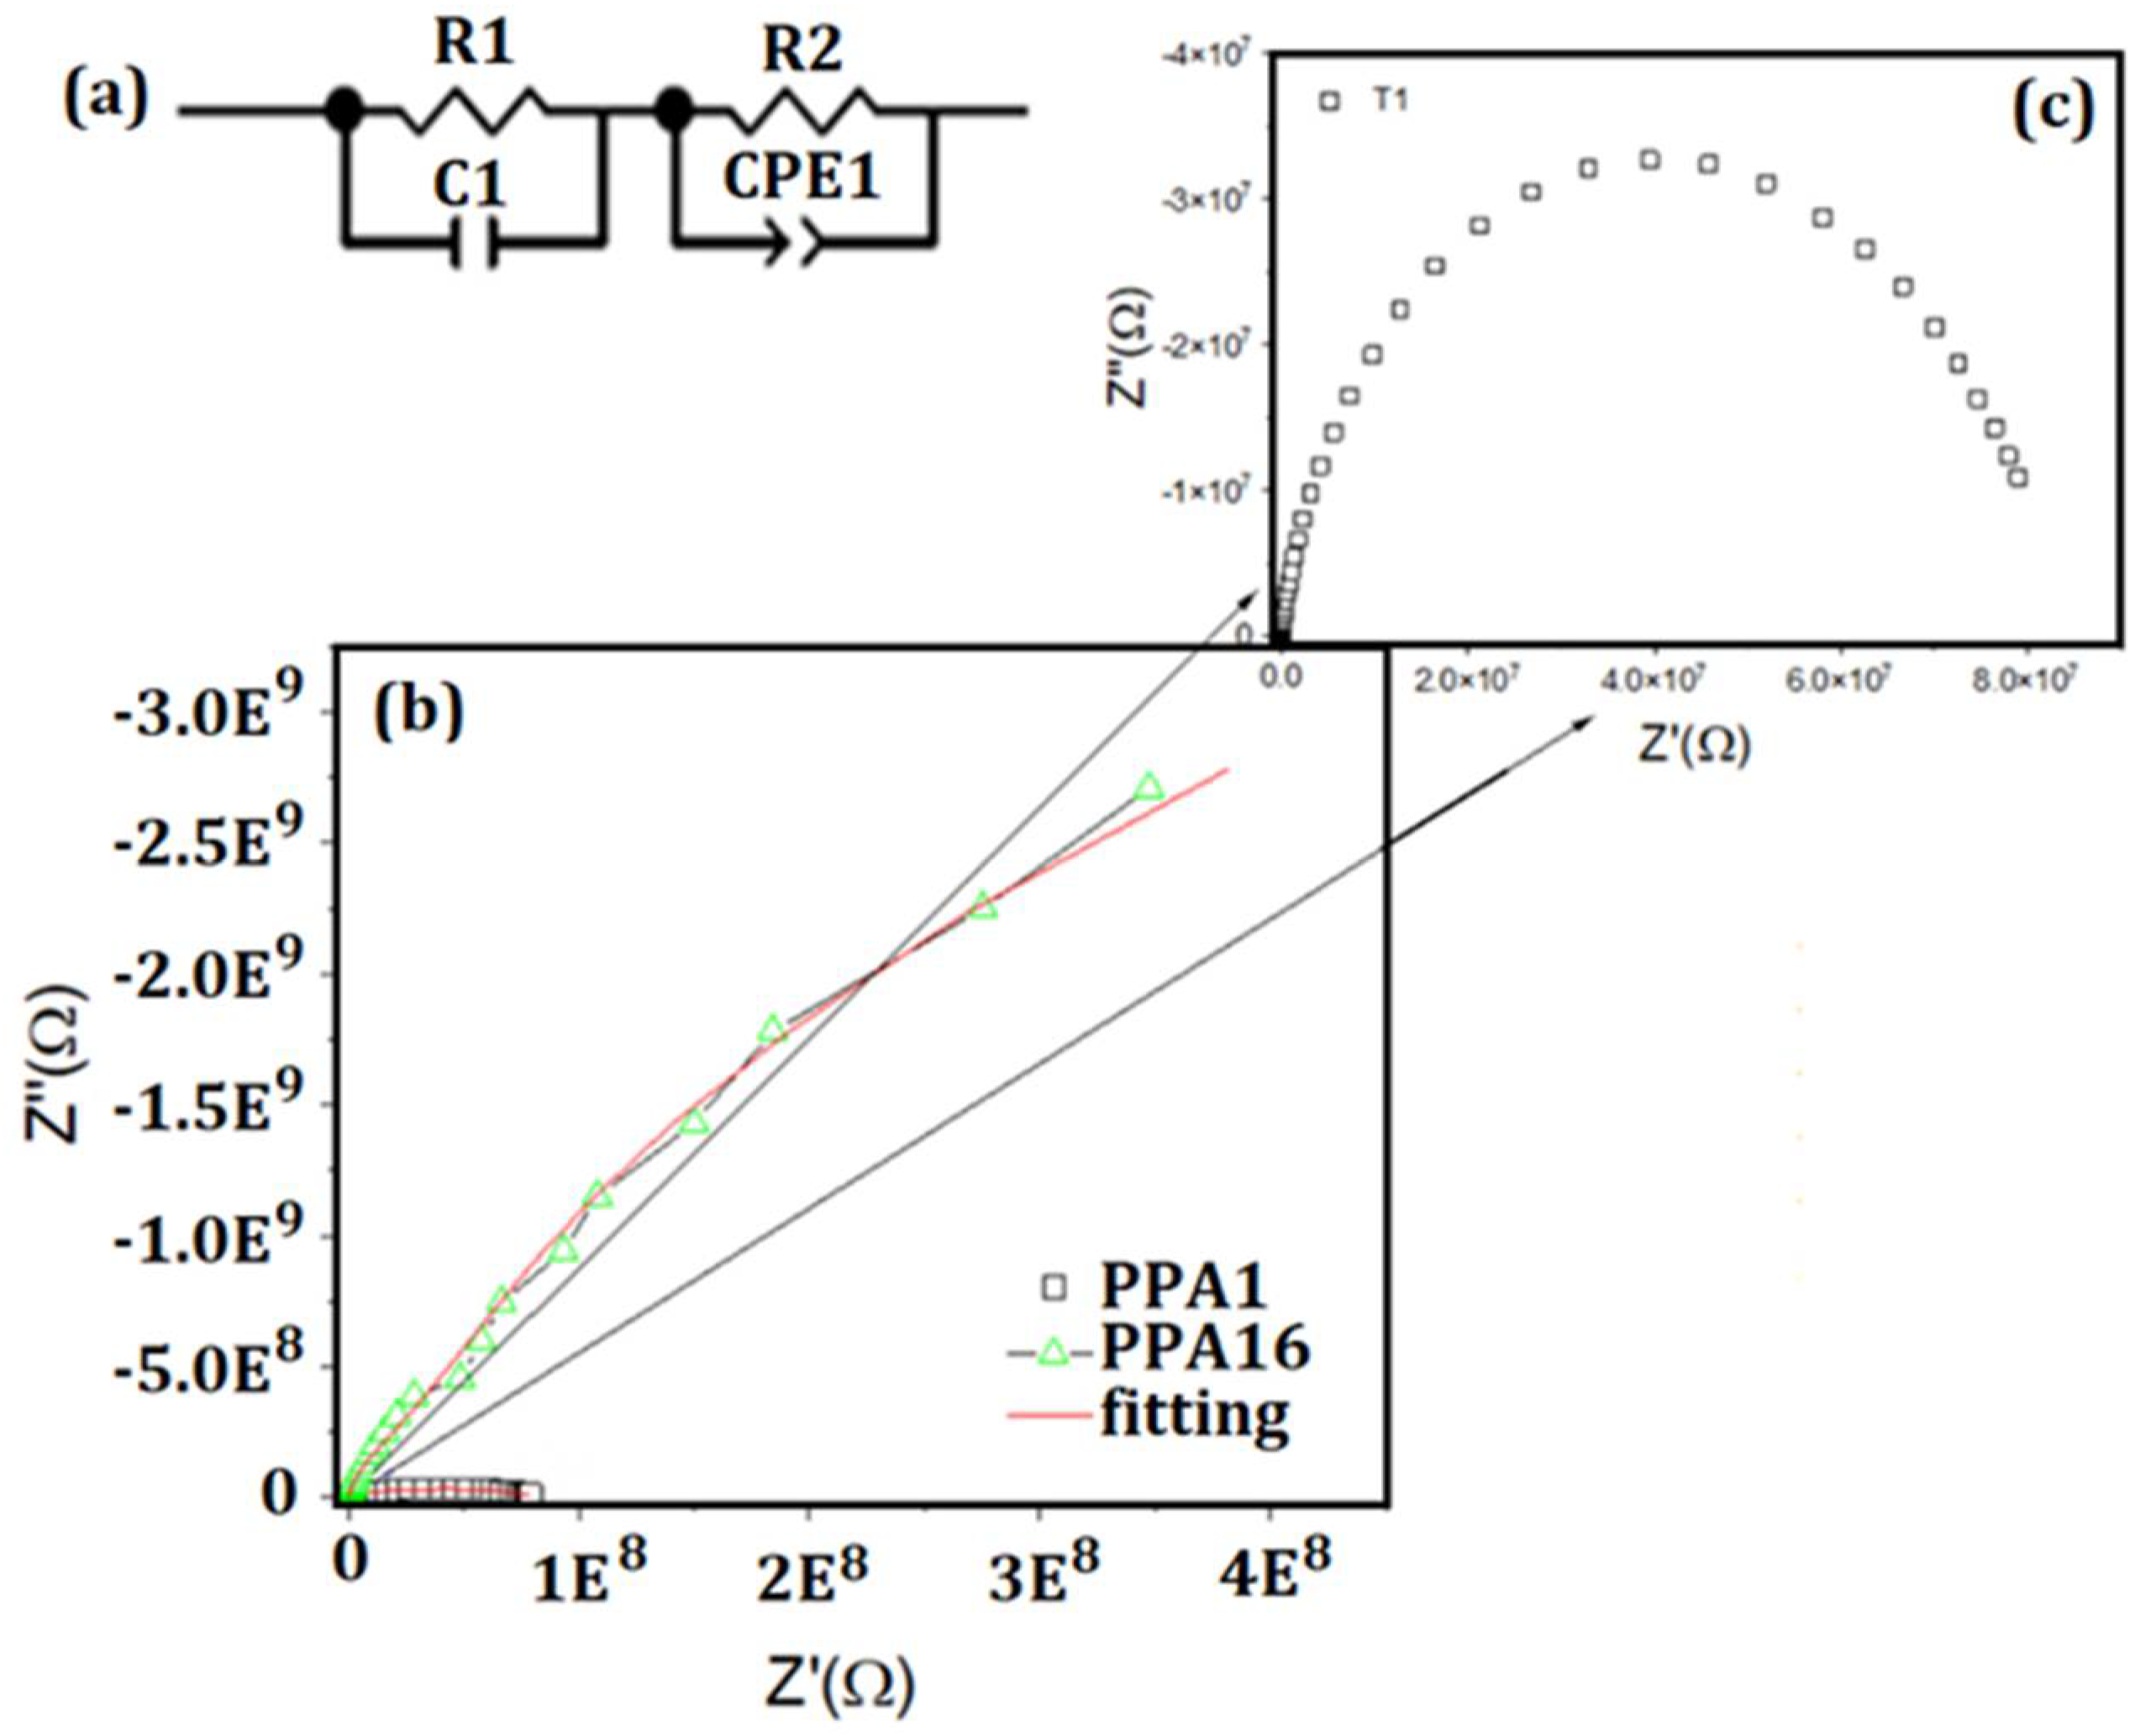
3.6. Electrical Conductivity
4. Conclusions
Author Contributions
Funding
Institutional Review Board Statement
Informed Consent Statement
Data Availability Statement
Acknowledgments
Conflicts of Interest
Sample Availability
References
- MacDiarmid, A.G. “Synthetic Metals”: A novel role for organic polymers (Nobel Lecture). Angew. Chem. Int. Ed. 2001, 40, 2581–2590. [Google Scholar] [CrossRef]
- Veras, T.N.; Carolino, A.S.; Lima, S.X.; Biondo, M.M.; Santos, N.A.; Campelo, P.H.; Ruiz, Y.L.; Frota, H.O.; Sanches, E.A. Characterization and DFT calculation of poly(m-anisidine) synthesized with different dopant acids. J. Mol. Struct. 2020, 1201, 127182. [Google Scholar] [CrossRef]
- Namsheer, K.; Rout, C.S. Conducting polymers: A comprehensive review on recent advances in synthesis, properties and applications. RSC Adv. 2021, 11, 5659–5697. [Google Scholar] [CrossRef]
- Ferreira, A.A.; Sanches, E.A. Multimorphologies of hydrochloride polyaniline synthesized by conventional and interfacial polymerization. J. Mol. Struct. 2017, 1143, 294–305. [Google Scholar] [CrossRef]
- Sharma, S.; Sudhakara, P.; Omran, A.A.B.; Singh, J.; Ilyas, R.A. Recent trends and developments in conducting polymer nanocomposites for multifunctional applications. Polymers 2021, 13, 2898. [Google Scholar] [CrossRef]
- Ramanavicius, S.; Deshmukh, M.A.; Apetrei, R.-M.; Ramanaviciene, A.; Plikusiene, I.; Morkvenaite-Vilkonciene, I.; Thorat, H.N.; Shirsat, M.D.; Ramanavicius, A. Conducting polymers—Versatile tools in analytical systems for the determination of biomarkers and biologically active compounds. In The Detection of Biomarkers; Elsevier: Amsterdam, The Netherlands, 2022; pp. 407–434. [Google Scholar]
- Ouyang, J. Application of intrinsically conducting polymers in flexible electronics. SmartMat 2021, 2, 263–285. [Google Scholar] [CrossRef]
- Da Silva, J.M.S.; de Souza Carolino, A.; de Oliveira, L.R.; de Souza Gonçalves, D.; Biondo, M.M.; Campelo, P.H.; de Araújo Bezerra, J.; Ţălu, Ş.; da Fonseca Filho, H.D.; da Frota, H.O.; et al. Poly(o-methoxyaniline) chain degradation based on a heat treatment (HT) process: Combined experimental and theoretical evaluation. Molecules 2022, 27, 3693. [Google Scholar] [CrossRef]
- Picanço, W.M.; de Andrade Feitosa, B.; da Silva, N.G.; Silva, G.T.A.; Giacon, V.M.; Campelo, P.H.; de Souza, S.M.; de Oliveira, K.M.T.; Sanches, E.A. Aniline-oriented polymerization over nano-SiO2 particles. J. Mol. Struct. 2018, 1167, 118–126. [Google Scholar] [CrossRef]
- Silva, A.D.S.; Soares, J.C.; Mafud, A.C.; De Souza, S.M.; Fernandes, E.G.R.; Mascarenhas, Y.P.; Sanches, E.A. Structural and morphological characterization of Poly(o-ethoxyaniline) Emeraldine-salt form using FTIR, XRD, Le Bail Method and SEM. J. Mol. Struct. 2014, 1071, 1–5. [Google Scholar] [CrossRef]
- Luo, H.; Kaneti, Y.V.; Ai, Y.; Wu, Y.; Wei, F.; Fu, J.; Cheng, J.; Jing, C.; Yuliarto, B.; Eguchi, M.; et al. Nanoarchitectured porous conducting polymers: From controlled synthesis to advanced applications. Adv. Mater. 2021, 33, 2007318. [Google Scholar] [CrossRef]
- Leite, F.L.; Alves, W.F.; Neto, M.O.; Polikarpov, I.; Herrmann, P.S.P.; Mattoso, L.H.C.; Oliveira, O.N. Doping in poly(o-ethoxyaniline) nanostructured films studied with atomic force spectroscopy (AFS). Micron 2008, 39, 1119–1125. [Google Scholar] [CrossRef] [PubMed]
- Mattoso, L.H.C.; Bulhões, L.O.S. Synthesis and characterization of poly(o-anisidine) films. Synth. Met. 1992, 52, 171–181. [Google Scholar] [CrossRef]
- Sanches, E.A.; Soares, J.C.; Mafud, A.C.; Trovati, G.; Fernandes, E.G.; Mascarenhas, Y.P. Structural and morphological characterization of chloride salt of conducting poly(o-methoxyaniline) obtained at different time synthesis. J. Mol. Struct. 2013, 1039, 167–173. [Google Scholar] [CrossRef]
- Zarrintaj, P.; Vahabi, H.; Saeb, M.R.; Mozafari, M. Application of polyaniline and its derivatives. In Fundamentals and Emerging Applications of Polyaniline; Elsevier: Amsterdam, The Netherlands, 2019; pp. 259–272. [Google Scholar]
- Farea, M.O.; Alhadlaq, H.A.; Alaizeri, Z.M.; Ahmed, A.A.A.; Sallam, M.O.; Ahamed, M. High performance of carbon monoxide gas sensor based on a novel PEDOT:PSS/PPA nanocomposite. ACS Omega 2022, 7, 22492–22499. [Google Scholar] [CrossRef]
- Rathidevi, K.; Velmani, N.; Tamilselvi, D. Electrical conductivity study of poly(p-anisidine) doped and undoped ZnO nanocomposite. Mediterr. J. Chem. 2019, 9, 403–410. [Google Scholar] [CrossRef]
- Radja, I.; Djelad, H.; Morallon, E.; Benyoucef, A. Characterization and electrochemical properties of conducting nanocomposites synthesized from p-anisidine and aniline with titanium carbide by chemical oxidative method. Synth. Met. 2015, 202, 25–32. [Google Scholar] [CrossRef]
- Koval’chuck, E.P.; Stratan, V.N.; Reshentnyak, V.O.; Błażejowski, J.; Whittingham, W.S. Synthesis and properties of the polyanisidines. Solid State Ion. 2001, 46, 217–224. [Google Scholar] [CrossRef]
- Chouli, F.; Radja, I.; Morallon, E.; Benyoucef, A. A novel conducting nanocomposite obtained by p-anisidine and aniline with titanium(IV) oxide nanoparticles: Synthesis, characterization, and electrochemical properties. Polym. Compos. 2017, 38, E254–E260. [Google Scholar] [CrossRef]
- Boutaleb, N.; Chouli, F.; Benyoucef, A.; Zeggai, F.Z.; Bachari, K. A comparative study on surfactant etyltrimethylammoniumbromide modified clay-based poly(p-anisidine) nanocomposites: Synthesis, characterization, optical and electrochemical properties. Polym. Compos. 2021, 42, 1648–1658. [Google Scholar] [CrossRef]
- Bordin, E.R.; Frumi Camargo, A.; Rossetto, V.; Scapini, T.; Modkovski, T.A.; Weirich, S.; Carezia, C.; Barretta Franceschetti, M.; Balem, A.; Golunski, S.M.; et al. Non-toxic bioherbicides obtained from Trichoderma koningiopsis can be applied to the control of weeds in agriculture crops. Ind. Biotechnol. 2018, 14, 157–163. [Google Scholar] [CrossRef]
- Lewin, M.; Guttmann, H.; Saar, N. New aspects of the accessibility of cellulose. In Proceedings of the Applied Polymer Symposium; Interscience, J.W., Ed.; Wiley: New York, NY, USA, 1976; Volume 28. [Google Scholar]
- Foroutan-pour, K.; Dutilleul, P.; Smith, D. Advances in the implementation of the box-counting method of fractal dimension estimation. Appl. Math. Comput. 1999, 105, 195–210. [Google Scholar] [CrossRef]
- Li, J.; Du, Q.; Sun, C. An improved box-counting method for image fractal dimension estimation. Pattern Recognit. 2009, 42, 2460–2469. [Google Scholar] [CrossRef]
- Yao, B.; Imani, F.; Sakpal, A.S.; Reutzel, E.W.; Yang, H. Multifractal analysis of image profiles for the characterization and detection of defects in additive manufacturing. J. Manuf. Sci. Eng. 2018, 140, 031014. [Google Scholar] [CrossRef]
- Chen, Y.; Yang, H. Numerical simulation and pattern characterization of nonlinear spatiotemporal dynamics on fractal surfaces for the whole-heart modeling applications. Eur. Phys. J. B 2016, 89, 181. [Google Scholar] [CrossRef]
- Ţălu, Ş.; Stach, S.; Ghodselahi, T.; Ghaderi, A.; Solaymani, S.; Boochani, A.; Garczyk, Ż. Topographic characterization of Cu–Ni NPs@a-C:H films by AFM and multifractal analysis. J. Phys. Chem. B 2015, 119, 5662–5670. [Google Scholar] [CrossRef] [PubMed]
- Posadas, A.N.D.; Giménez, D.; Quiroz, R.; Protz, R. Multifractal characterization of soil pore systems. Soil Sci. Soc. Am. J. 2003, 67, 1361–1369. [Google Scholar] [CrossRef]
- Ţălu, Ş.; Stach, S.; Mahajan, A.; Pathak, D.; Wagner, T.; Kumar, A.; Bedi, R.K.; Ţălu, M. Multifractal characterization of water soluble copper phthalocyanine based films surfaces. Electron. Mater. Lett. 2014, 10, 719–730. [Google Scholar] [CrossRef]
- Ţălu, Ş. Micro and Nanoscale Characterization of Three Dimensional Surfaces; Napoca Star Publishing House: Cluj-Napoca, Romania, 2015. [Google Scholar]
- Ţălu, Ş.; Stach, S. Multifractal characterization of unworn hydrogel contact lens surfaces. Polym. Eng. Sci. 2014, 54, 1066–1080. [Google Scholar] [CrossRef]
- Ţălu, Ş.; Stach, S.; Valedbagi, S.; Bavadi, R.; Elahi, S.M.; Ţălu, M. Multifractal characteristics of titanium nitride thin films. Mater. Sci. 2015, 33, 541–548. [Google Scholar] [CrossRef]
- Metz, G.; Ziliox, M.; Smith, S.O. Towards quantitative CP-MAS NMR. Solid State Nucl. Magn. Reson. 1996, 7, 155–160. [Google Scholar] [CrossRef]
- Sinha, N.; Grant, C.V.; Wu, C.H.; De Angelis, A.A.; Howell, S.C.; Opella, S.J. SPINAL modulated decoupling in high field double- and triple-resonance solid-state NMR experiments on stationary samples. J. Magn. Reson. 2005, 177, 197–202. [Google Scholar] [CrossRef] [PubMed]
- Perdew, J.P. Density functional theory and the band gap problem. Int. J. Quantum Chem. 1985, 28, 497–523. [Google Scholar] [CrossRef]
- Frisch, M.J.; Trucks, G.W.; Schlegel, H.B.; Scuseria, G.E.; Robb, M.A.; Cheeseman, J.R.; Montgomery, J.A., Jr.; Vreven, T.; Kudin, K.N.; Burant, J.C.; et al. Gaussian 03; Gaussian, Inc.: Wallingford, CT, USA, 2003. [Google Scholar]
- Perdew, J.P.; Burke, K.; Ernzerhof, M. Generalized gradient approximation made simple. Phys. Rev. Lett. 1996, 77, 3865–3868. [Google Scholar] [CrossRef] [PubMed]
- Perdew, J.P.; Burke, K.; Ernzerhof, M. Generalized gradient approximation made simple [Phys. Rev. Lett. 77, 3865 (1996)]. Phys. Rev. Lett. 1997, 78, 1396. [Google Scholar] [CrossRef]
- Wong, B.M.; Cordaro, J.G. Electronic properties of vinylene-linked heterocyclic conducting polymers: Predictive design and rational guidance from DFT calculations. J. Phys. Chem. C 2011, 115, 18333–18341. [Google Scholar] [CrossRef]
- Debnath, S.; Boyle, C.J.; Zhou, D.; Wong, B.M.; Kittilstved, K.R.; Venkataraman, D. Persistent radical anion polymers based on naphthalenediimide and a vinylene spacer. RSC Adv. 2018, 8, 14760–14764. [Google Scholar] [CrossRef]
- Dennington, R.D.; Keith, T.A.; Millam, J.M. GaussView Program; Semichem Inc.: Shawnee Mission, KS, USA, 2009. [Google Scholar]
- Wegner, G.; Fischer, E.W.; Muñoz-Escalona, A. Crystal structure and morphology of polymers from solid-state reactions. Die Makromol. Chem. 1975, 1, 521–558. [Google Scholar] [CrossRef]
- De Rosa, C.; Auriemma, F. Crystals and Crystallinity in Polymers: Diffraction Analysis of Ordered and Disordered Crystals, 1st ed.; John Wiley & Sons, Inc.: Hoboken, NJ, USA, 2014; ISBN 1118690796. [Google Scholar]
- Corradini, P.; Auriemma, F.; De Rosa, C. Crystals and crystallinity in polymeric materials. Acc. Chem. Res. 2006, 39, 314–323. [Google Scholar] [CrossRef]
- Canevarolo, S.V., Jr. Ciência Dos Polímeros. Um Texto Básico para Tecnólogos e Engenheiros, 3rd ed.; Artiliber Editora Ltda: São Paulo, Brazil, 2013. [Google Scholar]
- Morales, G.M. Effects of high hydrochloric acid concentration on aniline chemical polymerization. Polymer 1997, 38, 5247–5250. [Google Scholar] [CrossRef]
- Chung, F.H.; Scott, R.W. A new approach to the determination of crystallinity of polymers by X-ray diffraction. J. Appl. Crystallogr. 1973, 6, 225–230. [Google Scholar] [CrossRef]
- Sanches, E.A.; Carolino, A.S.; Santos, A.L.; Fernandes, E.G.R.; Trichês, D.M.; Mascarenhas, Y.P. The use of Le Bail Method to analyze the semicrystalline pattern of a nanocomposite based on polyaniline emeraldine-salt form and α-Al2O3. Adv. Mater. Sci. Eng. 2015, 2015, 375312. [Google Scholar] [CrossRef]
- Mazzeu, M.A.C.; Faria, L.K.; de Moura Cardoso, A.; Gama, A.M.; Baldan, M.R.; Gonçalves, E.S. Structural and morphological characteristics of polyaniline synthesized in pilot scale. J. Aerosp. Technol. Manag. 2017, 9, 39–47. [Google Scholar] [CrossRef]
- Stejskal, J.; Bober, P.; Trchová, M.; Nuzhnyy, D.; Bovtun, V.; Savinov, M.; Petzelt, J.; Proke, J. Interfaced conducting polymers. Synth. Met. 2017, 224, 109–115. [Google Scholar] [CrossRef]
- Behbahani, M.; Bide, Y.; Salarian, M.; Niknezhad, M.; Bagheri, S. The use of tetragonal star-like polyaniline nanostructures for efficient solid phase extraction and trace detection of Pb (II) and Cu (II) in agricultural products, sea foods, and water samples. Food Chem. 2014, 158, 14–19. [Google Scholar] [CrossRef]
- Bhadra, S.; Singha, N.K.; Khastgir, D. Effect of aromatic substitution in aniline on the properties of polyaniline. Eur. Polym. J. 2008, 44, 1763–1770. [Google Scholar] [CrossRef]
- Jamal, R.; Abdiryim, T.; Nurulla, I. Comparative studies of solid-state synthesized poly(o-methoxyaniline) and poly(o-toluidine). Polym. Adv. Technol. 2008, 19, 1461–1466. [Google Scholar] [CrossRef]
- Trovati, G.; Sanches, E.A.; De Souza, S.M.; Dos Santos, A.L.; Neto, S.C.; Mascarenhas, Y.P.; Chierice, G.O. Rigid and semi rigid polyurethane resins: A structural investigation using DMA, SAXS and Le Bail method. J. Mol. Struct. 2014, 1075, 589–593. [Google Scholar] [CrossRef]
- Sayyah, S.M.; El-Rabiey, M.M.; El-Feky, H.; Gaber, A.F. Electropolymerization of 2-methoxyaniline: Kinetic studies, mechanism, characterization of the polymer and applications as corrosion protection for mild steel in acid medium. Int. J. Polym. Mater. Polym. Biomater. 2007, 56, 605–628. [Google Scholar] [CrossRef]
- Bednarczyk, K.; Matysiak, W.; Tański, T.; Janeczek, H.; Schab-Balcerzak, E.; Libera, M. Effect of polyaniline content and protonating dopants on electroconductive composites. Sci. Rep. 2021, 11, 7487. [Google Scholar] [CrossRef]
- Van Put, A.; Vertes, A.; Wegrzynek, D.; Treiger, B.; Van Grieken, R. Quantitative characterization of individual particle surfaces by fractal analysis of scanning electron microscope images. Fresenius. J. Anal. Chem. 1994, 350, 440–447. [Google Scholar] [CrossRef]
- Mannelquist, A.; Almqvist, N.; Fredriksson, S. Influence of tip geometry on fractal analysis of atomic force microscopy images. Appl. Phys. A Mater. Sci. Process. 1998, 66, S891–S895. [Google Scholar] [CrossRef]
- Fu, H.; Wang, W.; Chen, X.; Pia, G.; Li, J. Fractal and multifractal analysis of fracture surfaces caused by hydrogen embrittlement in high-Mn twinning/transformation-induced plasticity steels. Appl. Surf. Sci. 2019, 470, 870–881. [Google Scholar] [CrossRef]
- Nečas, D.; Klapetek, P. Gwyddion: An open-source software for SPM data analysis. Cent. Eur. J. Phys. 2012, 10, 181–188. [Google Scholar] [CrossRef]
- Barabási, A.-L.; Vicsek, T. Multifractality of self-affine fractals. Phys. Rev. A 1991, 44, 2730–2733. [Google Scholar] [CrossRef] [PubMed]
- Grassberger, P.; Procaccia, I. Characterization of Strange Attractors. Phys. Rev. Lett. 1983, 50, 346–349. [Google Scholar] [CrossRef]
- Yadav, R.P.; Dwivedi, S.; Mittal, A.K.; Kumar, M.; Pandey, A.C. Fractal and multifractal analysis of LiF thin film surface. Appl. Surf. Sci. 2012, 261, 547–553. [Google Scholar] [CrossRef]
- Ghosh, K.; Pandey, R.K. Fractal and multifractal analysis of In-doped ZnO thin films deposited on glass, ITO, and silicon substrates. Appl. Phys. A 2019, 125, 98. [Google Scholar] [CrossRef]
- Nasehnejad, M.; Gholipour Shahraki, M.; Nabiyouni, G. Atomic force microscopy study, kinetic roughening and multifractal analysis of electrodeposited silver films. Appl. Surf. Sci. 2016, 389, 735–741. [Google Scholar] [CrossRef]
- De Oliveira, L.M.; Matos, R.S.; Campelo, P.H.; Sanches, E.A.; da Fonseca Filho, H.D. Evaluation of the nanoscale surface applied to biodegradable nanoparticles containing Allium sativum essential oil. Mater. Lett. 2020, 275, 128111. [Google Scholar] [CrossRef]
- De Oliveira, L.M.; Matos, R.S.; Ţălu, Ş.; Rocha, A.L.F.; de Aguiar Nunes, R.Z.; de Araújo Bezerra, J.; Campelo Felix, P.H.; Inada, N.M.; Sanches, E.A.; da Fonseca Filho, H.D. Three-dimensional nanoscale morphological surface analysis of polymeric particles containing Allium sativum essential oil. Materials 2022, 15, 2635. [Google Scholar] [CrossRef]
- NIST. NIST Standard Reference Data Program; National Institute of Standards and Technology: Boulder, CO, USA, 2010.
- Biondo, M.M.; Medeiros de Oliveira, L.; Lima, S.X.; de Souza Carolino, A.; Farias Rocha, A.L.; da Silva, J.P.; Ruiz, Y.L.; Giacon, V.M.; Campelo, P.H.; Sanches, E.A. Chemically synthesized poly(o-methoxyaniline): Influence of counterions on the structural and electrical properties. J. Mol. Struct. 2020, 1205, 127588. [Google Scholar] [CrossRef]
- Sanches, E.A.; Gomes, L.C.A.; Soares, J.C.; Da Silva, G.R.; Mascarenhas, Y.P. Characterization of Poly(o-methoxyaniline) Emeraldine-base form obtained at different time neutralization. J. Mol. Struct. 2014, 1063, 336–340. [Google Scholar] [CrossRef]
- Sanches, E.A.; Soares, J.C.; Iost, R.M.; Marangoni, V.S.; Trovati, G.; Batista, T.; Mafud, A.C.; Zucolotto, V.; Mascarenhas, Y.P. Structural characterization of emeraldine-salt polyaniline/gold nanoparticles complexes. J. Nanomater. 2011, 2011, 697071. [Google Scholar] [CrossRef]
- Reis, A.S.; Sanches, E.A.; Frota, H.O. Energy band structure and electronic transport properties of chlorine-doped polyaniline from ab initio calculations. Synth. Met. 2017, 231, 89–94. [Google Scholar] [CrossRef]
- Epstein, A.J.; Ginder, J.M.; Zuo, F.; Bigelow, R.W.; Woo, H.-S.; Tanner, D.B.; Richter, A.F.; Huang, W.-S.; MacDiarmid, A.G. Insulator to Metal Transition in Polyaniline. Synth. Met. 1987, 18, 303–309. [Google Scholar] [CrossRef]
- Kang, E.T.; Neoh, K.G.; Tan, K.L. Polyaniline: A polymer with many interesting intrinsic redox states. Prog. Polym. Sci. 1998, 23, 277–324. [Google Scholar] [CrossRef]
- Kar, P. Influence of Properties of Conjugated Polymer on Doping. In Doping in Conjugated Polymers; John Wiley & Sons, Inc.: Hoboken, NJ, USA, 2013; pp. 81–96. [Google Scholar]
- Hussin, H.; Gan, S.-N.; Phang, S.-W. Development of water-based polyaniline sensor for hydrazine detection. Sens. Actuators A Phys. 2021, 317, 112460. [Google Scholar] [CrossRef]
- Bhadra, S.; Kim, N.H.; Rhee, K.Y.; Lee, J.H. Preparation of nanosize polyaniline by solid-state polymerization and determination of crystal structure. Polym. Int. 2009, 58, 1173–1180. [Google Scholar] [CrossRef]
- Leite, F.L.; Alves, W.F.; Mir, M.; Mascarenhas, Y.P.; Herrmann, P.S.P.; Mattoso, L.H.C.; Oliveira, O.N. TEM, XRD and AFM study of poly(o-ethoxyaniline) films: New evidence for the formation of conducting islands. Appl. Phys. A Mater. Sci. Process. 2008, 93, 537–542. [Google Scholar] [CrossRef]
- Ponder, J.F.; Gregory, S.A.; Atassi, A.; Menon, A.K.; Lang, A.W.; Savagian, L.R.; Reynolds, J.R.; Yee, S.K. Significant enhancement of the electrical conductivity of conjugated polymers by post-processing side chain removal. J. Am. Chem. Soc. 2022, 144, 1351–1360. [Google Scholar] [CrossRef]
- Raghunathan, A.; Kahol, P.K.; McCormick, B.J. Electron localization in poly(alkoxyanilines). Solid State Commun. 1998, 108, 817–822. [Google Scholar] [CrossRef]
- Hassan, A.; Macedo, L.J.A.; Crespilho, F.N. Recognizing conductive islands in polymeric redox surfaces using electrochemical-coupled vibrational spectromicroscopy. Chem. Commun. 2020, 56, 10309–10312. [Google Scholar] [CrossRef] [PubMed]
- Nogueira, J.S.; Mattoso, L.H.c; Lepienski, C.M.; Faria, R.M. AC conduction of poly(o-methoxyaniline). Synth. Met. 1995, 69, 259–260. [Google Scholar] [CrossRef]
- Da Silva, L.S.; Biondo, M.M.; de Andrade Feitosa, B.; Rocha, A.L.F.; da Costa Pinto, C.; Lima, S.X.; de Lima Nogueira, C.; de Souza, S.M.; Ruiz, Y.L.; Campelo, P.H.; et al. Semiconducting nanocomposite based on the incorporation of polyaniline on the cellulose extracted from Bambusa vulgaris: Structural, thermal and electrical properties. Chem. Pap. 2022, 76, 309–322. [Google Scholar] [CrossRef]
- Nail, G.H.; Mendel, T.A.J. Synthesis, characterization and study electrical conductivity of new Poly 4-methoxy aniline/manganese dioxide nano composite. J. Educ. Sci. Stud. Chem. 2021, 17, 65–73. [Google Scholar] [CrossRef]


| PPA | p-Anisidine (g) | APS (g) | HCl (M) |
|---|---|---|---|
| PPA1 | 2.0 | 4.0 | 1.0 |
| PPA2 | 2.0 | 8.0 | 2.0 |
| PPA3 | 7.0 | 4.0 | 2.0 |
| PPA4 | 7.0 | 8.0 | 1.0 |
| PPA5 | 4.5 | 6.0 | 1.0 |
| PPA6 | 2.0 | 4.0 | 2.0 |
| PPA7 | 2.0 | 8.0 | 1.0 |
| PPA8 | 7.0 | 4.0 | 1.0 |
| PPA9 | 7.0 | 8.0 | 2.0 |
| PPA10 | 4.5 | 6.0 | 1.5 |
| PPA11 | 0.3 | 6.0 | 1.5 |
| PPA12 | 8.7 | 6.0 | 1.5 |
| PPA13 | 4.5 | 2.6 | 1.5 |
| PPA14 | 4.5 | 9.3 | 1.5 |
| PPA15 | 4.5 | 6.0 | 0.7 |
| PPA16 | 4.5 | 6.0 | 2.3 |
| PPA17 | 4.5 | 6.0 | 1.5 |
| Parameters | PPA1HT | PPA16HT-HH |
|---|---|---|
| f(αmax) | 0.34 | 0.14 |
| f(αmin) | 1.49 | 1.34 |
| Δf = f(αmin) − f(αmax) | 1.15 | 1.20 |
| αmax | 3.24 | 2.75 |
| αmin | 2.04 | 2.04 |
| Δα = αmax − αmin | 1.20 | 0.71 |
| PPAHT | PPAHH | ||
|---|---|---|---|
| Interatomic Distances (Å) | Angles (°) | Interatomic Distances (Å) | Angles (°) |
| d1 = 1.407 | (N44 C39 C36) = 118.280 | d1 = 1.431 | (N48 C35 C34) = 118.103 |
| d2 = 1.400 | (C35 O38 C43) = 117.437 | d2 = 1.403 | (C38 O43 C44) = 117.364 |
| d3 = 1.421 | (C36 C39 C34) = 28.816 | d3 = 1.405 | (C34 C35 C36) = 30.386 |
| d4 = 1.399 | (C34 C36 C35) = 30.881 | d4 = 1.402 | (C36 C34 C38) = 29.660 |
| d5 = 1.400 | (C37 C41 C35) = 29.240 | d5 = 1.403 | (C40 C37 C38) = 30.861 |
| d6 = 1.401 | (C39 C41 C36) = 30.881 | d6 = 1.392 | (C35 C37 C34) = 30.695 |
| d7 = 1.409 | d7 = 1.427 | ||
| d8 = 1.016 | d8 = 1.023 | ||
| d9 = 1.371 | d9 = 1.372 | ||
| d10 = 1.426 | d10 = 1.424 | ||
| d11 = 1.097 | d11 = 1.097 | ||
| Cl–PPAHT | Cl–PPAHH | ||
| Interatomic Distances (Å) | Angles (°) | Interatomic Distances (Å) | Angles (°) |
| d1 = 1.419 | (N44 C39 C36) = 116.773 | d1 = 1.446 | (N48 C35C34) = 125.903 |
| d2 = 1.387 | (C35 O38C43) = 120.253 | d2 = 1.412 | (C38 O43C44) = 118.142 |
| d3 = 1.441 | (C36 C39 C34) = 28.763 | d3 = 1.392 | (C34 C35 C36) = 30.563 |
| d4 = 1.415 | (C34 C36 C35) = 31.386 | d4 = 1.419 | (C36 C34 C38) = 29.012 |
| d5 = 1.383 | (C37 C41 C35) = 29.908 | d5 = 1.379 | (C40 C37 C38) = 30.869 |
| d6 = 1.425 | (C39 C41 C36) = 30.459 | d6 = 1.420 | (C35 C37 C34) = 31.088 |
| d7 = 1.367 | d7 = 1.382 | ||
| d8 = 1.101 | d8 = 1.076 | ||
| d9 = 1.335 | d9 = 1.362 | ||
| d10 = 1.445 | d10 = 1.431 | ||
| d11 = 1.100 | d11 = 1.096 | ||
| Theoretical Absorptions | Experimental Absorptions | |||||
|---|---|---|---|---|---|---|
| Absorption Bands | PPAHT (cm−1) | PPAHH (cm−1) | Cl–PPAHT (cm−1) | Cl–PPAHH (cm−1) | PPA1HT (cm−1) | PPA16HT-HH (cm−1) |
| γ(C–H) | 795 | 774 | 763 | 759 | 828 | 828 |
| ν(O–CH3) | 1039 | 1039 | 1024 | 1032 | 1032 | 1032 |
| ν(C–N–C) | 1216 | 1228 | 1223 | 1235 | 1109 | 1109 |
| ν(C–O) | 1230 | 1230 | 1233 | 1244 | 1173 | 1173 |
| ν(C–O–CH3) | 1242 | 1249 | 1253 | 1257 | 1250 | 1250 |
| ν(C=C) | 1337 | 1339 | 1336 | 1324 | 1358 | 1344 |
| ν(CH3) | 1454 | 1454 | 1447 | 1454 | 1418 | 1418 |
| Quinoid (Q) | – | – | 1537 | 1513 | 1490 | 1490 |
| Benzenoid (B) | 1606 | 1606 | 1596 | 1602 | 1516 | 1516 |
| ν(C–H)ring | 3080–3138 | 3085–3159 | 3090–3156 | 3101–3153 | 2836 | 2836 |
| ν(N–H) | 3515–3518 | 3427–3514 | 2101 and 2300 | 2491–2841 | 2905–3006 | 2905–3006 |
| Sample | R1 (MΩ) | R2 (MΩ) | Rt (MΩ) | C1 (µF) | CPE1-T | CPE1-T | ρ (MΩcm) | σ (S·cm−1) |
|---|---|---|---|---|---|---|---|---|
| PPA1HT | 3.34 | 77.31 | 80.65 | 6.96 × 10⁻⁵ | 3.60 × 10⁻⁵ | 0.90 | 8.23 × 10² | 1.00 × 10⁻⁹ |
| PPA16HT-HH | 30.9 | 2.89 × 10⁴ | 289.9 × 10⁴ | 5.65 × 10⁻⁵ | 6.09 × 10⁻⁵ | 0.98 | 2.56 × 10⁷ | 3.90 × 10⁻¹⁴ |
Publisher’s Note: MDPI stays neutral with regard to jurisdictional claims in published maps and institutional affiliations. |
© 2022 by the authors. Licensee MDPI, Basel, Switzerland. This article is an open access article distributed under the terms and conditions of the Creative Commons Attribution (CC BY) license (https://creativecommons.org/licenses/by/4.0/).
Share and Cite
de Oliveira, L.R.; de Souza Gonçalves, D.; de Souza Carolino, A.; Facchinatto, W.M.; de Carvalho Menezes, D.; Dias, C.O.; Colnago, L.A.; Ruiz, Y.L.; Ţălu, Ş.; da Fonseca Filho, H.D.; et al. Head-to-Tail and Head-to-Head Molecular Chains of Poly(p-Anisidine): Combined Experimental and Theoretical Evaluation. Molecules 2022, 27, 6326. https://doi.org/10.3390/molecules27196326
de Oliveira LR, de Souza Gonçalves D, de Souza Carolino A, Facchinatto WM, de Carvalho Menezes D, Dias CO, Colnago LA, Ruiz YL, Ţălu Ş, da Fonseca Filho HD, et al. Head-to-Tail and Head-to-Head Molecular Chains of Poly(p-Anisidine): Combined Experimental and Theoretical Evaluation. Molecules. 2022; 27(19):6326. https://doi.org/10.3390/molecules27196326
Chicago/Turabian Stylede Oliveira, Lilian Rodrigues, Douglas de Souza Gonçalves, Adriano de Souza Carolino, William Marcondes Facchinatto, Diogo de Carvalho Menezes, Cleverton Oliveira Dias, Luiz Alberto Colnago, Yurimiler Leyet Ruiz, Ştefan Ţălu, Henrique Duarte da Fonseca Filho, and et al. 2022. "Head-to-Tail and Head-to-Head Molecular Chains of Poly(p-Anisidine): Combined Experimental and Theoretical Evaluation" Molecules 27, no. 19: 6326. https://doi.org/10.3390/molecules27196326