
Kinetic Analysis of Digestate Slow Pyrolysis with the Application of the Master-Plots Method and Independent Parallel Reactions Scheme

 , ,
, , 
Abstract
:1. Introduction
The Importance of Digestate Slow-Pyrolysis Process
2. Results
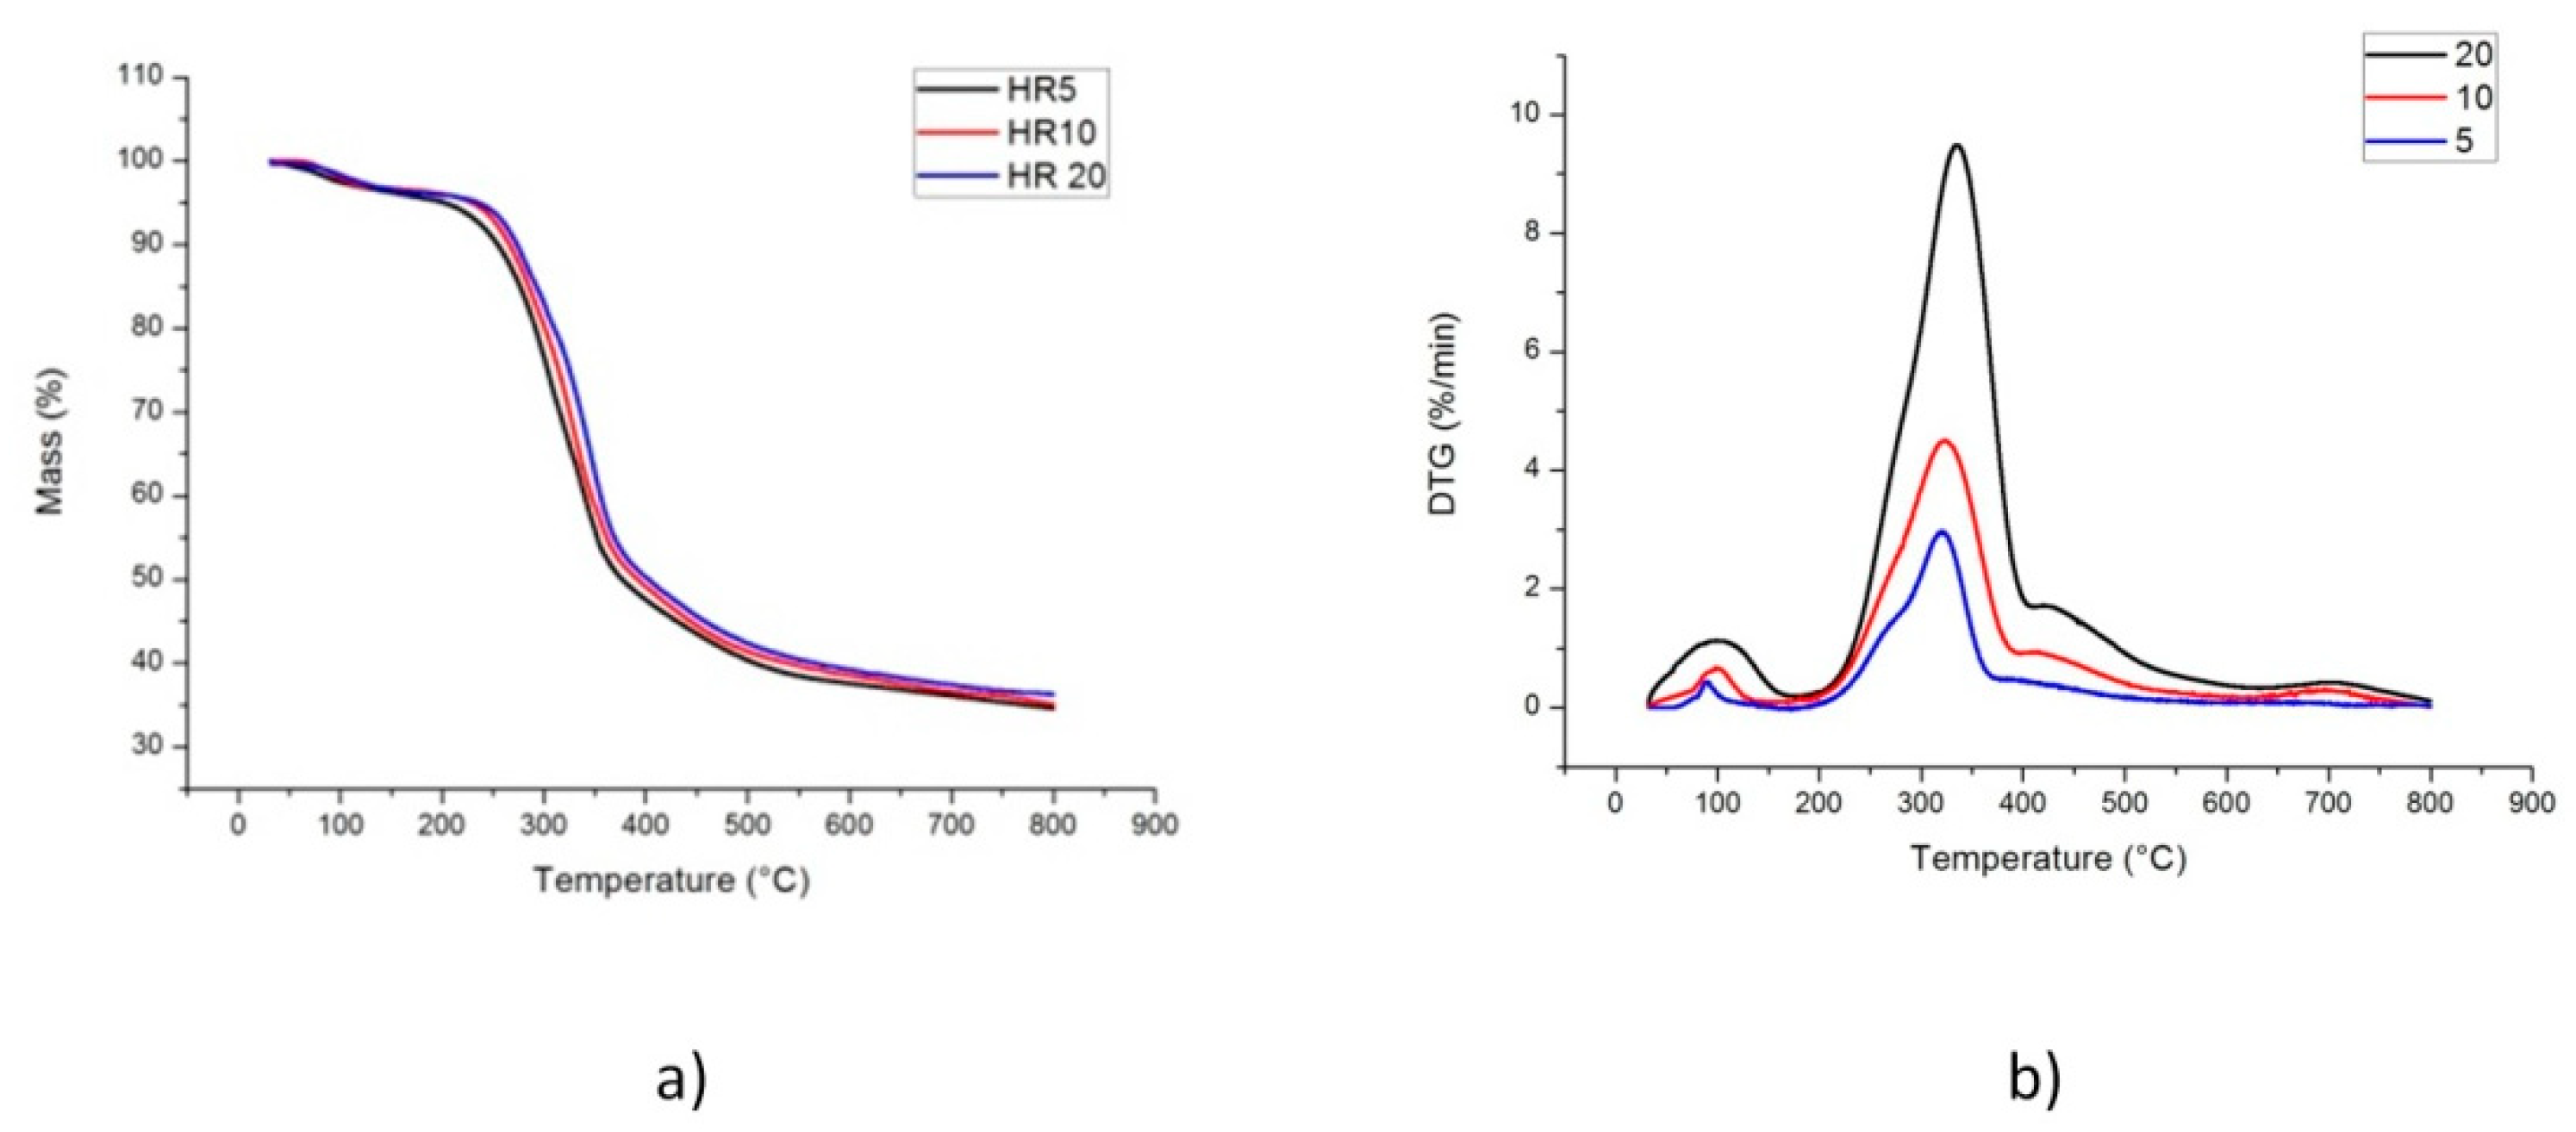
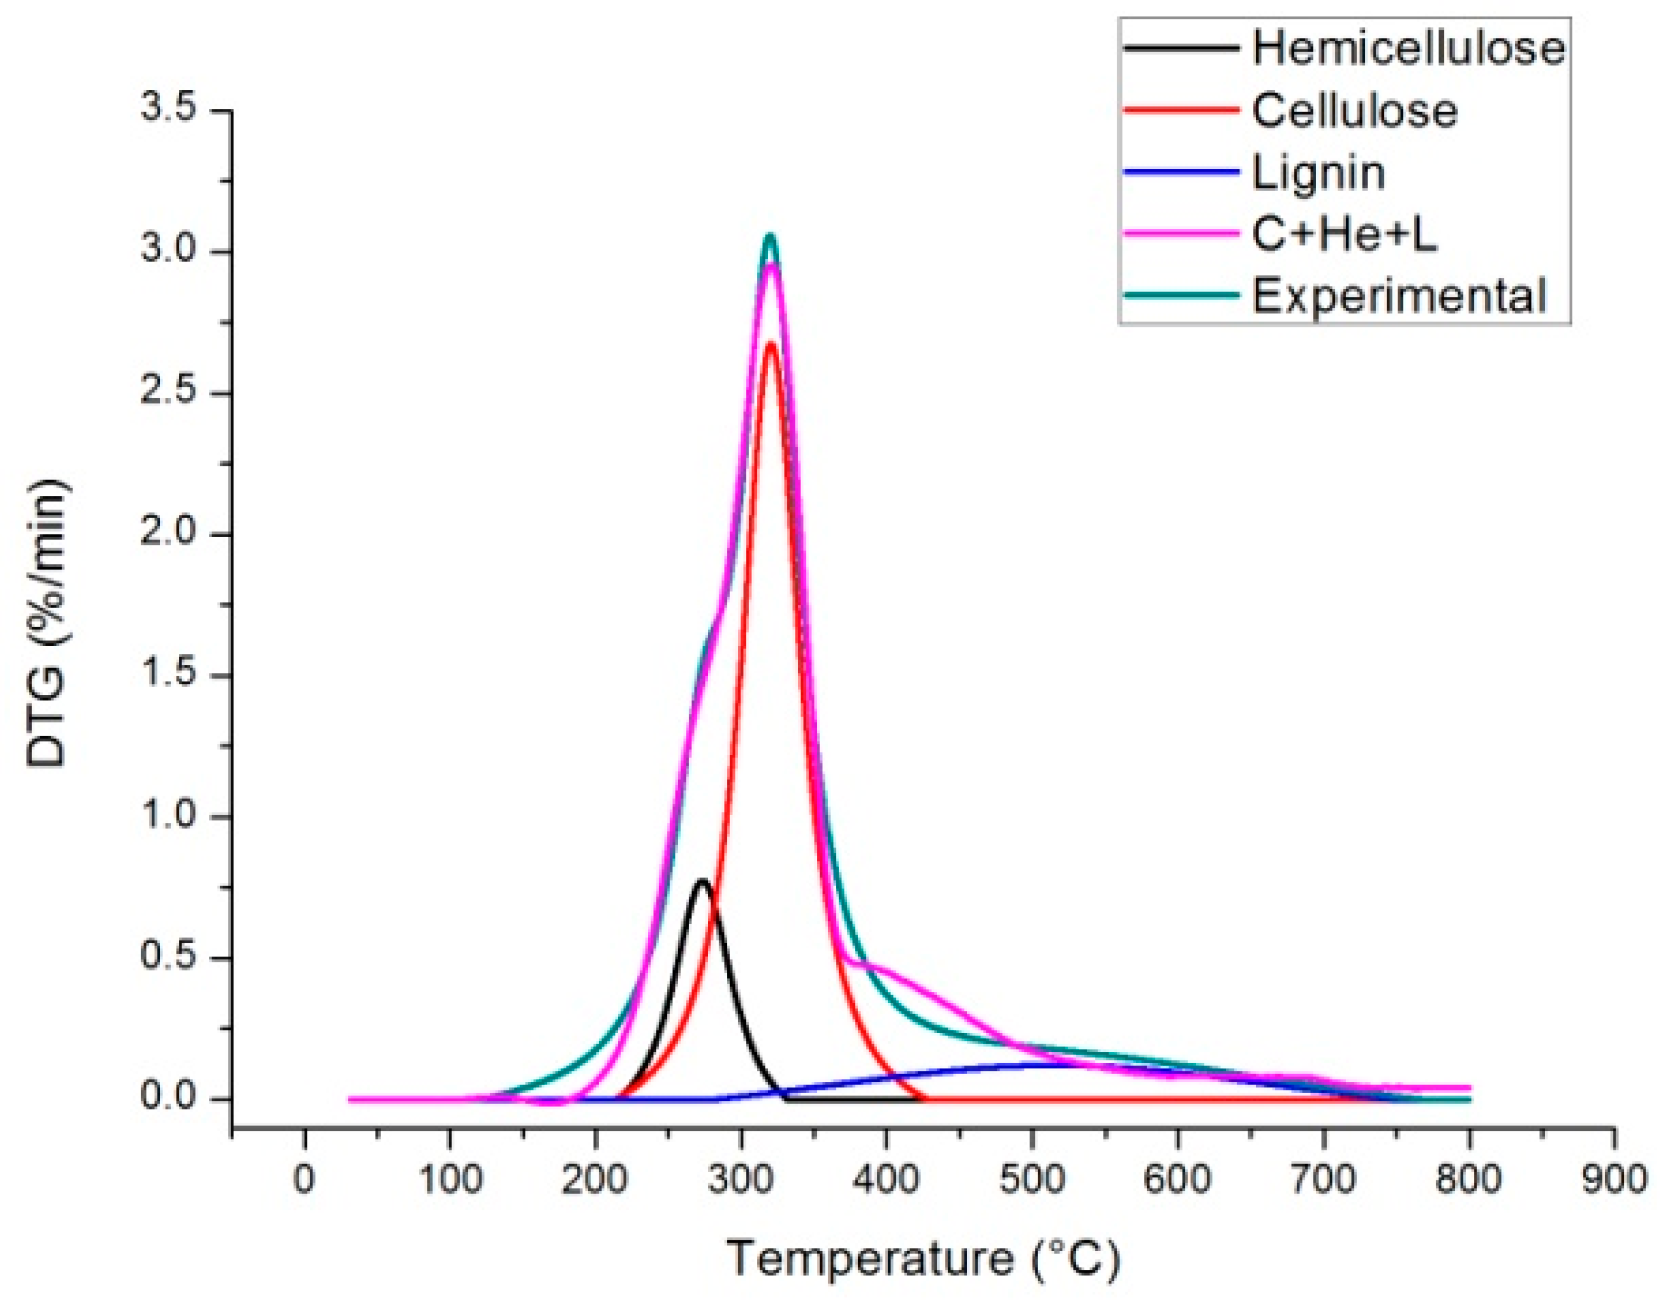
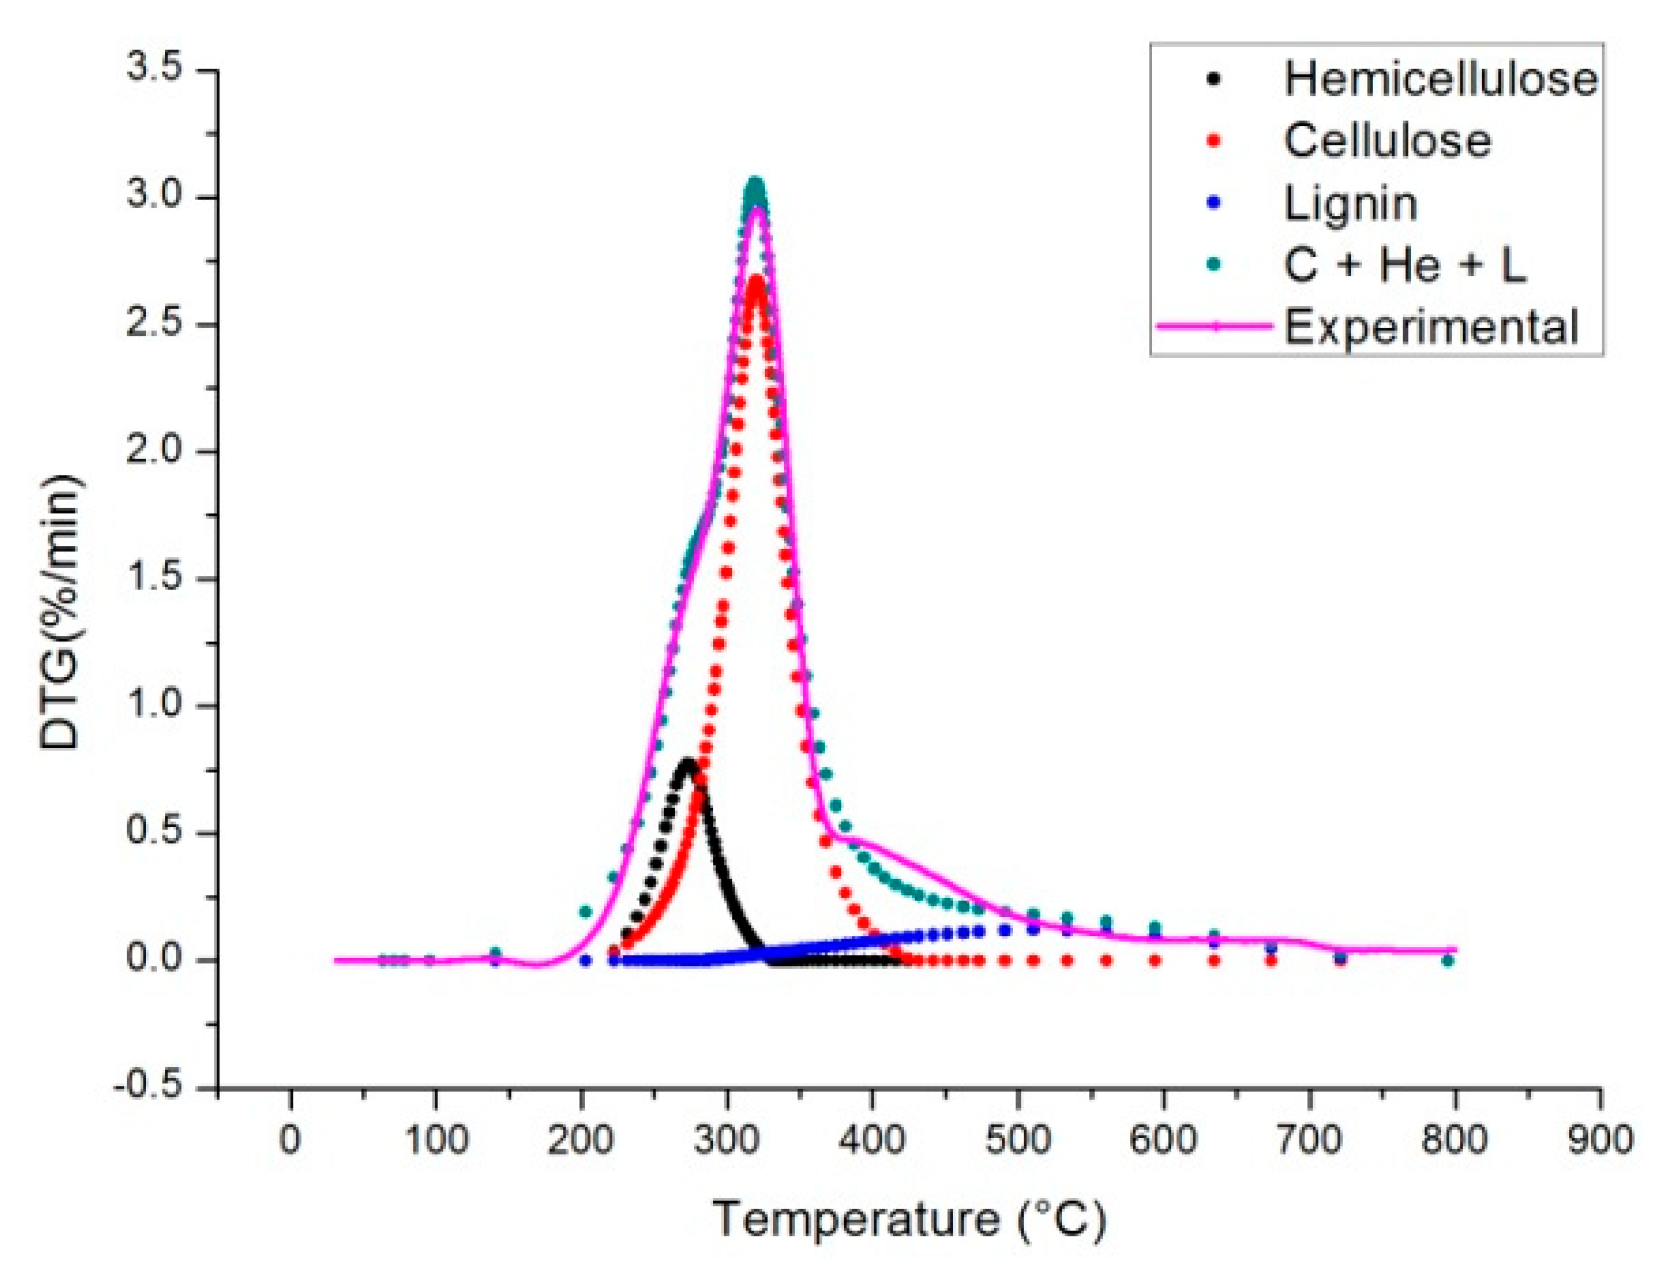
2.1. TG-DTG Curves
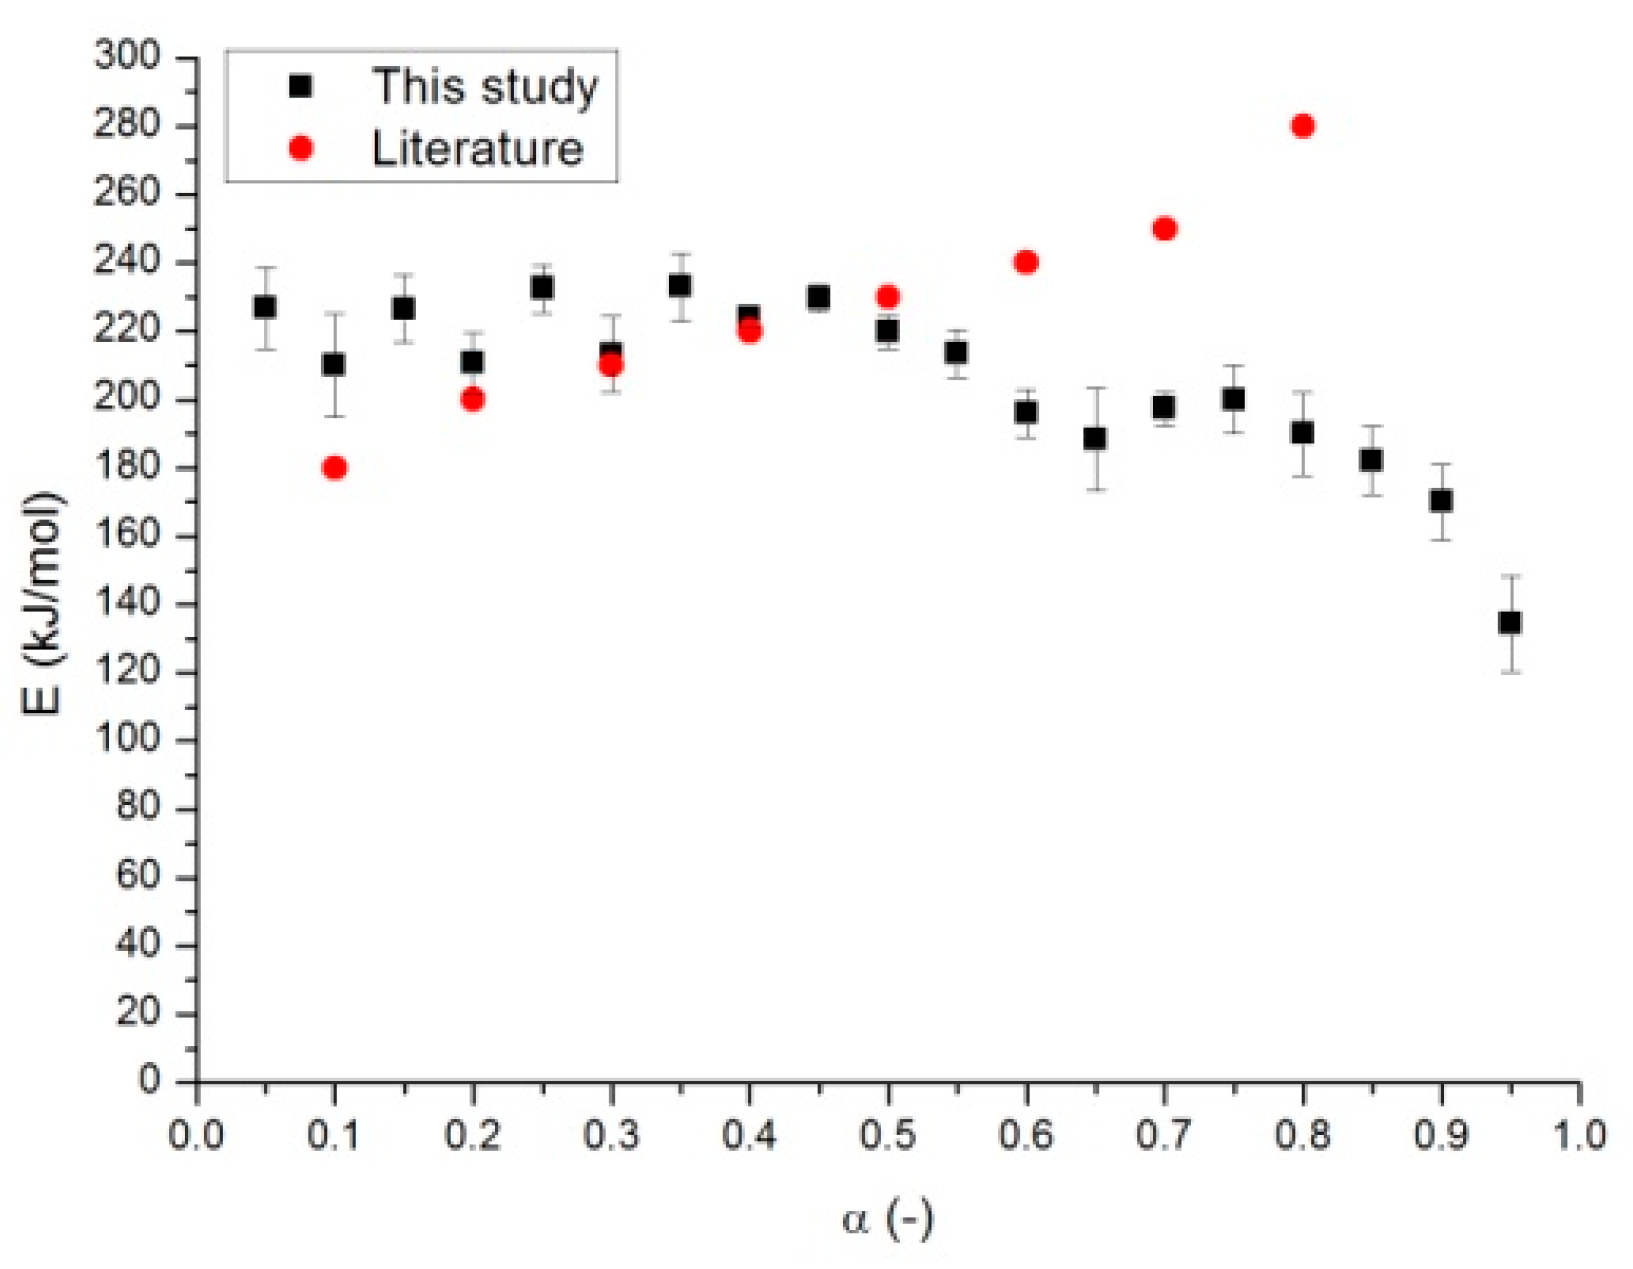
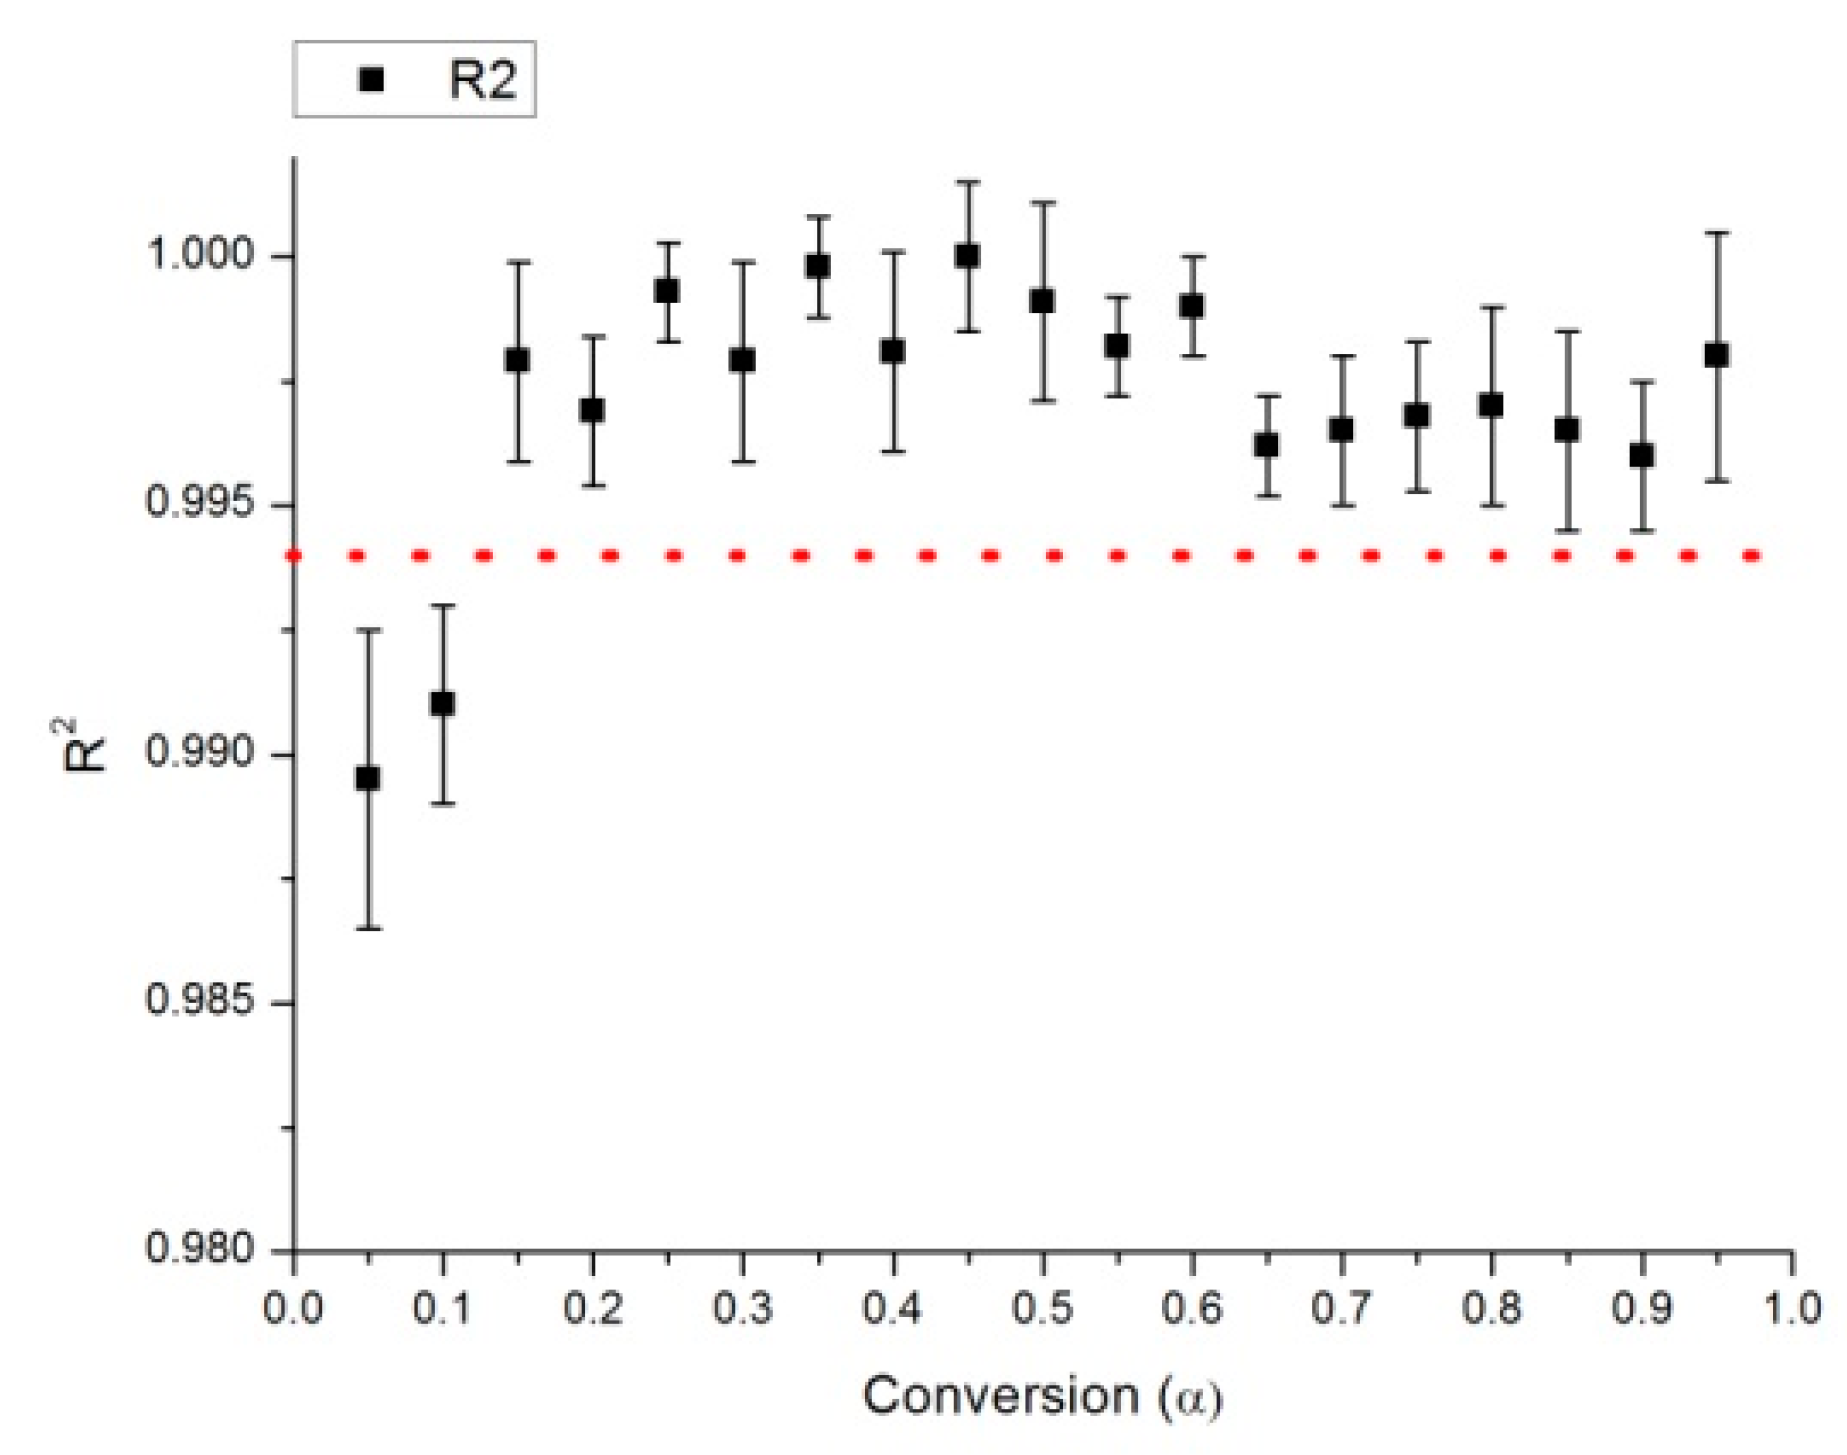
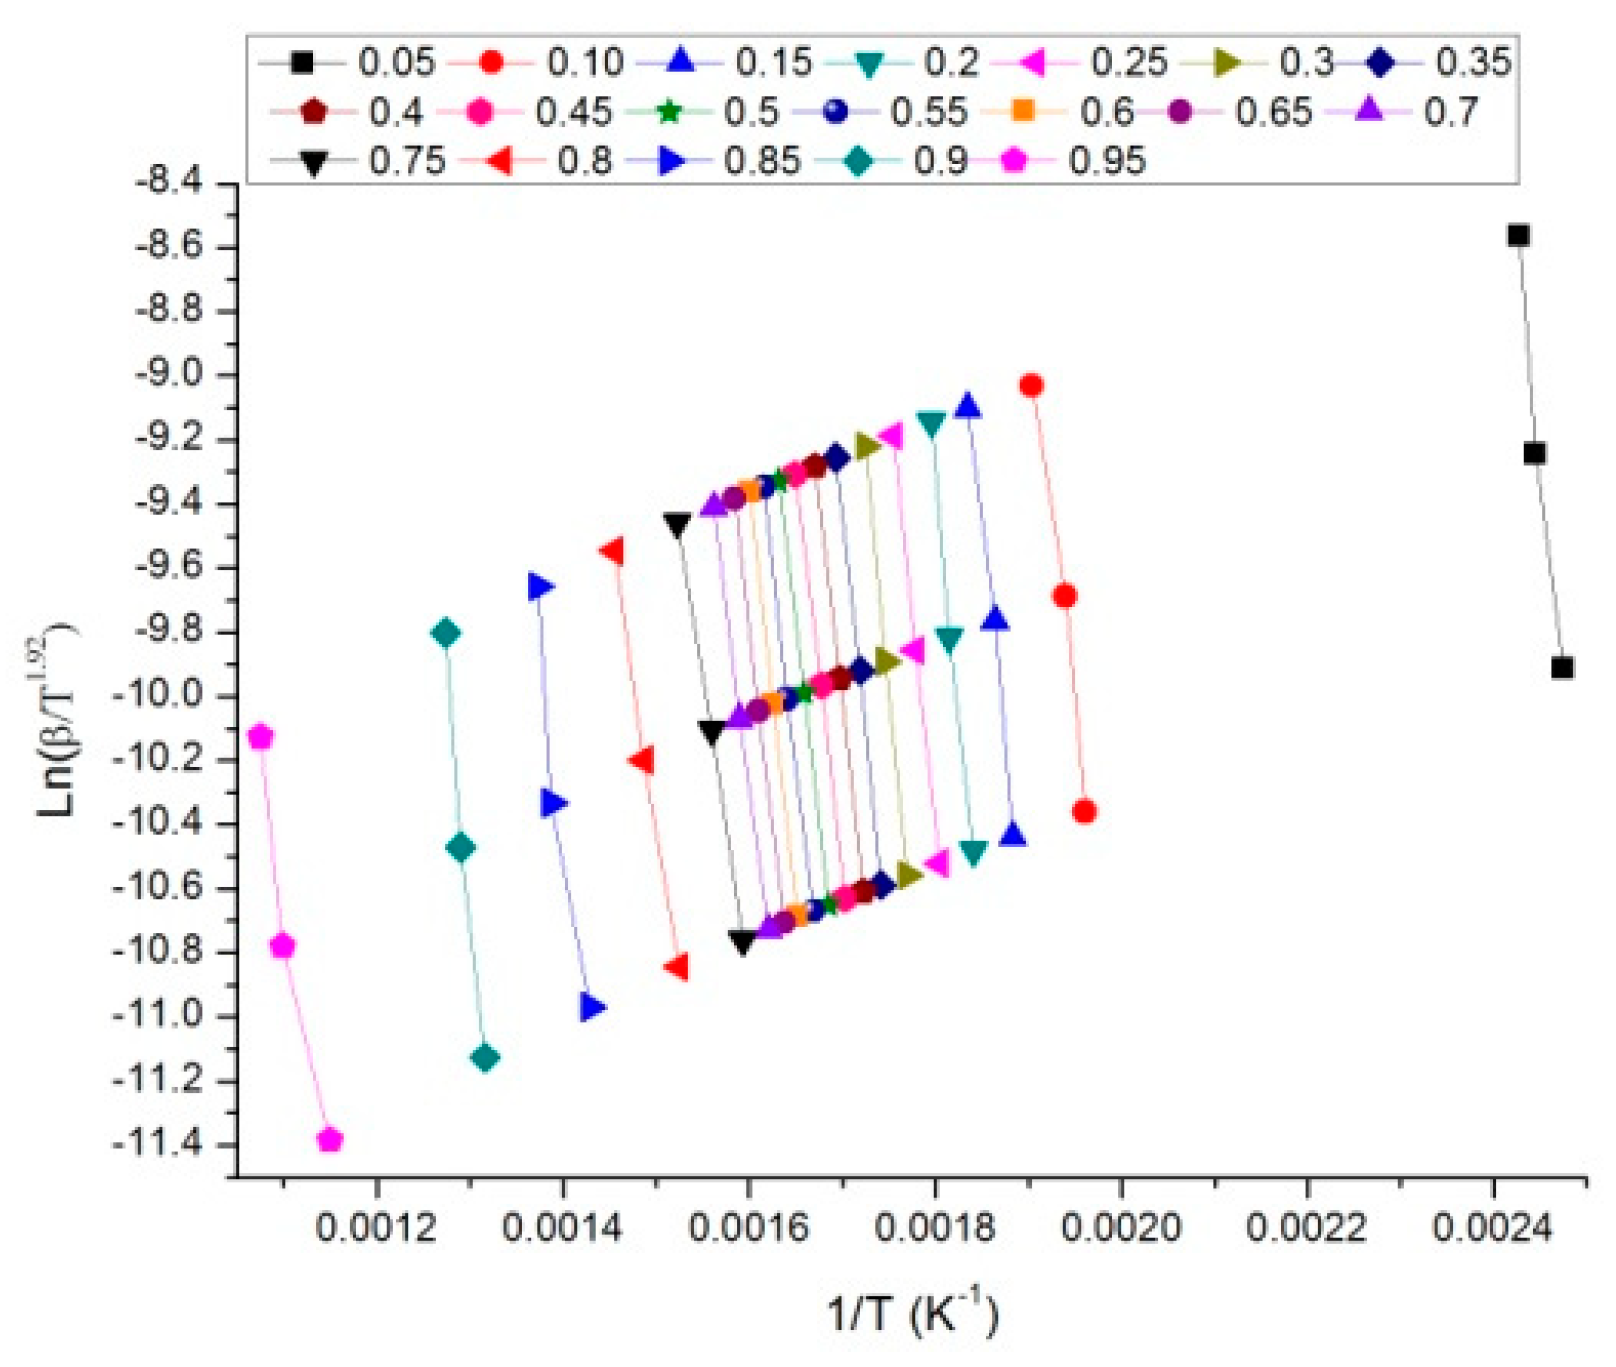
2.2. Determination of Activation Energy
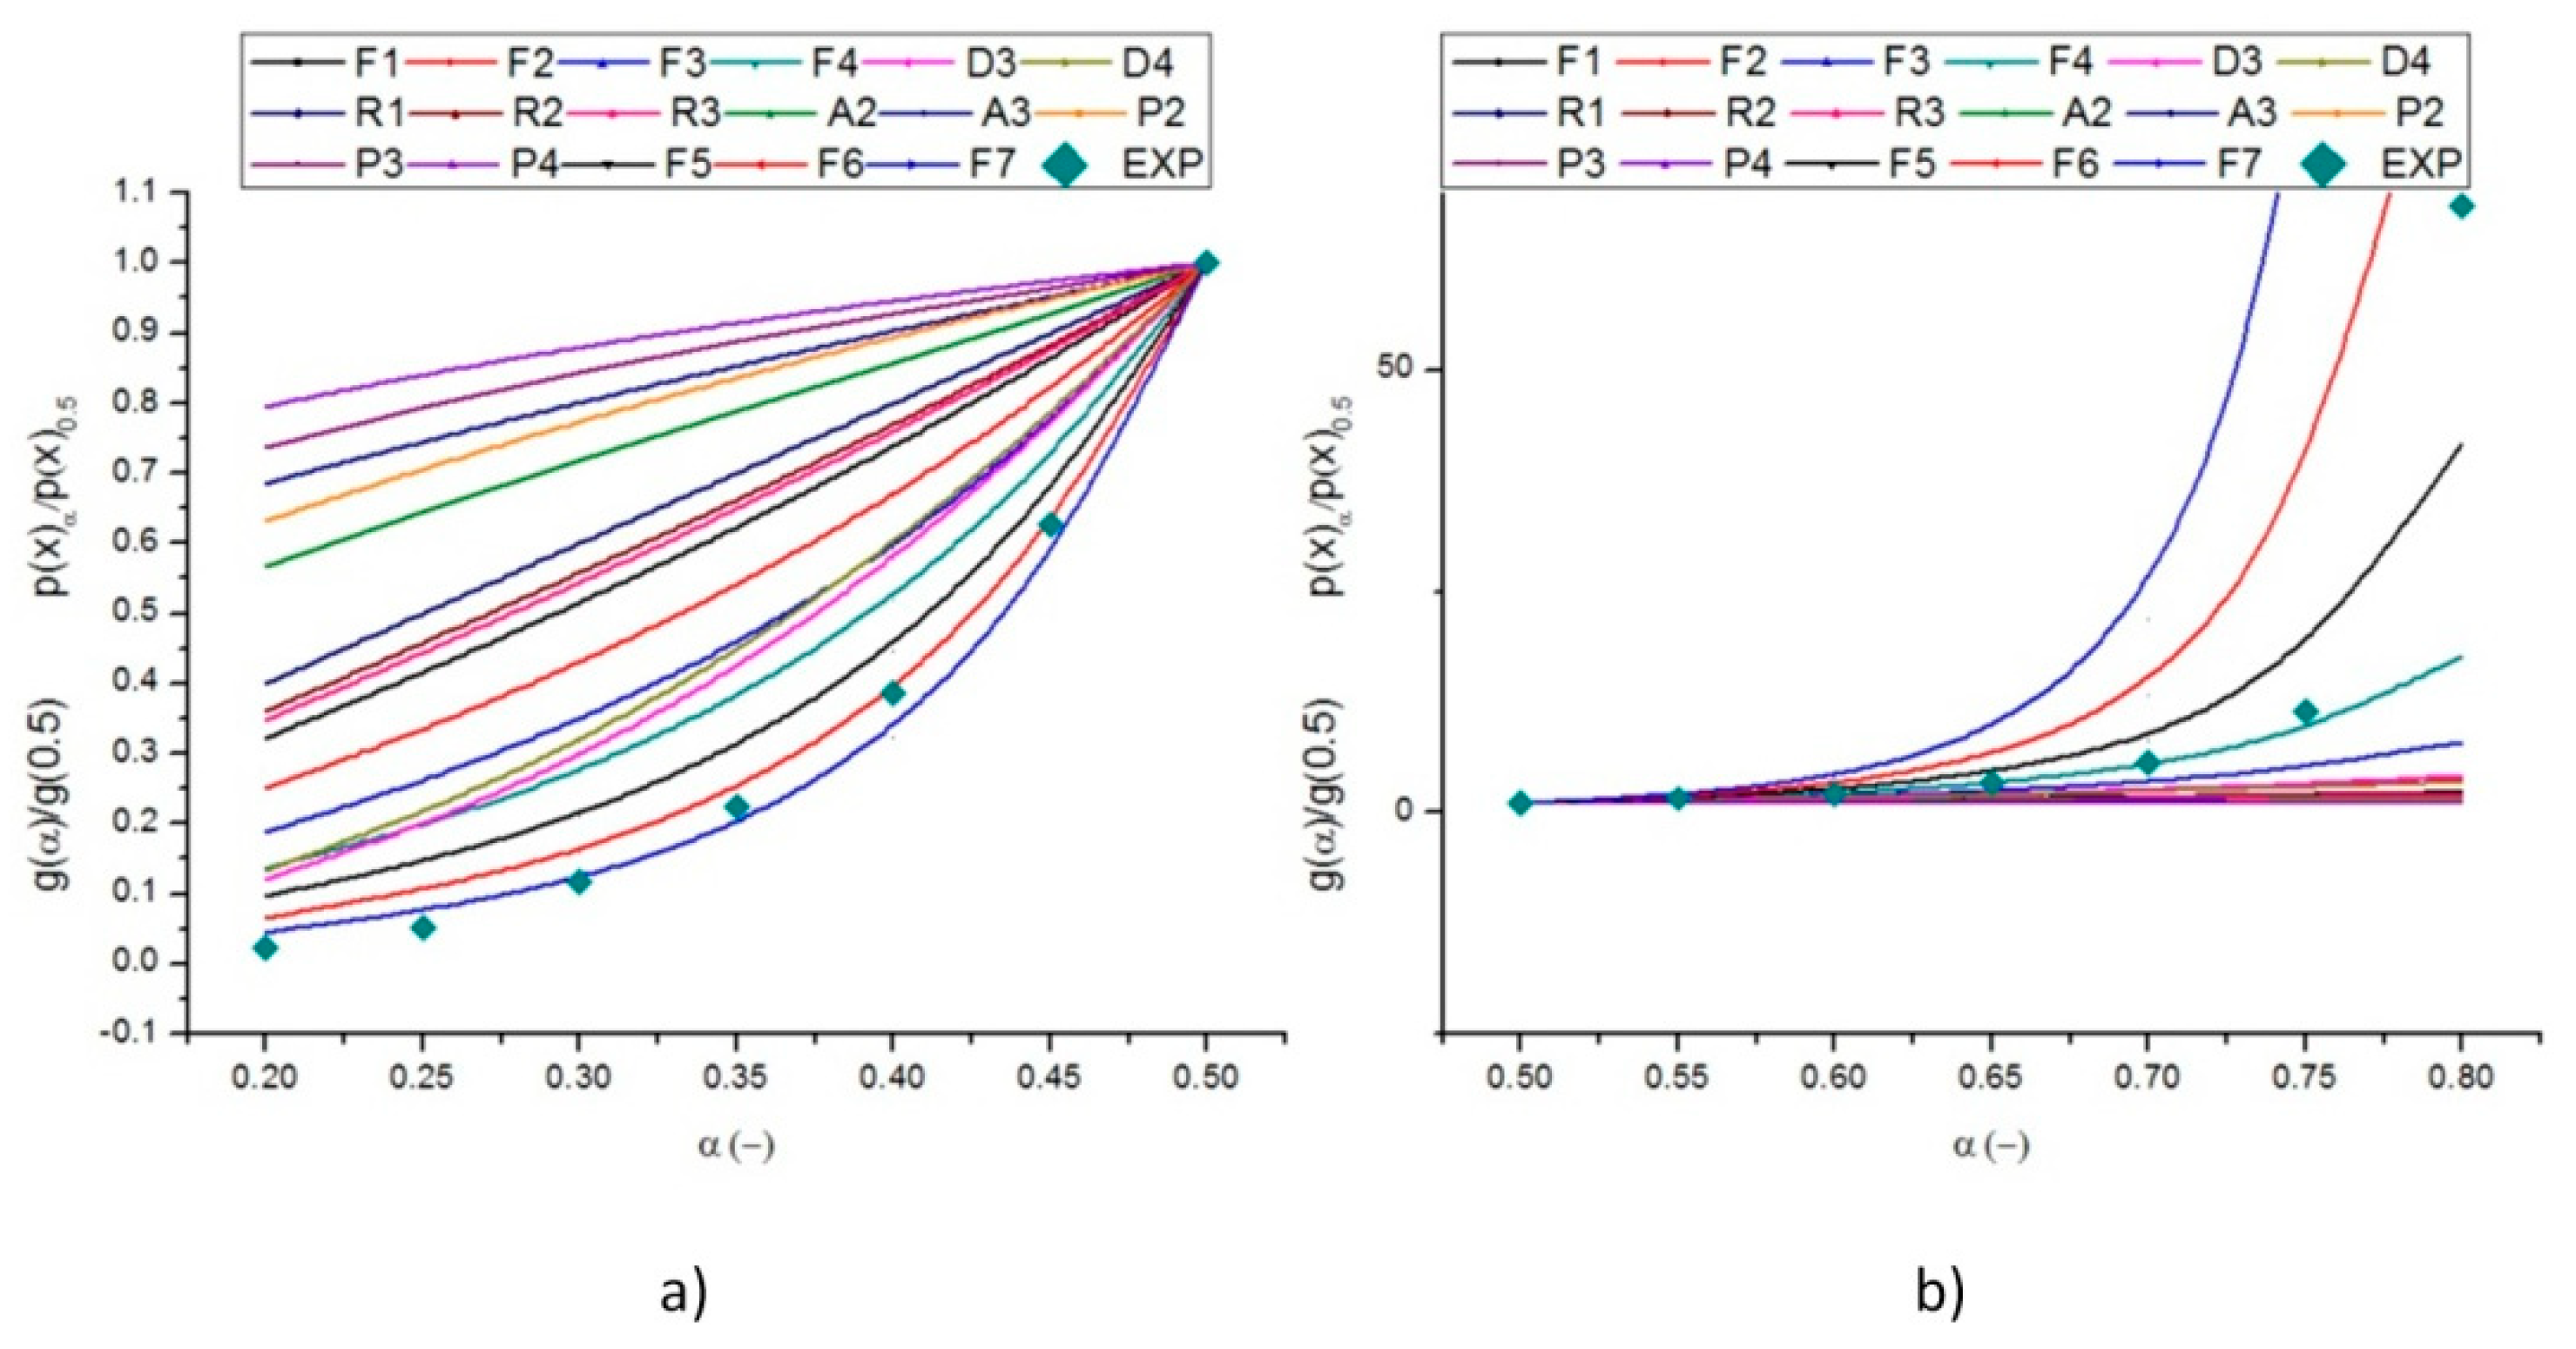
2.3. Identification of the Reaction Model
2.4. Independent Parallel Reactions Scheme
3. Materials and Methods
3.1. Sample Preparation
3.2. Experimental Setup
3.3. Kinetic Analysis through Iso-Conversional Methods
3.3.1. Master-Plots Method
3.3.2. Independent Parallel Reactions Scheme
4. Conclusions
Author Contributions
Funding
Acknowledgments
Conflicts of Interest
References
- Feng, Q.; Lin, Y. Integrated processes of anaerobic digestion and pyrolysis for higher bioenergy recovery from lignocellulosic biomass: A brief review. Renew. Sustain. Energy Rev. 2017, 77, 1272–1287. [Google Scholar] [CrossRef]
- Kosaric, N.; Blaszczyk, R. Industrial effluent processing. In Encyclopedia of Microbiology; Lederberg, J., Ed.; Academic Press Inc.: New York, NY, USA, 1992; Volume 2, pp. 473–491. [Google Scholar]
- D’Alessandro, B.; D’Amico, M.; Desideri, U.; Fantozzi, F. The IPRP (Integrated Pyrolysis Regenerated Plant) technology: From concept to demonstration. Appl. Energy 2013, 101, 423–431. [Google Scholar] [CrossRef]
- Neumann, J.; Binder, S.; Apfelbacher, A.; Gasson, J.R.; Ramirez Garcia, P.; Hornung, A. Production and characterization of a new quality pyrolysis oil, char and syngas from digestate—Introducing the thermo-catalytic reforming process. J. Anal. Appl. Pyrolysis 2015, 113, 137–142. [Google Scholar] [CrossRef]
- Gomez, X.; Cuetos, M.J.; Garcia, A.I.; Moran, A. An evaluation of stability by thermogravimetric analysis of digestate obtained from different biowastes. J. Hazard. Mater. 2007, 149, 97–105. [Google Scholar] [CrossRef] [PubMed]
- Otero, M.; Lobato, A.; Cuetos, M.J.; Sanchez, M.E.; Gomez, X. Digestion of cattle manure: Thermogravimetric kinetic analysis for the evaluation of organic matter conversion. Bioresour. Technol. 2011, 102, 3404–3410. [Google Scholar] [CrossRef]
- Zhang, D.; Wang, F.; Yi, W.; Li, Z.; Shen, X.; Niu, W. Comparison Study on Pyrolysis Characteristics and Kinetics of Corn Stover and Its Digestate by TG-FTIR. BioResources 2017, 12, 8240–8254. [Google Scholar]
- Doyle, C.D. Estimating isothermal life from thermogravimetric data. J. Appl. Polym. Sci. 1962, 6, 639–642. [Google Scholar] [CrossRef]
- Flynn, J.H.; Wall, L.A. A quick, direct method for the determination of activation energy from thermogravimetric data. Polym. Lett. 1966, 4, 323–328. [Google Scholar] [CrossRef]
- Ozawa, T. A new method of analyzing thermogravimetric data. Bull. Chem. Soc. Jpn. 1965, 38, 1881–1886. [Google Scholar] [CrossRef]
- Vyazovkin, S. Evaluation of activation energy of thermally stimulated solid state reactions under arbitrary variation of temperature. J. Comput. Chem. 1997, 18, 393–402. [Google Scholar] [CrossRef]
- Vyazovkin, S.; Burnham, A.K.; Criado, J.M.; Pérez-Maqueda, L.A.; Popescu, C.; Sbirrazzuoli, N. ICTAC Kinetics Committee recommendations for performing kinetic computations on thermal analysis data. Thermochim. Acta 2011, 520, 1–19. [Google Scholar]
- Vyazovkin, S. Isoconversional Kinetics of Thermally Stimulated Processes; Springer: Basel, Switzerland, 2015; pp. 1–239. [Google Scholar]
- Imtiaz, A. Comments on “Evaluating the bioenergy potential of Chinese Liquor-industry waste through pyrolysis, thermogravimetric, kinetics and evolved gas analyses” by Ye et al. [Energy Convers. Manage. 163 (2018) 13-21]. Energy Convers. Manag. 2018, 165, 869–870. [Google Scholar]
- Eyring, H. The activated complex and the absolute rate of chemical reactions. Chem. Rev. 1935, 17, 65–77. [Google Scholar] [CrossRef]
- Sánchez-Jiménez, P.E.; Pérez-Maqueda, L.A.; Perejón, A.; Criado, J.M. Generalized master plots as a straightforward approach for determining the kinetic model: The case of cellulose pyrolysis. Thermochim. Acta 2013, 552, 54–59. [Google Scholar] [CrossRef] [Green Version]
- Criado, J.M.; Málek, J.; Ortega, A. Applicability of the master plots in kinetic analysis of non-isothermal data. Thermochim. Acta 1989, 147, 377–385. [Google Scholar] [CrossRef]
- de Carvalho, V.S.; Tannous, K. Thermal decomposition kinetics modeling of energy cane Saccharum robustum. Thermochim. Acta 2017, 657, 56–65. [Google Scholar] [CrossRef]
- Jiang, G.; Nowakowski, D.J.; Bridgwater, A.V. A systematic study of the kinetics of lignin pyrolysis. Thermochim. Acta 2010, 498, 61–66. [Google Scholar] [CrossRef]
- Özsin, G.; Pütün, A.E. Kinetics and evolved gas analysis for pyrolysis of food processing wastes using TGA/MS/FT-IR. Waste Manag. 2017, 64, 315–326. [Google Scholar] [CrossRef]
- Varhegyi, G.; Antal, M.J.; Szekely, T.; Szabo, P. Kinetics of the thermal decomposition of cellulose, hemicellulose, and sugarcane bagasse. Energy Fuel 1989, 3, 329–335. [Google Scholar] [CrossRef]
- Wang, S.; Dai, G.; Yang, H.; Luo, Z. Lignocellulosic biomass pyrolysis mechanism: A state-of-the-art review. Prog. Energy Combust. 2017, 62, 33–86. [Google Scholar] [CrossRef]
- White, J.E.; Catallo, W.J.; Legendre, B.L. Biomass pyrolysis kinetics: A comparative critical review with relevant agricultural residue case studies. J. Anal. Appl. Pyrolysis 2011, 9, 11–33. [Google Scholar]
- Xu, Y.; Chen, B. Investigation of thermodynamic parameters in the pyrolysis conversion of biomass and manure to biochars using thermogravimetric analysis. Bioresour. Technol. 2013, 146, 485–493. [Google Scholar] [CrossRef]
- Mehmood, M.A.; Ye, G.; Luo, H.; Liu, C.; Malik, S.; Afzal, I.; Xu, J.; Ahmad, M.S. Pyrolysis and kinetic analyses of Camel grass (Cymbopogon schoenanthus) for bioenergy. Bioresour. Technol. 2017, 228, 18–24. [Google Scholar] [CrossRef] [PubMed]
- Lee, X.J.; Lee, L.Y.; Gan, S.; Thangalazy-Gopakumar, S.; Ng, H.K. Biochar potential evaluation of palm oil wastes through slow pyrolysis: Thermochemical characterization and pyrolytic kinetic studies. Bioresour. Technol. 2017, 236, 155–163. [Google Scholar] [CrossRef]
- Vamvuka, D.; Kakaras, E.; Kastanaki, E.; Grammelis, P. Pyrolysis characteristics and kinetics of biomass residuals mixtures with lignite. Fuel 2003, 82, 1949–1960. [Google Scholar] [CrossRef]
- Vyazovkin, S.; Chrissafis, K.; Di Lorenzo, M.L.; Koga, N.; Pijolat, M.; Roduit, B.; Sbirrazzuoli, N.; Sunol, J.J. ICTAC Kinetics Committee recommendations for collecting experimental thermal analysis data for kinetic computations. Thermochim. Acta 2014, 590, 1–23. [Google Scholar] [CrossRef]
- Wang, X.; Hu, M.; Hu, W.; Chen, Z.; Liu, S.; Hu, Z.; Xiao, B. Thermogravimetric kinetic study of agricultural residue biomass pyrolysis based on combined kinetics. Bioresour. Technol. 2016, 219, 510–520. [Google Scholar]
- Conesa, J.A.; Caballero, J.A.; Marcilla, A.; Font, R. Analysis of different kinetic models in the dynamic pyrolysis of cellulose. Thermochim. Acta 1995, 254, 175–192. [Google Scholar] [CrossRef]
- Antal, M.J.; Varhegyi, G. Cellulose Pyrolysis Kinetics: The Current State of Knowledge. Ind. Eng. Chem. Res. 1995, 34, 703–717. [Google Scholar] [CrossRef]
- Bartocci, P.; Anca-Couce, A.; Slopiecka, K.; Nefkens, S.; Evic, N.; Retschitzegger, S.; Barbanera, M.; Buratti, C.; Cotana, F.; Bidini, G.; et al. Pyrolysis of pellets made with biomass and glycerol: Kinetic analysis and evolved gas analysis. Biomass Bioenergy 2017, 97, 11–19. [Google Scholar] [CrossRef]
- Barbanera, M.; Cotana, F.; Di Matteo, U. Co-combustion performance and kinetic study of solid digestate with gasification biochar. Renew. Energy 2018, 121, 597–605. [Google Scholar] [CrossRef]
- Cai, J.; Xu, D.; Dong, Z.; Yu, X.; Yang, Y.; Banks, S.W.; Bridgwater, A.V. Processing thermogravimetric analysis data for isoconversional kinetic analysis of lignocellulosic biomass pyrolysis: Case study of corn stalk. Renew. Sustain. Energy Rev. 2018, 82, 2705–2715. [Google Scholar] [CrossRef]
- Anca-Couce, A. Reaction mechanisms and multi-scale modelling of lignocellulosic biomass pyrolysis. Prog. Energy Combust. Sci. 2016, 53, 41–79. [Google Scholar] [CrossRef]
- Starink, M. The determination of activation energy from linear heating rate experiments: A comparison of the accuracy of isoconversion methods. Thermochim. Acta 2003, 404, 163–176. [Google Scholar] [CrossRef]
- Aslan, D.I.; Parthasarathy, P.; Goldfarb, J.L.; Ceylan, S. Pyrolysis reaction models of waste tires: Application of Master-Plots method for energy conversion via devolatilization. Waste Manag. 2017, 68, 405–411. [Google Scholar] [CrossRef]
- Ceylan, S. Kinetic analysis on the non-isothermal degradation of plum stone waste by thermogravimetric analysis and integral Master-Plots method. Waste Manag. Res. 2015, 33, 345–352. [Google Scholar] [CrossRef] [PubMed]


| Heating Rate (°C/min) | Temperature * | DTGmax * | ||
|---|---|---|---|---|
| Ti (°C) | Tf (°C) | Tm (°C) | ||
| 5 | 184 (1) | 377 (3) | 319 (1) | 2.9 (0.5) |
| 10 | 188 (1) | 382 (2) | 329 (1) | 4.5 (0.7) |
| 20 | 190 (1) | 392 (3) | 346 (2) | 9.5 (0.9) |
| Pseudo-Component | Activation Energy | Pre-Exponential Factor | Reaction Order | |||
|---|---|---|---|---|---|---|
| Value | SD | Value | SD | Value | SD | |
| Cellulose | 189 kJ/mol | 15 kJ/mol | 4.7 × 10¹⁷ min−1 | 1.5 × 10¹⁶ min−1 | 1.0 | 0.1 |
| Hemicellulose | 151 kJ/mol | 21 kJ/mol | 4.4 × 10¹⁴ min−1 | 5.0 × 10¹² min−1 | 1.1 | 0.2 |
| Lignin | 64 k/mol | 7 kJ/mol | 6.3 × 10³ min−1 | 1.2 × 10³ min−1 | 1.6 | 1.1 |
| Solid Digestate | |
|---|---|
| Proximate analysis (wt.%, dry basis) | |
| Ash | 12.38 |
| Volatile Matter | 67.07 |
| Fixed Carbon | 20.55 |
| VM/FC | 3.29 |
| Ultimate analysis (wt.%, dry basis) | |
| C | 42.52 |
| H | 5.94 |
| N | 1.79 |
| O | 49.75 |
| Compositional analysis (wt.%, dry basis) | |
| Cellulose | 21.64 |
| Hemicellulose | 15.08 |
| Lignin | 40.88 |
| Extractives | 10.02 |
| Calorific value (MJ/kg, dry basis) | |
| Higher Heating Value | 19.74 |
| Mechanism | Symbol | f (α) | g (α) * |
|---|---|---|---|
| Order of reaction | |||
| First-order | F1 | 1 − α | −ln(1 − α) |
| Second-order | F2 | (1 − α)2 | (1 − α)−1 − 1 |
| Third-order | F3 | (1 − α)3 | [(1 − α)−2 − 1]/2 |
| Diffusion | |||
| One-way transport | D1 | 0.5α | α2 |
| Two-way transport | D2 | [−ln(1 − α)]−1 | (1 − α)ln(1 − α) + α |
| Three-way transport | D3 | 1.5(1 − α)2/3[1 − (1 − α)1/3]−1 | [1 − (1 − α)1/3]2 |
| Ginstling-Brounshtein equation | D4 | 1.5[(1 − α)–1/3]−1 | (1 − 2α/3) − (1 − α)2/3 |
| Limiting surface reaction between both phases | |||
| One dimension | R1 | 1 | α |
| Two dimensions | R2 | 2(1 − α)1/2 | 1 − (1 − α)1/2 |
| Three dimensions | R3 | 3(1 − α)2/3 | 1 − (1 − α)1/3 |
| Random nucleation and nuclei growth | |||
| Two-dimensional | A2 | 2(1 − α)[−ln(1 − α)]1/2 | [−ln(1 − α)]1/2 |
| Three-dimensional | A3 | 3(1 − x)[−ln(1 − x)]2/3 | [−ln(1 − x)]1/3 |
| Exponential nucleation | |||
| Power law, n =1/2 | P2 | 2α1/2 | α1/2 |
| Power law, n = 1/3 | P3 | 3α2/3 | α1/3 |
| Power law, n = 1/4 | P4 | 4α3/4 | α1/4 |
© 2019 by the authors. Licensee MDPI, Basel, Switzerland. This article is an open access article distributed under the terms and conditions of the Creative Commons Attribution (CC BY) license (http://creativecommons.org/licenses/by/4.0/).
Share and Cite
Bartocci, P.; Tschentscher, R.; Stensrød, R.E.; Barbanera, M.; Fantozzi, F. Kinetic Analysis of Digestate Slow Pyrolysis with the Application of the Master-Plots Method and Independent Parallel Reactions Scheme. Molecules 2019, 24, 1657. https://doi.org/10.3390/molecules24091657
Bartocci P, Tschentscher R, Stensrød RE, Barbanera M, Fantozzi F. Kinetic Analysis of Digestate Slow Pyrolysis with the Application of the Master-Plots Method and Independent Parallel Reactions Scheme. Molecules. 2019; 24(9):1657. https://doi.org/10.3390/molecules24091657
Chicago/Turabian StyleBartocci, Pietro, Roman Tschentscher, Ruth Elisabeth Stensrød, Marco Barbanera, and Francesco Fantozzi. 2019. "Kinetic Analysis of Digestate Slow Pyrolysis with the Application of the Master-Plots Method and Independent Parallel Reactions Scheme" Molecules 24, no. 9: 1657. https://doi.org/10.3390/molecules24091657