Article

Profiling of Seed Proteome in Pea (Pisum sativum L.) Lines Characterized with High and Low Responsivity to Combined Inoculation with Nodule Bacteria and Arbuscular Mycorrhizal Fungi

1
Department of Biochemistry, St. Petersburg State University, 199178 St. Petersburg, Russia
2
Department of Bioorganic Chemistry, Leibniz Institute of Plant Biochemistry, 06120 Halle (Saale), Germany
3
Department of Biotechnology, All-Russia Research Institute for Agricultural Microbiology, 196608 St. Petersburg, Russia
4
Department of Pharmaceutical Chemistry and Bioanalytics, Institute of Pharmacy, Martin-Luther Universität Halle-Wittenberg, 06120 Halle (Saale), Germany
5
R&D Department, Saint-Petersburg State Chemical and Pharmaceutical University, 197376 St. Petersburg, Russia
6
Department of Genetics and Biotechnology, St. Petersburg State University, 199034 St. Petersburg, Russia
*
Authors to whom correspondence should be addressed.
These authors contributed equally to the manuscript.
Molecules 2019, 24(8), 1603; https://doi.org/10.3390/molecules24081603
Submission received: 17 March 2019 / Revised: 14 April 2019 / Accepted: 18 April 2019 / Published: 23 April 2019
(This article belongs to the Special Issue CZE/LC-MS-based Proteomics)

Abstract

:
Legume crops represent the major source of food protein and contribute to human nutrition and animal feeding. An essential improvement of their productivity can be achieved by symbiosis with beneficial soil microorganisms—rhizobia (Rh) and arbuscular mycorrhizal (AM) fungi. The efficiency of these interactions depends on plant genotype. Recently, we have shown that, after simultaneous inoculation with Rh and AM, the productivity gain of pea (Pisum sativum L) line K-8274, characterized by high efficiency of interaction with soil microorganisms (EIBSM), was higher in comparison to a low-EIBSM line K-3358. However, the molecular mechanisms behind this effect are still uncharacterized. Therefore, here, we address the alterations in pea seed proteome, underlying the symbiosis-related productivity gain, and identify 111 differentially expressed proteins in the two lines. The high-EIBSM line K-8274 responded to inoculation by prolongation of seed maturation, manifested by up-regulation of proteins involved in cellular respiration, protein biosynthesis, and down-regulation of late-embryogenesis abundant (LEA) proteins. In contrast, the low-EIBSM line K-3358 demonstrated lower levels of the proteins, related to cell metabolism. Thus, we propose that the EIBSM trait is linked to prolongation of seed filling that needs to be taken into account in pulse crop breeding programs. The raw data have been deposited to the ProteomeXchange with identifier PXD013479.

Graphical Abstract

1. Introduction

Due to a variety of interactions with a wide range of beneficial soil microorganisms (BSM), legumes attract a special interest of microbiologists, molecular biologists, and plant biochemists [1,2,3]. Indeed, these plants can be involved in at least three forms of mutualistic plant–microbial interactions (symbioses): (i) with Glomeromycota fungi in arbuscular mycorrhizae (AM) [4], (ii) with nitrogen-fixing bacteria (rhizobia) in root nodules (legume–rhizobial symbiosis, LRS) [5], and (iii) with plant growth promoting bacteria (PGPB) [6]. The biological roles of these associations are clearly different. AM facilitates the assimilation of sparingly soluble phosphates by plant roots and increases efficiency of water consumption [4], whereas LRS acts as the basis for biological fixation of atmospheric nitrogen [3]. Interaction with PGPB additionally provides defense against pathogenic microorganisms suppressing their growth [7,8]. Moreover, synergistic effects of colonization with different BSM on legume plants are well characterized. Indeed, triple inoculation (i.e., simultaneous colonization with AM fungi, rhizobia, and PGPB) results in higher biomass and seed yields, compared to inoculation with only one or two BSM [1,9,10,11,12].
In general, formation of AM improves soil structure, whereas LRS results in accumulation of bioavailable nitrogen in soil [13]. Hence, these symbioses are beneficial for the whole rhizosphere [10,13]. Moreover, at the ecosystem level, legume–AM–rhizobial symbiosis may impact seedling development, plant biodiversity, and nutrition [14]. Therefore, cultivation of legumes can lead to reduction in use of mineral fertilizers and pesticides in favor of biological agents (i.e., these crops are ideal for sustainable agriculture) [15,16], making it possible to maintain their productivity under unfavorable conditions [9].
In general, the exact molecular mechanisms underlying the regulation of BSM-related symbiosis are still poorly understood, although the involvement of over 50 legume genes was confirmed (mostly encoding key players of signal transduction pathways and metabolic regulatory networks) [2]. On another hand, establishment of LRS [17] and AM [18] is accompanied by alterations in expression of thousands of genes, hundreds of which are represented by the so-called symbiosins [19]. Moreover, diverse transcriptional responses (known as specific genome-wide signatures) are associated with synergistic benefits of multiple interconnected mutualistic associations, as was shown, for example, for a tripartite association of Medicago truncatula, rhizobia, and AM fungi [20]. These changes in transcription patterns, in turn, directly affect proteome and metabolome profiles [21]. Thereby, due to the integrative character of plant regulatory systems, not only roots (as the organs, directly involved in interaction with bacteria and fungi), but also various parts of shoots, can response to inoculation with symbiotic organisms. Obviously, in the case of crop plants, it might affect commercial properties of plant-derived foods, which, for legumes, are mostly seeds. Due to the high importance of legume seeds for world production of food protein [22], symbiosis-related changes in seed proteome need to be comprehensively characterized. In this context, a bottom-up proteomic approach is a powerful tool to address both dynamics of individual proteins and patterns of post-translational modifications [23,24], potentially harmful to humans [25]. Certainly, these changes, related to root symbiosis, need to be considered in the context of plant biomass gain and seed productivity [24].
Pea (Pisum sativum L) is a wide-spread crop plant, highly variable in terms of efficiency of interaction with nodule bacteria Rhizobium leguminosarum and AM fungus Rhizophagus irregularis [26,27]. This variability, usually referred to as “efficiency of interaction with BSM” (EIBSM) can only be studied with complex BSM inoculants containing rhizobia and a combination of several AM fungi [1,28]. In a wide-scale study with 26 pea genotypes, a high efficiency of combined BSM inoculates in respect to biomass accumulation and seed protein contents was confirmed [29].
In this study we compare seed proteome profiles of the pea lines K-8274 (cv. Vendevil, France) and K-3358 (local landrace from Saratov region, Russia) [27], characterized with high and low EIBSM, respectively. The plants of both lines were grown in presence and absence of combined BSM. Thereby, inoculants contained R. leguminosarum and a combination of three different R. irregularis isolates. Comparison of these contrasting lines allowed to comprehensively characterize the changes in the proteomes of mature seeds related to complex mutual symbiosis. It also allowed uncovering the influence of the symbiotic efficiency trait on the development of seeds of different lines and identification the proteins likely responsible for the exhibited differences between the investigated lines.

2. Results

2.1. Biomass Gain and Seed Productivity

Previously, in three-year field trials, the line K-8274 has been chosen as a “standard” for high EIBSM, since it demonstrated a significant and stable increase in shoot and seed biomass upon the complex inoculation with AM fungi and nodule bacteria [29]. Interestingly, inoculation of the K-8274 plants with individual rhizobial or AM-fungal cultures did not result in increase of shoot or seed biomass production (Table S2-3) [30]. On another hand, simultaneous root colonization of the K-8274 plants with the same two BSM (i.e., rhizobia and AM fungi) resulted in significant gain in shoot and seed biomass (t-test: p = 0.02 and 0.004, respectively, Table S2-3). Based on this fact, we decided to investigate the phenomenon of high EIBSM in more detail, and addressed the alterations in seed proteome underlying high responsivity to combined inoculation with rhizobia and AM-fungi. For this, we reproduced the combined inoculation setup in a pot experiment with the high-EIBSM K-8274 plants in parallel to the line K-3358, characterized with low EIBSM [29]. Although the low EIBSM line K-3358 was characterized with a 23% and 25% higher degree (in comparison to the line K-8274) of shoot and seed biomass accumulation, respectively, its inoculation with the combination of two BSM did not give additional gain in productivity (Supplementary Material 2).

2.2. Protein Isolation and Tryptic Digestion

To achieve quantitative isolation of seed proteins, and the maximal coverage of a mature seed proteome, we decided for the phenol extraction procedure (Figure 1). The minimal concentration of the anionic acid-labile surfactant (AALS) required for quantitative solubilization of the protein was 0.15% (w/v), so it was used herein. According to the results of the Bradford assay, yields of the protein extraction were in the range of 63.6–175.0 mg/g fresh weight (Table S1-5). This was confirmed by the sodium dodecyl sulfate-polyacrylamide gel electrophoresis (SDS-PAGE) analysis, performed with the sample load, calculated based on the results of the Bradford assay [31]; the whole lane average intensities obtained with equal sample amounts (5 µg of protein) were 1.77 × 10⁴ ± 2.25 × 10³ (RSD = 12.7%). Thereby, the patterns of the signals, observed in the electropherograms were similar between lanes and treatment groups. The subsequent tryptic digestion (Figure 1) was considered to be complete, as the bands of major pea storage proteins, as legumin (α- and β- subunits, ∼40 and ∼20 kDa, correspondingly), vicilin (subunits of ∼29, ∼35, and ∼47 kDa) and convicilin (subunit of ∼71 kDa), were not detectable [31], assuming a staining sensitivity better than 30 ng [32] and a legumin content of at least 80% of the total seed protein [33].

2.3. Identification of Seed Proteins

Selection of an appropriate sequence database is the pre-requisite for successful identification of proteolytic peptides in enzymatic digests and, hence, reliable annotation of seed proteins. In this context, the use of reviewed databases, containing entries confirmed at the level of transcriptome or proteome, is advantageous. However, such information is not readily available for pea. Therefore, here we decided on a non-redundant combined database relying on several legume proteomes, closely related to pea—Medicago truncatula Gaertn, Lotus japonicas (Regel) K. Larsen, and Phaseolus vulgaris L. Earlier, to confirm the applicability of this database, we manually evaluated the MS/MS spectra of confidently identified peptides with the lowest values of the SEQUEST function XCorr [34]. As the spectra were acquired with the mass accuracy within 5 ppm, peptide sequences could be unambiguously assigned by characteristic patterns of N- and C-terminal ion series ( b and y ions, respectively) [31].
Analysis of the seed proteome of both lines resulted in confident identification of 3963 peptides in total (3557 and 3726 in the seeds of K-8274 and K-3358, respectively, Figure 2A, Supplementary Material 3). Based on this information, 5832 proteins were annotated (5195 in the seeds of K-8274 and 5593 in K-3358, Figure 2B), which represented 1500 non-redundant proteins (i.e., protein groups—1346 and 1425 in the seeds of K-8274 and K-3358, respectively, Figure 2C). For the line K-8274, 84 non-redundant proteins could be annotated only in the absence of BSM, whereas 103 features were found specifically in the seeds of inoculated plants. For K-3358, these values were 114 and 69, respectively (Figure 2C). The numbers of non-redundant proteins, not dependent on inoculation, were 1159 for the line K-8274 and 1242 for the line K-3358, with 1101 being, overall, common for both lines. Interestingly, only 12 such proteins were common between the seeds of both lines in combined symbiosis with rhizobia and AM fungi, and 15 proteins were common between the seeds of plants grown without BSM.

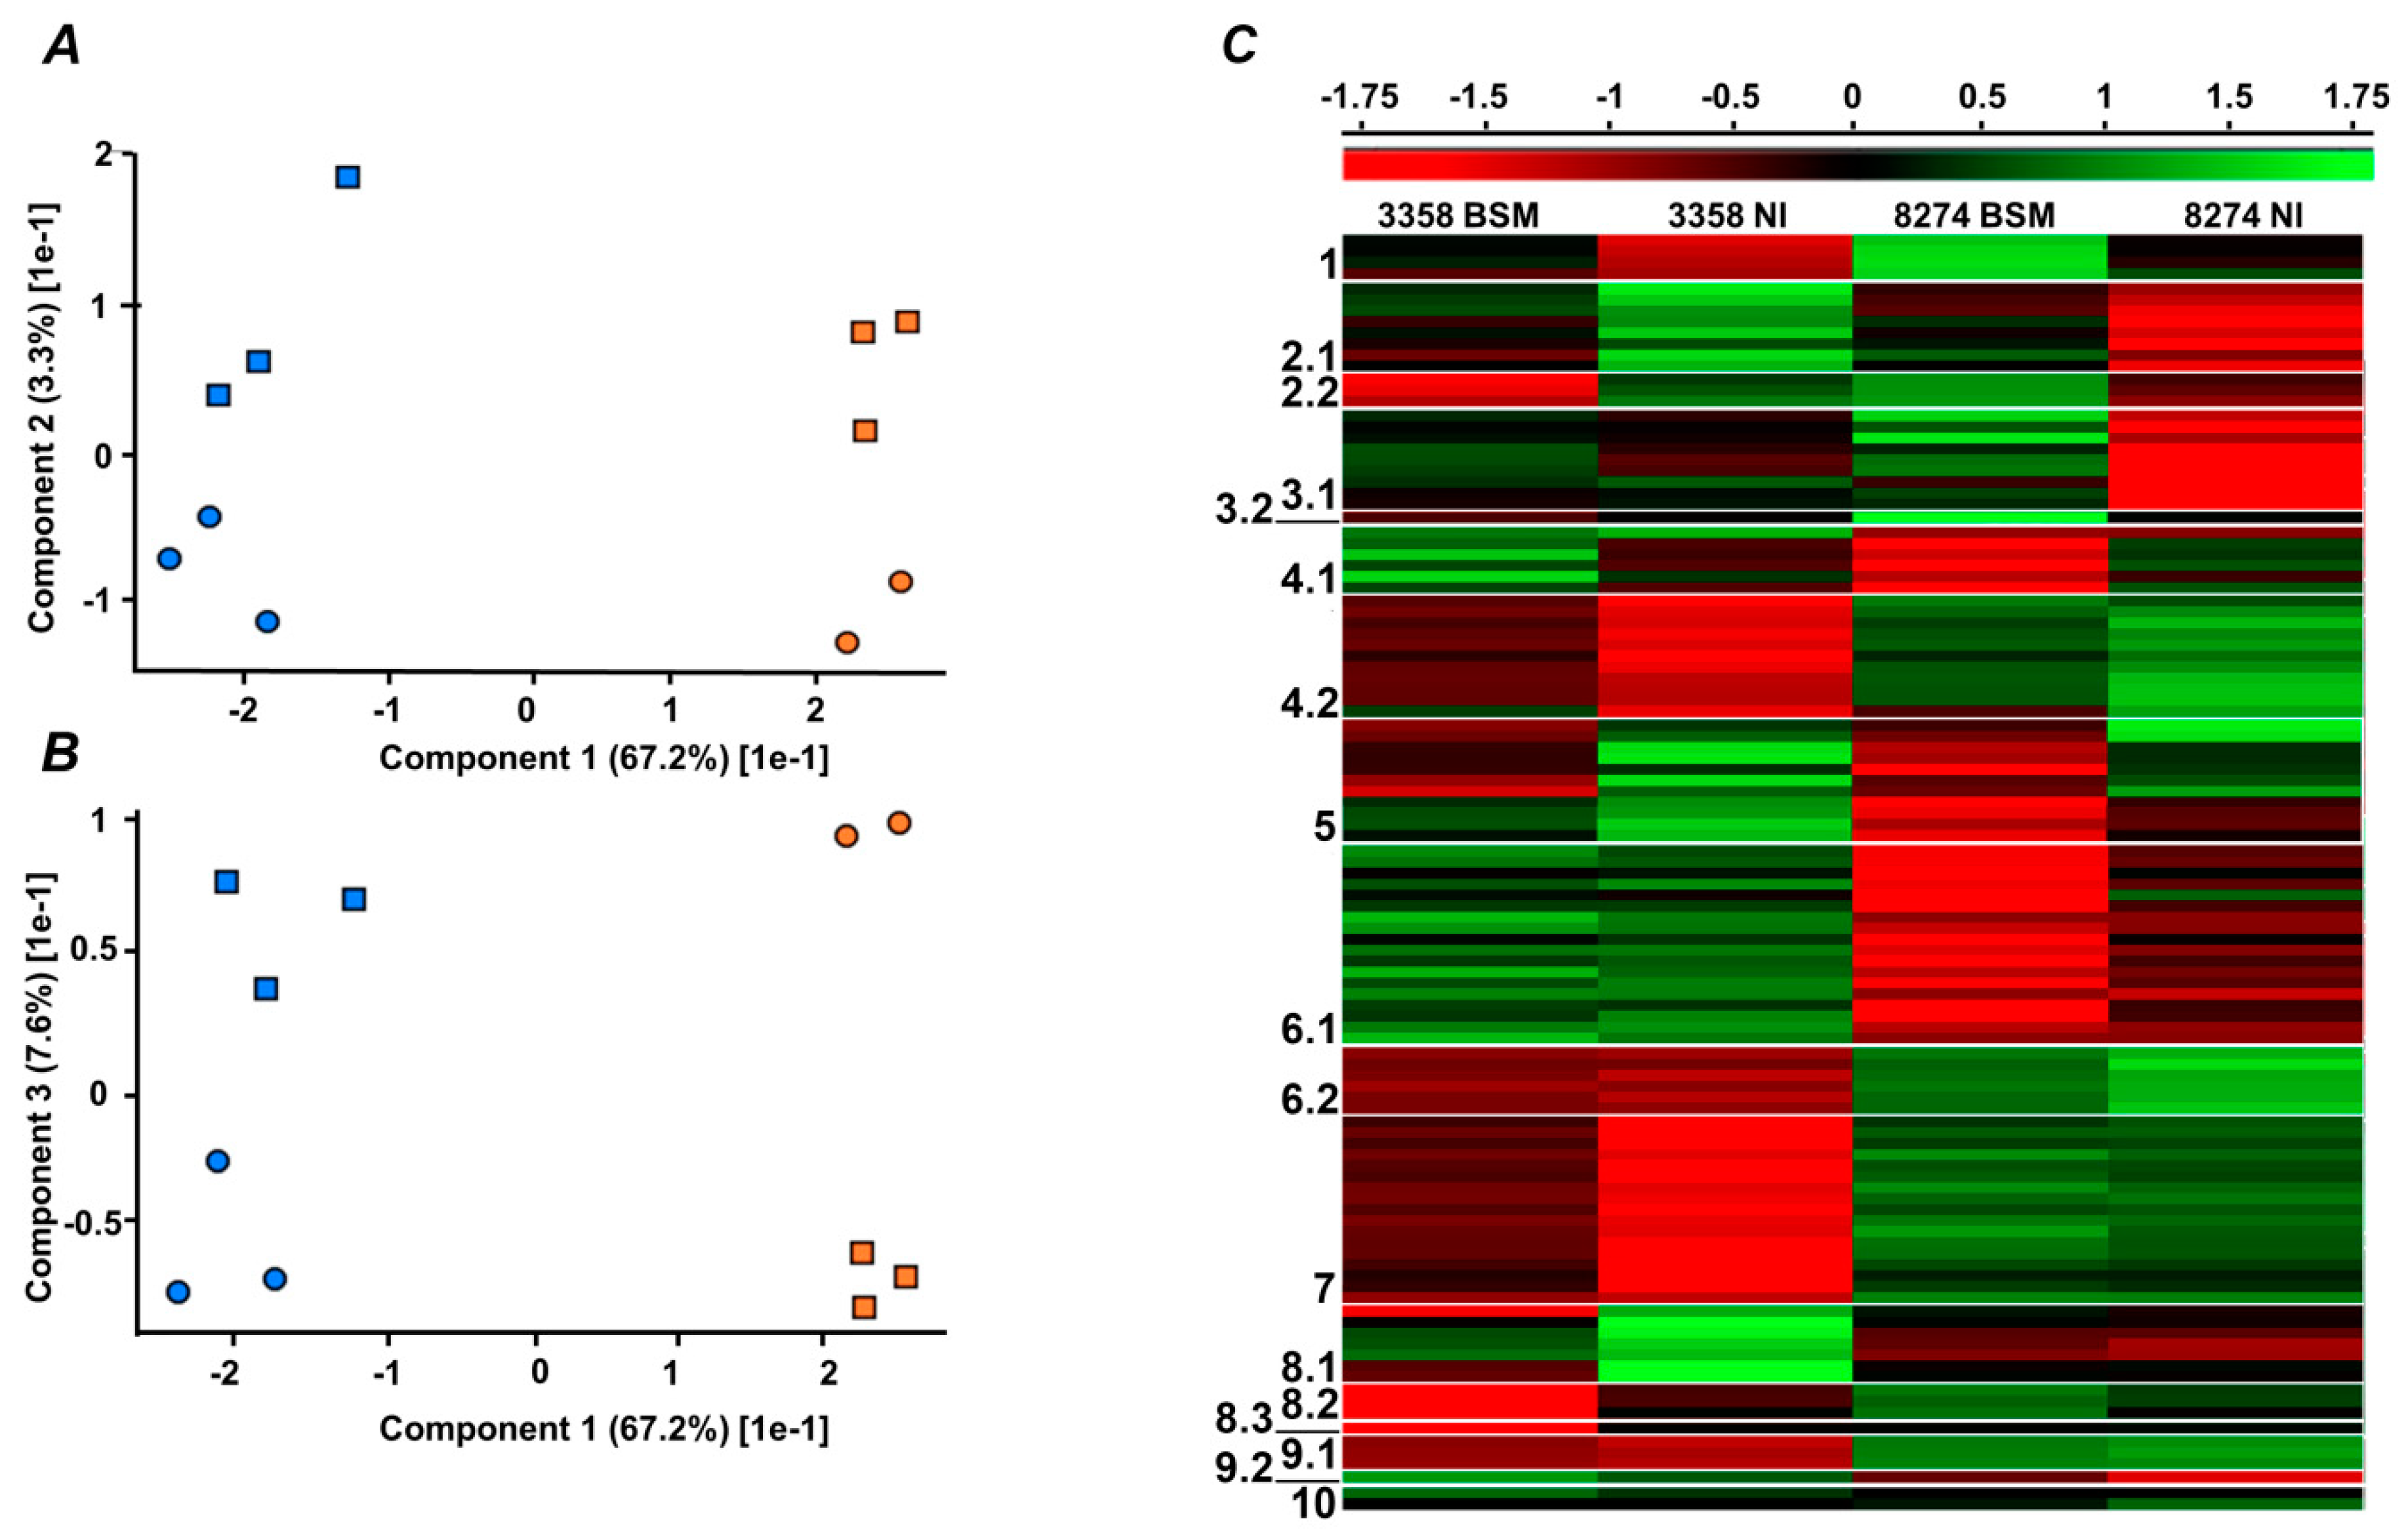
2.4. Label-Free Quantification

Analysis of the whole dataset with the Progenesis QIP software revealed 79 differentially expressed proteins (ANOVA, p ≤ 0.05). Additionally, a further 32 proteins were identified with the original redundant database, containing non-reviewed entries. The correctness of these identifications was confirmed by manual interpretation of the corresponding MS/MS spectra (Figure S1-2). Thus, 111 proteins were differentially expressed (as could be proved by verification of peak integration, Figure S1-5), in other words, demonstrated at least 1.5-fold significant abundance differences in intra- and inter-line comparisons (Table 1, Supplementary Material 4). One of the raw files (corresponding to one of the triplicates of not inoculated group of line K-8274) could not be satisfactory aligned to the whole dataset, and was therefore excluded from quantitative analysis.
Among regulated seed proteins, 84 were differentially expressed between the lines in the inoculated (BSM) and 99 in the not inoculated (NI) group. Remarkably, 36 and 61 proteins were more abundant in the BSM and NI groups of K-3358 plants, respectively, in comparison to the same groups of the K-8274 line. In contrast, the abundance of 48 and 38 proteins in BSM and NI groups of K-3358 plants was lower in comparison to K-8274 plants. Totally, 60 proteins in the seeds of K-8274 demonstrated inoculation-related changes in expression profiles (50 and 10 polypeptides were up- and down-regulated upon combined inoculation with BSM, respectively). For the line K-3358, these values were 31 and 29, respectively.
Principle component analysis (PCA) revealed clear differences between two lines, which could be distinguished by the first component (67.2% of difference, Figure 3A,B and Figure S1-3A,B corresponding loading plots are given on Figure S1-4). For each line, the differences between inoculated and not inoculated plants were much less pronounced, although clearly observable (3.3% and 7.6% differences in the components 2 and 3, respectively, Figure 3A,B, respectively). At the next step, hierarchical clustering was applied to classify individual differentially regulated proteins according to their intra- and inter-line differences in expression profiles. Based on the heat map, built for average values of each group (Figure 3C), all differentially expressed non-redundant proteins could be assigned to one of 17 individual groups, organized by similarity of expression profiles (Supplementary Material 4). The original results of data clustering in Perseus are given on Figure S1-3C. Finally, depending on the direction of protein expression changes, these groups (further referred to as sub-clusters) were organized in ten principle clusters. Thus, response of individual proteins to inoculation with combined BSM, could be expressed as “up-regulated”, “down-regulated”, and “not responsive” or “steady” relative to corresponding NI controls. Thus, combination of these regulation states in two lines yielded nine principle clusters (i.e., clusters 1–3, 4–6, and 7–9) comprising the proteins up-regulated, down-regulated, and not responsive in line K-8274, respectively, with different regulation status of the line K-3358 (Table 1). The last cluster (#10) comprised the proteins, identified only in one of the lines (Table 1).
The first principle cluster represented non-redundant proteins, abundance of which increased in the seeds of both lines in response to combined inoculation with BSM. Similarly, the fifth cluster represented the proteins with decreased abundances (i.e., down regulated) in both lines in response to the inoculation, whereas the non-responsive proteins built the ninth cluster. The proteins comprising the second cluster were up-regulated in the line K-8274, but down-regulated within line K-3358. This principle cluster consisted of two sub-clusters: The proteins, demonstrating the lowest abundance in (i) NI group of line K-8274, and (ii) in the BSM group of line K-3358. The proteins of the forth cluster demonstrated inverse response to inoculation. This principle cluster also consisted of two sub-clusters: Demonstrating the lowest abundance (i) in BSM group of line K-8274 and (ii) in the NI group of line K-3358. The next group of principle clusters was represented by the seed proteins, regulated by inoculation with BSM only in one of the lines. Thus, the proteins of the clusters 3 and 6 (both including two sub-clusters) were up- and down-regulated in the seeds of K-8274, respectively, but demonstrated a “steady” behavior in the line K-3358. Analogously, the proteins of the clusters 7 and 8 (represented by one and three sub-clusters, respectively) were up- and down-regulated in response to inoculation with BSM in the seeds of line K-3358, respectively, with no abundance changes in the seeds of the line K-8274. Finally, β-hexosaminidase was found only in the seeds of line K-3358, and probable S.7-like l-type lectin-domain containing receptor kinase was identified in the line K-8274. These two proteins comprised the last, tenth cluster.

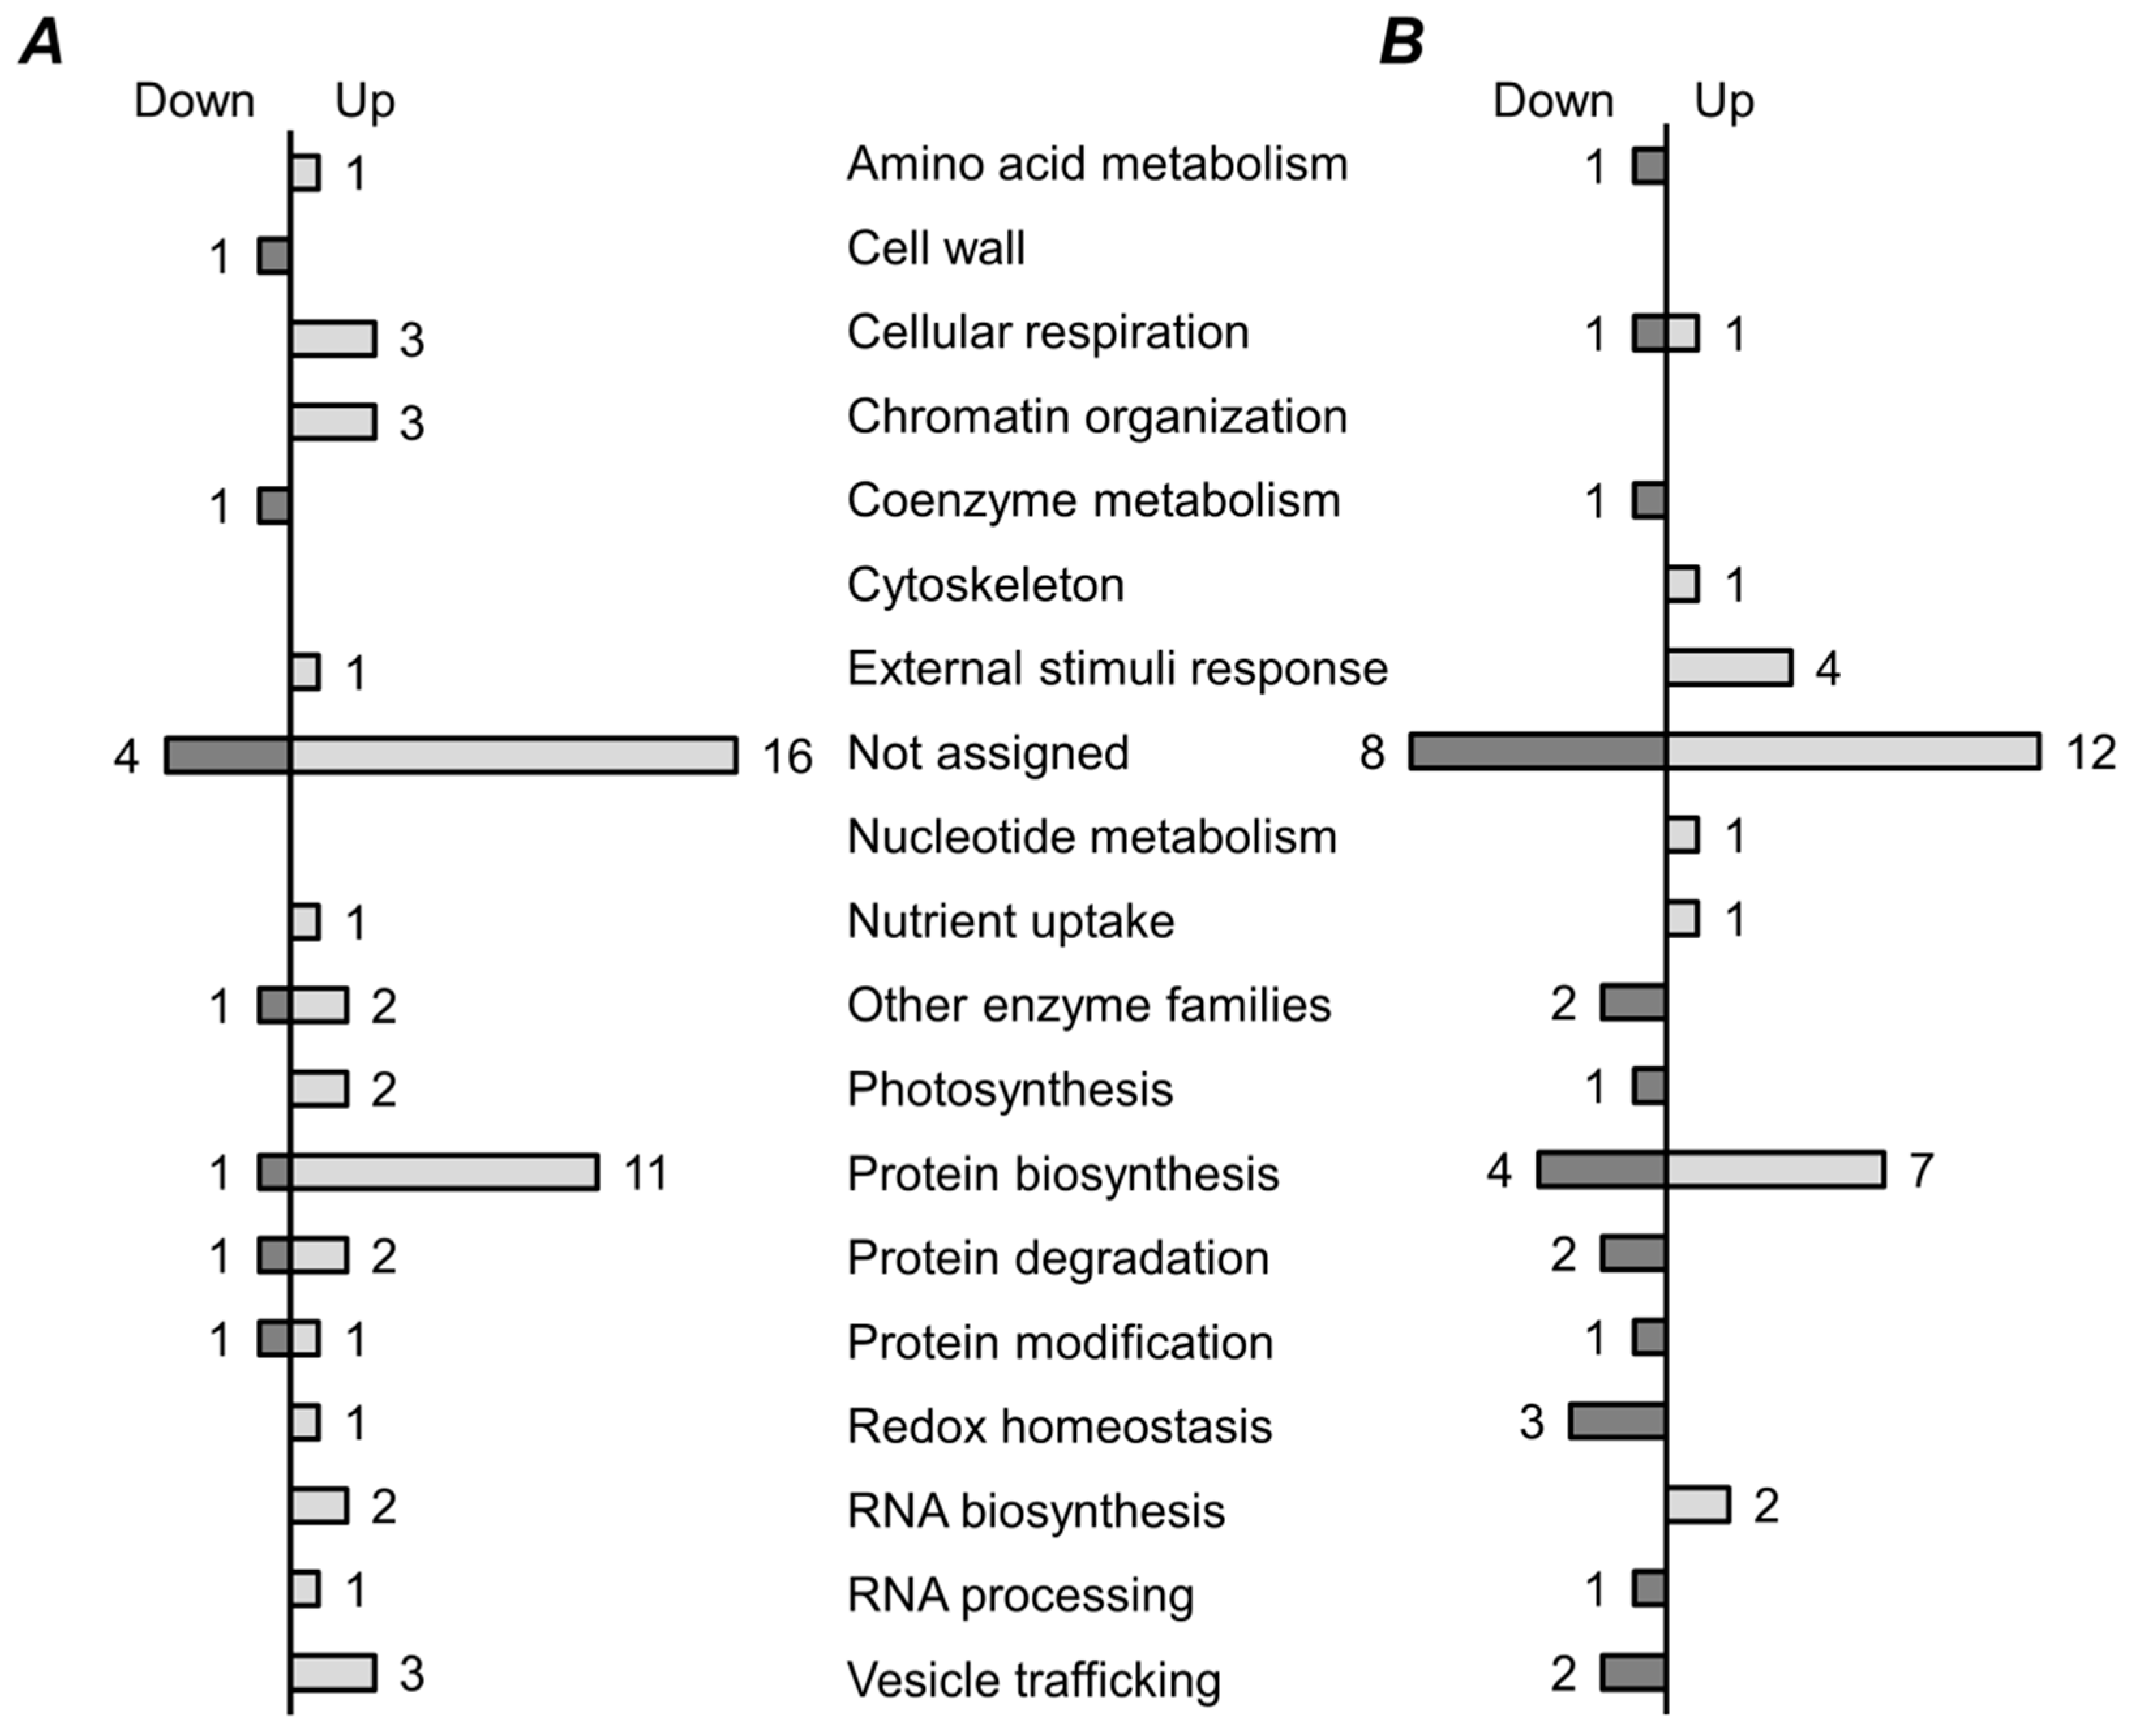
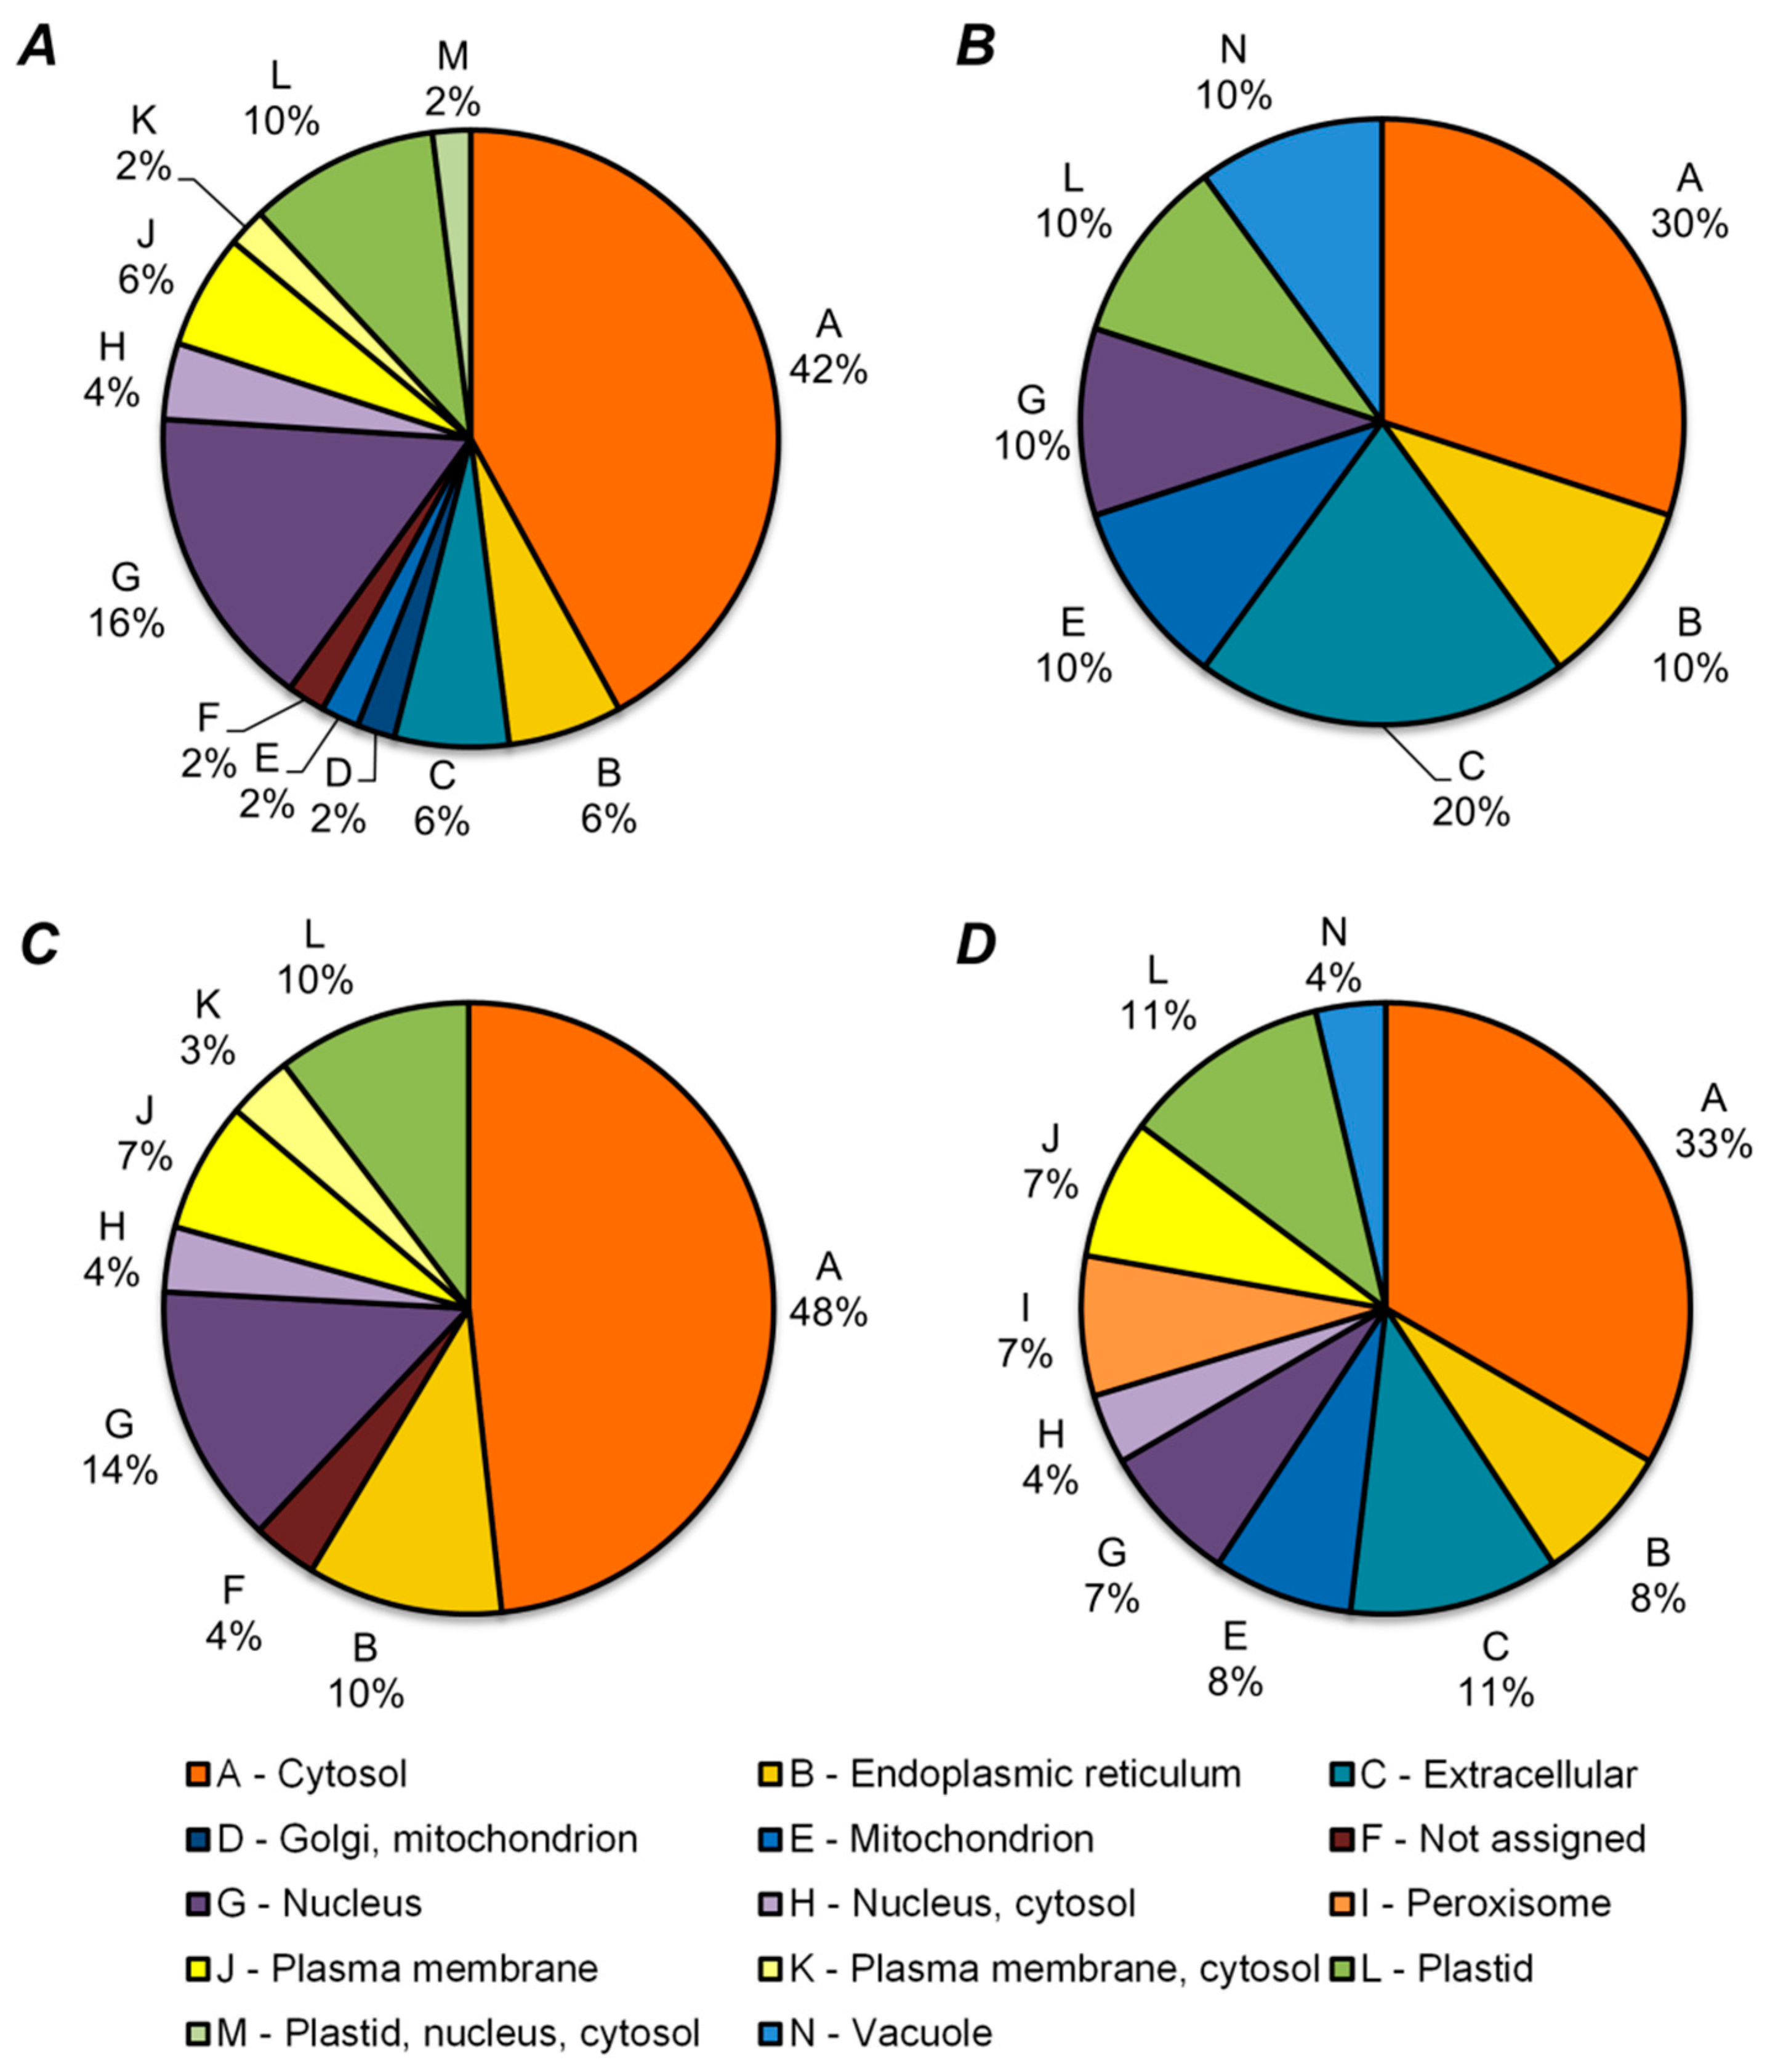
2.5. Functional Annotation of Differentially Regulated Proteins

Functional annotation of differentially expressed proteins relied on the Mercator tool, and revealed clear inter-line differences in functional profiles of regulated proteome (Supplementary Material 5). Forty of the 60 proteins, changing their abundance in the seeds of the high-EIBSM line K-8274 upon combined inoculation, were successfully assigned to specific functional bins. Totally, 50 of the 60 proteins (including 34 assigned to functional bins) were up-regulated (Figure 4A). Protein biosynthesis represented the most strongly affected function—only one polypeptide, namely 60S ribosomal protein L26-1, was down-regulated. Such processes as RNA biosynthesis, RNA processing, protein modification, and degradation were affected as well. Accordingly, symbiosis-related up-regulation of energy metabolism was observed: Three enzymes of cellular respiration and two enzymes involved in photosynthesis increased their abundance in response to colonization of K-8274 roots. Another strongly up-regulated function was chromatin organization—three different types of core histones increased their abundance, which was in line with the overall up-regulation of RNA and protein biosynthesis.
In agreement with the fact that approximately half of differentially expressed proteins were up-regulated in K-3358 seeds in response to interaction with BSM (31 of 60), the number of annotated up-regulated proteins was 17 out of overall 36 successfully annotated species (Figure 4B). Remarkably, in the seeds of the K-3358 plants, the proteins, involved in protein biosynthesis, showed more prominent difference in expression profiles: Besides the seven up-regulated polypeptides, four species, namely UTP-glucose-1-phosphate uridylyltransferase, 60S ribosomal protein L3B, and two poorly characterized probable structural constituents of ribosome, decreased their abundance after inoculation with BSM. The large number of polypeptides involved in protein biosynthesis, including ribosomal proteins and the EF2 elongation factor, were up-regulated in both lines upon inoculation with BSM. Interestingly, the exact set of ribosomal proteins, up-regulated in presence of symbiosis with BSM, was different in two lines, possibly reflecting the difference in response of the microorganisms to the symbiosis. The same was the case only for the proteins involved in cellular respiration (e.g., ATP synthase subunit alpha and probable triosephosphate isomerase), which were clearly up-regulated. The triosephosphate isomerase was shown to be required for post-germinative transition to autotrophic growth in seeds [36]. The significant increase of ATP-synthase abundance points at the significant increase in metabolism of the seeds of the line K-8274 upon symbiosis.
Remarkably, in the K-3358 line, several functional protein groups were exclusively down-regulated upon inoculation with BSM. This can be exemplified by the proteins involved in redox homeostasis (catalase, probable peroxiredoxin (UniProt ID B7FH22), and superoxide dismutase), protein degradation and modification (proteasome alpha subunit, serine carboxypeptidase-like protein, and glutathione S-transferase), and vesicle tracking (clathrin heavy chain and GDP-dissociation inhibitor). All these observations indicate a decrease in metabolic activity in the seeds of the low-EIBSM line in comparison to those of the high-EIBSM one. Interestingly, probable peroxiredoxin (B7FH22) and phosphoenolpyruvate carboxylase, involved in redox homeostasis and photosynthesis are down-regulated in this line, while they are among the up-regulated species in the seeds of the line K-8274 (Figure 4). Among the proteins without assigned functional category, a polypeptide annotated as an embryogenesis abundant protein, significantly decreased its abundance in seeds of K-8274 and increased it in K-3358. Proteins of this group were mostly found in seeds at late developmental stages [37] and can thus be related to seed maturity.
Prediction of cellular localization, performed for differentially expressed proteins, revealed cytosol as the major cellular fraction, responding to inoculation with BSM, although nuclear and plastid proteins were highly represented as well (Figure 5, Supplementary Material 5). Thus, plastid proteins constituted the most symmetrically changing group of proteins; in both lines, these species represented 10%–12% of up- and down-regulated polypeptides. On the other hand, the most variable groups were represented by extracellular (up to 20% of all of the proteins), membrane (up to 10%), and mitochondrial (up to 10%) proteins (Figure 5, Supplementary Material 5). Interestingly, vacuolar proteins represented the only down-regulated localization protein group within both lines (Figure 5B,D). Some proteins were identified exclusively in specific groups: One protein with shared localization in Golgi apparatus and mitochondrion was up-regulated within line K-8274, while two peroxisome proteins were found only down-regulated in line K-3358 (Figure 5A,D, respectively), also indicating a differential response of metabolism of the seeds to inoculation.

3. Discussion

3.1. Complex Inoculation Affects Seed Productivity only in the High-EIBSM Line K-8274

During the recent years, legume seed proteome was intensively studied [34,38]. Specifically, Sistani et al. addressed the changes in pea seed protein content upon inoculation with rhizobia and/or arbuscular-mycorrhizal fungi in the context of resistance to the pathogenic fungi Didymella pinodes [39]. Here we consider these inoculation-related effects with a specific focus to susceptibility of plants to inoculation with BSM. For this, we employ two pea lines with contrasting EIBSM as an efficient tool to dissect metabolic effects underlying the observed increase in seed protein contents. In agreement with this aim, we rely here on the methods of bottom-up proteomics—an efficient functional genomics tool, well-established in seed research during the last decade [40]. Recently, we validated our nanoHPLC-ion trap (IT)-Orbitrap-MS-based approach for label-free quantification and confirmed its high reliability, precision, and sensitivity [32]. In our earlier studies it proved to be well compatible with other functional genomics techniques [24].
At the level of morphology, the beneficial effect of complex inoculation (namely, increase in seed/shoot biomass and seed number) was observed for the high-EIBSM line K-8274, but not the low-EIBSM one K-3358, which was in agreement with the previous studies [41]. Thereby, as inoculation of K-8274 with individual BSM did not result in any significant beneficial effects on plant productivity [30], only the effects of complex inoculation (with rhizobia and AM fungi simultaneously) were addressed here. It is well known, that individual pea lines strongly differ in their response to inoculation with individual BSM and their combinations. Indeed, for the pea cultivar Messire, double inoculation was inefficient [42], whereas root colonization with an individual culture of rhizobia resulted in significant gain in seed weight [39]. This example clearly illustrates the importance of using contrasting genotypes for these kinds of studies.

3.2. Differences in Protein Expression Patterns between the Pea Lines with High and Low EIBSM

The overall success of comprehensive proteome characterization critically depends on proper protein identification methods. Therefore, here we applied a representative sequence database of legume species, closely related to pea. This approach proved to be efficient in our previous studies [44]. Thus, altogether 1500 non-redundant proteins were identified here (1346 and 1425 in the seeds of K-8274 and K-3358, respectively). Although it was slightly lower in comparison to the results of our recent comprehensive profiling of pea seed proteome [34], the conclusions drawn here are still based on the most complete, to the best of our knowledge, pea seed protein map.
In agreement with the results of Turetschek et al. [45], the effect of plant genotype on seed proteome signatures was more pronounced, than the impact of inoculation with BSM. Thus, due to the contrasting seed color (green and yellow for K-3358 and K-8274, respectively), several proteins related to photosynthesis were differently expressed in two analyzed lines. Indeed, the yellow color of seeds of the K-8274 plants was due to the lack of the active SGR (STAY GREEN) protein, involved in regulation of chlorophyll degradation, encoded by the gene I [46,47]. Further, the proteins involved in abscisic acid (ABA) signaling were clearly more abundant in the seeds of K-8274 in comparison to the seeds of the low-EIBSM line. The role of these molecules (17.6 kDa class I heat shock protein, translation elongation factor EF-2 subunit, UTP-glucose-1-phosphate uridylyltransferase, and ABA-responsive protein, Table 1, Supplementary information 4) in ABA signal transduction is well-characterized in non-legume species [48,49,50,51]. As ABA is a critical regulator of late steps of seed development [47], this observation might indicate inter-line differences in seed maturation rates. We also identified proteins differentially expressed in two lines that might indicate high polymorphism of pea seeds in respect of their proteome signatures. Thus, the approach relying on relative quantification of individual proteins might have a high value in breeding. This conclusion is supported by the work of Bourgeois et al. [52], where the genetic architecture of seed proteome variability was uncovered and the protein quantity loci, responsible for different seed protein composition and protein content, were identified.

3.3. Response of High- and Low-EIBSM Pea Lines to Inoculation with Rhizobia and Arbuscular Mycorrhiza

In general, the observed responses of seed proteome to inoculation with BSM could be classified as line-unspecific and line-specific. The non-specific responses manifested as up-regulation of the polypeptides, involved in protein biosynthesis and vesicle transport. This fact might indicate an improved availability of soil phosphorous and nitrogen. However, the number of such hits was lower in comparison to the proteins, demonstrating inter-line expression differences (as shown on the PCA plots on Figure 4A,B; corresponding loading plots on Figure S1-6). As these proteins could contribute on the observed difference in EIBSM, we addressed this group in more detail.
The analyzed lines showed a differential response to inoculation with BSM. Thus, K-8274 demonstrated stronger symbiosis-related differences in expression of seed proteins in comparison to the low-EIBSM line. Moreover, the functional patterns of the expression differences were clearly line-specific. Thus, inoculation of the low-EIBSM line K-3358 with two BSM resulted in down-regulation of the proteins involved in central and energy metabolism, as well as biosynthesis and post-translational modification of proteins. In agreement with this, the K-3358 plants inoculated with BSM completed seed development earlier, than corresponding not inoculated controls.
In contrast, inoculation of the high-EIBSM line K-8274 resulted in up-regulation of the polypeptides, involved in biosynthetic pathways, cellular respiration, detoxification of reactive oxygen species (ROS), and photosynthesis. One of the up-regulated biosynthetic enzymes, namely phosphoenolpyruvate carboxylase, was previously shown to be highly correlated with seed protein and lipid contents in soybean [53]. On another hand, a plastid protein with triose phosphate isomerase activity appeared to be up-regulated (Supplementary information 5, Table S5-1). A protein with this activity was earlier shown to be crucial for post-germinative switch from heterotrophic to autotrophic growth in Arabidopsis [36]. The observed inoculation-related changes might indicate a high level of cell metabolism, which is essential for seed filling and beneficial for seed development. Differential expression of some other proteins might be related to line-specific differences in interaction of pea plants with symbiotic bacteria. Thus, β-hexosaminidase, expressed exclusively in K-3358 seeds, was not earlier reported in the context of legume–rhizobial symbiosis. On the other hand, the S.7-like l-type lectin-domain containing receptor kinase, found only in the K-8274 seeds, can potentially be involved in the reception of microorganisms and thus potentially may represent a link between the inoculation and seed formation.
In agreement with this, the high-EIBSM line K-8274 demonstrated an inoculation-related down-regulation of late embryogenesis abundant (LEA) protein A0A072TMR3. This might indicate retardation of seed maturation. Indeed, a similar observation was done by Sistany et al. [39], who reported lower levels of LEA proteins in pea plants, inoculated with rhizobia, in comparison to corresponding non-inoculated controls. Thus, we assume that the high-EIBSM genotype of the K-8274 line might contribute to the prolongation of the immature stage of seed development upon the inoculation with BSM, whereas the low-EIBSM line K-3358 did not respond to complex symbiosis in this way. Recently, we have shown that arbuscular mycorrhiza results in prolongation of the pea life cycle (Shtark et al., under revision). Therefore, we assume the mycorrhizal component of the inoculum to be the main contributor to the inoculation-related seed biomass increase, observed in this study for the high-EIBSM K-8274 line.
Another important marker of the inoculation-related retardation in seed maturation is 1,2-dihydroxy-3-keto-5-methylthiopentene dioxygenase—an enzyme involved in methionine salvage and annotated here by the M. truncatula part of our combined sequence database as MEDTR1G102870.1. According to the M. truncatula gene expression atlas [54], this enzyme is expressed in most of the tissues. Thereby, in seeds, it shows a characteristic expression pattern (i.e., its abundance decreases from the 10th to the 24th day after pollination (DAP), and increases until the 36th DAP. Under symbiotic conditions, this increase in abundance was four-fold in the seeds of K-8274, whereas this enzyme was two-fold down-regulated in the seeds of K-3358 plants, inoculated with BSM. This observation was in agreement with the here proposed prolongation of the immature stage of seed development in the high-EIBSM line upon the inoculation with BSM. As MEDTR1G102870.1 can be a promising marker of this “prolonged seed youth” phenomenon, expression levels of the corresponding gene and kinetics of the enzymatic reaction product deserve to be determined in future studies.

3.4. Ecological and Agricultural Aspects of the High-EIBSM Trait

Most probably, the differential response to inoculation with BSM (i.e., low- and high-EIBSM traits) reflects two strategies of nitrogen assimilation upon its supplementation: Some genotypes demonstrate prolonged seed filling under optimal nitrogen supply conditions, whereas the others complete seed development as fast as possible (reminiscent to r- and K-strategies characteristic for different higher organisms [55]). Obviously, representation of the both strategies in a population might increase its overall adaptation flexibility. On another hand, the difference in response to available nitrogen can be attributed to the breeding history of individual pea varieties and cultivars. In this context, we assume that the plants of the low-EIBSM line prioritize the speed of seed maturation over the maximization of the nutrient content of the seeds. Interestingly, the K-3358 plants develop multiple reproductive nodes (i.e., new seeds can form during the whole ontogenesis). In contrast, the K-8274 plants can produce only a limited number of reproductive nodes, and, hence, develop a limited pre-determined number of pods and seeds, in which the available resources invested. Thus, K- and r-strategies of different pea genotypes might reflect corresponding growth patterns. Most probably, at the metabolic level, these strategies can be due to differences in (i) nitrogen sensing, (ii) efficiency of nitrogen uptake from soil or efficiency of its fixation in nodules, and (iii) assimilation of nitrogen by the seeds.
Seed development is, metabolically, closely associated with re-mobilization of nitrogen from vegetative tissues to seeds, which triggers leaf senescence and shortens seed filling period [56]. On another hand, mycorrhization prolongs the metabolically active stages of leaf ontogenesis (i.e., Shtark et al., under revision). Thus, high-EIBSM genotypes, like K-8274, represent well-balanced systems with improved efficiency of seed filling due to a longer immature stage in seed development. Therefore, such genotypes give access to higher biomass gain. Hence, involvement of high-EIBSM lines in breeding programs might increase the overall agricultural efficiency. One needs to keep in mind; however, that environmental stress, like drought, common in most pea culturing countries, might eliminate the favorable effects of symbiosis with BSM [57]. Therefore, additional experiments in adequate drought models [58] are necessary to address inoculation of high-EIBSM pea plants with BSM under conditions of environmental stress.

4. Materials and Methods

4.1. Reagents

Unless stated otherwise, materials were obtained from the following manufacturers. Carl Roth GmbH and Co (Karlsruhe, Germany): acetonitrile (≥99.95%, LC-MS grade), ethanol (≥99.8%), sodium dodecyl sulfate (SDS) (>99%), tris-(2-carboxyethyl)-phosphine hydrochloride (TCEP, ≥98%); PanReac AppliChem (Darmstadt, Germany): acrylamide (2K Standard Grade), glycerol (ACS grade); AMRESCO LLC (Fountain Parkway Solon, OH, USA): ammonium persulfate (ACS grade), glycine (biotechnology grade), N,N′-methylene-bis-acrylamide (ultra-pure grade), tris(hydroxymethyl)aminomethane (tris, ultra-pure grade), urea (ultra-pure grade); Bioanalytical Technologies 3M Company (St. Paul, MN, USA): Empore™ solid phase octadecyl extraction discs; Component-Reactiv (Moscow, Russia): phosphoric acid (p.a.); Reachem (Moscow, Russia): hydrochloric acid (p.a.), isopropanol (reagent grade), potassium chloride (reagent grade); SERVA Electrophoresis GmbH (Heidelberg, Germany): Coomassie Brilliant Blue G-250, 2-mercaptoethanol (research grade), trypsin NB (sequencing grade, modified from porcine pancreas); Thermo Scientific (Waltham, MA, USA): PierceTM Unstained Protein Molecular Weight Marker #26610 (14.4–116.0kDa); Dichrom GmbH (Marl, Germany): Progenta™ anionic acid labile surfactant II (AALS) and adaptors for stage-tips; Vekton (Saint-Petersburg, Russia): sucrose (ACS grade). All other chemicals were purchased from Sigma-Aldrich Chemie GmbH (Taufkirchen, Germany). Water was purified in house (resistance 5–15 mΩ/cm) on a water conditioning and purification system «Elix 3 UV» (Millipore, Moscow, Russia). The seeds of pea (Pisum sativum L) lines with accession numbers K-8274 (cultivar Vendevil, France) and K-3358 (local landrace from Saratov region, Russia), characterized by high and low EIBSM, respectively, were initially obtained from the collection of the Vavilov Institute of Plant Genetic Resources (St. Petersburg, Russia) and were propagated prior to the experiment in ARRIAM (St. Petersburg, Russia).

4.2. AM Fungal Inoculum

The AM inoculum relied on a combination of three R. irregularis strains, namely BEG144, BEG53 (both provided by the International Bank for the Glomeromycota, Dijon, France), and ST3 (All-Russia Research Institute for Agricultural Microbiology, Saint-Petersburg) [59]. All isolates were cultured individually in a sand/soil mixture (1:1 v/v) using Plectranthus australis R. Br. as a host plant. To obtain the inoculum of AM fungi, the seeds of sorghum (Sorghum sp.) were surface sterilized with a 0.15% (w/v) aqueous solution of potassium permanganate for 15 min, and transferred to pots, filled with a soil-based substrate (pH 7) containing dried P. australis roots colonized with the three above mentioned R. irregularis strains. After about 120 days of vegetation, the colonized sorghum roots were separated from the substrate, cut into 1 cm pieces, dried and mixed with the substrate to establish the inoculum.

4.3. Plant Experiments and Characterization of Biomass Gain and Seed Productivity

The seeds were surface sterilized with concentrated sulfuric acid, rinsed with sterile water, germinated on wet vermiculite for three days in darkness at 25 °C, planted in 5 L pots filled with sod-podzolic light loamy soil (five plants per pot), and inoculated with 150 ml of water suspension (106 CFU * l-1) of symbiotic bacteria (Rhizobium leguminosarum bv. viciae RCAM1026) [60] in combination with prepared inoculum (see previous section). Thereby, the planted seeds (n = 5) were overlaid with 30 g/pot of the AM fungal inoculum (see previous section). Before planting, the weight of pots was adjusted with soil to obtain the same value. The plants were grown under non-controlled light and temperature conditions in a vegetation house of the All-Russia Research Institute for Agricultural Microbiology, St. Petersburg (June–August 2016). Formation of AM was verified on the 28th day after germination by light microscopy, as described by Shtark et al. [61]. The plants were harvested at the stage of mature seeds (3 months after planting), and the dry weight of aerial part, the weight of seeds and the total number of seeds per plant, were recorded. Data processing and statistical evaluation was done with SigmaPlot 12.0 software (Systat Software, San Jose, CA, USA).

4.4. Protein Isolation

Pea seeds (10 per biological replicate) were frozen in liquid nitrogen and ground in a Mixer Mill MM 400 ball mill with a Ø 20 mm stainless steel ball (Retsch, Haan, Germany) at a vibration frequency of 30 Hz for 2 × 1 min, and kept on dry ice prior to protein extraction. The total protein fraction was isolated from the frozen ground material by phenol extraction, as described by Frolov and co-workers [62] with some modifications. Briefly, approximately 50 mg of plant material (placed in 2 mL polypropylene tubes) were put on ice, and one minute later supplemented with 700 µL of cold (4 °C) phenol extraction buffer, containing 0.7 mol/L sucrose, 0.1 mol/L KCl, 5 mmol/L ethylenediaminetetraacetic acid (EDTA), 2% (v/v) mercaptoethanol, and 1 mmol/L phenylmethylsulfonyl fluoride (PMSF) in 0.5 mol/L tris-HCl buffer (pH 7.5). After vortexing for 30 s, 700 µL of cold phenol (4 °C) saturated with 0.5 mol/L tris-HCl buffer (pH 7.5) were added. Samples were vortexed for 30 s, shaken for 30 min at 900 rpm (4 °C), and centrifuged at 5000 g for 30 min (4 °C). The upper phenolic phase was collected in new 1.5 mL polypropylene tubes, and washed two times with equal volumes of the phenol extraction buffer (vortexing 30 s, shaking for 30 min at 900 rpm, at 4 °C and centrifugation at 5000 g for 15 min at 4 °C). The proteins were precipitated by adding a five-fold volume of ice-cold methanolic 0.1 mol/L ammonium acetate overnight at −20 °C. The next morning, the samples were centrifuged (10 min, 5000 g, 4 °C), and the supernatants were discarded. The pellets were washed twice by re-suspending in two volumes (relative to the volume of the phenol phase) of ice-cold methanol, and twice with the same volume of ice-cold acetone. After re-suspending, the samples were centrifuged (5000 g, 10 min, 4° C). The pellets were dried under air flow, reconstituted in 100 µL of shotgun buffer (8 mol/L urea, 2 mol/L thiourea, 0.15% AALS in 100 mmol/L tris-HCl, pH 7.5), and protein contents were determined by Bradford assay performed in a 96-well plate format according to Schmidt and co-workers [63]. The results of the assay were validated by SDS-PAGE as described by Greifenhagen and co-workers [64].

4.5. Tryptic Digestion

The tryptic digestion was performed as described by Frolov and co-workers [65] with minor modifications. In detail, the 70 µg aliquots of protein were supplemented with the shotgun buffer (see previous section) and 10 µL of 50 mmol/L TCEP (prepared in the shotgun buffer without AALS) to obtain a total volume of 100 µL. Disulfides were reduced during 30 min at 37 °C under continuous shaking (450 rpm). After cooling the samples to room temperature (RT), the proteins were alkylated with iodoacetamide (11 µL, 0.1 mol/L in 50 mmol/L aq. NH4HCO3) during 60 min at 4 °C in darkness. Afterwards, the samples were diluted with 875 µL of 50 mmol/L ammonium bicarbonate, and trypsin (0.5 g/L in 50 mmol/L aq. NH4HCO3) was added twice at the enzyme/protein ratio of 1:20 and 1:50. The proteins were hydrolyzed at 37 °C under continuous shaking (450 rpm) for 5 and 12 h, respectively. The completeness of tryptic digestion was verified by SDS-PAGE (as described above), and AALS was destroyed by addition of 103 µL of 10% (v/v) trifluoroacetic acid (TFA, final concentration 1% v/v) and incubation for 20 min at 37 °C under continuous shaking (450 rpm). Afterwards, the digests were desalted by solid phase extraction (SPE) using in-house prepared stage-tips (i.e., polypropylene pipette tips (200 µL) filled with six layers of C18 reversed phase material (Empower™ SPE discs)) [34]. The eluents were driven by centrifugal force (2500× g) after placing stage-tips in 2 mL polypropylene tubes using appropriate adaptors. The stage-tips were conditioned with 200 µL of methanol, equilibrated with 200 µL 0.1% (v/v) trifluoroacetic acid (TFA), before samples were loaded and washed with two 200 µL-portions of 0.1% (v/v) formic aid (FA). Afterwards, stage-tips with adaptors were transferred in new polypropylene tubes, and retained peptides were sequentially eluted with 40%, 60%, and 80% (v/v) acetonitrile in aqueous (aq.) 0.1% (v/v) FA, as proposed by Spiller and co-workers [66]. The resulting eluates were freeze-dried overnight under reduced pressure in a CentriVap Vacuum Concentrator (Labconco, Kansas City, MO, USA), and stored at −20 °C before analysis.

4.6. LC-MS Experiments

Individual tryptic digests (500 ng, 10 µL) dissolved in 3% (v/v) acetonitrile in 0.1% (v/v) aq. TFA were loaded onto an Acclaim PepMap 100C18trap column (300 µm × 5 mm, 3 µm particle size) during 15 min at the flow rate of 30 µL/min. Peptides were separated at the flow rate of 300 nL/min on an Acclaim PepMap 100C18 column (75 µm × 250 mm, particle size 2 µm) using an Ultimate 3000 RSLC nano-HPLC system coupled on-line to an Orbitrap Fusion Tribrid mass spectrometer via a nano-ESI source equipped with a 30 µm ID, 40 mm long steel emitter (all Thermo Fisher Scientific, Bremen, Germany). The eluents A and B were 0.1% (v/v) aq. FA and 0.08% (v/v) aq. FA in acetonitrile, respectively. The peptides were eluted with linear gradients ramping from 1% to 35% B over 90 min, followed by 35% to 85% eluent B over 5 min. The column was washed for 5 min, and re-equilibrated at 1% eluent B for 10 min. The nano-LC-Orbitrap-MS analysis relied on data-dependent acquisition (DDA) experiments performed in the positive ion mode, comprising a survey Orbitrap-MS scan and MS/MS scans for the most abundant signals in the following 5 s (at certain tR), with charge states ranging from 2 to 6. The mass spectrometer settings and DDA parameters are summarized in the Supplementary Material (Table S1-1). The mass spectrometry proteomics data have been deposited to the ProteomeXchange Consortium via the PRIDE partner repository [67] with the dataset identifier PXD013479.

4.7. Data Analysis and Post-Processing

Identification of peptides, annotation and label-free quantification of proteins relied on the Progenesis QIP software (Waters GmbH, Eschborn, Germany). After peak alignment, spectral and peptide filters were applied (Table S1-2), and thereby selected MS/MS spectra were searched with SEQUEST engine against a combined database, containing protein sequences of three legume species closely related to pea (Table S1-3), as was recently proposed by Matamoros and co-workers [44]. The database search settings are summarized in Table S1-4. Afterwards, the resulted pepXML file (obtained after the search against decoy database, FDR < 0.05) was imported to Progenesis QIP software for relative quantification of identified differentially expressed proteins based on Hi-N algorithm, picking the three most abundant peptides for quantification. Finally, the proteins meeting the filter criteria (listed in Table S1-2), were exported for statistical interpretation in Perseus 1.6.0.0 software (Max-Planck Institute of Biochemistry, Martinsried, Germany) [68]. This included logarithmical (log2) transformation of analyte abundances, and normalization by uniting vectors in individual experiments (columns) and by z-score based on median calculated for individual proteins (rows). Hierarchical clustering relied on Pearson correlation coefficient to cluster individual experiments and Spearman correlation coefficient to cluster individual proteins. After subsequent manual adjustment of the heat-map-based clusters, specific profile plots were built for each of them. Annotation of individual proteins relied on the original sequence database. For the proteins, annotated as “uncharacterized”, further information was derived from the Uniprot database [69].
For qualitative characterization of seed proteome, the raw files were directly analyzed in Proteome Discoverer 2.2 using the search parameters described above (Table S1-4). Venn diagrams were built by means of the InteractiVenn tool [70]. Thereby, only the proteins and protein groups (i.e., non-redundant proteins) identified with at least one unique peptide were considered. For building Venn diagrams, all specifically modified peptides were considered as unique species.
Functional annotation of the identified proteins relied on the Mercator 4 (v1.0) web application [35]. The results were interpreted and visualized by custom Rscripts (v 3.4.4). The closest homologues of the analyzed proteins to the Arabidopsis proteins were identified with reciprocal best-hit methods. Prediction of intracellular localization relied on the SUBA4 tool [43].

5. Conclusions

Bottom-up shotgun proteomics is a powerful tool in legume seed research. Here we successfully applied it to probe seed metabolic differences related to simultaneous inoculation of low- and high-EIBSM pea plants with rhizobia and AM fungi (i.e., the conditions mimicking the real plant rhizosphere). Thus, the high-EIBSM genotype responded to the inoculation with a prolongation of the seed filling period. This effect was due to changes in expression of the proteins involved in central energy metabolism and protein biosynthesis and folding. Of course the presented data are preliminary, and in the future these proteomics studies might be complemented with other methods of functional genomics—metabolomics and transcriptomics (i.e., a multi-omics approach can be employed). Besides, genome-wide association studies (GWAS) might help to discover novel determinants of the beneficial traits. It is important to mention; however, that efficiency of data interpretation and integration of different approaches will dramatically increase when the sequencing of the pea genome is accomplished.

Supplementary Materials

The following are available online.

Author Contributions

T.M. performed proteomics experiments, data processing, and post-processing, and contributed to writing the manuscript draft; A.M.A contributed in data post-processing, data interpretation, and writing the manuscript draft; C.I. performed LC-MS measurements; A.S. and E.L. accomplished sample preparation; A.S.S., O.Y.S., and G.A.A. performed inoculation experiments and contributed to data interpretation; M.N.P. contributed in critical discussion and writing the manuscript draft; A.S. provided expertise and support in the proteomics experiments; A.F. designed and supervised the proteomics experiments, and contributed to data interpretation and the writing of the final version of the manuscript; V.A.Z. designed and supervised the inoculation experiments, and contributed to data interpretation and the writing of the final version of the manuscript; I.A.T. proposed the idea of the experiment, supervised the whole work, and contributed to the writing of the final version of the manuscript.

Funding

The work was supported by the Russian Science Foundation (project number 16-16-00118).

Acknowledgments

The authors thank The St. Petersburg St. University Research Resource Center for Molecular and Cell Technologies for technical support. The authors are grateful to Liudmila E. Dvoryaninova for technical assistance and to Alexey Y. Borisov for fruitful discussion.

Conflicts of Interest

The authors declare no conflicts of interest.

References

  1. Shtark, O.Y.; Borisov, A.Y.; Zhukov, V.A.; Tikhonovich, I.A. Mutually beneficial legume symbioses with soil microbes and their potential for plant production. Symbiosis 2012, 58, 51–62. [Google Scholar] [CrossRef]
  2. Oldroyd, G.E.D. Speak, friend, and enter: Signalling systems that promote beneficial symbiotic associations in plants. Nat. Rev. Microbiol. 2013, 11, 252–263. [Google Scholar] [CrossRef] [PubMed]
  3. Vance, C.P. Carbon and Nitrogen Metabolism in Legume Nodules. In Nitrogen-Fixing Leguminous Symbioses; Springer: Dordrecht, The Netherlands, 2008; pp. 293–320. [Google Scholar]
  4. Smith, S.E.; Andrew Smith, F. Roles of Arbuscular Mycorrhizas in Plant Nutrition and Growth: New Paradigms from Cellular to Ecosystem Scales. Annu. Rev. Plant Biol. 2011, 62, 227–250. [Google Scholar] [CrossRef] [PubMed]
  5. Velázquez, E.; García-Fraile, P.; Ramírez-Bahena, M.-H.; Rivas, R.; Martínez-Molina, E. Current Status of the Taxonomy of Bacteria Able to Establish Nitrogen-Fixing Legume Symbiosis. In Microbes for Legume Improvement; Springer International Publishing: Cham, Germany, 2017; pp. 1–43. [Google Scholar]
  6. Glick, B.R. Plant Growth-Promoting Bacteria: Mechanisms and Applications. Scientifica 2012, 2012, 1–15. [Google Scholar] [CrossRef] [PubMed]
  7. Pii, Y.; Mimmo, T.; Tomasi, N.; Terzano, R.; Cesco, S.; Crecchio, C. Microbial interactions in the rhizosphere: Beneficial influences of plant growth-promoting rhizobacteria on nutrient acquisition process. A review. Biol. Fertil. Soils 2015, 51, 403–415. [Google Scholar] [CrossRef]
  8. Lugtenberg, B.; Rozen, D.E.; Kamilova, F. Wars between microbes on roots and fruits. F1000Research 2017, 6, 343. [Google Scholar] [CrossRef] [PubMed]
  9. Muleta, D. Legume Response to Arbuscular Mycorrhizal Fungi Inoculation in Sustainable Agriculture. In Microbes for Legume Improvement; Springer International Publishing: Cham, Germany, 2017; pp. 227–260. [Google Scholar]
  10. Barea, J.-M.; Azcón, R.; Azcón-Aguilar, C. Mycorrhizosphere interactions to improve plant fitness and soil quality. Antonie Van Leeuwenhoek 2002, 81, 343–351. [Google Scholar] [CrossRef] [PubMed]
  11. Khan, M.S.; Zaidi, A.; Musarrat, J. Microbes for Legume Improvement; Springer-Verlag: Wien, Austria, 2017; ISBN 978-3-319-59173-5. [Google Scholar]
  12. Shtark, O.Y.; Zhukov, V.; Sulima, A.S.; Singh, R.; Naumkina, T.S.; Akhtemova, G.A.; Borisov, A.Y. Prospects for the use of multi-component symbiotic systems of the Legumes. Ecol. Genet. 2015, 13, 33–46. [Google Scholar] [CrossRef]
  13. Shtark, O.Y.; Borisov, A.Y.; Zhukov, V.A.; Provorov, N.A.; Tikhonovich, I.A. Intimate associations of beneficial soil microbes with the host plants. In Soil Microbiology and Sustainable Crop Production; Springer: Dordrecht, The Netherlands, 2010; pp. 119–196. ISBN 978-90-481-9478-0. [Google Scholar]
  14. Van der Heijden, M.G.A.; de Bruin, S.; Luckerhoff, L.; van Logtestijn, R.S.P.; Schlaeppi, K. A widespread plant-fungal-bacterial symbiosis promotes plant biodiversity, plant nutrition and seedling recruitment. ISME J. 2016, 10, 389–399. [Google Scholar] [CrossRef]
  15. Lüscher, A.; Mueller-Harvey, I.; Soussana, J.F.; Rees, R.M.; Peyraud, J.L. Potential of Legume-Based Grassland-Livestock Systems in Europe: A Review. Grass Forage Sci. 2014, 69, 206–228. [Google Scholar] [CrossRef] [PubMed]
  16. Oldroyd, G.E.; Dixon, R. Biotechnological solutions to the nitrogen problem. Curr. Opin. Biotechnol. 2014, 26, 19–24. [Google Scholar] [CrossRef]
  17. Limpens, E.; Moling, S.; Hooiveld, G.; Pereira, P.A.; Bisseling, T.; Becker, J.D.; Küster, H. Cell- and Tissue-Specific Transcriptome Analyses of Medicago truncatula Root Nodules. PLoS ONE 2013, 8, e64377. [Google Scholar] [CrossRef] [PubMed]
  18. Camps, C.; Jardinaud, M.; Rengel, D.; Carrère, S.; Hervé, C.; Debellé, F.; Gamas, P.; Bensmihen, S.; Gough, C. Combined genetic and transcriptomic analysis reveals three major signalling pathways activated by Myc-LCOs in Medicago truncatula. New Phytol. 2015, 208, 224–240. [Google Scholar] [CrossRef] [PubMed]
  19. Küster, H.; Vieweg, M.F.; Manthey, K.; Baier, M.C.; Hohnjec, N.; Perlick, A.M. Identification and expression regulation of symbiotically activated legume genes. Phytochemistry 2007, 68, 8–18. [Google Scholar] [CrossRef] [PubMed]
  20. Afkhami, M.E.; Stinchcombe, J.R. Multiple mutualist effects on genomewide expression in the tripartite association between Medicago truncatula, nitrogen-fixing bacteria and mycorrhizal fungi. Mol. Ecol. 2016, 25, 4946–4962. [Google Scholar] [CrossRef]
  21. Nielsen, J.; Oliver, S. The next wave in metabolome analysis. Trends Biotechnol. 2005, 23, 544–546. [Google Scholar] [CrossRef]
  22. Duranti, M. Grain Legume Proteins and Nutraceutical Properties. Fitoterapia 2006, 77, 67–82. [Google Scholar] [CrossRef]
  23. Gillet, L.C.; Leitner, A.; Aebersold, R. Mass Spectrometry Applied to Bottom-Up Proteomics: Entering the High-Throughput Era for Hypothesis Testing. Annu. Rev. Anal. Chem. 2016, 9, 449–472. [Google Scholar] [CrossRef] [PubMed]
  24. Paudel, G.; Bilova, T.; Schmidt, R.; Greifenhagen, U.; Berger, R.; Tarakhovskaya, E.; Stöckhardt, S.; Balcke, G.U.; Humbeck, K.; Brandt, W.; et al. Osmotic stress is accompanied by protein glycation in Arabidopsis thaliana. J. Exp. Bot. 2016, erw395. [Google Scholar] [CrossRef]
  25. Poulsen, M.W.; Hedegaard, R.V.; Andersen, J.M.; de Courten, B.; Bügel, S.; Nielsen, J.; Skibsted, L.H.; Dragsted, L.O. Advanced glycation endproducts in food and their effects on health. Food Chem. Toxicol. 2013, 60, 10–37. [Google Scholar] [CrossRef] [PubMed]
  26. Jacobi, L.M.; Kukalev, A.S.; Ushakov, K.V.; Tsyganov, V.E.; Provorov, N.A.; Borisov, A.Y.; Tikhonovich, I. Genetic variability of garden pea (Pisum sativum, L.) for symbiotic capacities. Pisum. Genet. 1999, 31, 44–45. [Google Scholar]
  27. Borisov, A.Y.; Tsyganov, V.E.; Shtark, O.Y.; Jacobi, L.M.; Naumkina, T.S.; Serdyuk, V.P.; Vishnyakova, M.A. Pea: Symbiotic effectiveness. Cat. World Collect. VIR 2002, 728, 1–29. [Google Scholar]
  28. Chebotar, V.K.; Kazakov, A.E.; Erofeev, S.V.; Danilova, T.N.; Naumkina, T.S.; Shtark, O.Y.; Tikhonovich, I.A.; Borisov, A.Y. Method of production of complex microbial fertilizer. RF Patent No. 2318784, 30 Matrch 2006. [Google Scholar]
  29. Shtark, O.Y.; Danilova, T.N.; Naumkina, T.S.; Vasilchikov, A.G.; Chebotar, V.K.; Kazakov, A.E.; Zhernakov, A.I.; Nemankin, T.A.; Prilepskaya, N.A.; Borisov, A.U.; et al. Analysis Of Pea (Pisum Sativum L.) Source Material For Breeding Of Cultivars With High Symbiotic Potential And Choice Of Criteria For Its Evaluation. Ecol. Genet. 2006, 4, 22–28. [Google Scholar] [CrossRef]
  30. Borisov, A.Y.; Naumkina, T.S.; Shtark, O.Y.; Danilova, T.N.; Tsyganov, V.E. Effectiveness of combined inoculation of pea (Pisum sativum L.) with arbuscular mycorrhizal fungu and rhizobia. Proc. Russ. Acad. Agric. Sci. 2004, 2, 12–14. [Google Scholar]
  31. Mamontova, T.; Lukasheva, E.; Mavropolo-Stolyarenko, G.; Proksch, C.; Bilova, T.; Kim, A.; Babakov, V.; Grishina, T.; Hoehenwarter, W.; Medvedev, S.; et al. Proteome Map of Pea (Pisum sativum L.) Embryos Containing Different Amounts of Residual Chlorophylls. Int. J. Mol. Sci. 2018, 19, 4066. [Google Scholar] [CrossRef] [PubMed]
  32. Frolov, A.; Blüher, M.; Hoffmann, R. Glycation sites of human plasma proteins are affected to different extents by hyperglycemic conditions in type 2 diabetes mellitus. Anal. Bioanal. Chem. 2014, 406, 5755–5763. [Google Scholar] [CrossRef] [PubMed]
  33. Barac, M.; Cabrilo, S.; Pesic, M.; Stanojevic, S.; Zilic, S.; Macej, O.; Ristic, N.; Barac, M.; Cabrilo, S.; Pesic, M.; et al. Profile and Functional Properties of Seed Proteins from Six Pea (Pisum sativum) Genotypes. Int. J. Mol. Sci. 2010, 11, 4973–4990. [Google Scholar] [CrossRef]
  34. Matamoros, M.A.; Kim, A.; Peñuelas, M.; Ihling, C.; Griesser, E.; Hoffmann, R.; Fedorova, M.; Frolov, A.; Becana, M. Protein Carbonylation and Glycation in Legume Nodules. Plant Physiol. 2018, 177, 1510–1528. [Google Scholar] [CrossRef]
  35. Lohse, M.; Nagel, A.; Herter, T.; May, P.; Schroda, M.; Zrenner, R.; Tohge, T.; Fernie, A.R.; Stitt, M.; Usadel, B. Mercator: A fast and simple web server for genome scale functional annotation of plant sequence data. Plant Cell Environ. 2014, 37, 1250–1258. [Google Scholar] [CrossRef]
  36. Chen, M.; Thelen, J.J. The Plastid Isoform of Triose Phosphate Isomerase Is Required for the Postgerminative Transition from Heterotrophic to Autotrophic Growth in Arabidopsis. Plant Cell 2010, 22, 77–90. [Google Scholar] [CrossRef]
  37. Dure, L.; Greenway, S.C.; Galau, G.A. Developmental biochemistry of cottonseed embryogenesis and germination: Changing messenger ribonucleic acid populations as shown by in vitro and in vivo protein synthesis. Biochemistry 1981, 20, 4162–4168. [Google Scholar] [CrossRef] [PubMed]
  38. Min, C.W.; Lee, H.S.; Cheon, Y.E.; Han, W.Y.; Ko, J.M.; Kang, H.W.; Kim, Y.C.; Agrawal, G.K.; Rakwal, R.; Gupta, R.; et al. In-depth proteomic analysis of Glycine max seeds during controlled deterioration treatment reveals a shift in seed metabolism. J. Proteomics 2017, 169, 125–135. [Google Scholar] [CrossRef] [PubMed]
  39. Ranjbar Sistani, N.; Kaul, H.-P.; Desalegn, G.; Wienkoop, S. Rhizobium Impacts on Seed Productivity, Quality, and Protection of Pisum sativum upon Disease Stress Caused by Didymella pinodes: Phenotypic, Proteomic, and Metabolomic Traits. Front. Plant Sci. 2017, 8, 1961. [Google Scholar] [CrossRef] [PubMed]
  40. Frolov, A.; Mamontova, T.; Ihling, C.; Lukasheva, E.; Bankin, M.; Chantseva, V.; Vikhnina, M.; Soboleva, A.; Shumilina, J.; Osmolovskaya, N.; et al. Mining seed proteome: From protein dynamics to modification profiles. Biol. Commun. 2018, 63, 43–58. [Google Scholar] [CrossRef]
  41. Borisov, A.Y.; Danilova, T.N.; Koroleva, T.A.; Naumkina, T.S.; Pavlova, Z.B.; Pinaev, A.G.; Shtark, O.Y.; Tsyganov, V.E.; Voroshilova, V.A.; Zhernakov, A.I.; et al. Pea (Pisum sativum L.) regulatory genes controlling development of nitrogen-fixing nodule and arbuscular mycorrhiza: Fundamentals and application. Biologia 2004, 59, 137–144. [Google Scholar]
  42. Desalegn, G.; Turetschek, R.; Kaul, H.-P.; Wienkoop, S. Microbial symbionts affect Pisum sativum proteome and metabolome under Didymella pinodes infection. J. Proteomics 2016, 143, 173–187. [Google Scholar] [CrossRef]
  43. Hooper, C.M.; Tanz, S.K.; Castleden, I.R.; Vacher, M.A.; Small, I.D.; Millar, A.H. SUBAcon: A consensus algorithm for unifying the subcellular localization data of the Arabidopsis proteome. Bioinformatics 2014, 30, 3356–3364. [Google Scholar] [CrossRef] [PubMed]
  44. Turetschek, R.; Lyon, D.; Desalegn, G.; Kaul, H.-P.; Wienkoop, S. A Proteomic Workflow Using High-Throughput De Novo Sequencing Towards Complementation of Genome Information for Improved Comparative Crop Science; In Humana Press: New York, NY, USA, 2016; pp. 233–243. [Google Scholar]
  45. Ellis, T.H.N.; Hofer, J.M.I.; Timmerman-Vaughan, G.M.; Coyne, C.J.; Hellens, R.P. Mendel, 150 years on. Trends Plant Sci. 2011, 16, 590–596. [Google Scholar] [CrossRef]
  46. Smolikova, G.; Dolgikh, E.; Vikhnina, M.; Frolov, A.; Medvedev, S. Genetic and Hormonal Regulation of Chlorophyll Degradation during Maturation of Seeds with Green Embryos. Int. J. Mol. Sci. 2017, 18, 1993. [Google Scholar] [CrossRef]
  47. Almoguera, C.; Jordano, J. Developmental and environmental concurrent expression of sunflower dry-seed-stored low-molecular-weight heat-shock protein and Lea mRNAs. Plant Mol. Biol. 1992, 19, 781–792. [Google Scholar] [CrossRef]
  48. Kalemba, E.M.; Pukacka, S. Changes in late embryogenesis abundant proteins and a small heat shock protein during storage of beech (Fagus sylvatica L.) seeds. Environ. Exp. Bot. 2008, 63, 274–280. [Google Scholar] [CrossRef]
  49. Pawłowski, T.A. Proteome analysis of Norway maple (Acer platanoides L.) seeds dormancy breaking and germination: Influence of abscisic and gibberellic acids. BMC Plant Biol. 2009, 9, 48. [Google Scholar] [CrossRef] [PubMed]
  50. Park, S.-Y.; Fung, P.; Nishimura, N.; Jensen, D.R.; Fujii, H.; Zhao, Y.; Lumba, S.; Santiago, J.; Rodrigues, A.; Chow, T.-F.F.; et al. Abscisic acid inhibits type 2C protein phosphatases via the PYR/PYL family of START proteins. Science 2009, 324, 1068–1071. [Google Scholar] [CrossRef] [PubMed]
  51. Bourgeois, M.; Jacquin, F.; Cassecuelle, F.; Savois, V.; Belghazi, M.; Aubert, G.; Quillien, L.; Huart, M.; Marget, P.; Burstin, J. A PQL (protein quantity loci) analysis of mature pea seed proteins identifies loci determining seed protein composition. Proteomics 2011, 11, 1581–1594. [Google Scholar] [CrossRef] [PubMed]
  52. Sugimoto, T.; Tanaka, K.; Monma, M.; Kawamura, Y.; Saio, K. Phosphoenolpyruvate Carboxylase Level in Soybean Seed Highly Correlates to Its Contents of Protein and Lipid. Agric. Biol. Chem. 1989, 53, 885–887. [Google Scholar]
  53. Benedito, V.A.; Torres-Jerez, I.; Murray, J.D.; Andriankaja, A.; Allen, S.; Kakar, K.; Wandrey, M.; Verdier, J.; Zuber, H.; Ott, T.; et al. A gene expression atlas of the model legume Medicago truncatula. Plant J. 2008, 55, 504–513. [Google Scholar] [CrossRef] [PubMed]
  54. MacArthur, R.; Wilson, E. The Theory of Island Biogeography; Princeton University Press: Princeton, NJ, USA, 2001. [Google Scholar]
  55. Balazadeh, S.; Schildhauer, J.; Araújo, W.L.; Munné-Bosch, S.; Fernie, A.R.; Proost, S.; Humbeck, K.; Mueller-Roeber, B. Reversal of senescence by N resupply to N-starved Arabidopsis thaliana: Transcriptomic and metabolomic consequences. J. Exp. Bot. 2014, 65, 3975–3992. [Google Scholar] [CrossRef] [PubMed]
  56. Salon, C.; Munier-Jolain, N.; Duc, G.; Voisin, A.-S.; Grandgirard, D.; Larmure, A.; Emery, R.; Ney, B. Grain legume seed filling in relation to nitrogen acquisition: A review and prospects with particular reference to pea. Agronomie 2001, 21, 539–552. [Google Scholar] [CrossRef]
  57. Zhukov, V.A.; Akhtemova, G.A.; Zhernakov, A.I.; Sulima, A.S.; Shtark, O.Y.; Tikhonovich, I.A. Evaluation of the symbiotic effectiveness of Pea (Pisum Sativum L.) Genotypes in pot experiment. Agric. Biol. 2017, 52, 607–614. [Google Scholar] [CrossRef]
  58. Osmolovskaya, N.; Shumilina, J.; Kim, A.; Didio, A.; Grishina, T.; Bilova, T.; Keltsieva, O.A.; Zhukov, V.; Tikhonovich, I.; Tarakhovskaya, E.; et al. Methodology of Drought Stress Research: Experimental Setup and Physiological Characterization. Int. J. Mol. Sci. 2018, 19, 4089. [Google Scholar] [CrossRef]
  59. Kozlova, N.; Strunnikova, O.K. Production and specificity of polyclonal antibodies against soluble proteins from the arbuscular mycorrhizal fungus Glomus intraradices. Mycorrhiza 2001, 10, 301–305. [Google Scholar] [CrossRef]
  60. Afonin, A.; Sulima, A.; Zhernakov, A.; Zhukov, V. Draft genome of the strain RCAM1026 Rhizobium leguminosarum bv. viciae. Genomics Data 2017, 11, 85–86. [Google Scholar] [CrossRef]
  61. Shtark, O.Y.; Sulima, A.S.; Zhernakov, A.I.; Kliukova, M.S.; Fedorina, J.V.; Pinaev, A.G.; Kryukov, A.A.; Akhtemova, G.A.; Tikhonovich, I.A.; Zhukov, V.A. Arbuscular mycorrhiza development in pea (Pisum sativum L.) mutants impaired in five early nodulation genes including putative orthologs of NSP1 and NSP2. Symbiosis 2016, 68, 129–144. [Google Scholar] [CrossRef]
  62. Frolov, A.; Didio, A.; Ihling, C.; Chantzeva, V.; Grishina, T.; Hoehenwarter, W.; Sinz, A.; Smolikova, G.; Bilova, T.; Medvedev, S. The effect of simulated microgravity on the Brassica napus seedling proteome. Funct. Plant Biol. 2018, 45, 440. [Google Scholar] [CrossRef]
  63. Schmidt, R.; Böhme, D.; Singer, D.; Frolov, A. Specific tandem mass spectrometric detection of AGE-modified arginine residues in peptides. J. Mass Spectrom. 2015, 50, 613–624. [Google Scholar] [CrossRef]
  64. Greifenhagen, U.; Frolov, A.; Blüher, M.; Hoffmann, R. Plasma Proteins Modified by Advanced Glycation End Products (AGEs) Reveal Site-specific Susceptibilities to Glycemic Control in Patients with Type 2 Diabetes. J. Biol. Chem. 2016, 291, 9610–9616. [Google Scholar] [CrossRef]
  65. Frolov, A.; Bilova, T.; Paudel, G.; Berger, R.; Balcke, G.U.; Birkemeyer, C.; Wessjohann, L.A. Early responses of mature Arabidopsis thaliana plants to reduced water potential in the agar-based polyethylene glycol infusion drought model. J. Plant Physiol. 2017, 208, 70–83. [Google Scholar] [CrossRef]
  66. Spiller, S.; Frolov, A.; Hoffmann, R. Quantification of Specific Glycation Sites in Human Serum Albumin as Prospective Type 2 Diabetes Mellitus Biomarkers. Protein Pept. Lett. 2018, 24. [Google Scholar] [CrossRef]
  67. Vizcaíno, J.A.; Côté, R.G.; Csordas, A.; Dianes, J.A.; Fabregat, A.; Foster, J.M.; Griss, J.; Alpi, E.; Birim, M.; Contell, J.; et al. The PRoteomics IDEntifications (PRIDE) database and associated tools: Status in 2013. Nucleic Acids Res. 2013, 41, D1063–D1069. [Google Scholar] [CrossRef]
  68. Tyanova, S.; Temu, T.; Sinitcyn, P.; Carlson, A.; Hein, M.Y.; Geiger, T.; Mann, M.; Cox, J. The Perseus computational platform for comprehensive analysis of (prote)omics data. Nat. Methods 2016, 13, 731–740. [Google Scholar] [CrossRef]
  69. The UniProt Consortium. UniProt: The universal protein knowledgebase. Nucleic Acids Res. 2018, 46, 2699. [Google Scholar] [CrossRef] [PubMed]
  70. Heberle, H.; Meirelles, G.V.; da Silva, F.R.; Telles, G.P.; Minghim, R. InteractiVenn: A web-based tool for the analysis of sets through Venn diagrams. BMC Bioinform. 2015, 16, 169. [Google Scholar] [CrossRef] [PubMed]
Sample Availability: Data files are available from the authors.
Figure 1. Experimental workflow for the analysis of a pea seed proteome.
Molecules 24 01603 g001
Figure 2. The numbers of tryptic peptides (A), possible proteins (B), and non-redundant proteins (protein groups, C) identified in seeds of pea (P. sativum L) plants, lines K-8274 (high efficiency of interaction with soil microorganisms (EIBSM), A) and K-3358 (low EIBSM, B), grown with (BSM, beneficial soil microorganisms) and without (NI, not inoculated) simultaneous colonization of pea roots with rhizobia and arbuscular mycorrhizae (AM) fungi R. irregularis. The pea seed protein tryptic digests (n = 3) were analyzed by nano-high performance liquid chromatography-electrospray ionization mass spectrometry (nanoHPLC-ESI-Q-Orbitrap-MS) in DDA mode.
Molecules 24 01603 g002
Figure 3. Post-processing of the label-free quantification data, acquired in nanoHPLC-ESI-Q-Orbitrap-MS/data-dependent acquisition experiments, performed with seed protein tryptic digests of pea (P. sativum L) plants, lines K-8274 (high EIBSM, A) and K-3358 (low EIBSM, B), grown with (BSM, beneficial soil microorganisms) and without (NI, not inoculated) simultaneous colonization of pea roots with rhizobia and arbuscular mycorrhizae (AM). The K-8274 (orange) and K-3358 (blue) pea lines could be separated by the first component (A,B), whereas BSM (squares) and NI (circles) were separated by the second (A) and third (B) components. Hierarchical clustering was done for average group values, calculated by three biological replicates (C). Post-processing relied on Perseus software (n = 3). For the original Perseus export data (i.e., prior manual verification of clusters) see Figure S1-3.
Molecules 24 01603 g003
Figure 4. Functional annotation of proteins, differentially regulated in seeds of pea (P. sativum L) lines K-8274 (A) and K-3358 (B), characterized with high and low EIBSM, respectively. Functional annotation relied on Mercator tool [35].
Molecules 24 01603 g004
Figure 5. Sub-cellular localization annotation of differentially expressed proteins of seeds of pea (P. sativum L) as accessed in Progenesis QIP (ANOVA, p ≤ 0.05). A—proteins up-regulated within line K-8274; B—proteins down-regulated within line K-8274; C—proteins up-regulated within line K-3358; D—proteins down-regulated within line K-3358. Prediction of the cellular localization relied on SUBA4 tool [43].
Molecules 24 01603 g005
Table 1. Differentially expressed pea proteins, identified in the seeds of P. sativum lines K-8274 and K-3385, characterized with a high and low EIBSM, respectively, and grown in presence and absence of a complex symbiosis with Rhizobium leguminosarum bv. viciae (strain RCAM 1026) and R. irregularis strains BEG144, BEG53, and S7.
Clusters of Protein a (8274/3358)Nr.Proteinslog2 Fold Change eAnovap fqg
AccessionDescription bFunction d82743358BSMNI
1. Up/Up
Molecules 24 01603 i0011+Q1S053Probable histone H2A.3Chromatin organization1.5NSNS1.30.0120.032
2+I3SCW0Uncharacterized; HSP20-like chaperone cExternal stimuli response2.71.7NSNS0.0230.043
3A0A072UBI6Small hydrophilic plant seed proteinNot assigned1.71.22.31.60.0160.038
4Lj0g3v0065729.1Uncharacterized; 60S ribosomal protein L35-like cProtein biosynthesis1.10.6NS1.60.0110.029
2. Up/Down
Molecules 24 01603 i0022.15+Medtr1g102870.11,2-dihydroxy-3-keto-5-methylthiopentene dioxygenaseAmino acid metabolism1.9−1.3NSNS0.0110.032
6A0A072VC98ATPase. AAA-type. CDC48 proteinNot assigned1.0−0.63.53.20.0240.044
7I3T832Uncharacterized; response to oxidative stress, heme binding, peroxidase activity c1.6−0.7−0.81.00.0050.018
8Lj6g3v1880130.1ATP-dependent (S)-NAD(P)H-hydrate dehydratase1.3−1.0−0.61.30.0230.044
9A0A072U0B5UDP-glucosyltransferase family proteinOther enzyme families0.9−0.82.01.90.0120.031
10G7IEE7Xyloglucanase-specific endoglucanase inhibitor p.Protein degradation1.0NS−4.6−4.50.0020.014
11+B7FH22Uncharacterized; oxidoreductase activity cRedox homeostasis2.3−0.7NS0.80.0240.043
12+G7L8T3Guanosine nucleotide diphosphate dissociation inhibitorVesicle trafficking1.7−1.7−5.1−5.20.0200.043
2.213G7IJ13Proteasome subunit alpha typeProtein degradation1.3−0.7−2.3−2.10.0250.044
14B7FLD1Putative uncharacterized; Nop domain superfamily (pre-RNA processing ribonucleoproteins) cRNA processing1.8−1.80.6NS0.0010.013
15A0A072UGB7Clathrin heavy chainVesicle trafficking1.4−1.43.72.60.0340.050
3. Up/Steady
Molecules 24 01603 i003 3.116A0A072W1H5ATP synthase subunit betaCellular respiration3.0NSNS2.70.0030.017
17I3SN66Uncharacterized; triose-phosphate isomerase activity, chloroplast organization c2.71.0−0.6−0.80.0040.017
18G7IUE0LRR receptor-like kinase family proteinNot assigned2.1NSNSNS0.0100.029
19G7J538GDP-fucose protein O-fucosyltransferase1.6NS−0.7−0.90.0230.044
20V7CPQ1Uncharacterized; ATP binding c1.8NS0.82.90.0020.015
21+A2Q582Aldo/keto reductaseOther enzyme families1.9NSNS3.30.0160.038
22A0A072UJ10Cytoplasmic ribosomal protein S13Protein biosynthesis3.90.82.62.50.0020.015
23I3T61760S ribosomal L35-like protein4.01.4NS2.40.0050.018
24+Q5QQ34Coatomer epsilon subunitVesicle trafficking2.8NSNS1.50.0190.041
3.225I3SHC8Uncharacterized; ribosome biogenesis cProtein biosynthesis1.7NSNS−0.60.0080.025
Molecules 24 01603 i004 4.126V7BQ03Uncharacterized; carboxy-lyase activity, magnesium ion binding, thiamine pyrophosphate binding cCarbohydrate metabolismNSNS−2.90.80.0370.050
27G7KBA217.6 kDa class I heat shock proteinExternal stimuli responseNS1.0−1.2−1.30.0030.015
28A0A072TF91Heat shock protein HSP20. putative (Fragment)Not assignedNSNS2.51.80.0300.046
29Lj3g3v0324640.1LipoxygenaseOther enzyme familiesNSNS−1.71.10.0040.018
30+V7BZK0LipoxygenaseNSNS2.12.90.0040.019
4.231G7L0I7Cobalamin-independent methionine synthaseAmino acid metabolismNSNS−1.1−5.00.0120.031
32G7L831TCP-1/cpn60 chaperonin family proteinCytoskeletonNS0.9−0.7−1.70.0230.044
33G7JSC7NB-ARC domain disease resistance proteinNot assigned0.60.6−1.2−1.30.0020.014
34Lj1g3v0411500.1Uncharacterized; Myb/SANT-like domain (nuclear DNA-binding proteins, nuclear receptor co-repressors) cNS0.6NS1.80.0160.038
35V7ARA2Uncharacterized; Ca2+ binding cNSNS1.62.10.0010.012
36V7BSM8AnnexinNSNS0.6−0.80.0010.013
37V7AR99Uncharacterized; lipase activity cNS1.01.72.60.0160.038
38B7FIG5Putative uncharacterized; oxidoreductase activity, acting on the CH–CH group of donors cNucleotide metabolismNS0.71.52.60.0010.013
39A0A072V122tRNA-binding region domain proteinProtein biosynthesisNSNS2.41.90.0240.044
40V7AUC2Uncharacterized; RNA 3′-end processing, RNA polyadenylation cRNA processingNSNS−0.6NS0.0130.032
41+I3SYE61,2-dihydroxy-3-keto-5-methylthiopentene dioxygenaseAmino acid metabolismNSNSNS-0.60.0090.027
Molecules 24 01603 i00542G7J834Glucose-1-phosphate adenylyltransferaseCarbohydrate metabolismNSNS−0.9−0.60.0240.044
43G7JM88Lethal leaf-spot protein. putativeCoenzyme metabolismNS−1.1−0.6−1.10.0180.040
44Lj4g3v2371610.1Probable glycine cleavage T-protein family (aminomethyl transferase)−0.9NS−2.11.50.0040.017
45+Medtr5g019780.1Cupin family proteinNot assignedNS−1.0NS1.10.0130.033
46A0A072TDJ4TCP-1/cpn60 chaperonin family protein (Fragment)−1.4−1.11.41.20.0370.051
47G7IDU4Protein disulfide isomerase-like protein−1.1−1.0−1.6−1.40.0030.017
48V7AJE4Probable defense response, ADP bindingNS−2.01.81.70.0240.044
49+B7FJF0Xylose isomeraseOther enzyme families−2.7−3.5NS1.60.0210.043
50+G7ILF260S ribosomal protein L26-1Protein biosynthesis−0.6NS−1.0−1.20.0310.047
51+I3T560Superoxide dismutaseRedox homeostasisNS−0.8−1.41.70.0230.043
6. Down/Steady
Molecules 24 01603 i006 6.152+I3SU69Uncharacterized; argininosuccinatelyase activity cAmino acid metabolismNSNS−0.9−1.50.0010.010
53G7J530ArgininosuccinatelyaseNSNS−0.6−0.80.0010.009
54+A0A072TSD1Pectin acetylesteraseCell wall−0.9NS1.31.20.0080.026
55G7JFK1Heat shock 70 kDa proteinExternal stimuli responseNS0.8−0.7−0.70.0010.010
56+V7C9P5Uncharacterized; ATP binding cNS0.83.53.20.0010.010
57A0A072U2T6Translin-like proteinNot assignedNSNS0.90.90.0000.008
58+A0A072TMR3Late embryogenesis abundant protein−1.3NS1.20.70.0000.001
59+B1NY79Cold-acclimation specific protein 15NS0.9−0.71.30.0050.020
60+B5U8K3Convicilin storage protein 1NSNSNS1.20.0010.010
61+I3S2D8Uncharacterized; Mitochondrial inner membrane translocase subunit c2.4NS−0.6−1.40.0000.000
62+V7BVA1Uncharacterized; QWRF domain family, microtubule-associated c−0.6−0.6−1.3NS0.0000.000
63I3T8A0Glutamine synthetaseNutrient uptakeNSNSNS1.40.0250.044
64G7IS29LipoxygenaseOther enzyme familiesNSNSNS−0.80.0240.044
65+Medtr1g094155.1Probable serine carboxypeptidase-like proteinProtein degradation−1.0−0.6NS−0.60.0230.043
66G7I54926S proteasome non-ATPase regulatory subunit-like proteinNSNS0.70.60.0340.050
67A0A072TQN5Phosphatase 2C family proteinProtein modificationNSNS0.90.60.0030.016
68B7FMC4Putative uncharacterized; Glutathione S-transferases terminal domain c−0.6NS1.6NS0.0230.044
69G7LH03GlycosyltransferaseSecondary metabolismNSNS−2.1−2.70.0000.008
6.270G7JPY4Delta-1-pyrroline-5-carboxylate dehydrogenaseAmino acid metabolismNSNS−0.9−0.70.0040.017
71A0A072VNG1Uncharacterized proteinNot assignedNSNSNS2.10.0020.014
72Lj1g3v3690420.1Elongation factor 1-alphaProtein biosynthesisNSNSNS2.70.0260.044
73G7IVL9U-box kinase family proteinProtein modificationNSNSNS−0.80.0340.050
74Lj0g3v0348019.1Transcription factorRNA biosynthesisNSNS0.82.90.0020.014
75Q93XA4Homeodomain leucine zipper protein HDZ2NSNS−1.1NS0.0070.022
7. Steady/Up
Molecules 24 01603 i00776V7AU77Uncharacterized; lactoylglutathionelyase activity cCellular respiration0.8NS−0.9NS0.0300.046
77G7IHB8Core histone H2A/H2B/H3/H4Chromatin organization0.8NS−0.7−0.70.0250.044
78+Q38JC8Temperature-induced lipocalinNot assigned1.01.71.10.60.0150.036
79G7JPM2Uro-adherence factor A. putativeNS0.9−1.0−1.00.0270.046
80V7ALP7Annexin0.60.61.71.90.0130.032
81B7FJY0Annexin0.80.6−0.93.60.0100.029
82V7B712Hexosyltransferase0.91.0−0.9NS0.0350.050
83V7BYE1Uncharacterized (Fragment); Leucine-rich repeat domain superfamily c0.91.4−1.40.60.0370.050
84+A0A072U7T5F-box/RNI/F box domain-like domain protein0.74.66.95.80.0030.017
85B7FK47FerritinNutrient uptake0.70.92.43.30.0310.048
86A0A072UUP460S ribosomal protein L18aProtein biosynthesisNS0.91.41.10.0290.046
87A0A072VAP660S ribosomal protein L17A0.6NS8.98.90.0320.049
88A0A072VJE740S ribosomal protein S5-2NS0.90.72.40.0280.046
89+G7IH13Translation elongation factor EF-2 subunit0.61.7−1.7−1.80.0250.043
90B7FMQ660S ribosomal L23-like protein0.70.90.70.60.0360.050
91V7B0F4Uncharacterized; RNA-binding, RNA-mediated gene silencing cRNA biosynthesis0.81.0−1.8−0.80.0060.021
92+I3SRR2Uncharacterized; transcription factor activity, sequence-specific DNA binding, zinc ion binding c0.70.9−0.6−0.80.0110.032
93G7J2R6110 kDa 4SNc-tudor domain proteinRNA processingNSNS−1.1−0.80.0080.025
8. Steady/Down
Molecules 24 01603 i008 8.194V7AWC54-alpha-glucanotransferaseCarbohydrate metabolismNSNS−1.4NS0.0330.049
95G9JLT6ATP synthase subunit alphaCellular respirationNS−0.8−0.7−0.90.0040.017
96+G7KG34Glutamine synthetaseNutrient uptakeNSNS−0.7−1.20.0030.016
97G7IH71Phosphoenolpyruvate carboxylasePhotosynthesisNS−0.6−1.2−1.60.0000.008
98G7IBY160S ribosomal protein L3BProtein biosynthesis0.7−1.3−1.3−1.20.0030.017
99+B7FN14Uncharacterized; Involved in translation, rRNA-binding c0.7−3.81.00.80.0020.014
100+A0A072TQ47Phosphatase 2C family proteinProtein modification0.6NSNS0.80.0150.036
101+A0PG70CatalaseRedox homeostasisNS−1.4NS2.70.0210.043
8.2102A0A072UKG0Histone H2BChromatin organization0.8NS11.413.50.0050.018
103V7B8C8Uncharacterized; translation, structural constituent of ribosome cProtein biosynthesis0.8−1.1−2.1NS0.0090.026
104+A0A072VE37UTP-glucose-1-phosphate uridylyltransferase1.5−2.1NS2.20.0080.026
8.3105A0A072VJU4Glutathione S-transferase. amino-terminal domain proteinProtein modificationNS−1.40.71.90.0050.018
9. Steady/Steady
Molecules 24 01603 i009 9.1106A2Q4V2Leucine-rich repeat. plant specificNot assignedNSNS−0.92.50.0000.008
107I3SIG9Chlorophyll a-b binding protein. chloroplasticPhotosynthesis0.6NSNS−0.90.0000.000
108B6DXD7Vacuolar H+-translocating inorganic pyrophosphataseSolute transportNSNS0.92.10.0080.025
9.2109+G7IMZ3ABA-responsive proteinNot assigned1.4NS−1.6−1.90.0030.017
10. None h
110A0A072TYG8β-hexosaminidaseProtein modification-NS--0.0000.000
111Lj0g3v0098069.1Uncharacterized; l-type lectin-domain containing receptor kinase S.7-like cNot assignedNS---0.0000.000
Plants were grown under non-controlled light and temperature conditions in a greenhouse, as described in Materials and Methods section. The plants were harvested at the stage of mature seeds (three months after planting). The total seed protein fraction was isolated by phenol extraction, the proteins were digested by trypsin and resulted digests were analyzed by nanoHPLC-Q-Orbitrap-LIT-MS. Abbreviations: Nr.—number of protein; UDP—uridine diphosphate; LRR—leucine-rich repeat; GDP—guanidine diphosphate; NB-ARC—nucleotide-binding adaptor shared by APAF-1, R proteins, and CED-4; ADP –adenosine diphosphate. a Initial grouping of proteins by expression profiles relied on hierarchical clustering (using Spearman correlation as a distance measure) with subsequent manual correction of individual protein plots in Perseus software (if necessary); individual expression profiles were defined based on the direction of changes in protein abundance in response to inoculation with BSM; b the descriptions for individual proteins were taken from headers of corresponding fasta files; c for the proteins, annotated as “Uncharacterized” or “Putative uncharacterized”, additional information from UniprotKB was collected; d functional annotation relied on the Mercator software; e binary logarithm of fold changes (log2FCs) within the lines K-8274 and K-3358 is calculated for the abundance ratios BSMK-8274/NIK-8274 and BSMK-3385/NIK-3385, whereas the comparisons of the lines relied on the ratios BSMK-3385/BSMK-8274 and NIK-3385/NIK-8274; f p values were obtained by one-way ANOVA using Progenesis QI software; g q values were obtained with Progenesis QI software; h the tenth profile corresponds to proteins which were not found in one of the lines: A0A072TYG8 was identified and quantified only in line 3358 and Lj0g3v0098069.1 only in line 8274; + indicates the proteins identified in the search against a redundant sequence database and manually checked for quality of identification. NS—“Non-significant” denotes fold changes <1.5 in absolute scale or <0.6 and >−0.6 in log2 scale.

