
Study on a Fermented Whole Wheat: Phenolic Content, Activity on PTP1B Enzyme and In Vitro Prebiotic Properties


 , , ,
, , ,  ,
,
Abstract
:
1. Introduction
2. Results and Discussion
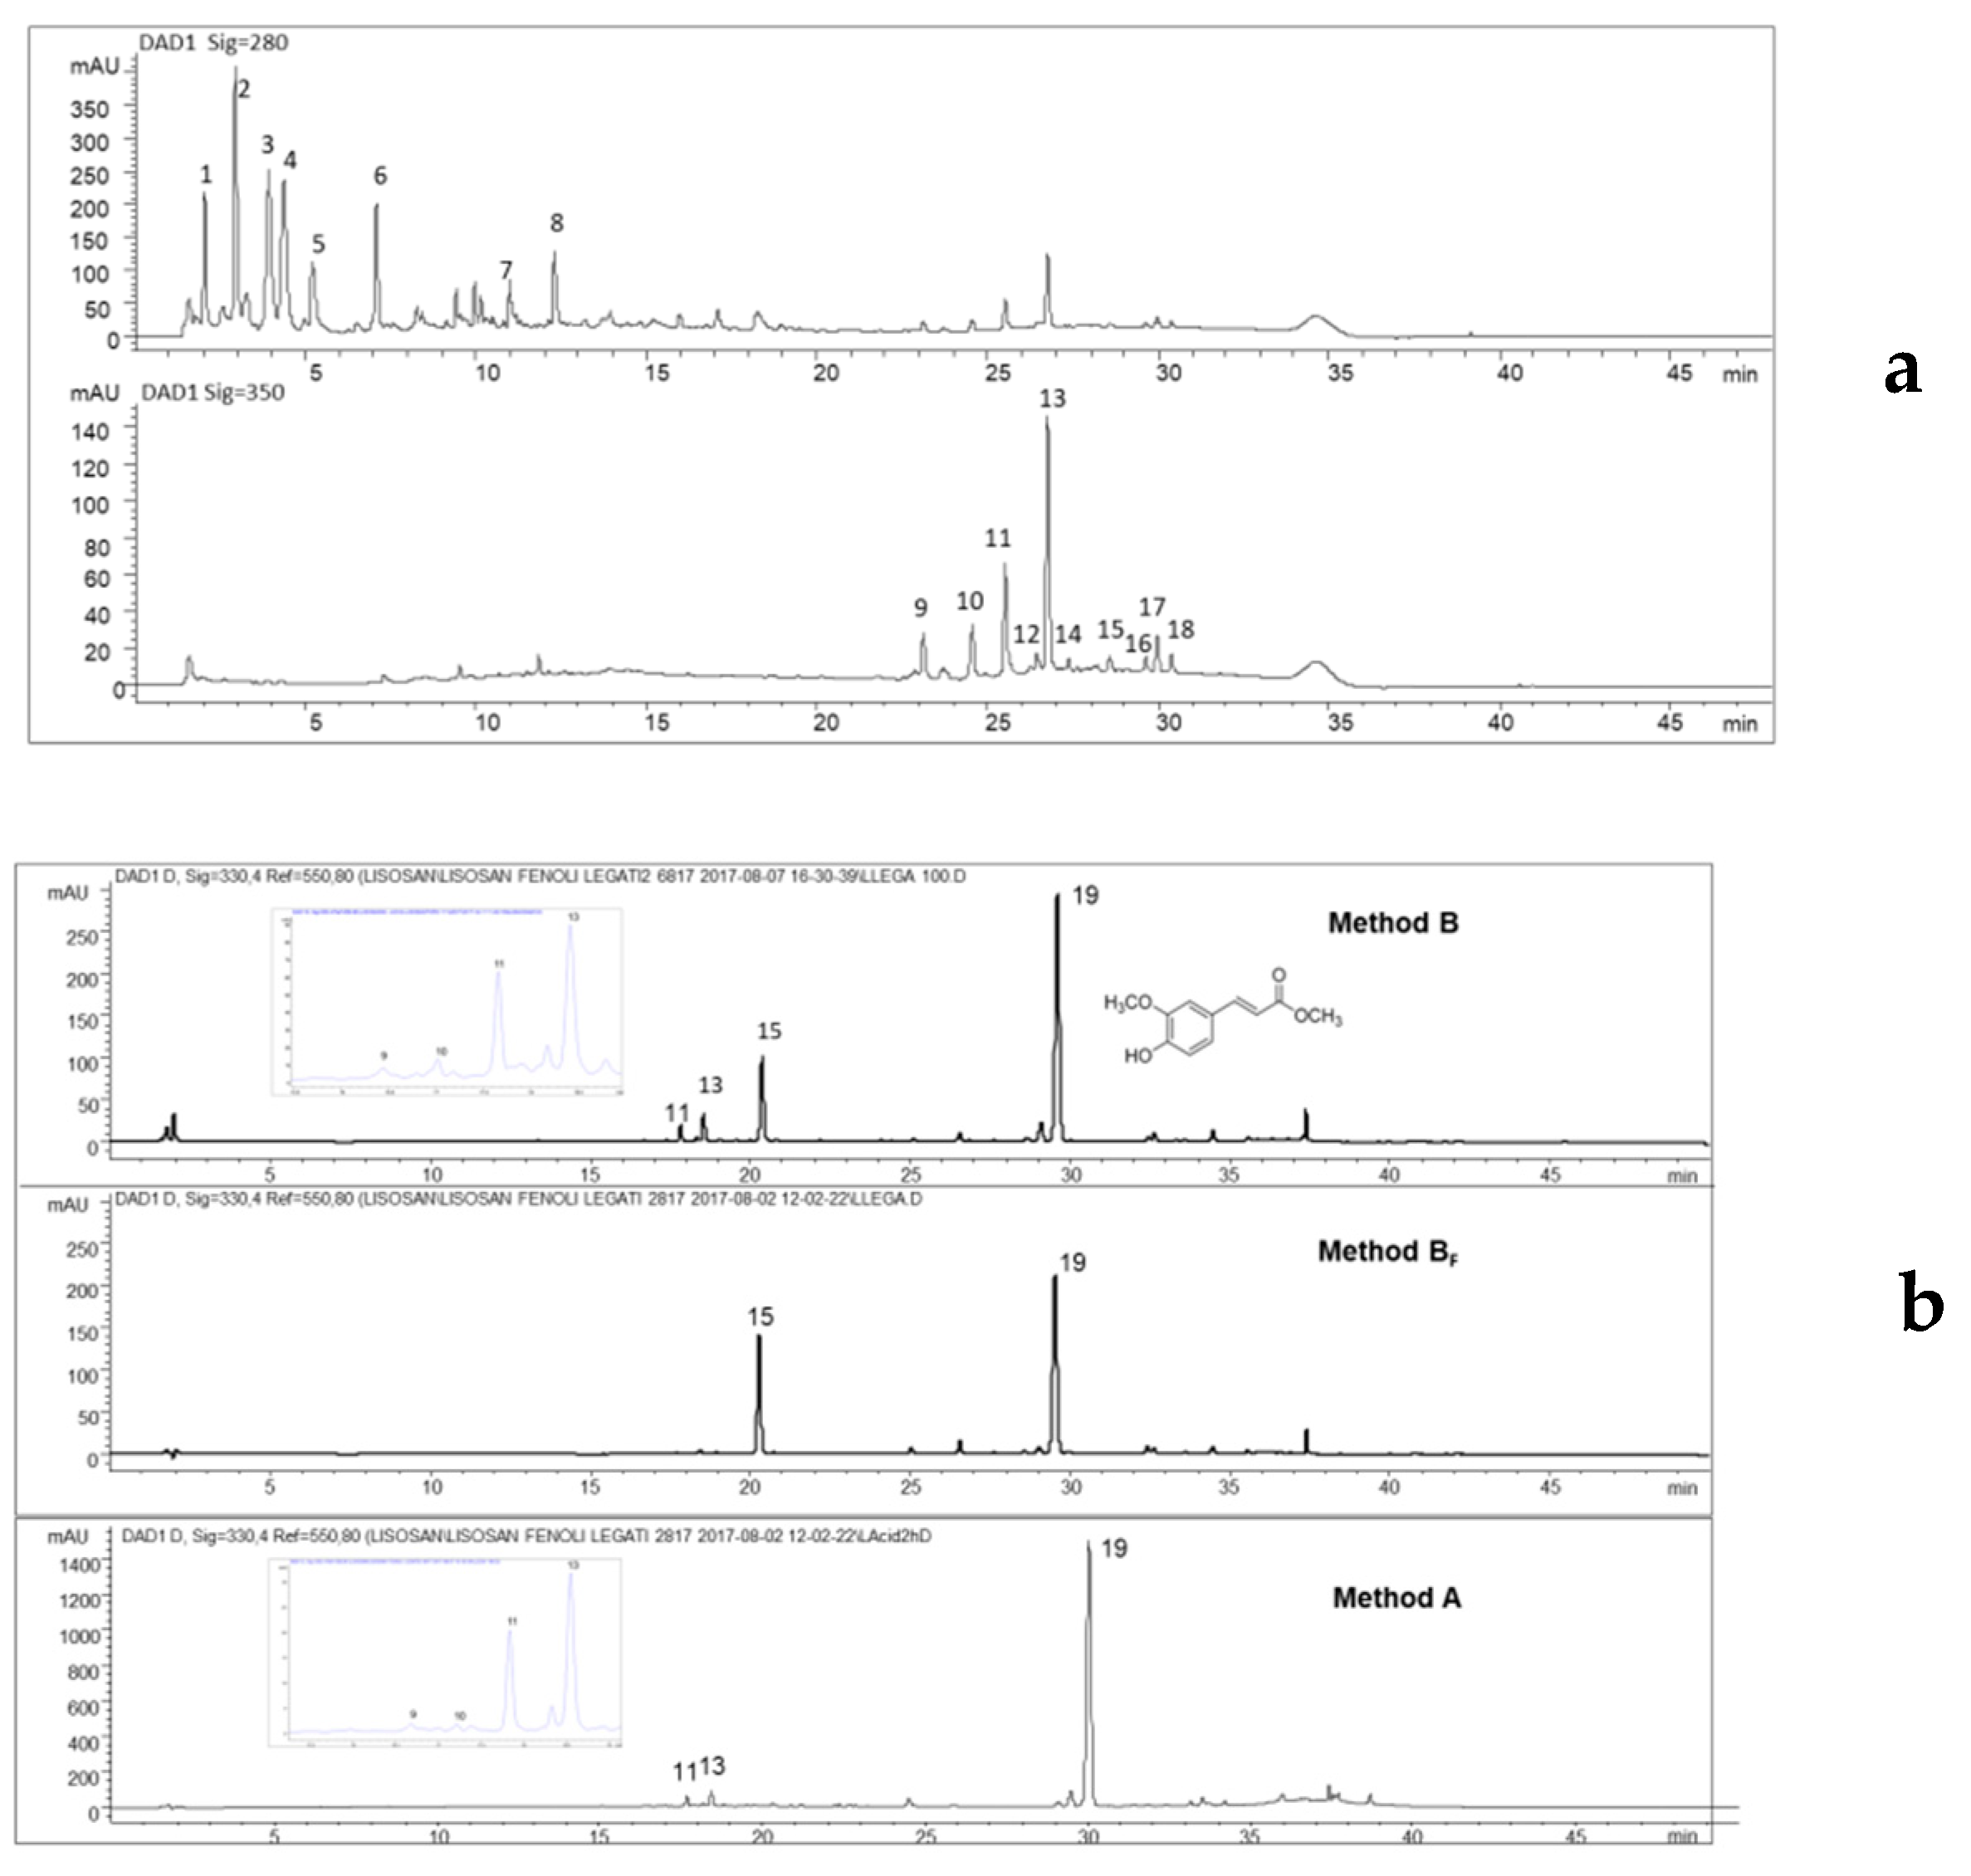
2.1. Fractionation by Semipreparativa HPLC
2.2. Extraction of Free, Bound, and Total Phenols
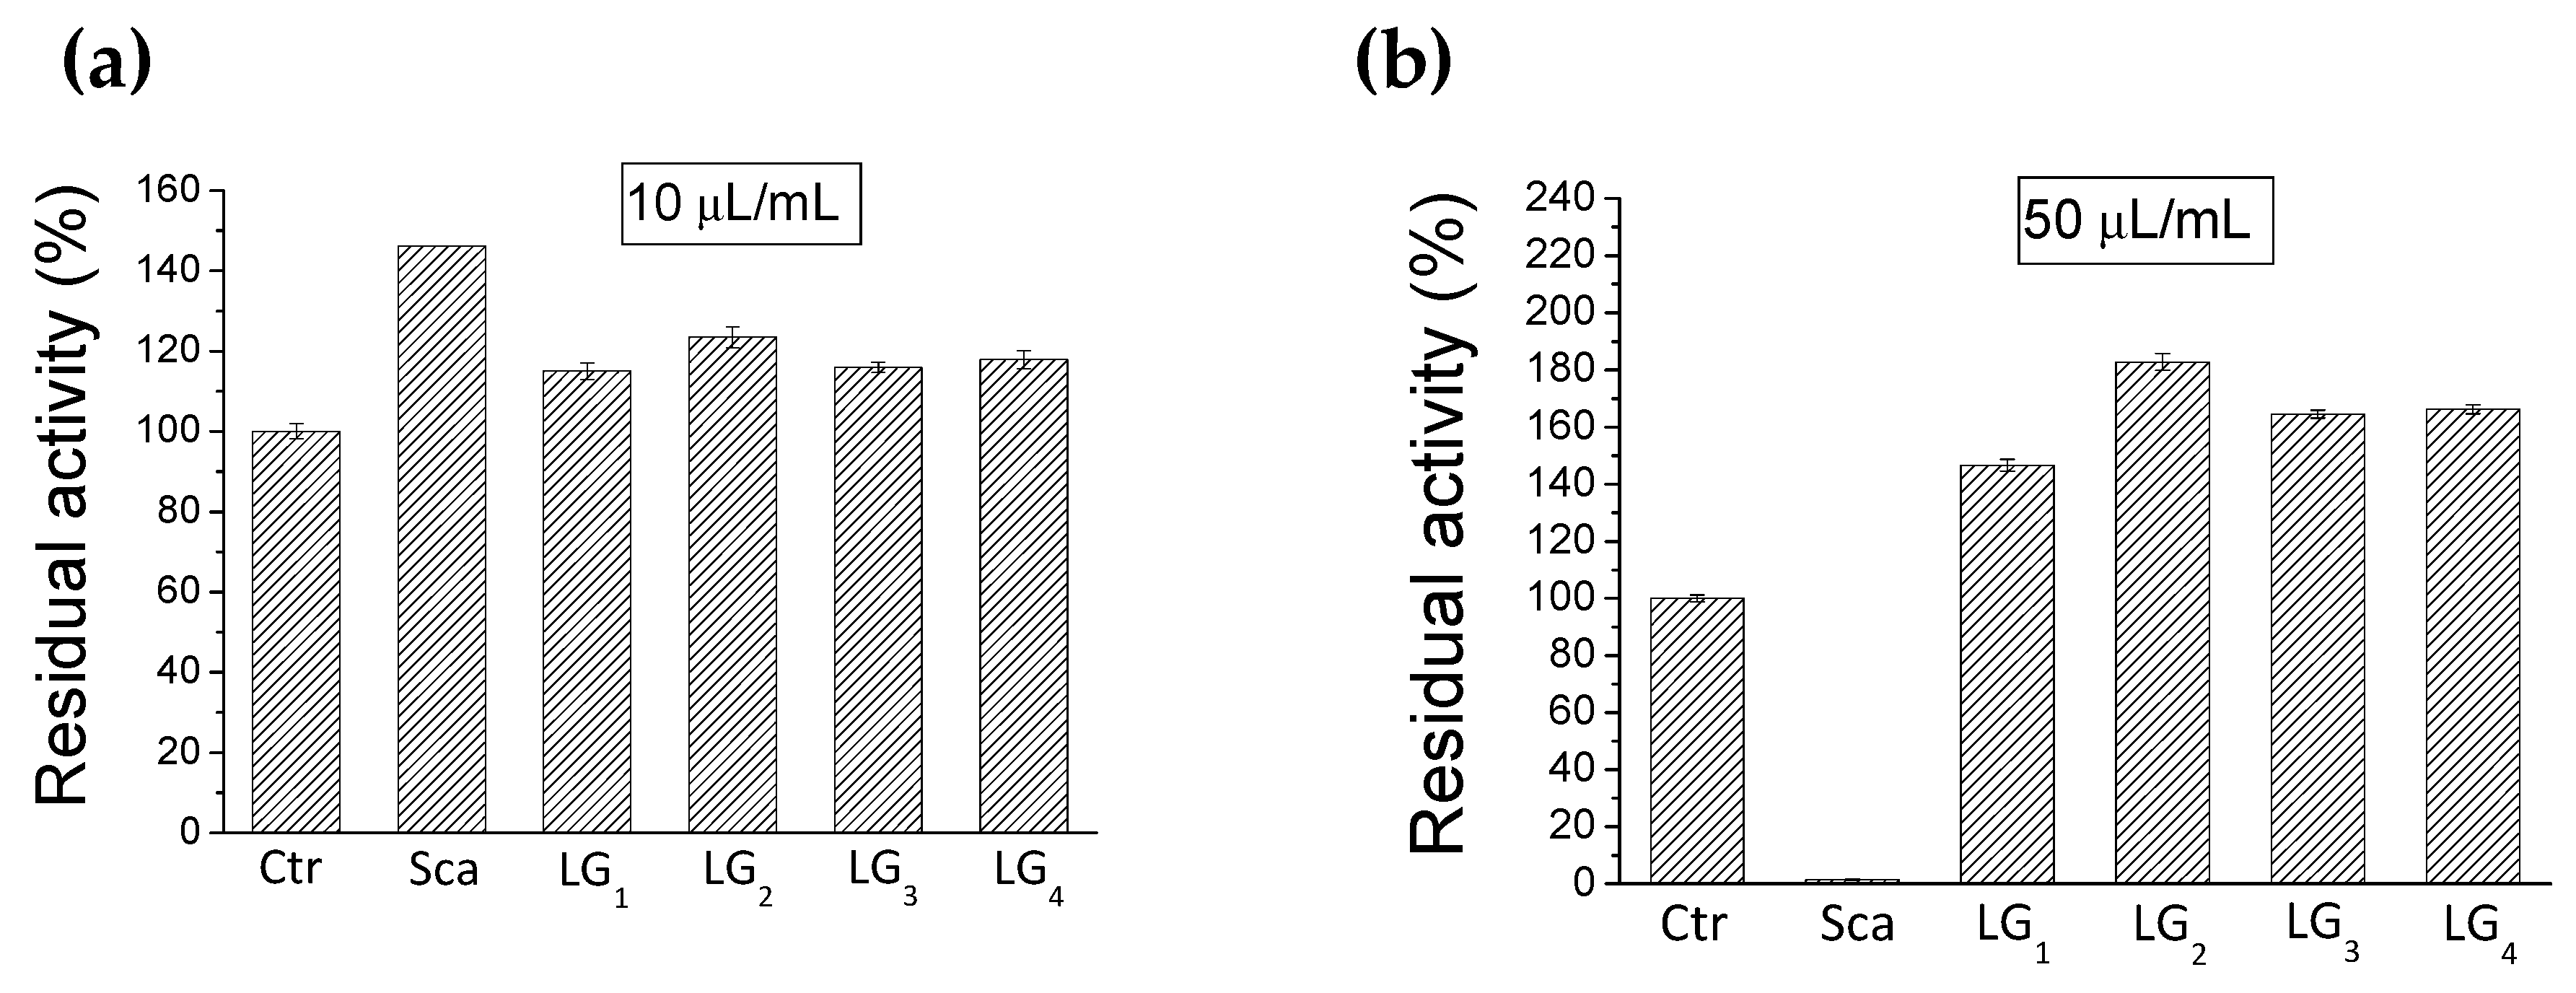
2.3. Inhibition of PTP1B
2.4. Microbial Composition of Lisosan® G
2.5. Activity on Lactobacillus reuteri
3. Materials and Methods
3.1. Samples and Reagents
3.2. Extraction of Phenolic Compounds
3.3. Fractionation by Semipreparative HPLC
3.4. Inhibition Test on PTP1B Enzyme
3.5. Bacteriological Analysis
3.6. 16S Ribosomal RNA Gene Amplicons Preparation and Illumine MISEQ and Data Analysis
3.7. Test on Lactobacillus reuteri
3.8. Analytical HPLC-DAD
3.9. MS Analysis of Lisosan® G fractions
3.10. Quantitative Determination of Phenolic Acids and Flavonoids
3.11. Statistical Analysis
4. Conclusions
Author Contributions
Funding
Acknowledgments
Conflicts of Interest
References
- Terefe, N.S. Reference Module In Food Science. In Food Fermentation; Elsevier: Amsterdam, The Netherlands, 2016; pp. 1–3. [Google Scholar] [CrossRef]
- Hur, S.J.; Lee, S.Y.; Kim, Y.C.; Choi, I.; Kim, G.B. Effect of Fermentation on the Antioxidant Activity in Plant-Based Foods. Food Chem. 2014, 160, 346–356. [Google Scholar] [CrossRef] [PubMed]
- Dey, T.B.; Kuhad, R.C. Enhanced Production and Extraction of Phenolic Compounds from Wheat by Solid-State Fermentation with Rhizopus Oryzae RCK2012. Biotechnol. Rep. 2014, 4, 120–127. [Google Scholar]
- Arranz, S.; Saura Calixto, F. Analysis of Polyphenols in Cereals May Be Improved Performing Acidic Hydrolysis: A Study in Wheat Flour and Wheat Bran and Cereals of the Diet. J. Cereal Sci. 2010, 51, 313–318. [Google Scholar] [CrossRef]
- Holscher, H.D. Dietary Fiber and Prebiotics and the Gastrointestinal Microbiota. Gut Microbes 2017, 8, 172–184. [Google Scholar] [CrossRef] [PubMed]
- Longo, V.; Gervasi, P.G.; Lubrano, V. Cisplatin Induced Toxicity in Rat Tissues: The Protective Effect of Lisosan G. Food Chem. Toxicol. 2011, 49, 233–237. [Google Scholar] [CrossRef] [PubMed]
- Lubrano, V.; Baldi, S.; Napoli, D.; Longo, V. Beneficial Effect of Lisosan G on Cultured Human Microvascular Endothelial Cells Exposed to Oxidised Low Density Lipoprotein. Indian J. Med. Res. 2012, 136, 82–88. [Google Scholar]
- Lucchesi, D.; Russo, R.; Gabriele, M.; Longo, V.; Del Prato, S.; Penno, G.; Pucci, L. Grain and Bean Lysates Improve Function of Endothelial Progenitor Cells from Human Peripheral Blood: Involvement of the Endogenous Antioxidant Defenses. PLoS ONE 2014, 9, e109298. [Google Scholar] [CrossRef]
- La Marca, M.; Beffy, P.; Pugliese, A.; Longo, V. Fermented Wheat Powder Induces the Antioxidant and Detoxifying System in Primary Rat Hepatocytes. PLoS ONE 2013, 8, e83538. [Google Scholar] [CrossRef] [PubMed]
- Verma, M.; Gupta, S.J.; Chaudhary, A.; Garg, V.K. Protein Tyrosine Phosphatase 1B Inhibitors as Antidiabetic Agents—A Brief Review. Bioorg. Chem. 2017, 70, 267–283. [Google Scholar] [CrossRef]
- Dinelli, G.; Segura-Carretero, A.; Di Silvestro, R.; Marotti, I.; Arráez-Román, D.; Benedettelli, S.; Ghiselli, L.; Fernadez-Gutierrez, A. Profiles of Phenolic Compounds in Modern and Old Common Wheat Varieties Determined by Liquid Chromatography Coupled with Time-of-Flight Mass Spectrometry. J. Chromatogr. A 2011, 1218, 7670–7681. [Google Scholar] [CrossRef]
- Leoncini, E.; Prata, C.; Malaguti, M.; Marotti, I.; Segura-Carretero, A.; Catizone, P.; Dinelli, G.; Hrelia, S. Phytochemical Profile and Nutraceutical Value of Old and Modern Common Wheat Cultivars. PLoS ONE 2012, 7, e45997. [Google Scholar] [CrossRef] [PubMed]
- Rahman, M.A.; Akond, M.; Babar, M.A.; Beecher, C.; Erickson, J.; Thomason, K.; De Jong, F.A.; Mason, R.E. LC-HRMS Based Non-Targeted Metabolomic Profiling of Wheat under Post-Anthesis Drought Stress. Am. J. Plant Sci. 2017, 8, 3024–3061. [Google Scholar] [CrossRef]
- Iswaldi, I.; Arráez-Román, D.; Rodríguez-Medina, I.; Beltrán-Debón, R.; Joven, J.; Segura-Carretero, A.; Fernández-Gutiérrez, A. Identification of Phenolic Compounds in Aqueous and Ethanolic Rooibos Extracts (Aspalathus Linearis) by HPLC-ESI-MS (TOF/IT). Anal. Bioanal. Chem. 2011, 400, 3643–3654. [Google Scholar] [CrossRef]
- Colombo, R.; Yariwake, J.H.; Mccullagh, M. Study of C- and O-Glycosylflavones in Sugarcane Extracts Using Liquid Chromatography—Exact Mass Measuremente Mass Spectrometry. J. Braz. Chem. Soc. 2008, 19, 483–490. [Google Scholar] [CrossRef]
- Simirgiotis, M.J.; Schmeda-Hirschmann, G.; Bórquez, J.; Kennelly, E.J. The Passiflora Tripartita (Banana Passion) Fruit: A Source of Bioactive Flavonoid C-Glycosides Isolated by HSCCC and Characterized by HPLC-DAD-ESI/MS/MS. Molecules 2013, 18, 1672–1692. [Google Scholar] [CrossRef]
- Brandolini, A.; Castoldi, P.; Plizzari, L.; Hidalgo, A. Phenolic Acids Composition, Total Polyphenols Content and Antioxidant Activity of Triticum Monococcum, Triticum Turgidum and Triticum Aestivum: A Two-Years Evaluation. J. Cereal Sci. 2013, 58, 123–131. [Google Scholar] [CrossRef]
- Adom, K.K.; Liu, R.H. Antioxidant Activity of Grains. J. Agric. Food Chem. 2002, 50, 6182–6187. [Google Scholar] [CrossRef] [PubMed]
- Tanaka, A.; Kato, A.; Tsuchiya, T. Isolation of β-Sitosteryl Ferulate from Rice Bran Oil. J. Jpn. Oil Chem. Soc. 1964, 13, 260–263. [Google Scholar] [CrossRef]
- Jiang, C.S.; Liang, L.F.; Guo, Y.W. Natural Products Possessing Protein Tyrosine Phosphatase 1B (PTP1B) Inhibitory Activity Found in the Last Decades. Acta Pharmacol. Sin. 2012, 33, 1217–1245. [Google Scholar] [CrossRef]
- Hjortness, M.K.; Riccardi, L.; Hongdusit, A.; Zwart, P.H.; Sankaran, B.; De Vivo, M.; Fox, J.M. Evolutionarily Conserved Allosteric Communication in Protein Tyrosine Phosphatases. Biochemistry 2018, 57, 6443–6451. [Google Scholar] [CrossRef]
- Adisakwattana, S.; Pongsuwan, J.; Wungcharoen, C.; Yibchok-Anun, S. In Vitro Effects of Cinnamic Acid Derivatives on Protein Tyrosine Phosphatase 1B. J. Enzym. Inhib. Med. Chem. 2013, 28, 1067–1072. [Google Scholar] [CrossRef]
- De Vuyst, L.; Leroy, F.; Foulquie, M.R. Enterococcus Faecium RZS C5, an Interesting Bacteriocin Producer to Be Used as a Co-Culture in Food Fermentation. Int. J. Food Microbiol. 2003, 88, 235–240. [Google Scholar]
- Urbańska, M.; Szajewska, H. The Efficacy of Lactobacillus reuteri DSM 17938 in Infants and Children: A Review of the Current Evidence. Eur. J. Pediatr. 2014, 173, 1327–1337. [Google Scholar] [CrossRef]
- Paoli, P.; Cirri, P.; Caselli, A.; Ranaldi, F.; Bruschi, G.; Santi, A.; Camici, G. The Insulin-Mimetic Effect of Morin: A Promising Molecule in Diabetes Treatment. Biochim. Biophys. Acta Gener. Subj. 2013, 1830, 3102–3111. [Google Scholar] [CrossRef]
- Microbial Composition of a Fermented Whole Wheat (Triticum aestivum). Available online: http://www.ebi.ac.uk/ena/data/view/PRJEB30414 (accessed on 18 March 2019).
- Di Paola, M.; Bonech, E.; Provensi, G.; Costa, A.; Clarke, G.; Ballerini, C.; Filippo, C.D.; Passani, M.B. Oleoylethanolamide Treatment Affects Gut Microbiota Composition and the Expression of Intestinal Cytokines in Peyer’s Patches of Mice. Sci. Rep. 2018, 8, 14881. [Google Scholar] [CrossRef]
- Khatib, M.; Giuliani, C.; Rossi, F.; Adessi, A.; Al-Tamimi, A.; Mazzola, G.; Di Gioia, D.; Innocenti, M.; Mulinacci, N. Polysaccharides from By-Products of the Wonderful and Laffan Pomegranate Varieties: New Insight into Extraction and Characterization. Food Chem. 2017, 235, 58–66. [Google Scholar] [CrossRef]
Sample Availability: Not available. |


| Positive Ion MSn | Negative Ion MSn | ||||
|---|---|---|---|---|---|
| Analytes | C-glycosylated Flavonoids | [M − H]+ | Fragment Ions | [M − H]− | Fragment Ions |
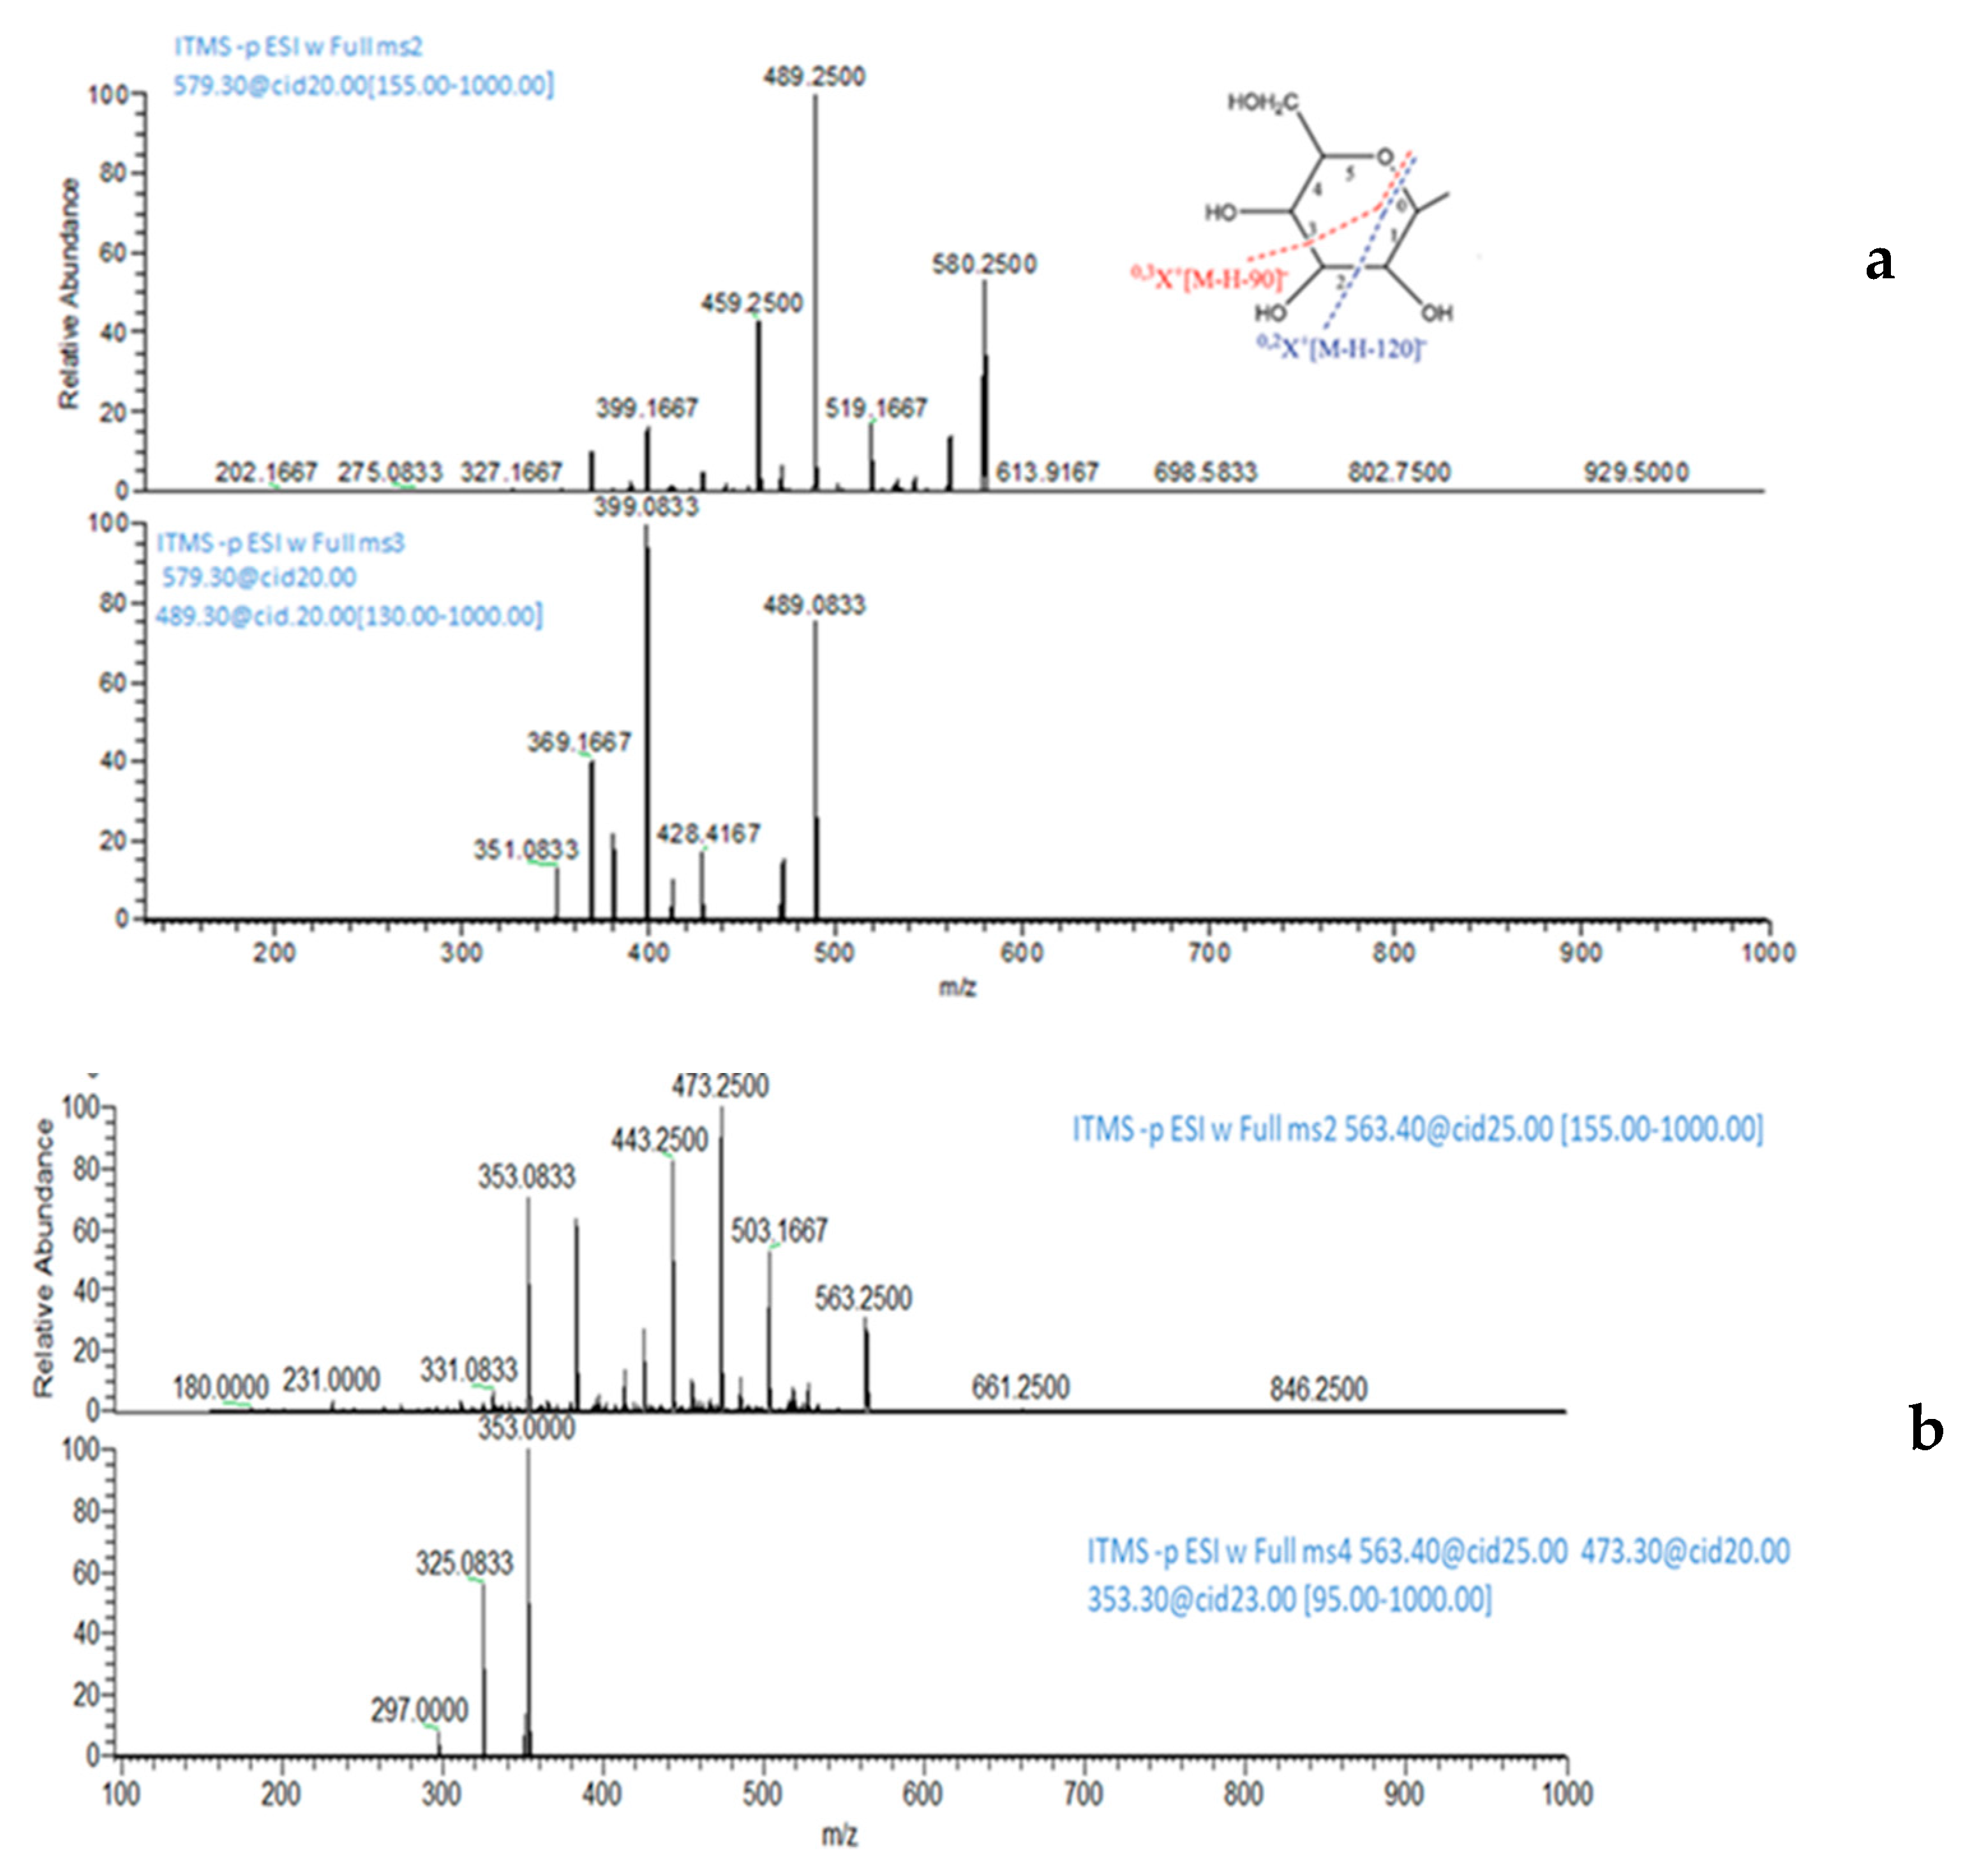
| 9 | Carlinoside/Neocarlinoside/Isocarlinoside | 581 | 563; 545; 527; 509 | 579 | 489; 399 |
| 10 | Carlinoside/Neocarlinoside/Isocarlinoside | 581 | 563; 545; 527; 509 | 579 | 489; 399 |
| 11 | Isoschaftoside | 565 | 547; 529; 511; 427; 349 | 563 | 473; 353; 325 |
| 13 | Schaftoside | 565 | 547; 529; 511; 427; 349 | 563 | 473; 353; 325 |
| (a) Free (FP) and Total Phenols (Bs, Bf and B) from Basic Hydrolyses in mg/100 g | ||||
| Compounds | FP | Bs | BF (on whole flour) | B |
| Carlinoside/isocarlinoside/neocarlinoside (9) | 6 | - | 4 | 2 |
| Carlinoside/isocarlinoside/neocarlinoside (10) | 5 | - | 3 | 2 |
| Isoschaftoside (11) | 7 | 6 | 7 | 13 |
| Schaftoside (13) | 17 | 12 | 15 | 22 |
| Ferulic Acid (15) | 3 | 223 | 12 | 48 |
| Methyl Ferulate (19) | - | - | 70 | 178 |
| Total ferulates | 3 | 223 | 82 | 226 |
| Total phenols | 38 | 241 | 111 | 265 |
| (b) Total Phenols Obtained Applying the Acidic Hydrolysis mg/100g | ||||
| Compounds | LG1 | LG2 | LG3 | LG4 |
| Carlinoside/isocarlinoside/neocarlinoside (9) | 2 | 2 | 2 | 2 |
| Carlinoside/isocarlinoside/neocarlinoside (10) | 3 | 2 | 3 | 3 |
| Isoschaftoside (11) | 10 | 6 | 6 | 6 |
| Schaftoside (13) | 17 | 10 | 9 | 10 |
| Ferulic Acid (15) | 2 | 2 | 3 | 2 |
| Methyl Ferulate (19) | 245 | 197 | 208 | 158 |
| Total ferulates | 247 | 199 | 211 | 160 |
| Total phenols | 279 | 219 | 231 | 181 |
| N. Reads | Amount (%) | |||||
|---|---|---|---|---|---|---|
| Phylum | Class | Order | Family | Genus | ||
| Firmicutes | Bacilli | Lactobacillales | Lactobacillaceae | Lactobacillus | 47,344 | 45.4% |
| Firmicutes | Bacilli | Lactobacillales | Enterococcaceae | Enterococcus | 29,195 | 28.0% |
| Firmicutes | Bacilli | Lactobacillales | Lactobacillaceae | Pediococcus | 17,711 | 17.0% |
| Firmicutes | Bacilli | Lactobacillales | Unclassified | Unclassified | 3863 | 3.7% |
| Firmicutes | Bacilli | Lactobacillales | Lactobacillaceae | Unclassified | 3391 | 3.3% |
| Firmicutes | Bacilli | Lactobacillales | Streptococcaceae | Lactococcus | 1218 | 1.2% |
| Unclassified | Unclassified | Unclassified | Unclassified | 918 | 0.9% | |
| Others | 637 | 0.6% | ||||
| Total | 104,277 |
© 2019 by the authors. Licensee MDPI, Basel, Switzerland. This article is an open access article distributed under the terms and conditions of the Creative Commons Attribution (CC BY) license (http://creativecommons.org/licenses/by/4.0/).
Share and Cite
Balli, D.; Bellumori, M.; Paoli, P.; Pieraccini, G.; Di Paola, M.; De Filippo, C.; Di Gioia, D.; Mulinacci, N.; Innocenti, M. Study on a Fermented Whole Wheat: Phenolic Content, Activity on PTP1B Enzyme and In Vitro Prebiotic Properties. Molecules 2019, 24, 1120. https://doi.org/10.3390/molecules24061120
Balli D, Bellumori M, Paoli P, Pieraccini G, Di Paola M, De Filippo C, Di Gioia D, Mulinacci N, Innocenti M. Study on a Fermented Whole Wheat: Phenolic Content, Activity on PTP1B Enzyme and In Vitro Prebiotic Properties. Molecules. 2019; 24(6):1120. https://doi.org/10.3390/molecules24061120
Chicago/Turabian StyleBalli, Diletta, Maria Bellumori, Paolo Paoli, Giuseppe Pieraccini, Monica Di Paola, Carlotta De Filippo, Diana Di Gioia, Nadia Mulinacci, and Marzia Innocenti. 2019. "Study on a Fermented Whole Wheat: Phenolic Content, Activity on PTP1B Enzyme and In Vitro Prebiotic Properties" Molecules 24, no. 6: 1120. https://doi.org/10.3390/molecules24061120