Article

Study of Catalytic CO2 Absorption and Desorption with Tertiary Amine DEEA and 1DMA-2P with the Aid of Solid Acid and Solid Alkaline Chemicals

1
Department of Environmental Science and Engineering, College of Science, University of Shanghai for Science and Technology, Shanghai 200093, China
2
Clean Energy Technology Research Innovation (CETRI), Faculty of Engineering and Applied Science, University of Regina, 3737 Wascana Parkway, Regina, SK S4S 0A2, Canada
*
Authors to whom correspondence should be addressed.
Molecules 2019, 24(6), 1009; https://doi.org/10.3390/molecules24061009
Submission received: 21 January 2019 / Revised: 4 March 2019 / Accepted: 8 March 2019 / Published: 13 March 2019
(This article belongs to the Special Issue Catalysis for Energy Storage and CO2 Conversion)

Abstract

:
Studies of catalytic CO2 absorption and desorption were completed in two well-performed tertiary amines: diethylmonoethanolamine (DEEA) and 1-dimethylamino-2-propanol (1DMA-2P), with the aid of CaCO3 and MgCO3 in the absorption process, and with the aid of γ-Al2O3 and H-ZSM-5 in the desorption process. The batch process was used for CO2 absorption with solid alkalis, and the recirculation process was used for CO2 desorption with solid acid catalysts. The CO2 equilibrium solubility and pKa were also measured at 293 K with results comparable to the literature. The catalytic tests discovered that the heterogeneous catalysis of tertiary amines on both absorption and desorption sides were quite different from monoethanolamine (MEA) and diethanolamine (DEA). These results were illustrative as a start-up to further study of the kinetics of heterogeneous catalysis of CO2 to tertiary amines based on their special reaction schemes and base-catalyzed hydration mechanism.

1. Introduction

The global warming and sudden change of climates have driven scientists and engineers to develop cost-effective processes for CO2 removal from coal-fired power plants [1]. The chemical absorption of CO2 in the post-combustion CO2 capture process may be implemented on the commercial scale [2]. This absorption process enables the CO2 removal with “energy efficient” amine solvents via an absorption-desorption unit [1].
The development of attractive and novel amines has been a strong drive to meet these basic requirements: high absorption rates, large cyclic capacity, and low regeneration energy [3,4]. Amine solutions of monoethanolamine (MEA), diethanolamine (DEA) and methyldiethanolamine (MDEA) have been widely used for CO2 removal, as benchmarks of primary, secondary, and tertiary amines [5]. MEA exhibits a higher reaction rate, but smaller cyclic capacity, higher energy costs for regeneration and higher corrosion rates [4]. To overcome these limitations, MEA is usually blended with a variety of tertiary amines in preparation for improved solvents called “MEA-R3N blends” such as MEA-MDEA [6,7], MEA-4-diethylamino-2butabol (DEAB) [6,7], MEA-diethylmonoethanolamine (DEEA) [8] and MEA-1-dimethylamino-2-propanol (1DMA-2P), etc. [9]. Among these MEA-R3N blends, the concentration of MEA is usually 5.0 mol/L, but the concentration of tertiary amine is around 1.0–2.0 mol/L for MDEA [6,7], and 1.0–1.5 for amines such as DEEA (1.0 mol/L) [9], 1DMA-2P (1.0 mol/L) [9] of DEAB (1.25 mol/L) [6,7] etc. In industry, the tertiary amines are usually prepared at a concentration of 1–1.5 mol/L for absorption if blended with a concentrated amine such as 5.0 mol/L MEA.
Most tertiary amines fulfill two basic requirements: a large cyclic capacity with a relatively lower regeneration energy compared with MEA and DEA [5]. Among these commercial tertiary amines, MDEA is always used as benchmark. Recently, two good performance tertiary amines have drawn research interest: DEEA and 1DMA-2P [1,5]. DEEA is studied for its relatively higher CO2 equilibrium solubility than MDEA [10]. The pKa of it [11] is studied, and its mass transfer performance [12] is also better than MDEA. 1DMA-2P is also investigated for its large CO2 cyclic capacity, much higher absorption rates (kinetics) [13] and better mass transfer characteristics [14] than MDEA. It also has a much lower CO2 absorption heat than MEA, DEA, PZ and MDEA [15]. Moreover, the equilibrium solubility, the pKa [16] and ion speciation plots of 1DMA-2P-CO2-H2O are generated with 13C NMR methods [17].
Meanwhile, based on recent studies, the effects of solid base chemicals to MEA (K/MgO, CaCO3 and MgCO3) [18,19] and DEA (CaCO3 and MgCO3) [20] on CO2 absorption have been verified. They accelerate the CO2 absorption rates. However, the effects of both solid bases onto a tertiary amine have rarely been discussed either. The effects of solid acid catalysts (γ-Al2O3, H-ZSM-5, TiO(OH)2, and transition metal oxides V2O5, MoO3, WO3, TiO2, and Cr2O3) to MEA [9,21,22,23,24,25] and DEA [26] have also been studied and proven to be effective in the reduction of heat duty. Some studies have been completed to investigate the effects of solid acid catalysts (H-ZSM-5, MCM-41 and SO42−/ZrO2) with blended amine solvents of 5 + 1.0 mol/L MEA-DEEA and MEA-1DMA-2P [9]. However, the effects of the heterogeneous catalysis toward CO2-R3N alone require detailed investigation.
The catalytic effects were verified of CaCO3 and MgCO3 toward MEA (19) and DEA (20) on CO2 absorption, and also (γ-Al2O3 and H-ZSM-5) to MEA [9,21,22,23] and DEA [26] on CO2 desorption. These catalytic effects toward tertiary amines were the purpose of this study. Since the reaction schemes and the mechanism of CO2 absorption with tertiary amines are quite different from primary amine (MEA) or secondary amine (DEA), these differences make the effects of heterogeneous catalysis worthy of deep investigation with solid bases and solid acids as a start-up. For this study, the CO2 absorption with 1.0–1.5 mol/L DEEA and 1DMA-2P solvents were investigated with the aid of a solid base (CaCO3 and MgCO3), and CO2 desorption 1.0–2.0 mol/L DEEA and 1DMA-2P solvents for solid acids (γ-Al2O3 and H-ZSM-5). The effects of heterogeneous catalysis on both sides of absorption and desorption were studied and compared with MEA and DEA.

2. Theory

2.1. Reaction Scheme, and Suitable Mechanisms of CO2-R3N Interaction

The reaction scheme of the CO2 reaction with tertiary amine (R1R2R3N) is presented below with Equations (1)–(6) [3]. Equation (1) is the major reaction being emphasized. Different from primary/secondary amines (R1NH2/R1R2NH), the major anion is bicarbonate (HCO3) instead of carbamate (R1R2N-COO).
CO2 + R1R2R3N + H2O ↔ R1R2R3NH+ + HCO3
R1R2R3NH+ ↔ R1R2R3N + H+
CO2 + H2O ↔ H2CO3 ↔ H+ + HCO3
CO2 + OH ↔ HCO3
HCO3 ↔ H+ + CO32−
H2O ↔ H+ + OH
Based on a recent review of kinetics [27], the Zwitterion mechanism [28] and Termolecular mechanism [29] are suitable for CO2 reactions with primary and secondary amines. The mechanism of CO2 reaction with tertiary amines was proposed by Donaldson and Nguyen and is termed the “base-catalyzed hydration mechanism” [30]. The tertiary amine (R1R2R3N) does not react directly with CO2, but rather acts as a base that catalyzes the hydration of CO2 [30] based on Equation (1).
The rate equation was written as Equation (7), with the rate constant of tertiary amine (R3N) of k R 3 N : [31] from Equation (7), the bigger amine concentration results in higher absorption rates.
r CO 2 = k R 3 N [ R 3 N ] [ CO 2 ] .
Moreover, there are three balance equations in the R3N-CO2-H2O systems, as presented in Equations (8)–(10) [3].
Mass balance of R3N:
[R1R2R3N]0 = [R1R2R3NH+] + [R1R2R3N]
Mass balance of Carbon, where α is CO2 loading:
α × [R1R2R3N]0 = [CO2(aq)] + [HCO3] + [CO32−]
Charge balance:
[R1R2R3NH+] + [H+] = [OH] + [HCO3] + 2[CO32−]

2.2. Role of Solid Alkalis Chemicals for Absorption

The catalytic effects of both solid alkalis to MEA and DEA were already studied [19,20]. However, the role was slightly different with tertiary amines. Since the reaction mechanism of CO2-R3N was “base-catalyzed hydration” [30], reactions (1)–(6) could be facilitated with either a liquid base [OH] or solid alkalis/Lewis base [19] due to the acidic chemical nature of CO2. Therefore, the solid alkalis (CaCO3 and MgCO3) could enhance the hydration of CO2, and proton transfer of [H2CO3] to water or R3N, as an aid to the liquid base of [OH].
CO 2 + H 2 O Base H + + HCO 3
CO 2 + R 1 R 2 R 3 N + H 2 O Base H + + HCO 3
After detailed investigations, the role of solid alkalis was “Lewis base” and “proton acceptor” [19] to facilitate proton transfer of H2CO3, with reactions below:
H2CO3 + Catalyst ↔ HCO3 + Cat-[H+]
Cat-[H+] + R3N ↔ Catalyst + [R3NH+]
The solid catalyst (CaCO3/MgCO3) accepted the protons [H+] from H2CO3 with its long pair of electrons on the “O atom” via (13). After that, the proton was transferred from the solid catalyst to the tertiary amine (R3N) via (14), because the tertiary amine is a stronger base than Lewis base (CaCO3/MgCO3). The overall reaction was (3) + (13) + (14) = (1), and the solid catalyst was involved in the reaction but did not change the reactant or products. From Equations (13) and (14), with an increased amount of solid base, the reaction rate of (13) would increase but the rate of (14) would decrease. With an increased mass of catalysts, the protons [H+] are easier to transfer onto a solid surface, but harder to release back to R3N. Therefore, there is an optimized amount of solid catalyst for CO2 absorption, after that, the rates slightly decreased.

2.3. Role of Lewis Acid and BrØnsted Acid for CO2 Desorption

The role of Lewis acid (γ-Al2O3) and BrØnsted acid for CO2 desorption with MEA and DEA has already been discussed repeatedly [9,21,26].
However, the role of both acids needs to be discussed for CO2 desorption with tertiary amines because the reactions were different, and no carbamate was involved. After the study of reaction schemes, the effect and mechanism of both solid acids were discussed as follows:
γ-Al2O3 as catalyst:
Al2O3 + 2OH ↔ 2 AlO2 + H2O
R1R2R3NH+ + AlO2 ↔ R1R2R3N + HAlO2
HAlO2 + HCO3 ↔ AlO2 + H2O + CO2
H-ZSM-5 as catalyst:
H-ZSM-5 + HCO3 ↔ (ZSM-5) + H2O + CO2
R1R2R3NH+ + (ZSM-5) ↔ R1R2R3N + H-ZSM-5
Both solid acids could facilitate the CO2 production rates and reduce the energy costs. In short, the Al2O3 is Amphoteric Oxide, and it was converted into AlO2 in basic solutions. From the published energy diagrams [6], Al2O3 (AlO2) can speed up the proton transfer from R1R2R3NH+ to HCO3 and CO2 generation under heat. H-ZSM-5 is the proton donor, which directly provides protons to the solvent and facilitates CO2 generation.
Based on the reaction schemes above, both solid acids involve two steps, namely “accept proton” and “donate/transfer proton”. Since γ-Al2O3 contains no proton, it has to “accept proton” first and “transfer proton” later in the desorption process. The H-ZSM-5 contains proton itself, and it intends to “donate proton” first and then “accept proton” from R1R2R3NH+. The mechanisms are similar for both solid catalysts but the order of “accept proton” and “donate/transfer proton” is opposite.

3. Materials and Experimental Methods

3.1. Chemicals

The solid chemicals were purchased from Huishan Chemical Ltd; they were CaCO3 and MgCO3. The CO2 gas and the liquid chemicals DEEA and 1-DMA2P were purchased from Tansoole Chemical Ltd. (Shanghai, China). HCl and methyl orange were commercially obtained from Guoyao Chemical Ltd. (Shanghai, China). The chemical structures and full name of DEEA and 1DMA2P were presented elsewhere [5].

3.2. pKa Analysis

The titration technique was adopted to determine the amine dissociation constant (Ka) with standard 1 mol/L HCl [32,33,34,35]. This is a simplified pH method to test the pKa of different amines under different temperatures. For an aqueous amine solution, the Equation (20) below showed the deprotonation reaction of AmineH+/Amine as a conjugated pair of acid-bases.
AmineH + k a Amine + H +
Based on a detailed pKa study of tertiary amines [11] the pH meter measured the activity {R3NH+} of amine solvents instead of its real concentration [R3NH+]. The correlation is {R3NH+} = [R3NH+] γ BH + [11]. This study assumed that this diluted amine solvent (<0.10 mol/L) is the ideal solution (when the concentration is very low and the activity coefficient γ BH + equals to 1 {BH+} ≈ [BH+]) [11]. Then, Equations (21) and (22) below were used to calculate the Ka.
K a , Amine = [ Amine ] [ H + ] [ AmineH + ]
p K a = log ( K a , Amine ) = log ( [ Amine ] [ H + ] / [ AmineH + ] )
The pH meter was used to measure the concentration of H+ in the solution [32,33,34,35]. As presented in Equation (23), the disappearance of H+ during the titration process resulted from its reaction with Amine to generate AmineH+, and reaction (20) is the dominant in aqueous solution. A mass balance of protons as shown in Equation (23) was adopted to calculate the concentration of AmineH+, and the amine balance equation as shown in Equation (24) was adopted to calculate free amine.
nHCl [ H + ] V total = [ AmineH + ] V total
( [ Amine ] + [ AmineH + ] ) V total = n 0 , Amine
In Equations (23) and (24) above, nHCl is the number of moles of HCl added during the titration process, Vtotal is the total liquid volume after the titration process, and n0,Amine is the moles of free amines as a start, which can be determined by titration with 1.0 mol/L HCl until the indicator of methyl orange turns pink.
For the experiment, the Ka of amine was determined based on the procedure described [32]. Briefly speaking, 100 mL of 0.10 mol/L amine solution was carefully prepared and titrated with 10 mL of 1.0 mol/L HCl standard solution at 298 K until the end point was observed. During the titration process, the pH meter was placed in the solution to record pH value with the addition of 1 mL HCl each time. A table of pH value and amount of HCl was generated. Equations (21)–(24), were used to determine the concentration of [AmineH+], [Amine] and then calculate the dissociation constant (Ka). The dataset was only recorded at pH > 9, because the results would be inaccurate if pH < 9, where the generation of [H+] or [OH] from water is not negligible.

3.3. CO2 Absorption Process with Absorption Profiles

A set of stirred-cell reactors were built in the lab, with the flow chart exhibited in Figure S1. The process was similar to that of other studies, [17,20] and the diameter of the reactor is 11.0 cm (a constant interfacial area of 95.0 cm2). The solid alkalis (CaCO3 and MgCO3) were pelletized at 2–3 mm and wrapped into small balls with a diameter of 2.5 cm, each ball contained about 2.5 g, similarly [20].
The CO2 absorption process was similar to that of other works [17,20]. Three-hundred milliliters of amine solvent was prepared at a concentration of 1.0–1.5 mol/L. For 1DMA-2P, it started to crystalize at 2.0 mol/L at 293 K, then 2.0 mol/L was not tested for absorption. The CO2 gas flow was introduced into the reactor at a rate of 1.5 L/min. The PCO2 was 101.3kPa with 100% purity. The operation temperature was maintained at 20 °C by the cooled water bath. The process was connected to the air with the pressure of 1 atm. Some vials were prepared and 2 mL samples were pipetted every 3–5 min into each of them. The titration technique was adopted to test the CO2 loadings and the results were recorded within 3−5 min [17]. A Chittick apparatus with an AAD of 2.5% was adopted to conduct the CO2-loading tests of the samples [36]. In order to ensure repeatability, these tests were performed at least twice.
We already verified the catalytic effect of CaCO3 with CO2 absorption with 1.0 mol/L MEA in another study [19]. The results exhibited that the order of catalytic effects was: 5 g CaCO3 in gas-liquid interface >5 g, CaCO3 in bulk of liquid >0 g, CaCO3 ≈ intert stainless steel. From the BET tests of CaCO3 and MgCO3, the surface areas were 0.428 m2/g for CaCO3 and 9.498 m2/g for MgCO3. The pore diameters were 31.3 nm and 4.31 nm, which facilitated the external mass transfer of amine molecules onto a solid surface. The inert material with large surface area might have a significant effects of mass transfer causing the increase of CO2 absorption. However, it could not replace the role of “Lewis base“ or “proton acceptor“ as solid alkaline catalysts to enhance the CO2 absorption with tertiary amine.
After the absorption profiles were plotted with (α, time), the initial absorption rates (Iabs_rate, mol CO2/min) [34] are determined as the slope of the linear regression of absorption profiles was at data range of CO2 loadings of 0.0–0.20 mol/mol, in Equation (25):
I abs _ rate = C × V d α d t
where “C” is the Concentration and “V” is the Volume, and α is the CO2 loading.
The initial absorption rates were adopted in this study to compare the CO2 absorption performance of different cases of catalysts. These data were generated at a consistent level for different catalytic and non-catalytic cases. The results were inadequate for kinetic studies for now, but it was adequate to verify the catalytic effect as a start up.

3.4. CO2 Desorption Tests with Heat Duty Calculation

An open recirculation-process (Figure S2) vessel equipped with an electrometer [9,26,37] was adopted to conduct the CO2 desorption tests under atmosphere to extract DEEA and 1DMA-2P solvents at 1.0 mol/L, 1.5 mol/L and 2.0 mol/L, and two types of solid acid catalyst were used as γ-Al2O3 and H-ZSM-5 representing Lewis acids and Brønsted acids [9,26]. The acidic catalytic conditions were 5.0 g, 7.5 g and 10.0 g, This CO2 desorption process was similar to that of others in the literature [9,26]. In this study, 250 mL of the amine solvent was put into the flask with a volume of 500 mL. The CO2 loading was over 0.80 mol/mol in preparation for desorption, with CO2 introduced into amine solvents beforehand. Small balls of various catalysts were placed into the solvents as well.
The experimental procedures were similar to those in our previous study [26]. The process was stirred and heated to 363 K. Based on the analysis of the CO2 loading of samples at 0−4 h, the catalytic effects on CO2 desorption were evaluated. A vial into which the samples were pipetted was then cooled down in a cooled water bath so as to maintain the CO2 loading. Similar to absorption, the CO2 loading was tested immediately after sample collection by titration [26]. A Chittick apparatus [36] was adopted to conduct the CO2-loading tests of each sample and they were performed at least twice so as to ensure repeatability. The average CO2 loading was then plotted for each run.
As part of the pivotal desorption parameter [9,26,33], the heat duties were calculated from CO2 production with Equations (26) and (27) below [9,21,26]. The nCO2 (mol) is the amount of desorbed CO2, α (mol of CO2 per mole of amine) is the CO2 loading, and C (mol/L) and V (L) are the concentration and volume of amine solvent. This method of calculating heat duties was similar to that in other studies [9,21,26].
H = heat   input / time amount   of   CO 2 / time = E nCO 2   kJ   of   electricity / h mol   of   CO 2 / h
nCO 2 = ( α rich α lean ) C × V

4. Results and Discussions

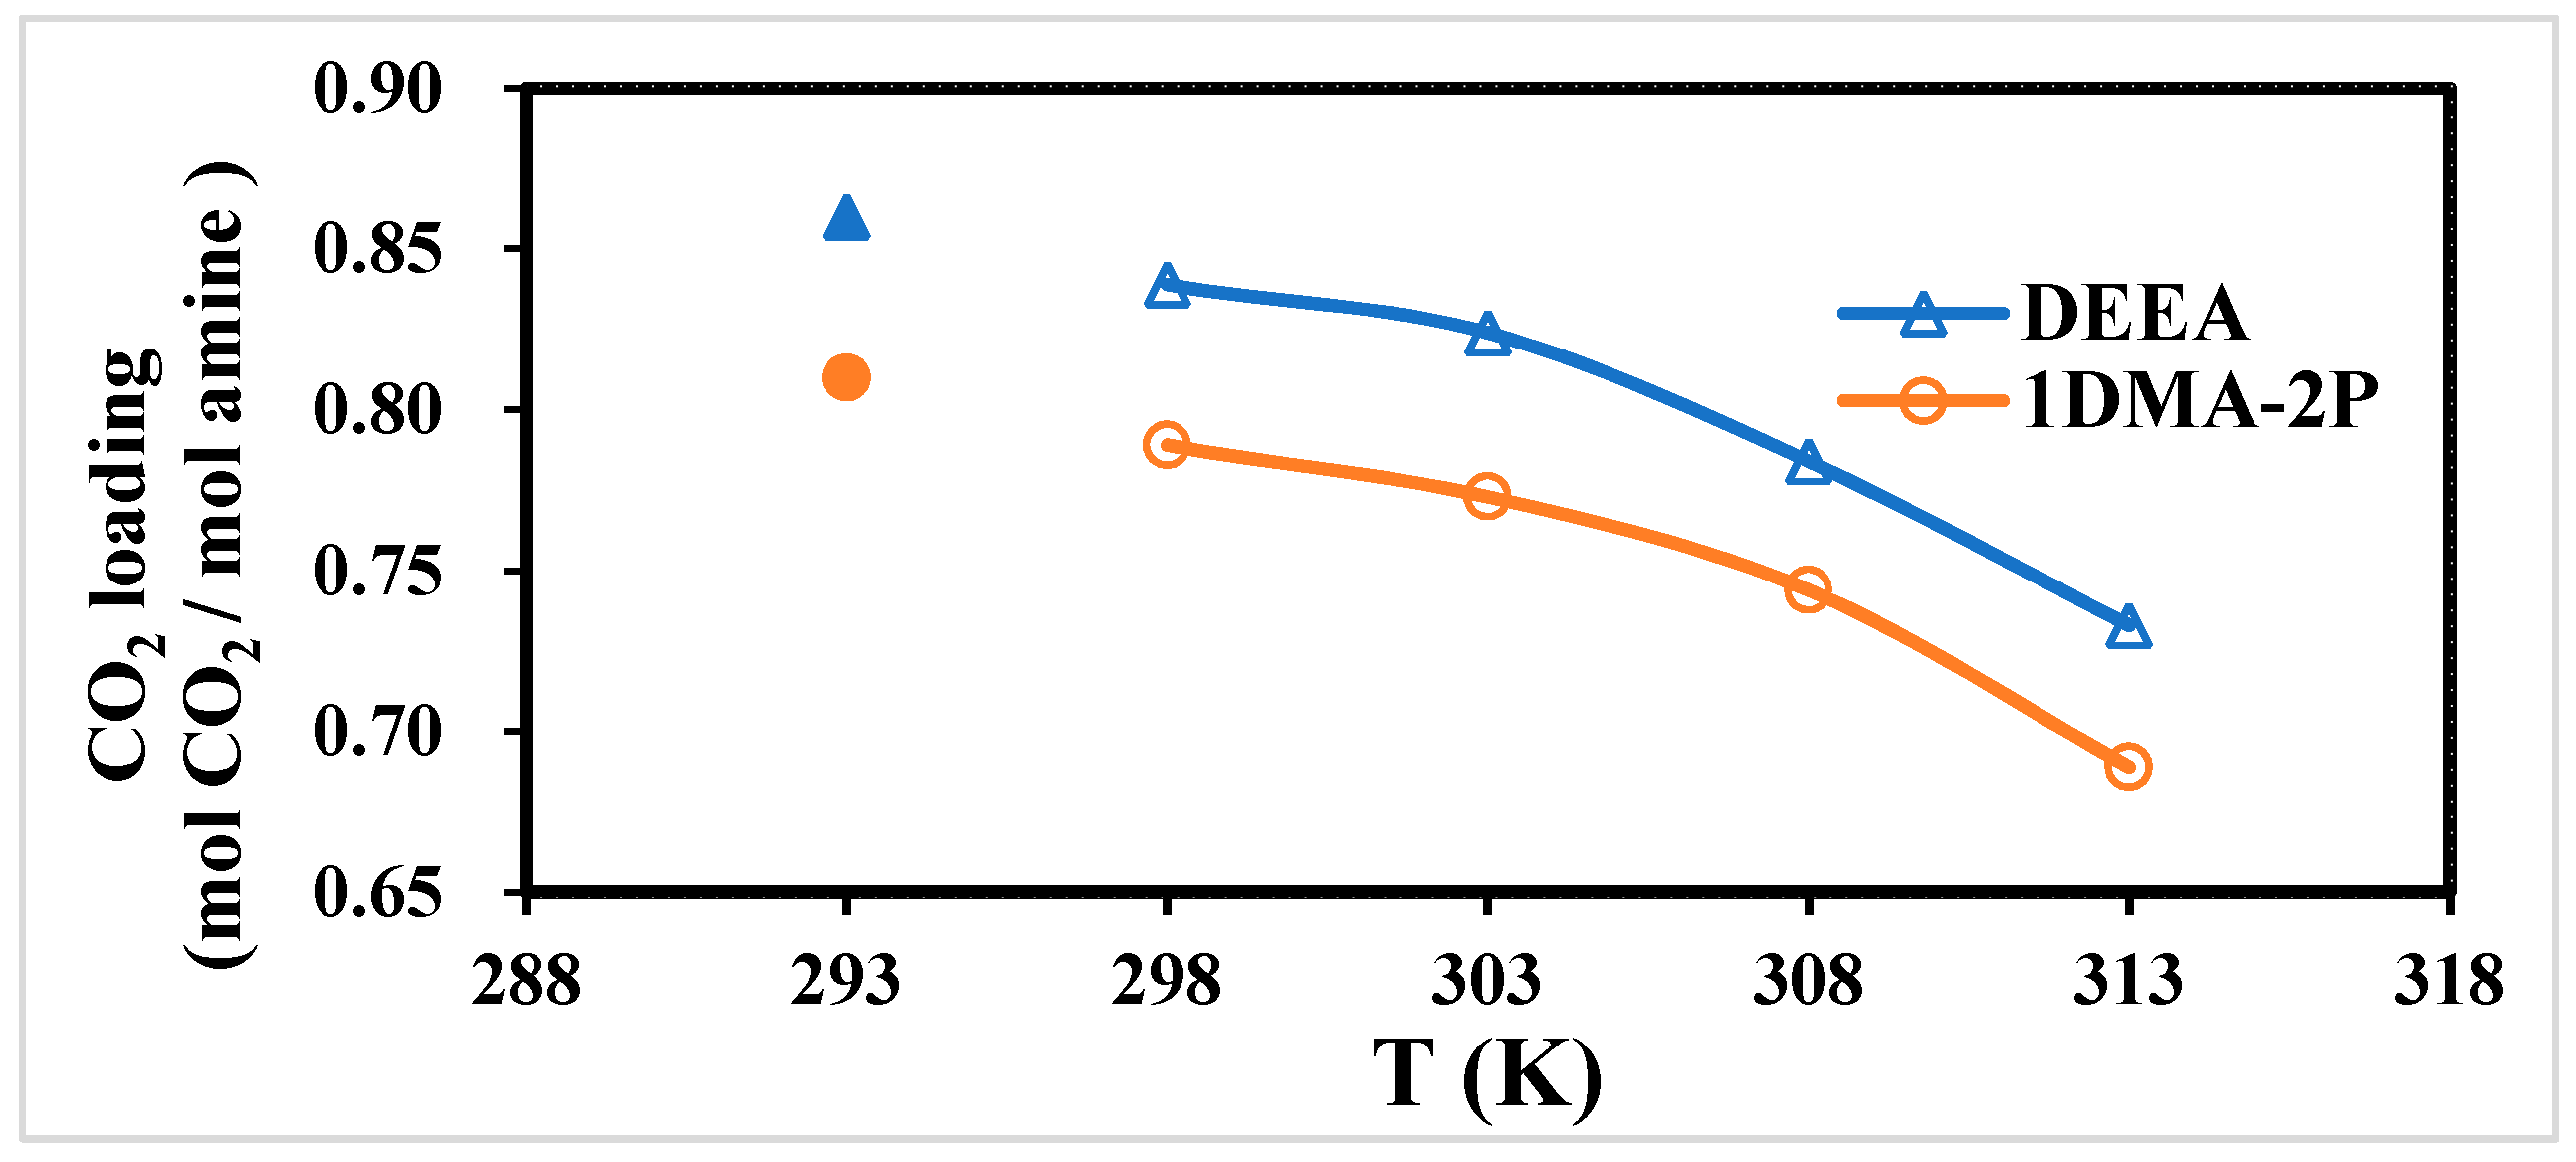
4.1. The Critical Point of CO2 Absorption Curve of DEEA and 1-DMA-2P at 293 K, Affected by Equilibrium Solubility

The CO2 equilibrium solubility at different temperatures and pressures was one of the key parameters for screen solvent [15]. Although different solid base chemicals could accelerate the CO2 absorption rates, they could hardly shift the CO2 equilibrium solubility under the VLE model, which was only determined by temperature [10].
There are two common methods to generate the VLE model of tertiary amines, (1) the predictive model by simulation using MDEA as benchmark [38,39], (2) experimental studies of CO2 solubility with absorption [5,10,15]. The equilibrium solubility of DEEA and 1DMA-2P was reported based on long-term vapor liquid equilibrium experiments at 298–313 K [5]. The accurate equilibrium solubility was relatively high due to the experimental procedures. Luo et al. completed the experiments and the modeling of data of DEEA-CO2-H2O at 1.0 to 4.0 mol/L under vapor-liquid equilibrium, from 293–353 K [10]. They used 0.15 L/min mixed gas of CO2/N2, with CO2 partial pressures from 6.2 kPa to 100.8 kPa and maintained 8–10 h to reach the thermodynamic equilibrium conditions. By the long-term tests, the equilibrium solubility of DEEA was 0.971 mol/mol at 293 K with PCO2 of 100.8 kPa. Similarly, Liu et al. completed the modeling of CO2 equilibrium solubility of 1DMA-2P solution, with CO2 partial pressures from 8 kPa to 101.3 kPa at 1, 2, and 5 mol/L, 298–333 K [15]. For 1.0 mol/L 1DMA-2P, the solubility was reported as 1.02 mol/mol at 101.3 kPa at 298 K with 8 h operation [15].
In this study, we determined the “critical point of CO2 absorption curves” based on the slope of CO2 absorption curves of 1.0 mol/L amine without catalysts. It was affected by the CO2 solubility or “Ion speciation plot” of R3N-CO2-H2O systems under the Vapor-liquid equilibrium model. From the CO2 absorption curves, different stages of the reaction were contained, (1) CO2 + R3N + H2O around 0–0.85 mol/mol, and (2) CO2 + H2O above 0.85 mol/mol when free R3N was exhausted. The slope of absorption curves turned very flat after this critical point, indicating that all the amines were converted to amineH+, and CO2 only reacted with water afterward. The critical point was determined by the graphic method based on the cross of slopes at different stages (Support Information).
Therefore, the “critical point of CO2 absorption curves” was calculated as about 0.87 mol/mol for DEEA, and 0.81 mol/mol for 1DMA-2P at 1.0 mol/L and 293 K here was based on the graphic method. The CO2 solubility of DEEA and 1DMA-2P under Vapor-Liquid Equilibrium (VLE) model was plotted in Figure 1 at 298–313 K [5]. Our data were added in Figure 1, but these data were not “CO2 equilibrium solubility”. It was affected by the “CO2 equilibrium solubility” and “Ion speciation plots”. From the literature value, CO2 equilibrium solubility of CO2 is 0.839 mol/mol for DEEA, and 0.789 mol/mol for 1DMA-2P at 298 K [5]. The trend was consistent from Figure 1 at 298–313 K: with an increase of temperature, the solubility of CO2 was slightly decreasing [5,10].

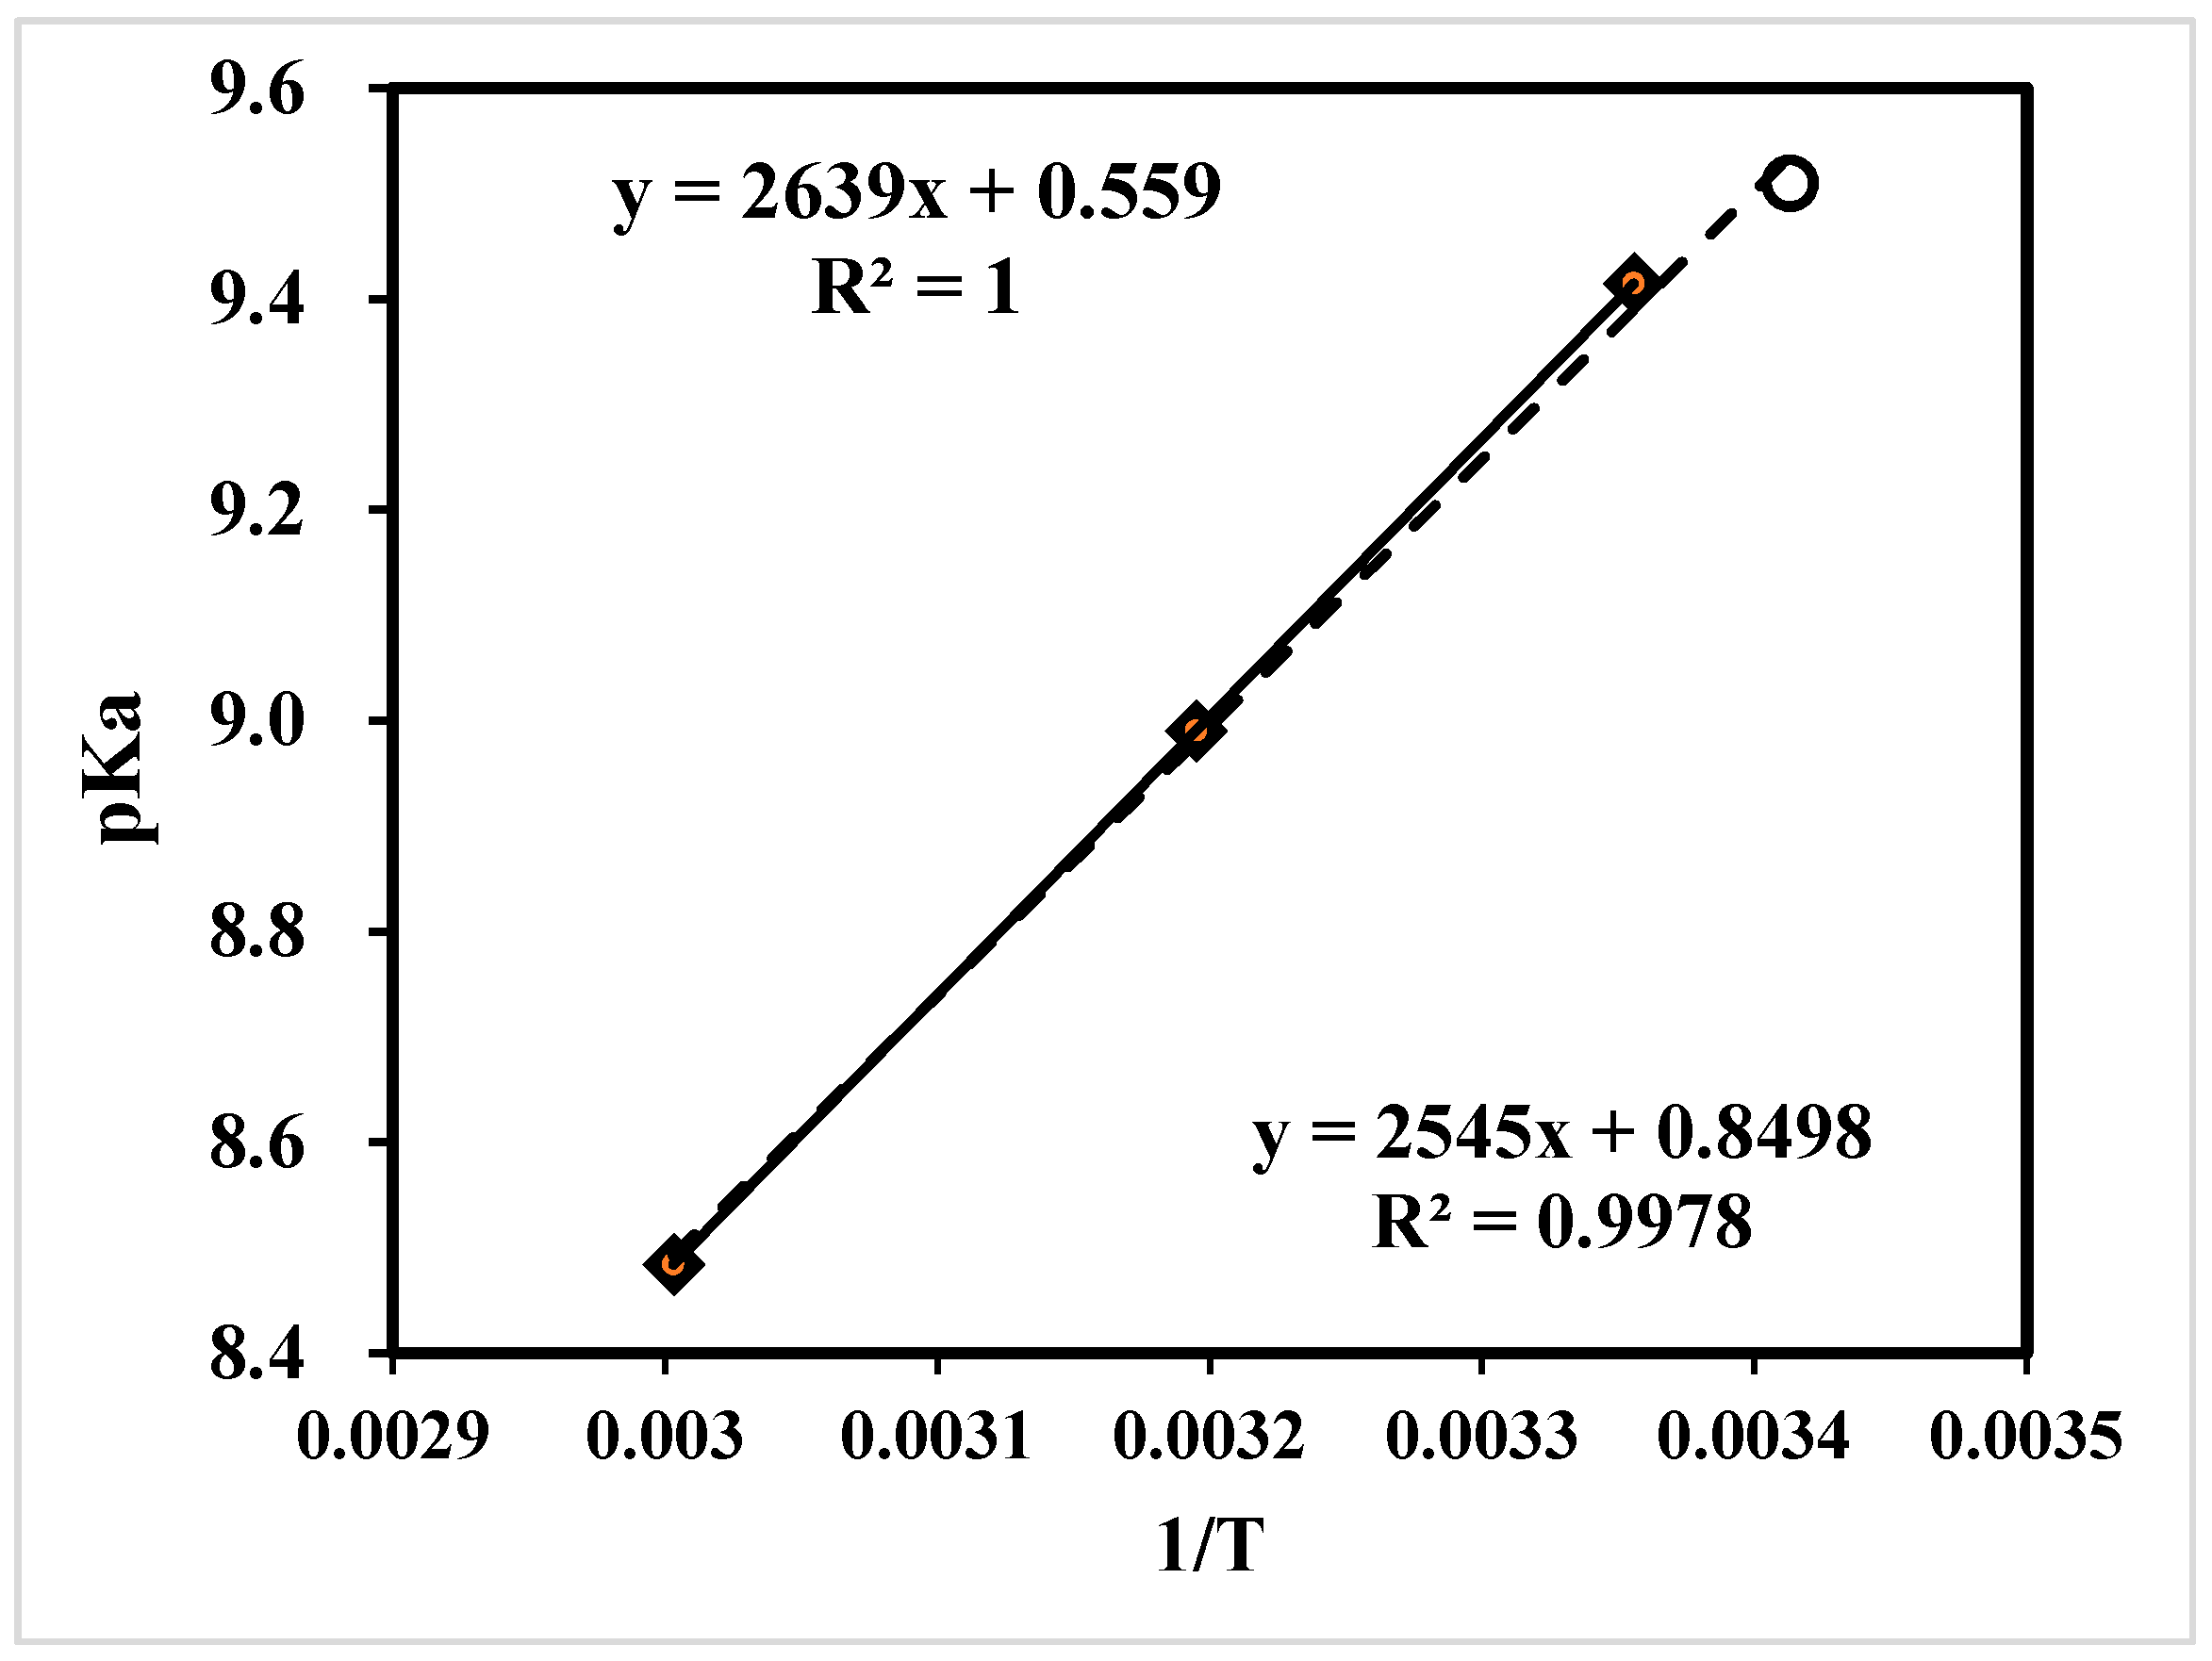
4.2. The pKa of DEEA and 1-DMA-2P at 293 K

The pKa is also an important parameter for tertiary amines, which can be used for the selection of amine solutions for both CO2 removal and the study of the reaction kinetic mechanism [15]. Based on the base-catalyzed mechanism, tertiary amines (R3N) do not directly react with CO2, but absorbed protons from H2CO3. The simplified pH method for the detection of pKa is quite similar to that of other studies [32,33,34,35]. It excluded the data of pH < 9.0. This was because the conjugated acid/base of [Amine]/[AmineH+] did not exist under acidic conditions (pH < 7.0). Moreover, a pH value between 7–9 was not selected either, for the calculation of pKa in Equation (22) was based on the assumption that the [H+] released into the solution was 100% from [AmineH+] with neglect of proton release from H2O. Meanwhile, the [OH] in the water solution was mainly from proton transfer from H2O to Amine, and [OH] released from H2O was also negligible. In the case of pH < 9, the [OH] in the solution was smaller than 10−5 mol/L, which was not 100 times bigger than the [OH] (10−7 mol/L) dissociated by neutral H2O. Then the dissociation of [OH] from H2O was not negligible, and thus Equation (22) had errors. Finally, the pKa was measured and grouped into Table 1 and Figure 2 for comparison.
Hence, the pKa was measured as 9.82 for DEEA at 293 K. This value was the same as the literature value of 9.82 at 293 K, [11] which reflected the accuracy. The pKa was measured as 9.51 for 1DMA-2P at 293 K, comparable to 9.41 at 298 K [15] from K2 correlation model for solubility study. It was measured as 9.67 at 301 K based on 13C NMR analysis. [17] Different methods might result in slight deviations. Recently, Liu et al developed a linear calibration of pKa of 1DMA-2P in Equation (27) at 298–333 K [15]. We combined these data with our own results and plotted in Figure 2. Our data (9.51, 293 K) was outside the range of that calibration curve, but the data was consistent with the line. The new linear calibration was generated in Equation (28) to expand the pKa of 1DMA-2P at 293-333 K.
pKa = 2639 T + 0.559 ; 298 333   K
pKa = 2545 T + 0.850 ; 293 333   K

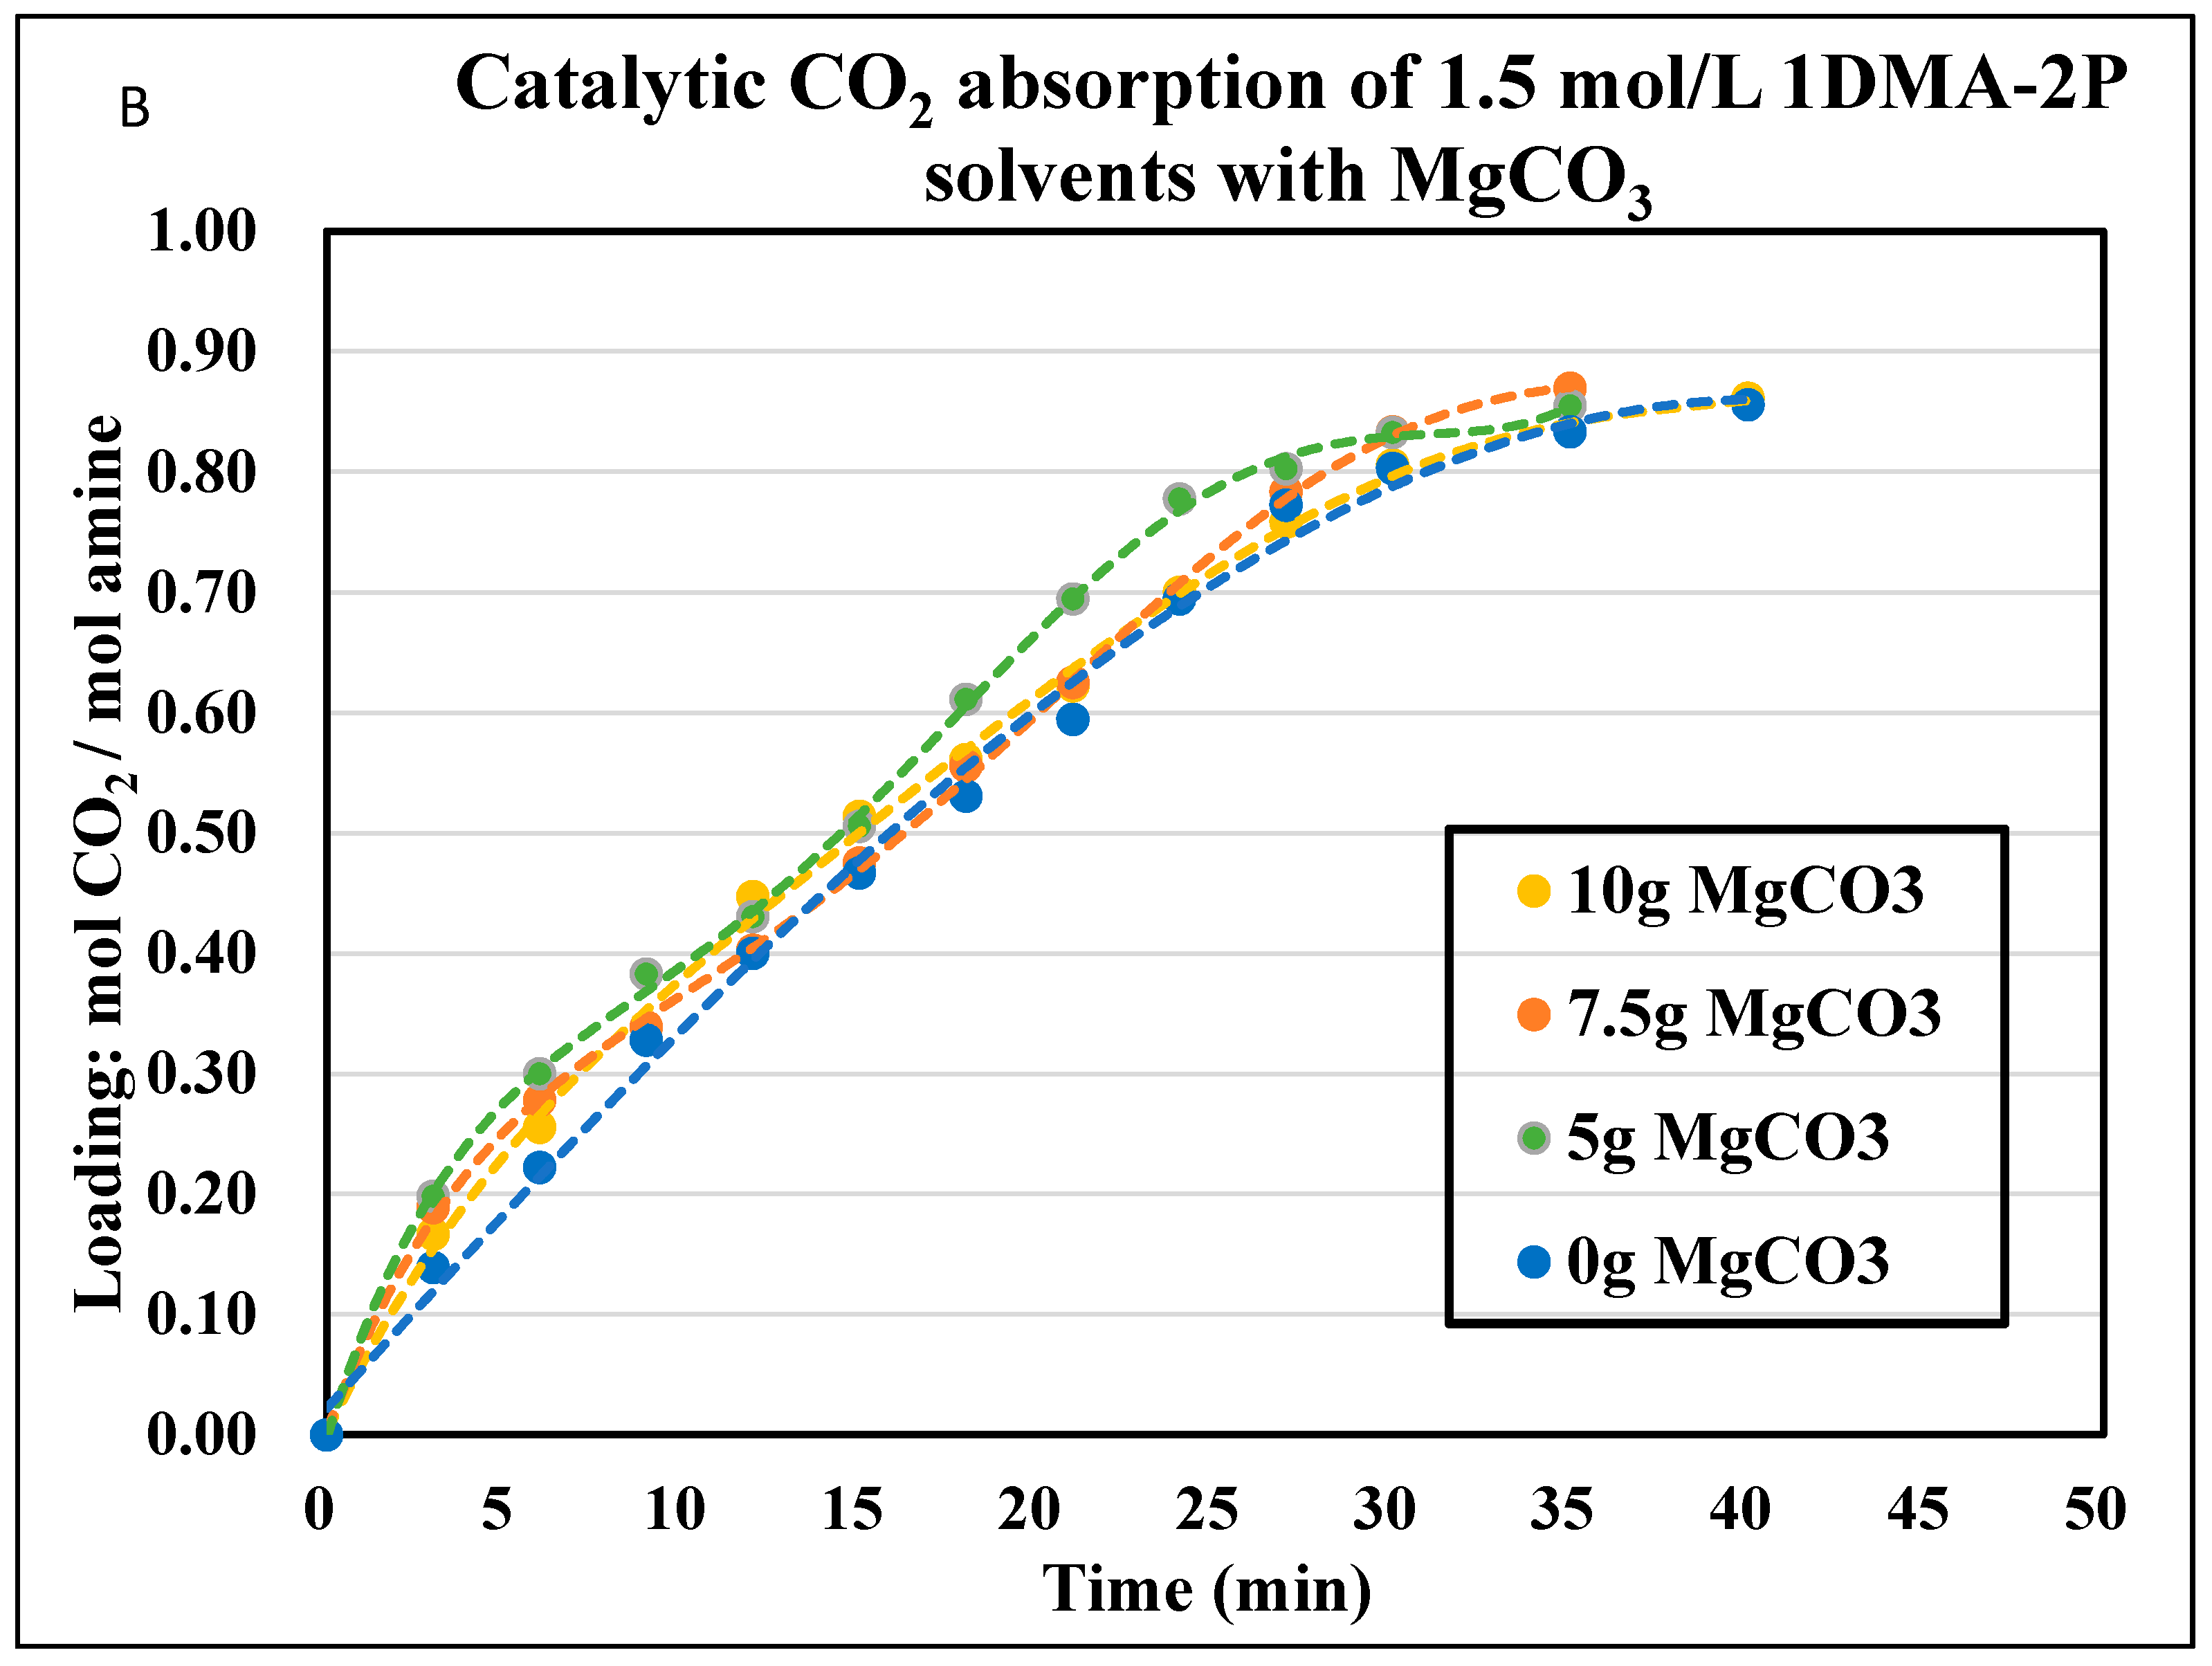
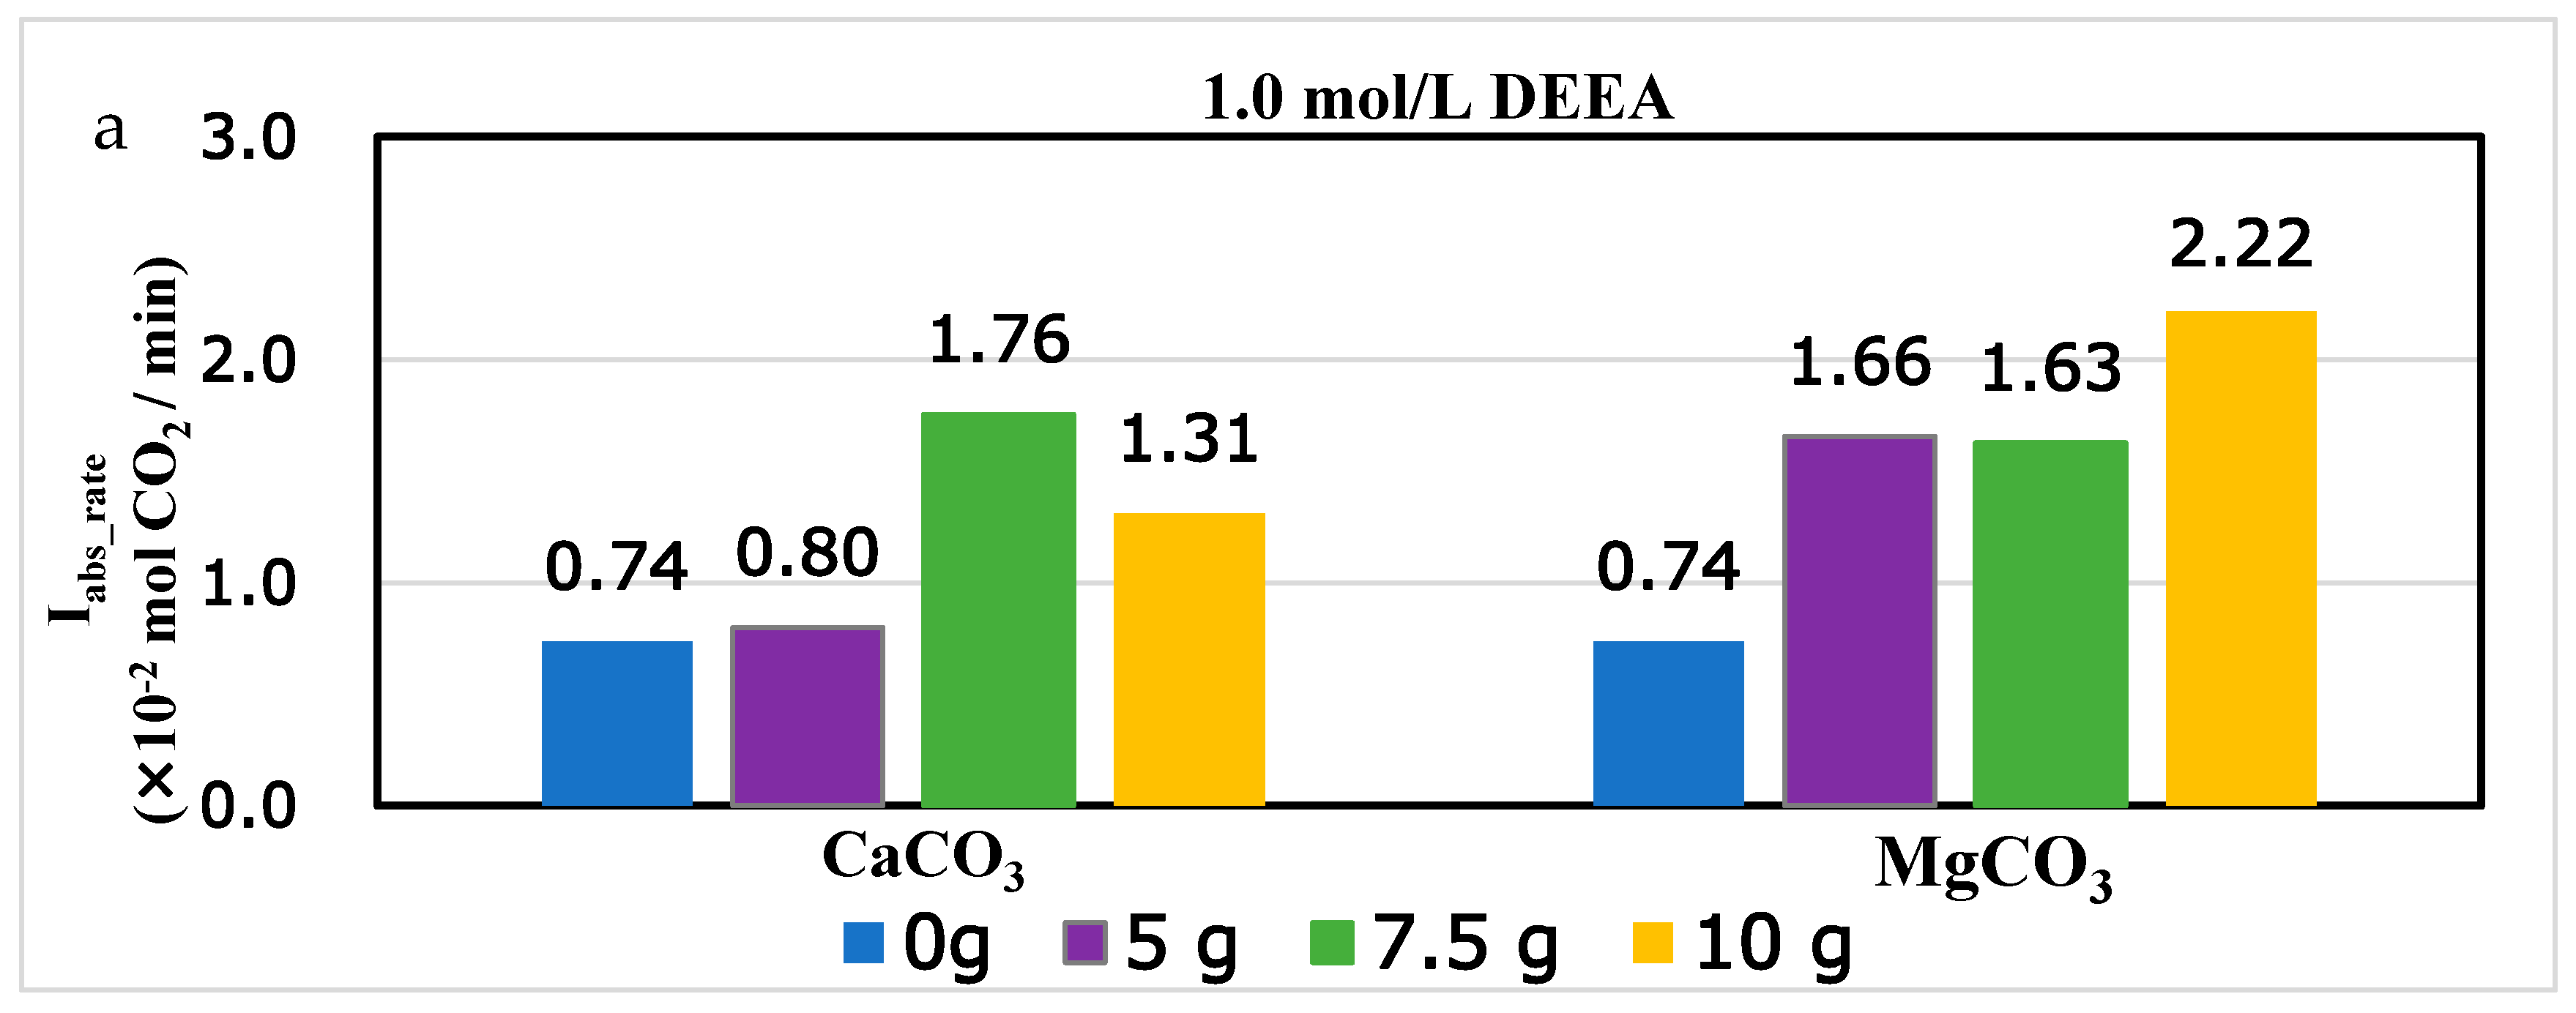
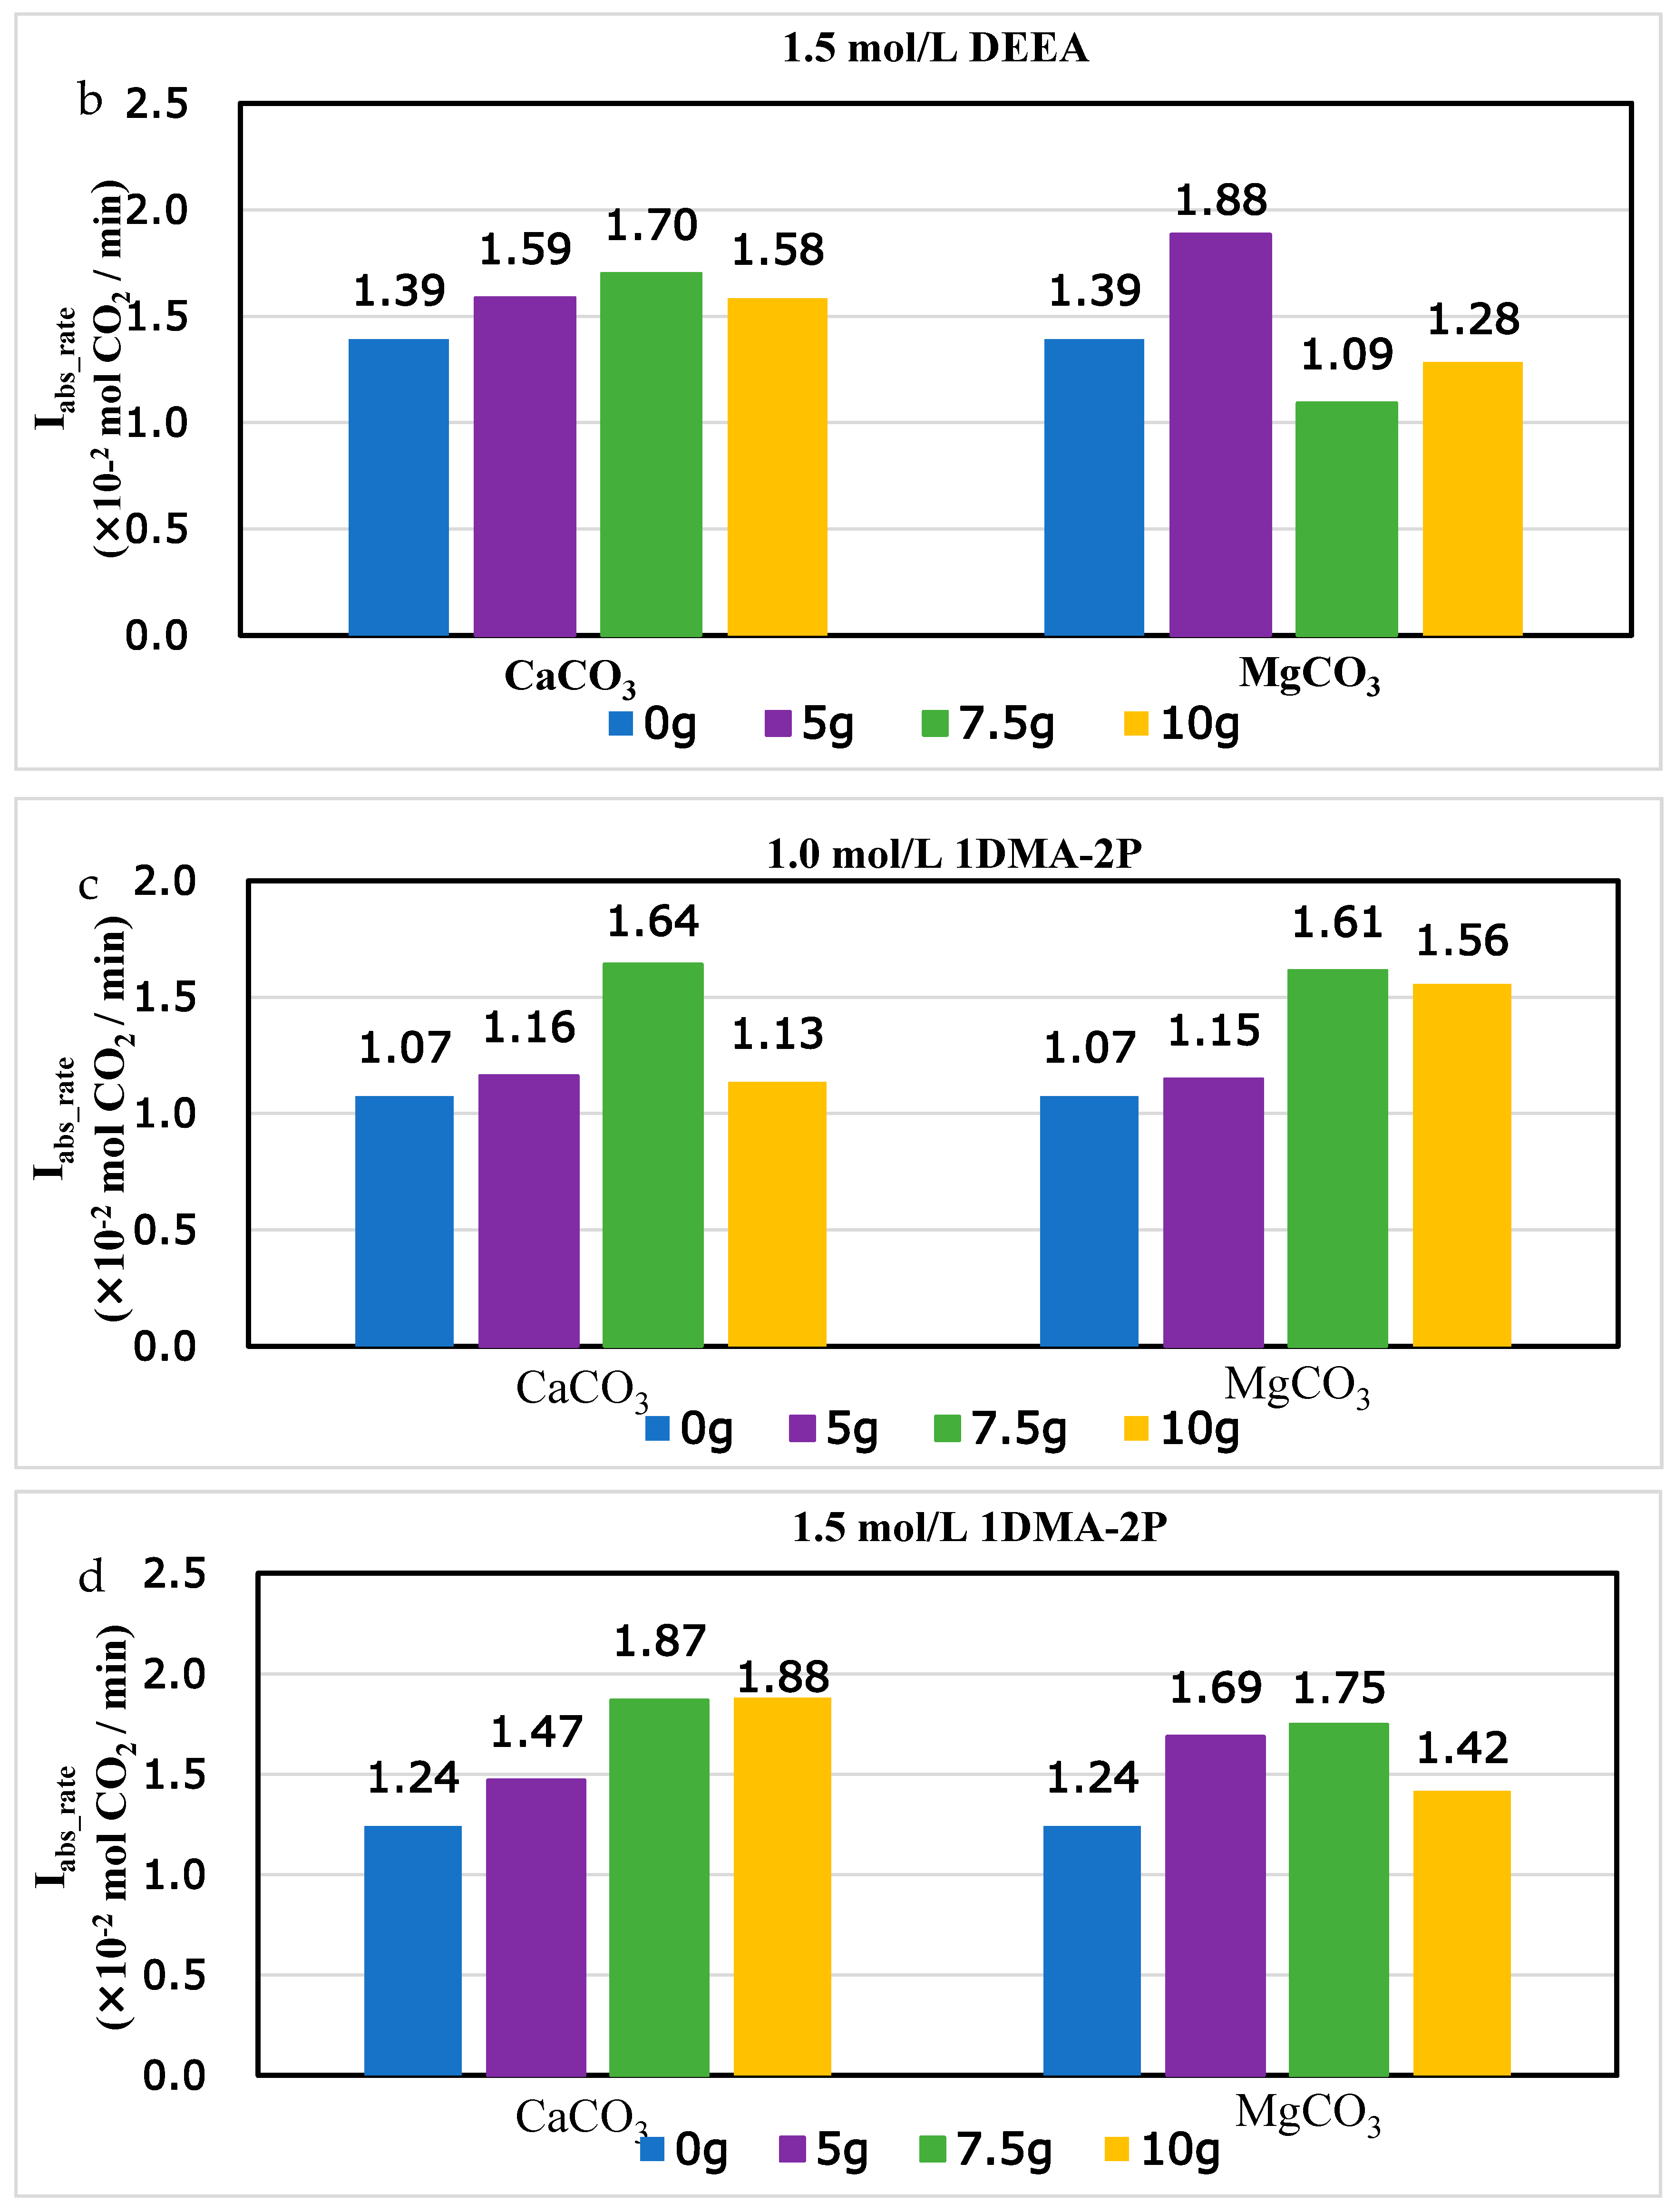
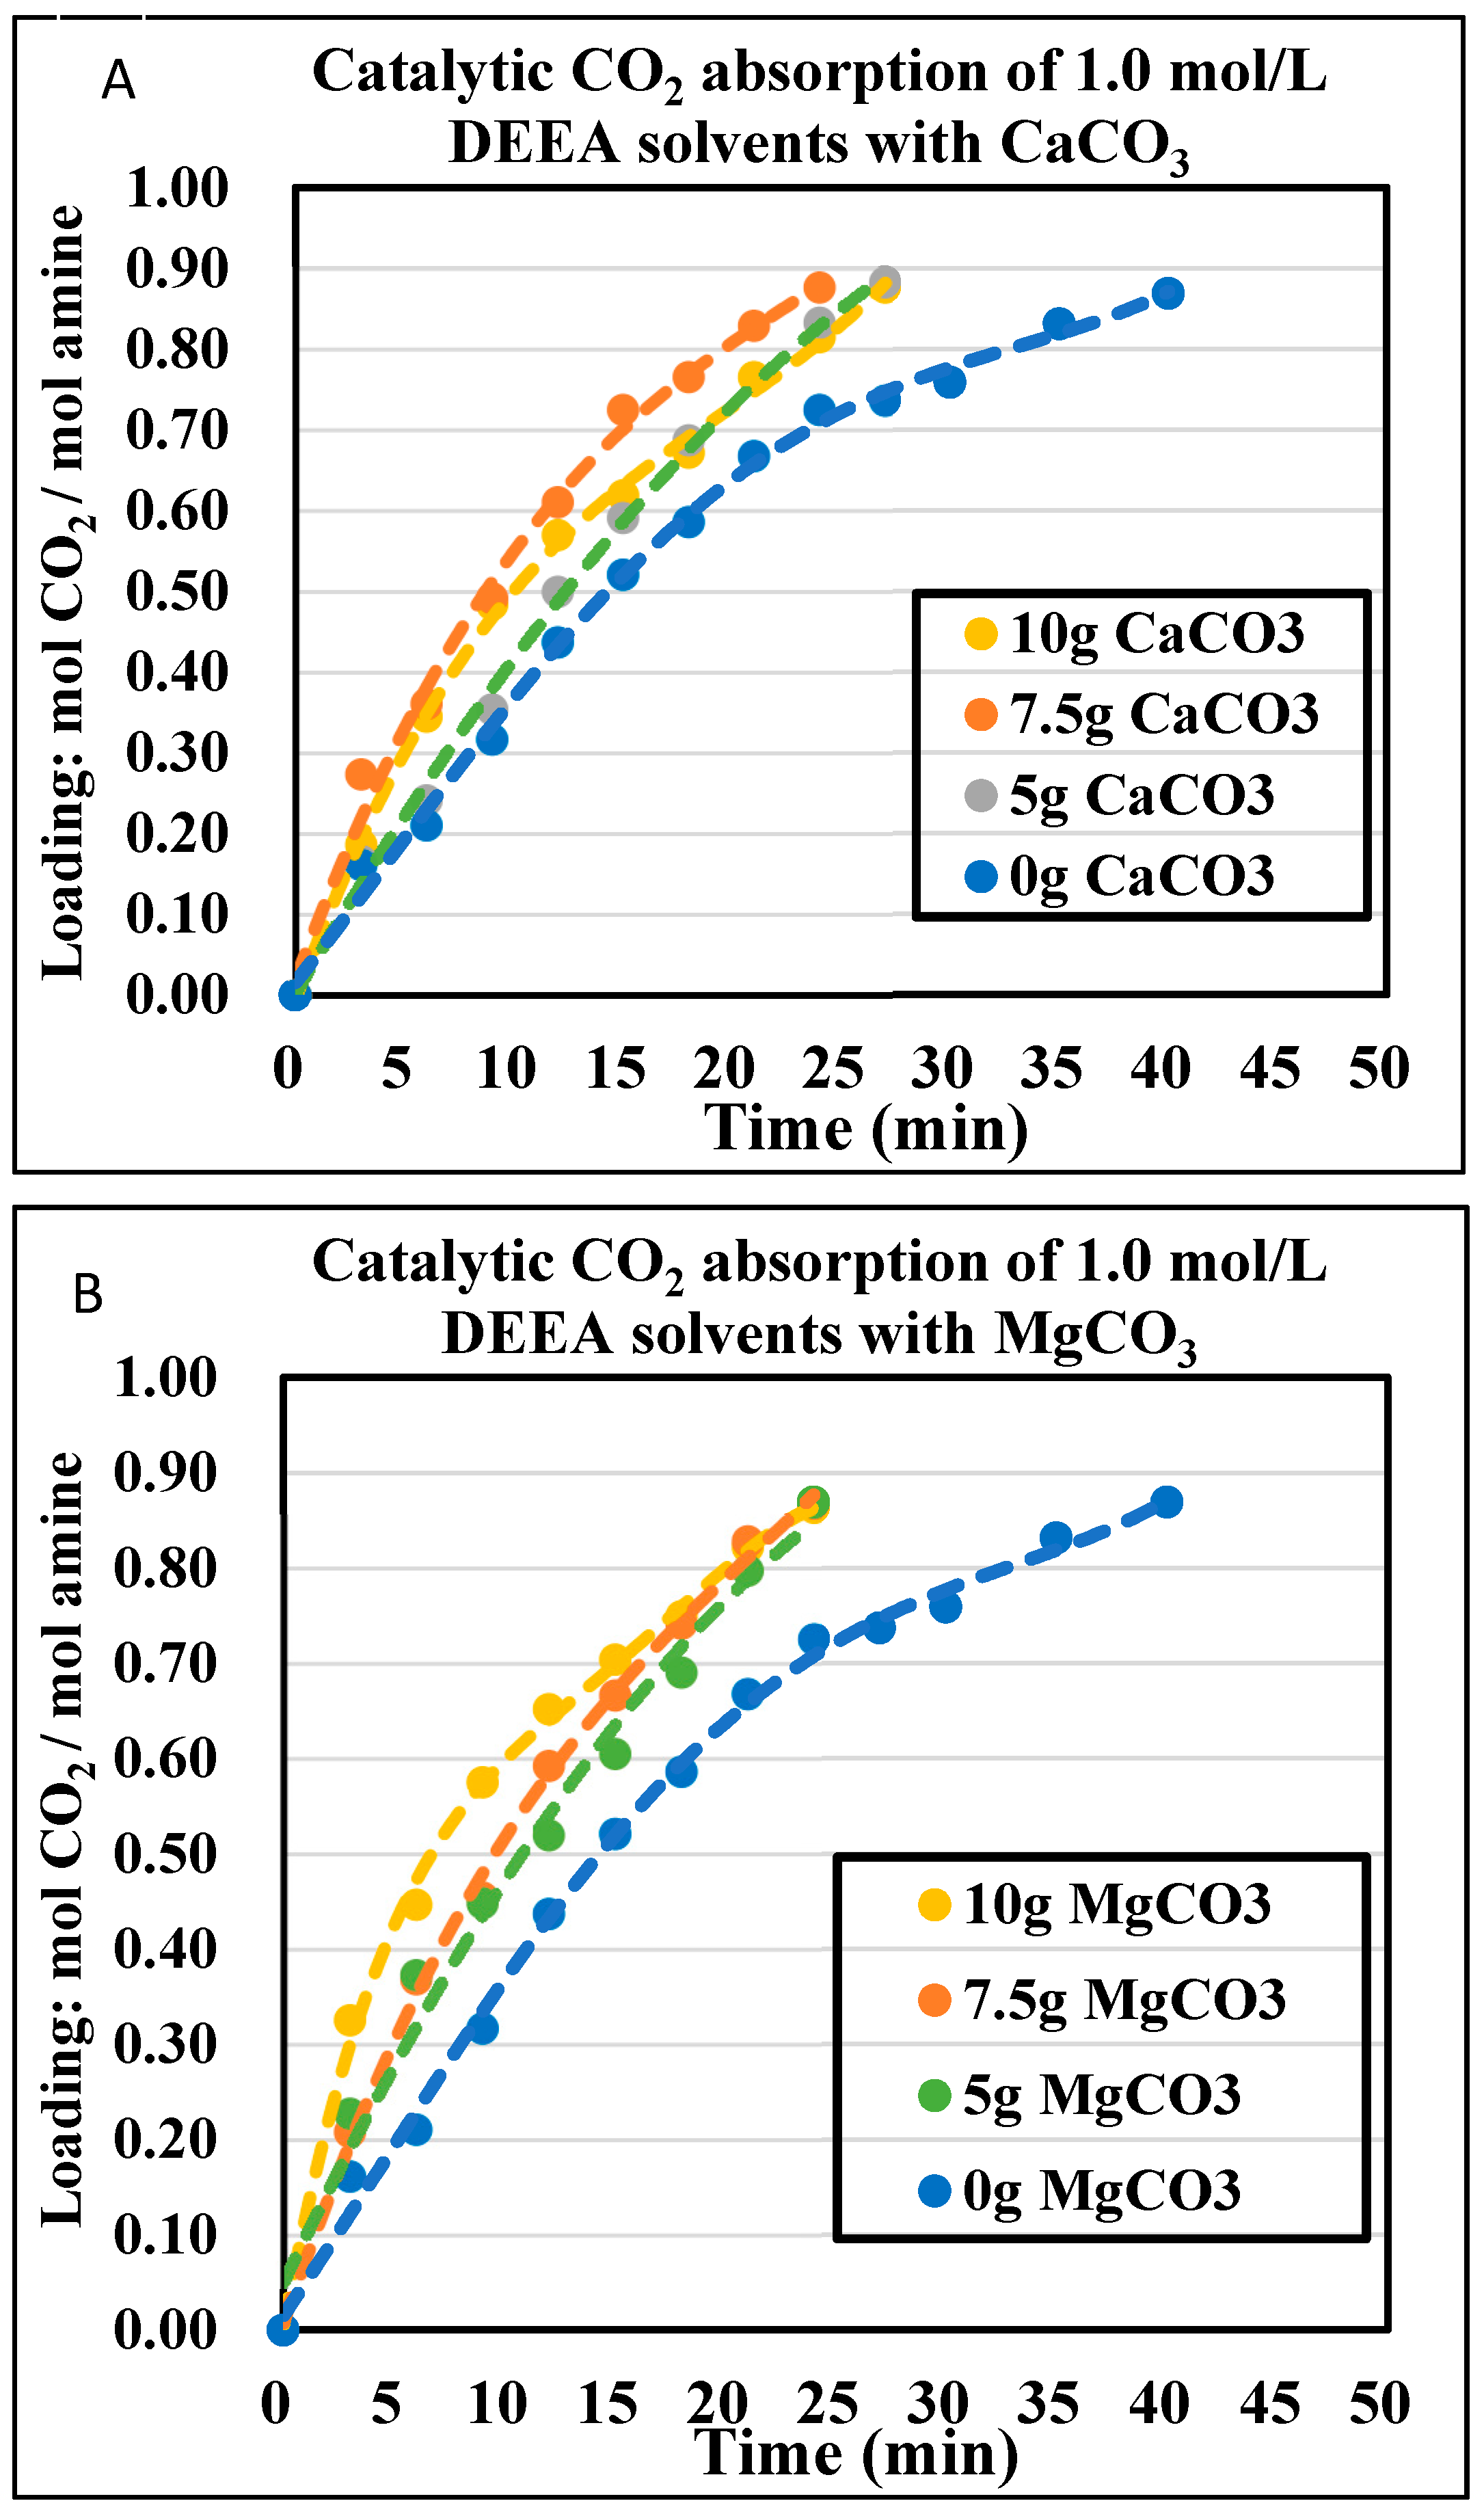
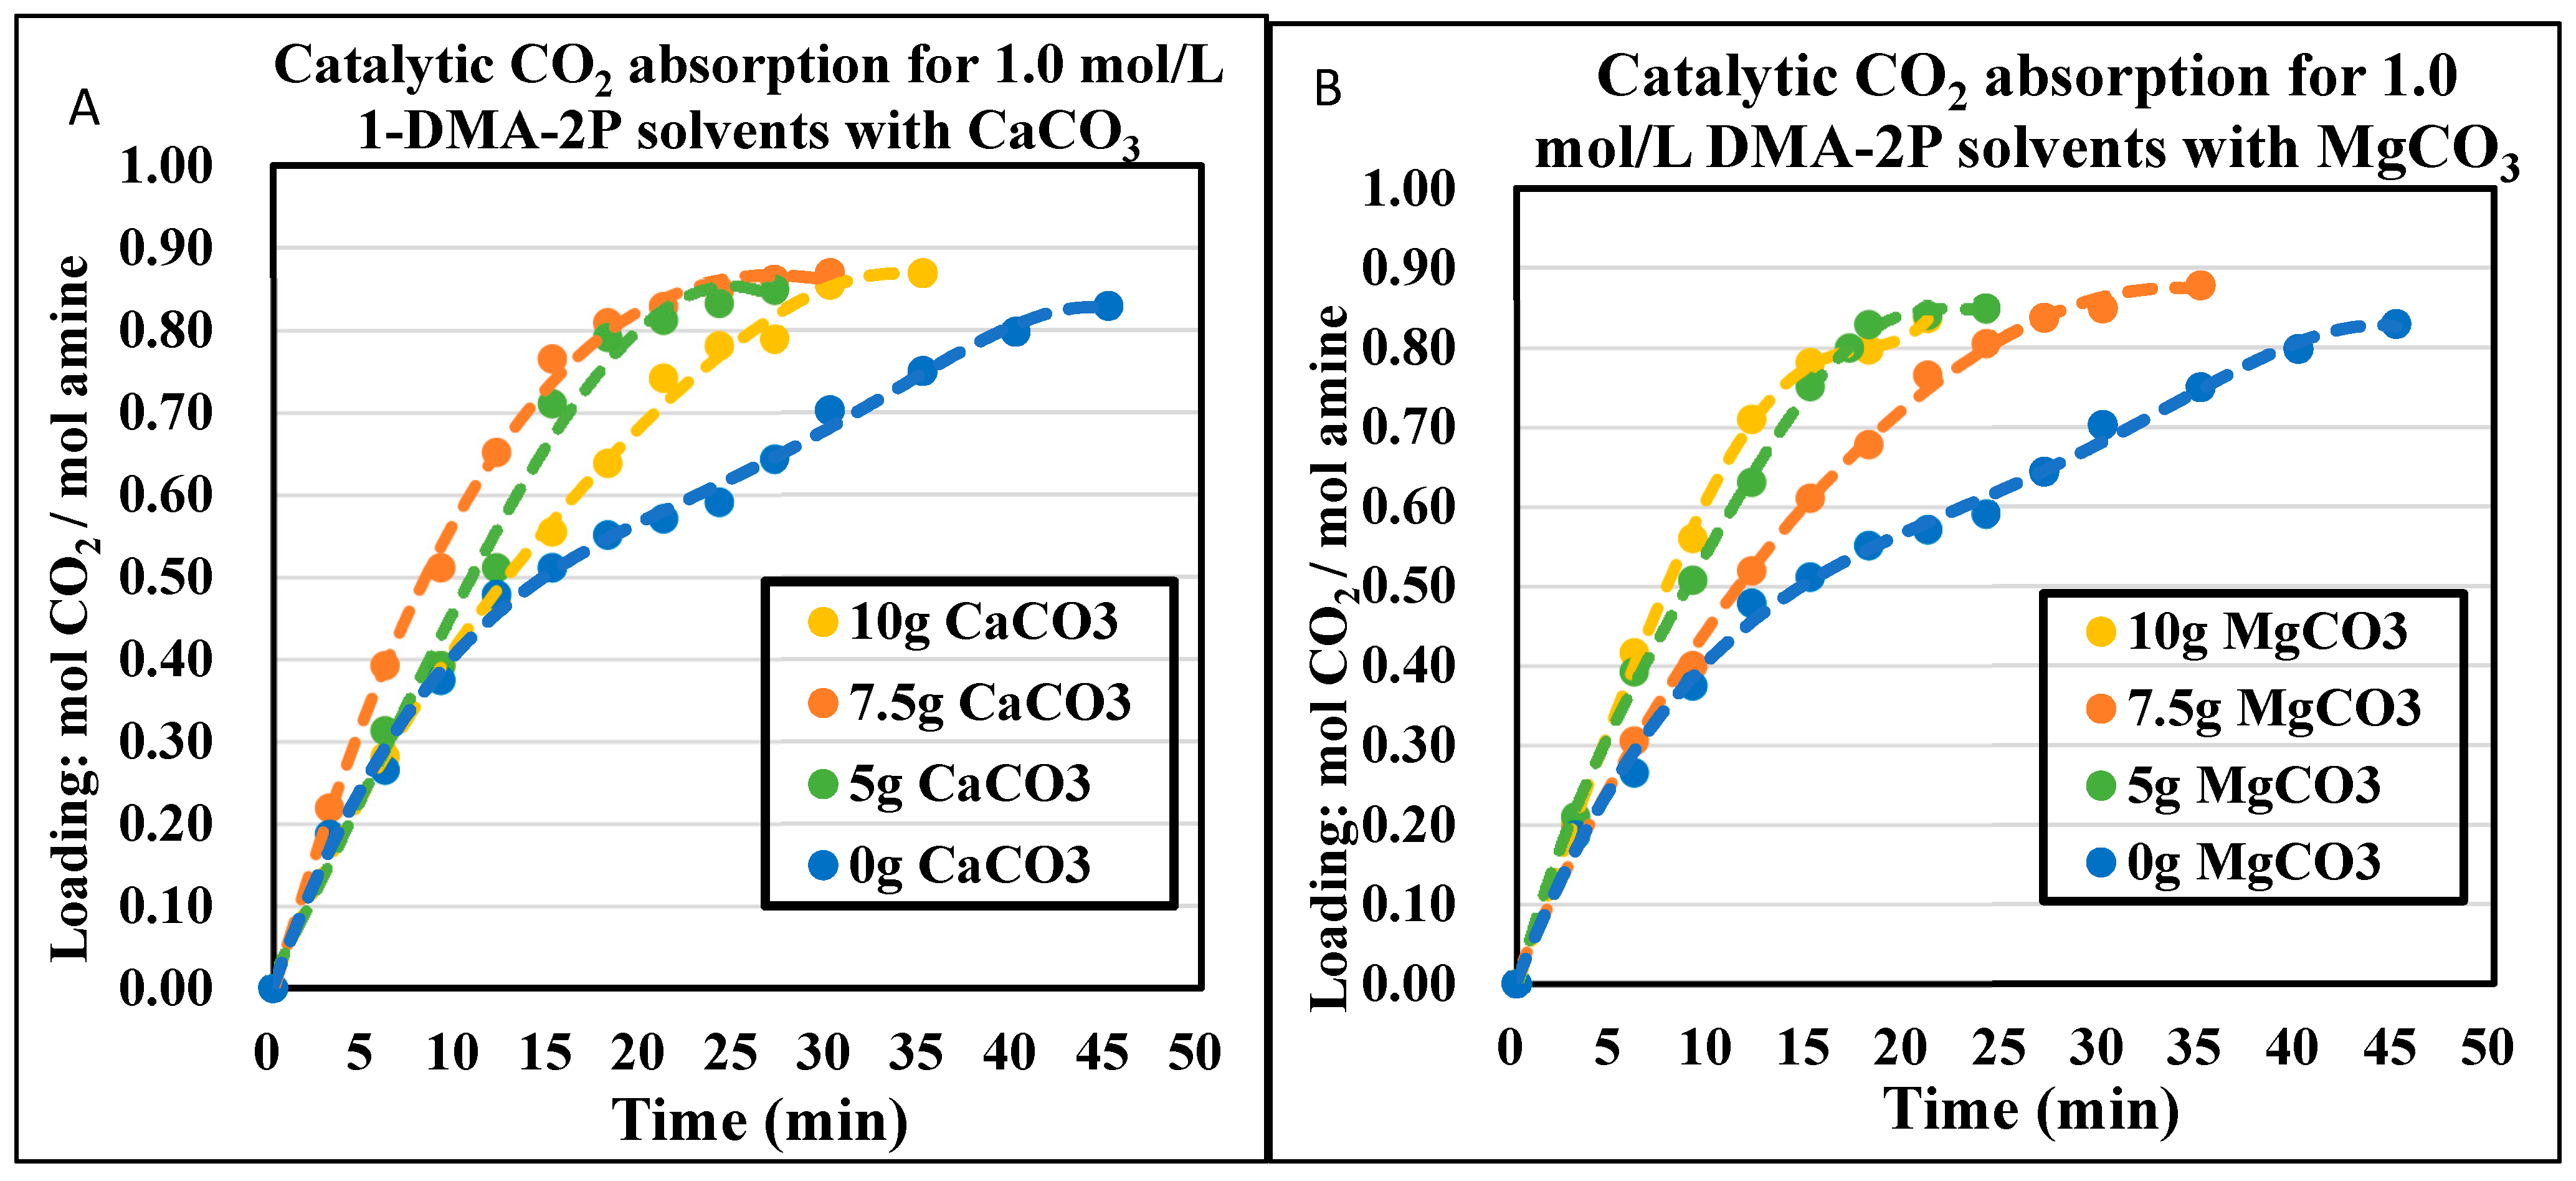
4.3. The CO2 Absorption Profiles with Initial Absorption Rates

The CO2 absorption profiles of 1.0 mol/L and 1.5 mol/L DEEA and 1DMA-2P solvents were plotted in Figure 3, Figure 4, Figure 5 and Figure 6, with the aid of CaCO3 and MgCO3, respectively. The optimized mass of solid alkalis under various amine concentrations was presented in Table 2. The optimized mass was based on the catalytic reactions (13) and (14), with explanation in Section 2.2. With an increased mass of solid catalysts, the initial absorption rates increased first, reached an optimum and then decreased after that.
The non-catalytic curves for DEEA were plotted in Figure 3 and Figure 4. In this time period, amine absorption was recorded from fresh solvent to equilibrium solubility of 0.87 mol/mol, the rest of the data was not displayed because CO2 was reacting with H2O. It took 40 min for 1.0 mol/L and 45 min for 1.5 mol/L. With the aid of solid alkalis CaCO3, the time was reduced to 24 min (21 min less) for 1.0 mol/L and 30 min (15 min less) for 1.5 mol/L at optimized conditions. With the aid of MgCO3, the time was reduced to 24 min (21 min less) for 1.0 mol/L and 45 min for 1.5 mol/L at optimized conditions. The effect of MgCO3 was similar to that of CaCO3 at 1.0 mol/L, but not very helpful at 1.5 mol/L with 5 g. If bigger than 5 g MgCO3, the absorption curves were worse than the non-catalytic curves due to “agglomeration” [40]. Therefore, CaCO3 was a better solid for DEEA than MgCO3.
The non-catalytic curves for 1DMA-2P were plotted in Figure 5 and Figure 6. In this time period, amine absorption was recorded from fresh solvent to equilibrium solubility of 0.81 mol/mol. It took 35 min for 1.0 mol/L, 30 min for 1.5 mol/L. The bigger amine concentration was, the less time it would take, due to faster absorption rates [5] and the smaller cyclic capacity (0.81 mol/mol). With the aid of CaCO3, the time was reduced to 18 min for 1.0 mol/L, 27 min for 1.5 mol/L at optimized conditions. With the aid of MgCO3, the time was reduced to 17 min for 1.0 mol/L, 27 min for 1.5 mol/L at optimized conditions. The effect of CaCO3 was comparable to that of MgCO3. It was quite effective at 1.0 mol/L when the time was reduced by 18 min, and the time was reduced by only 3 min at 1.5 mol/L.
The optimized amount of solid base chemicals is presented in Table 2. The orders were different under different amine concentrations. For DEEA, it was 7.5 g > 10 g > 5 g > 0 g for 1.0 mol/L and 7.5 g ≈ 5 g > 0 g > 10 g for 1.5 mol/L for CaCO3. The catalytic absorptions were better than the non-catalytic absorptions. For MgCO3, it was 10 g > 5 g > 7.5 g > 0 g for 1.0 mol/L, but 5 g > 0 g > 10 g > 7.5 g for 1.5 mol/L. We repeated the experiments of Figure 4A,B and Figure 6B at least twice. This poorer effect of CaCO3 and MgCO3 at large amount to 1.5 mol/L DEEA was probably due to the “agglomeration” [40] of solid chemicals, where the liquid covered the solid surface area and inhibited the catalysis. Such phenomena were also reported by other researchers with 0 g > 50 g CaCO3 to 4.0 mol/L BEA + AMP amine blend [40]. For 1DMA-2P, it was 7.5 g > 5 g > 10 g > 0 g for 1.0 mol/L and 10 g > 7.5 g ≈ 5 g > 0 g for 1.5 mol/L for CaCO3. For MgCO3, it was 10 g > 5 g > 7.5 g > 0 g for 1.0 mol/L and 5 g > 7.5 g ≈ 10 g ≈ 0 g for 1.5 mol/L. The larger amount of MgCO3 at 1.5 mol/L also resulted in agglomeration and made the catalysis comparable to non-catalytic absorption [40]. The removal of agglomeration awaits further investigation.
Under both amine concentrations without agglomeration, the catalytic absorptions were better than the non-catalytic absorptions. For 1.0 mol/L, the absorption rates increased significantly with different amounts of solid chemicals. For 1.5 mol/L, the catalytic absorptions were better than non-catalytic cases at moderate ability. This difference was explained by Equations (13) and (14). At a dilute concentration of 1.0 mol/L the solid catalyst was helpful, for there are limited free R3N amines around H2CO3. However, at a higher concentration of 1.5 mol/L, there are more free R3N molecules in solution with higher pH value in solution, the reaction rate was increased with [R3N] and the solid chemical had only moderate improvements r CO 2 = k R 3 N [ R 3 N ] [ CO 2 ] .

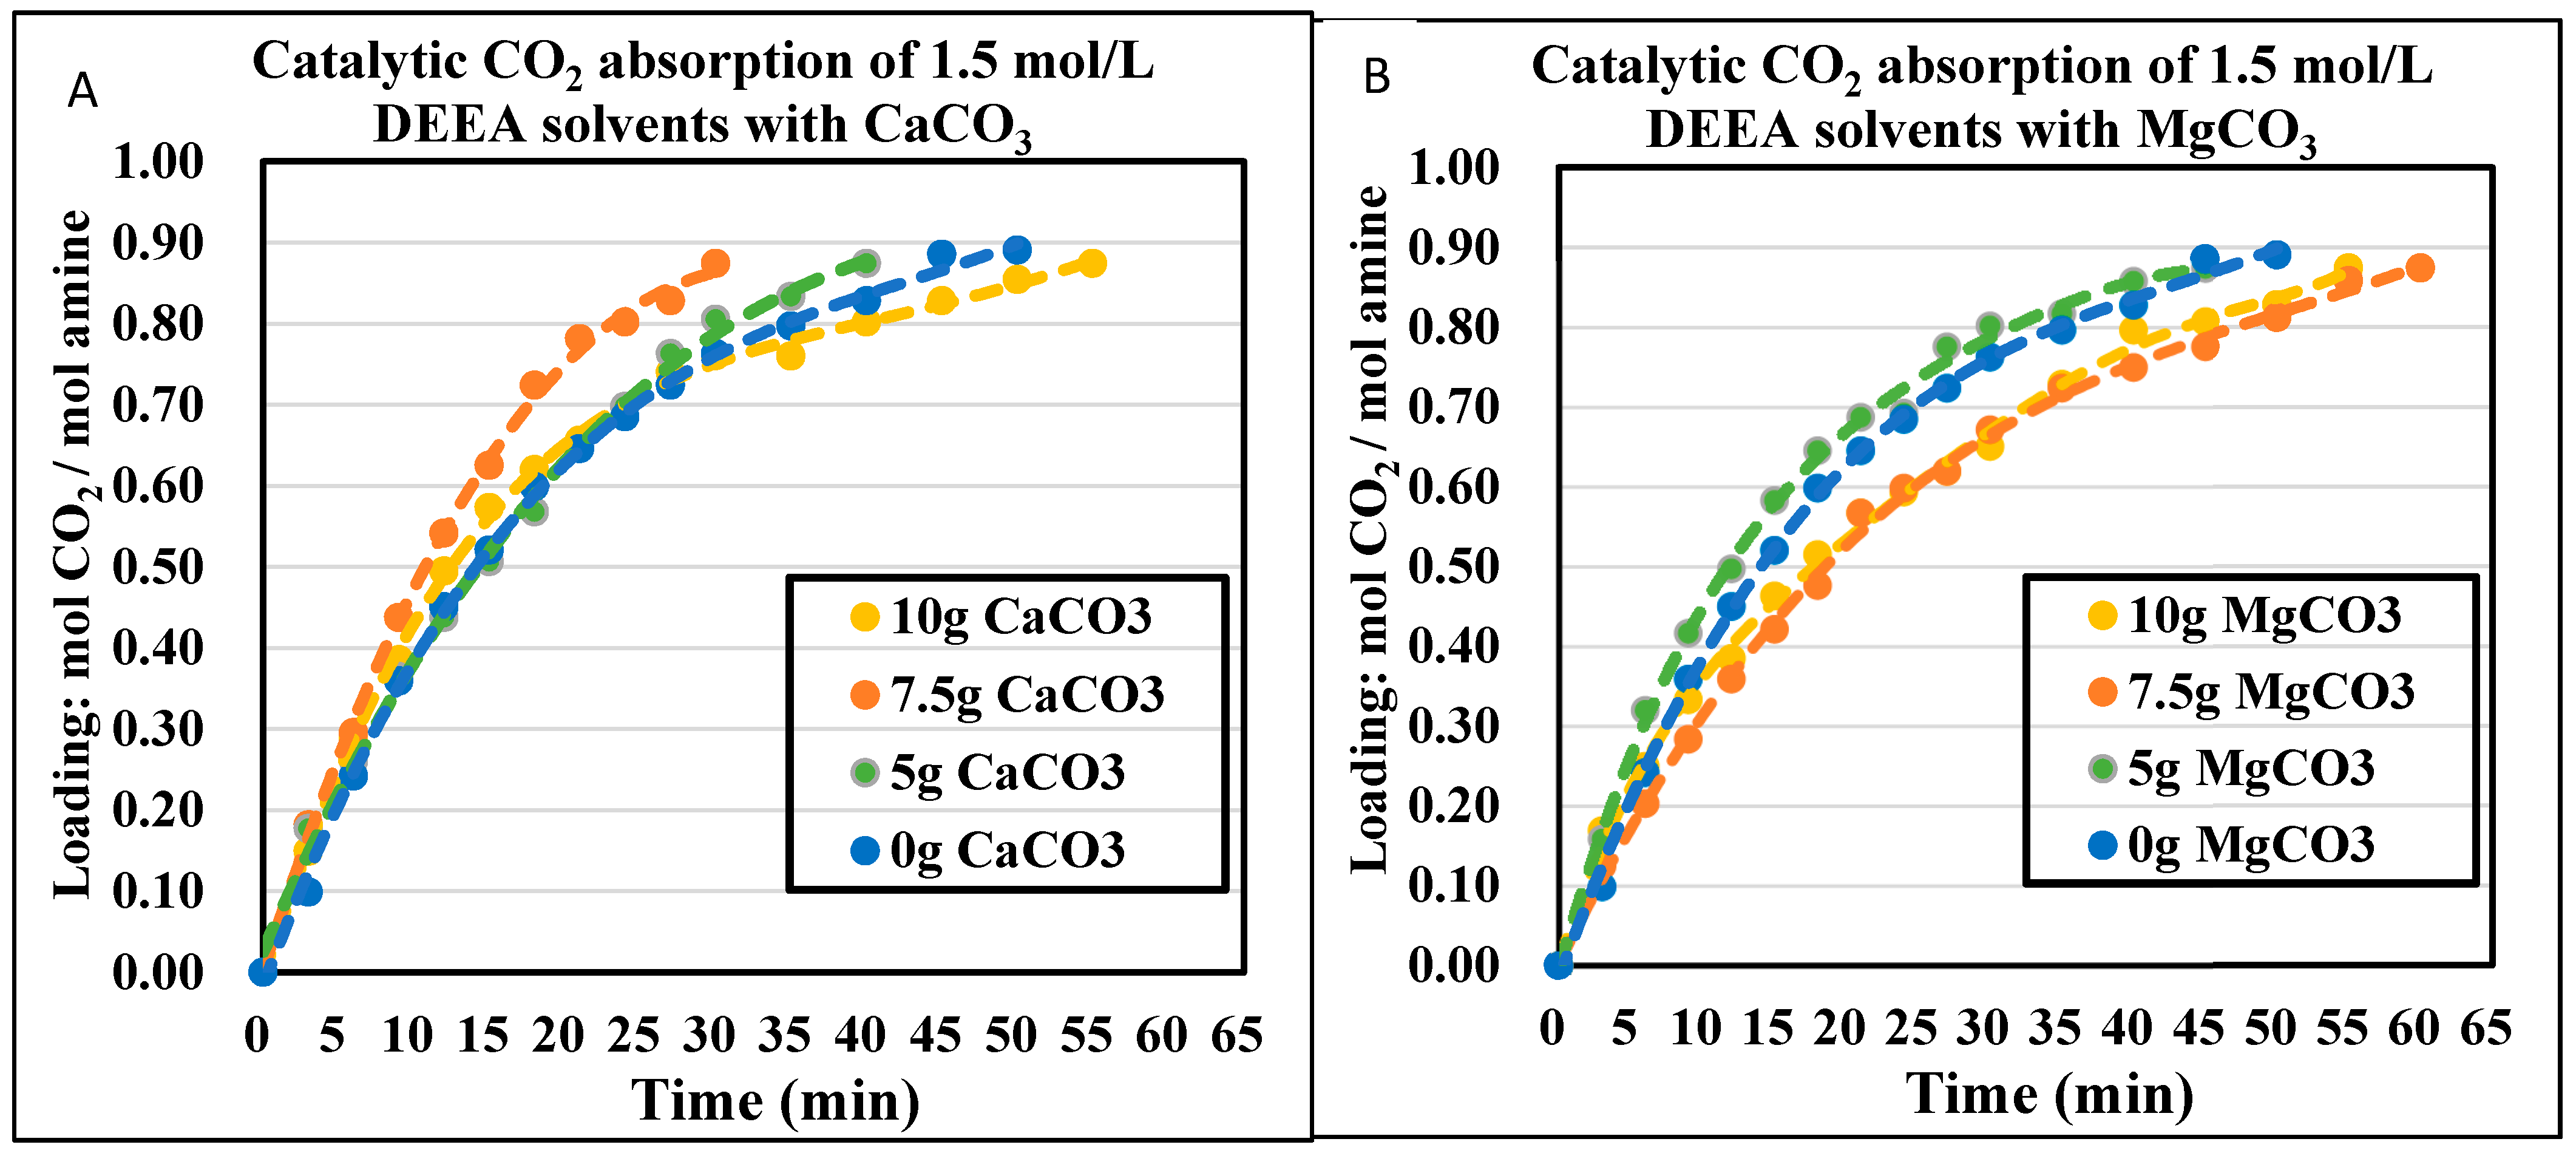
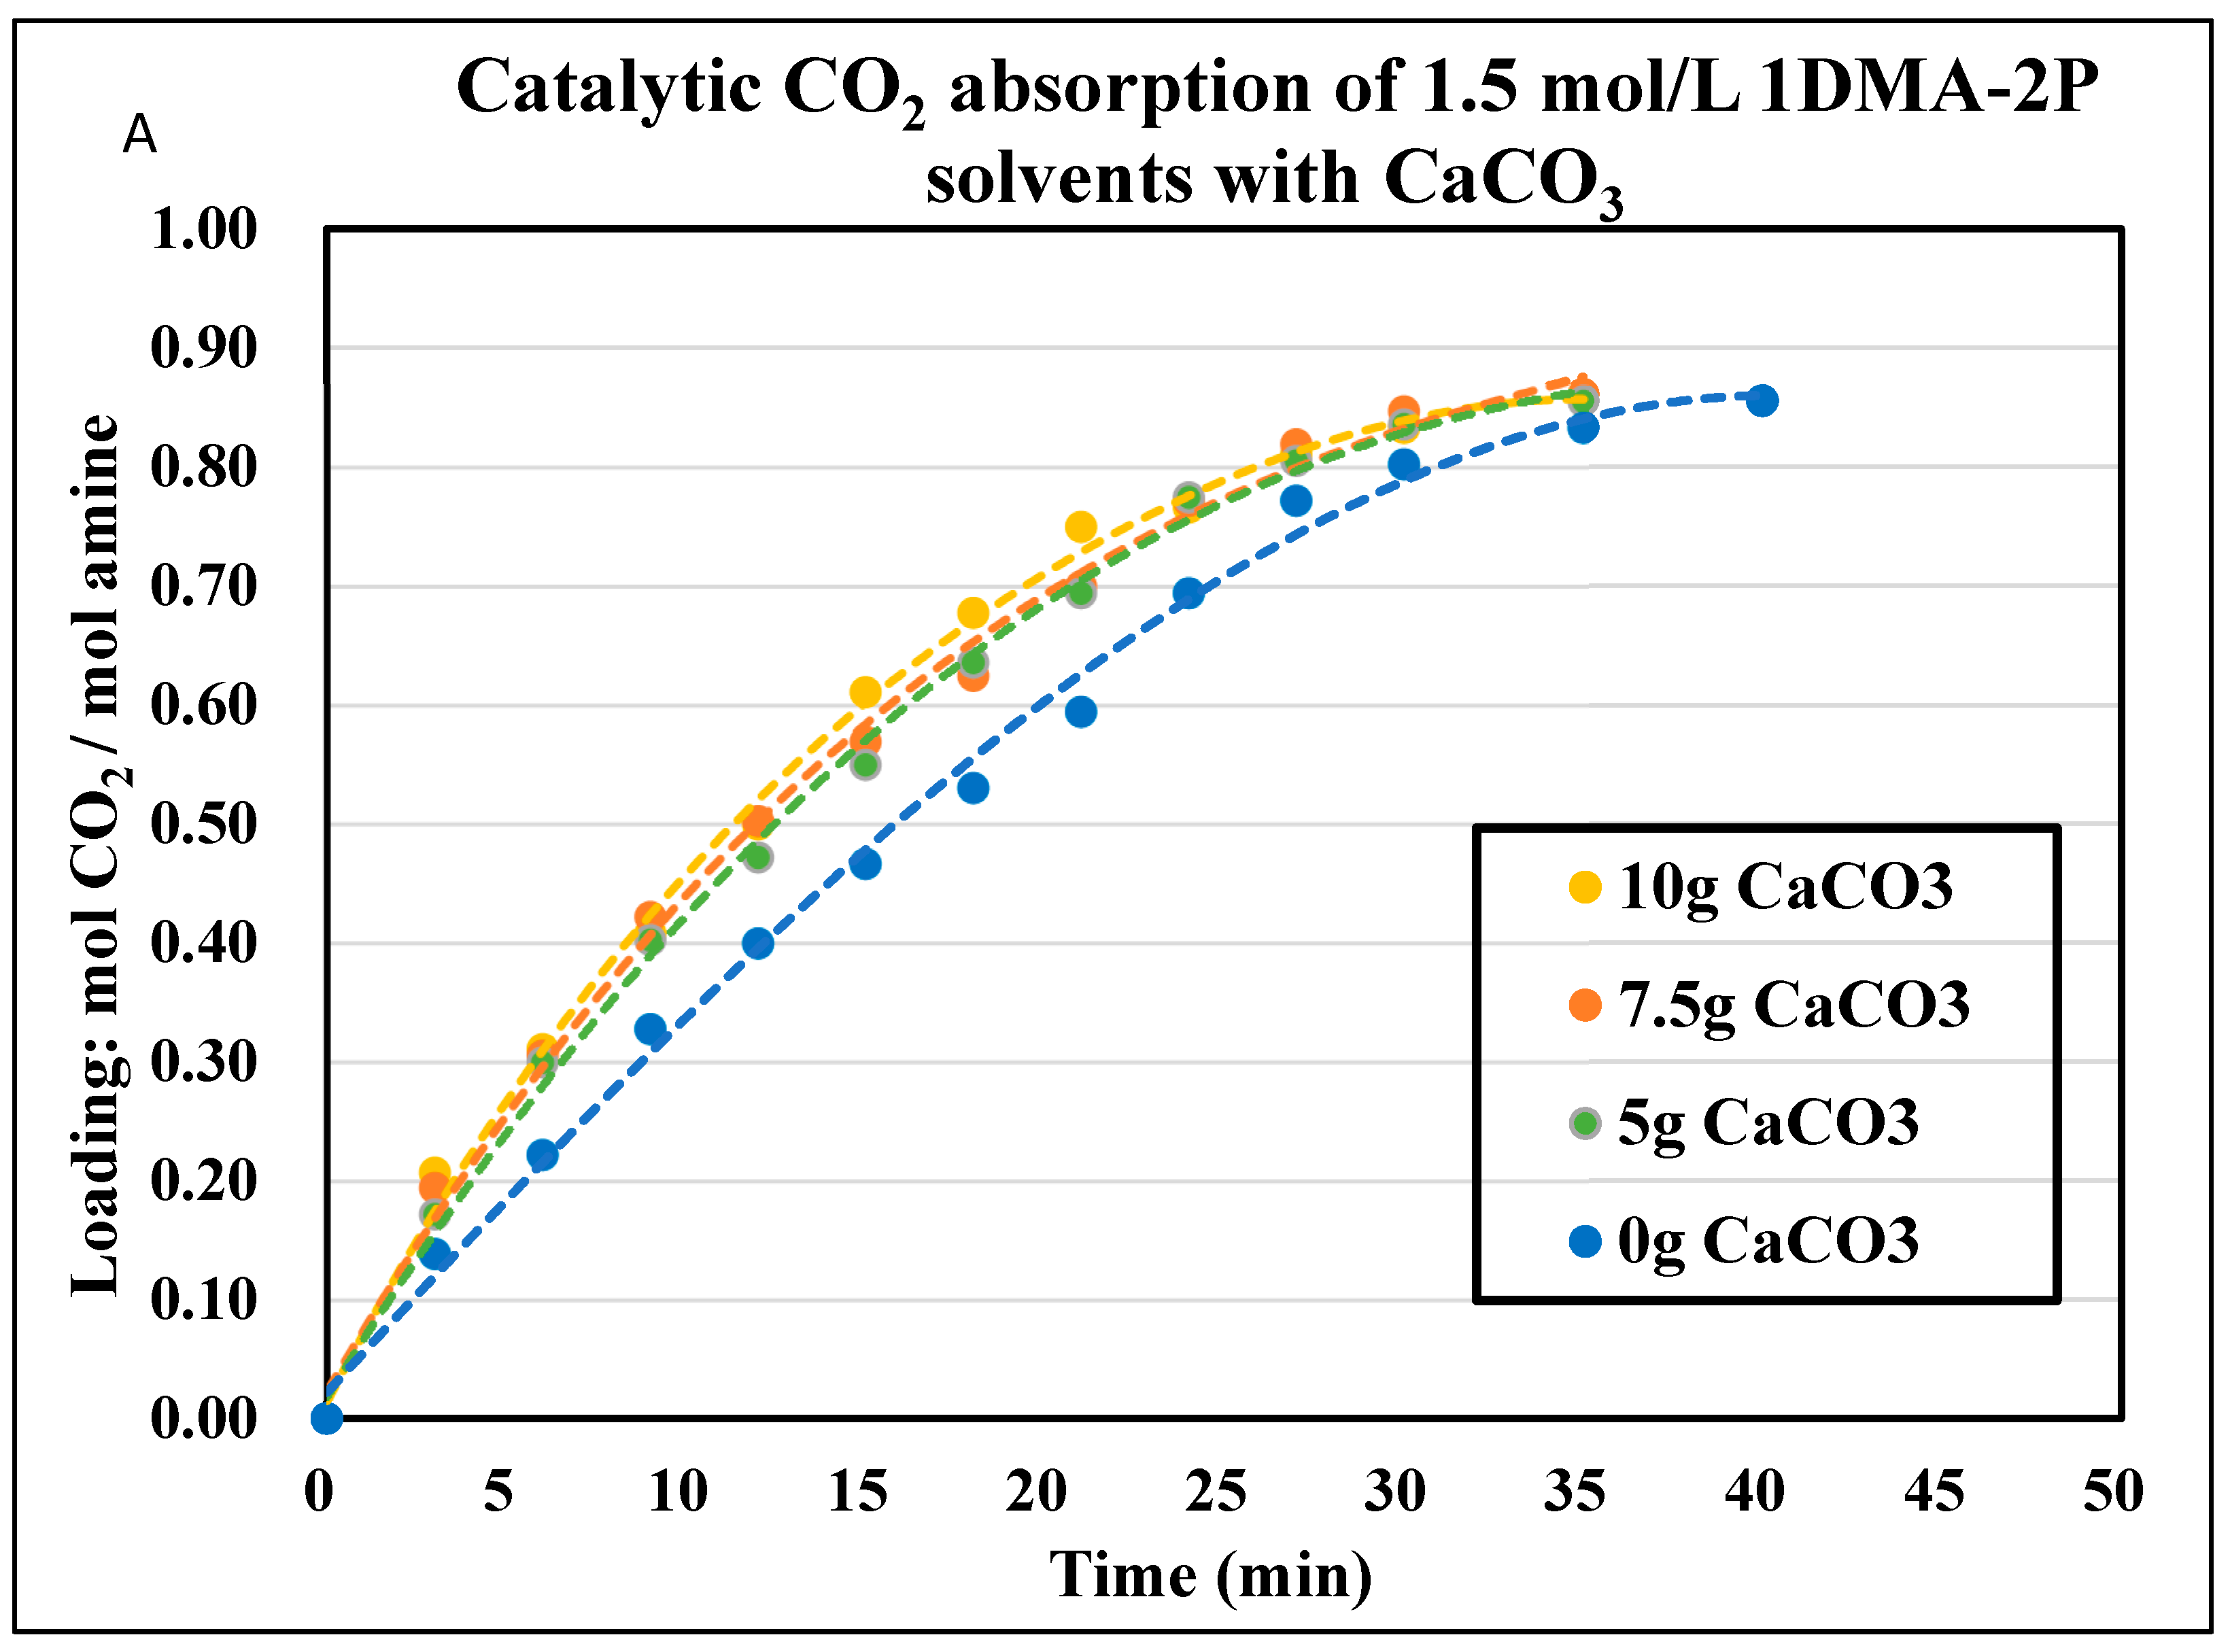
4.4. The Effect of Solid Base to CO2 Absorption to Tertiary Amine DEEA and 1DMA-2P with Comparison to MEA and DEA

In addition to the periods of absorption profiles, the effect of CaCO3 and MgCO3 could also be evaluated by the initial absorption rates, which was an important parameter [33]. The initial absorption rates were shown in Figure 7 for non-catalytic absorption and optimized catalytic absorption. The effect of solid alkalis was not the more the better, and there was an optimized mass. According to Section 2.2 with Equation (13), the increased mass of solid alkalis helped the proton transfer from H2CO3 to solid surface at start. However, after the optimized mass from Equation (14), the excess amount of solid base inhibited the proton transfer from catalyst to R3N, and reduced the overall absorption rates.
At optimized conditions, both rates increased significantly. For DEEA, the initial absorption rate was 0.74 × 10⁻² mol CO2/min for 1.0 mol/L without catalysts, and it increased to 238% and 247% with the aid of CaCO3 and MgCO3. The initial absorption rate increased to 1.39 × 10⁻² mol CO2/min for 1.5 mol/L, but increased to only 122% and 135% with CaCO3 and MgCO3. For 1DMA-2P, the initial absorption rate was 1.07 × 10⁻² mol CO2/min for 1.0 mol/L without catalysts, and it increased to 153% and 150% with CaCO3 and MgCO3. The initial absorption rate increased to 1.24 × 10⁻² mol CO2/min for 1.5 mol/L and increased to 165% and 149% with CaCO3 and MgCO3.
Compared with other studies of MEA and DEA, the absolute value of initial absorption rates of R3N was smaller than MEA and DEA, because of the lower absorption rates and smaller second order rate constant k2 [27]. With the aid of solid bases, the initial rates properly increased. The effect of solid chemicals was stronger at 1.0 mol/L and turned moderate at 1.5 mol/L for DEEA. For 1DMA-2P, the increase of initial absorption rates was similar at the range of 150–165% for 1.0 mol/L and 1.5 mol/L. The overall absorption periods were reduced by about 46–48% at 1.0 mol/L for DEEA and 1DMA-2P, but were reduced by only about 33% and 10% for 1.5 mol/L DEEA and 1DMA-2P.
Such a difference was due to the different reaction mechanisms of different reactions. For CO2 reaction with tertiary amine, it was the based catalyzed hydration mechanism. The R3N do not react with CO2 directly, but accept protons from [H2CO3]. The stronger basicity of the solvents led to stronger proton affinity, and caused better CO2 absorption. On the basis of kinetic studies, the second order rate constant (k2) was related to pKa of the tertiary amine. [5] The increased amine concentration led to a bigger pH value of the solution and higher absorption rates. The solid base chemicals could not directly affect the [OH] or pH value in solvent, and provided only moderate enhancement of CO2 absorption rates at higher concentrations. In short, the solid alkalis were effective for tertiary amines, but the effects were not as good as for primary and secondary amines. They were more effective at a dilute concentration.
However, for MEA and DEA, the CO2 reaction is driven by Zwitterion mechanism with the carbamate formation as products [28]. Solid alkalis might enhance the mass transfer or reduce the activation energy (Ea) of the reaction process and facilitate N-C bond formation of CO2-amine. The solid surface area contains abundant active sites which facilitate CO2 absorption in another reaction pathway [19,20].

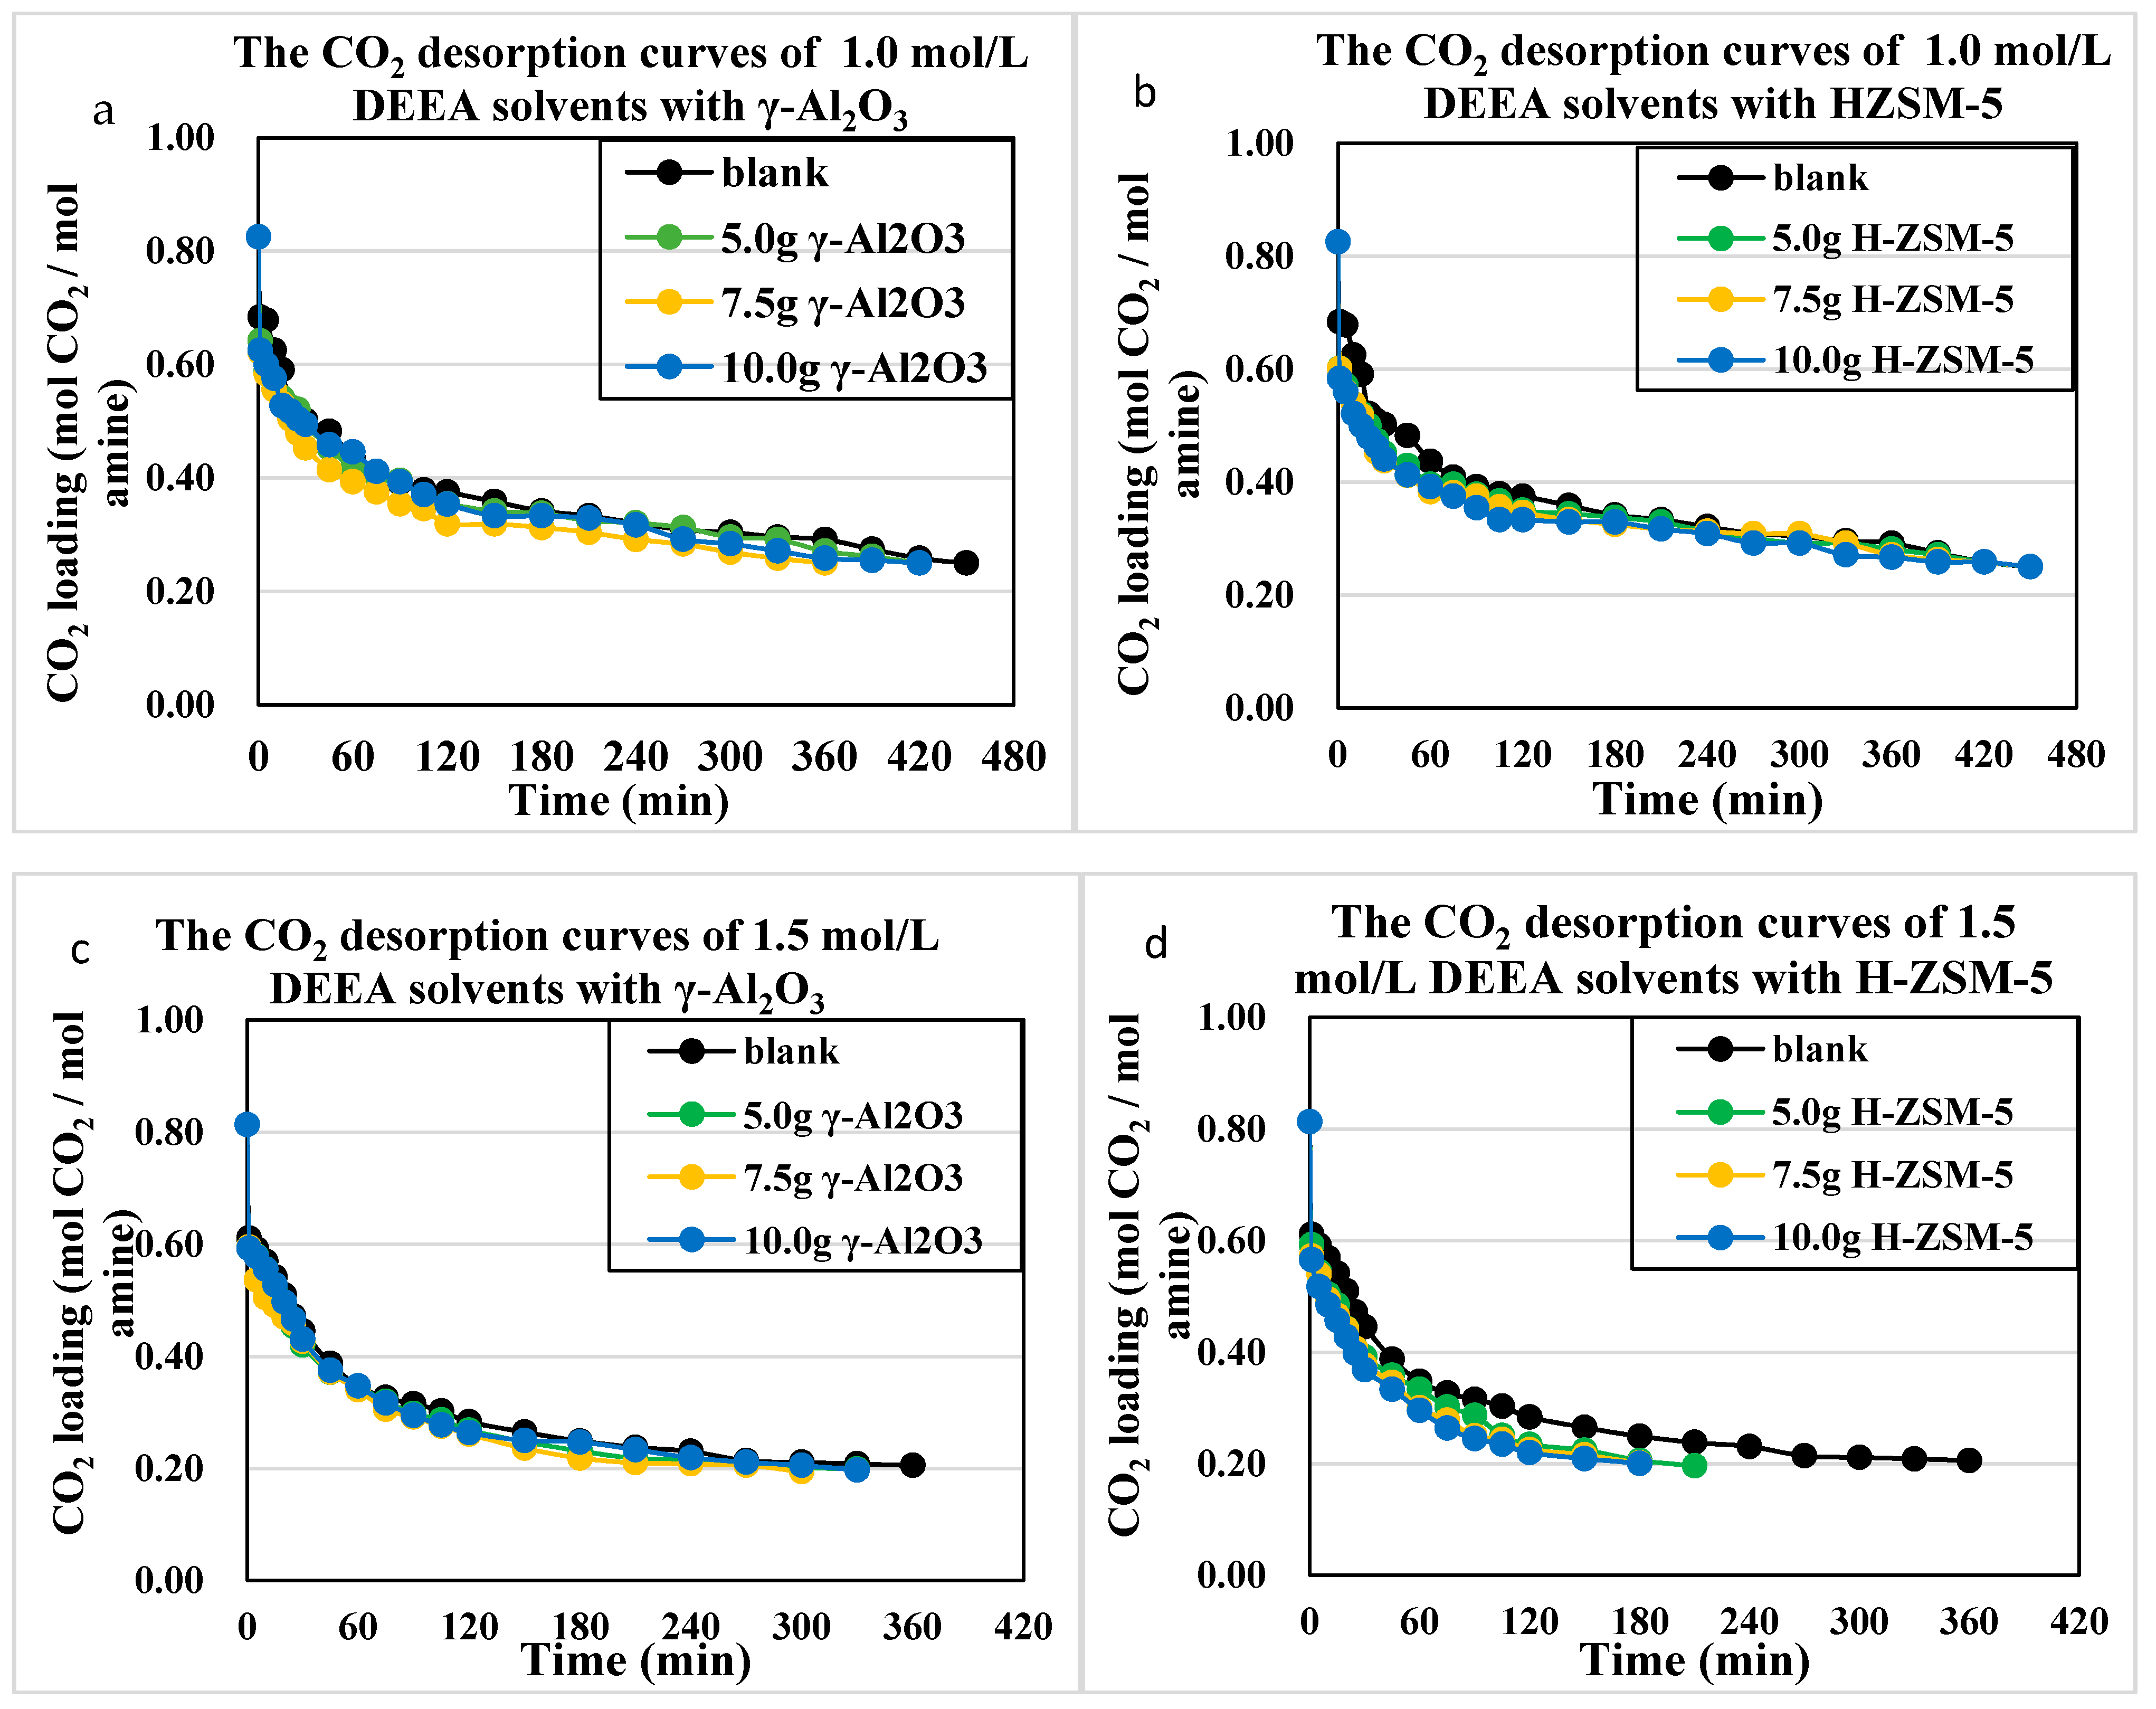
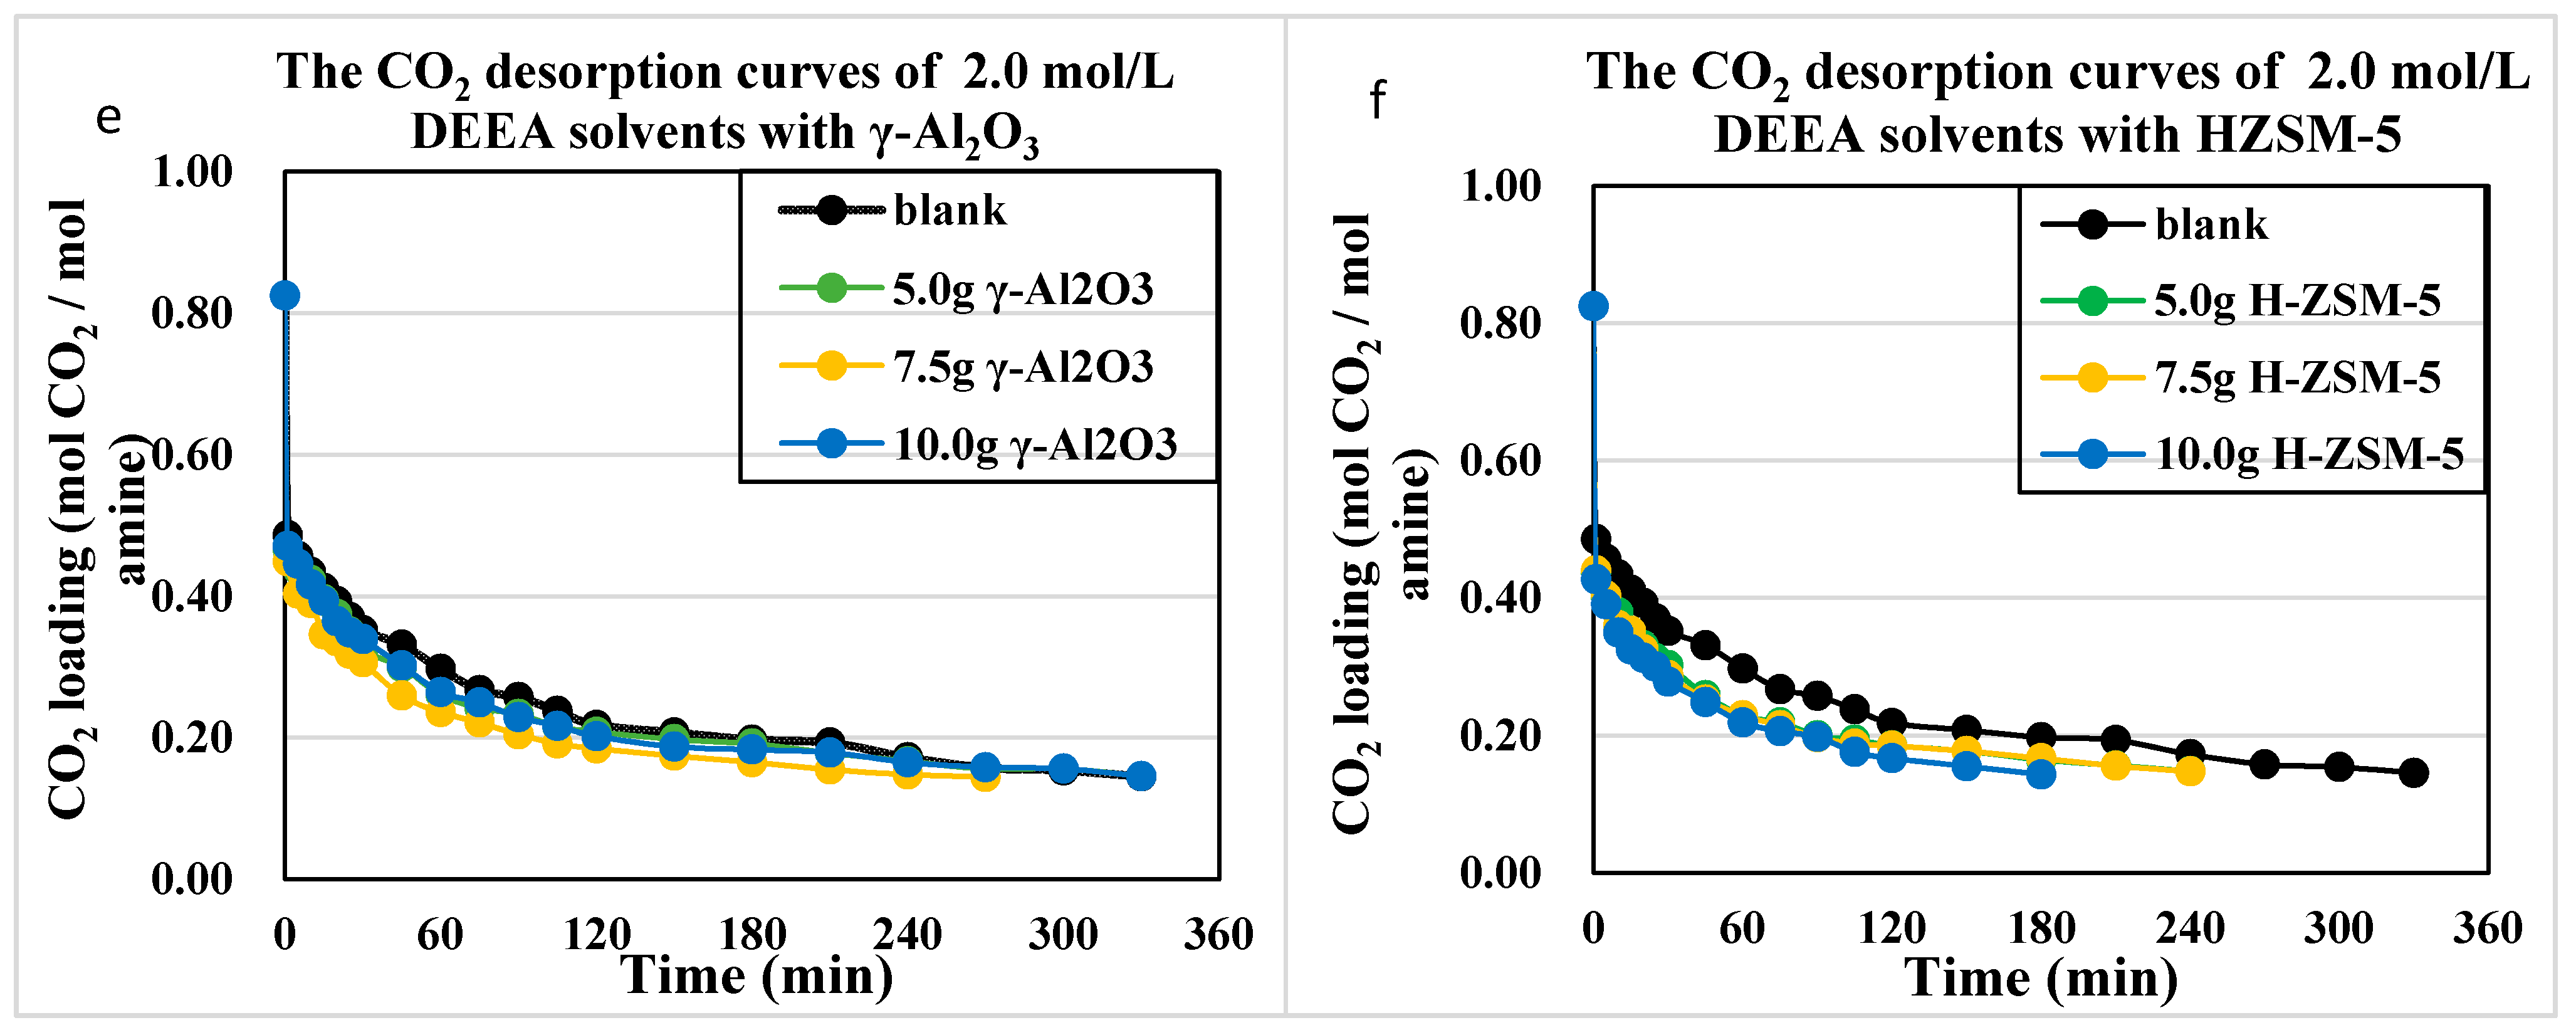
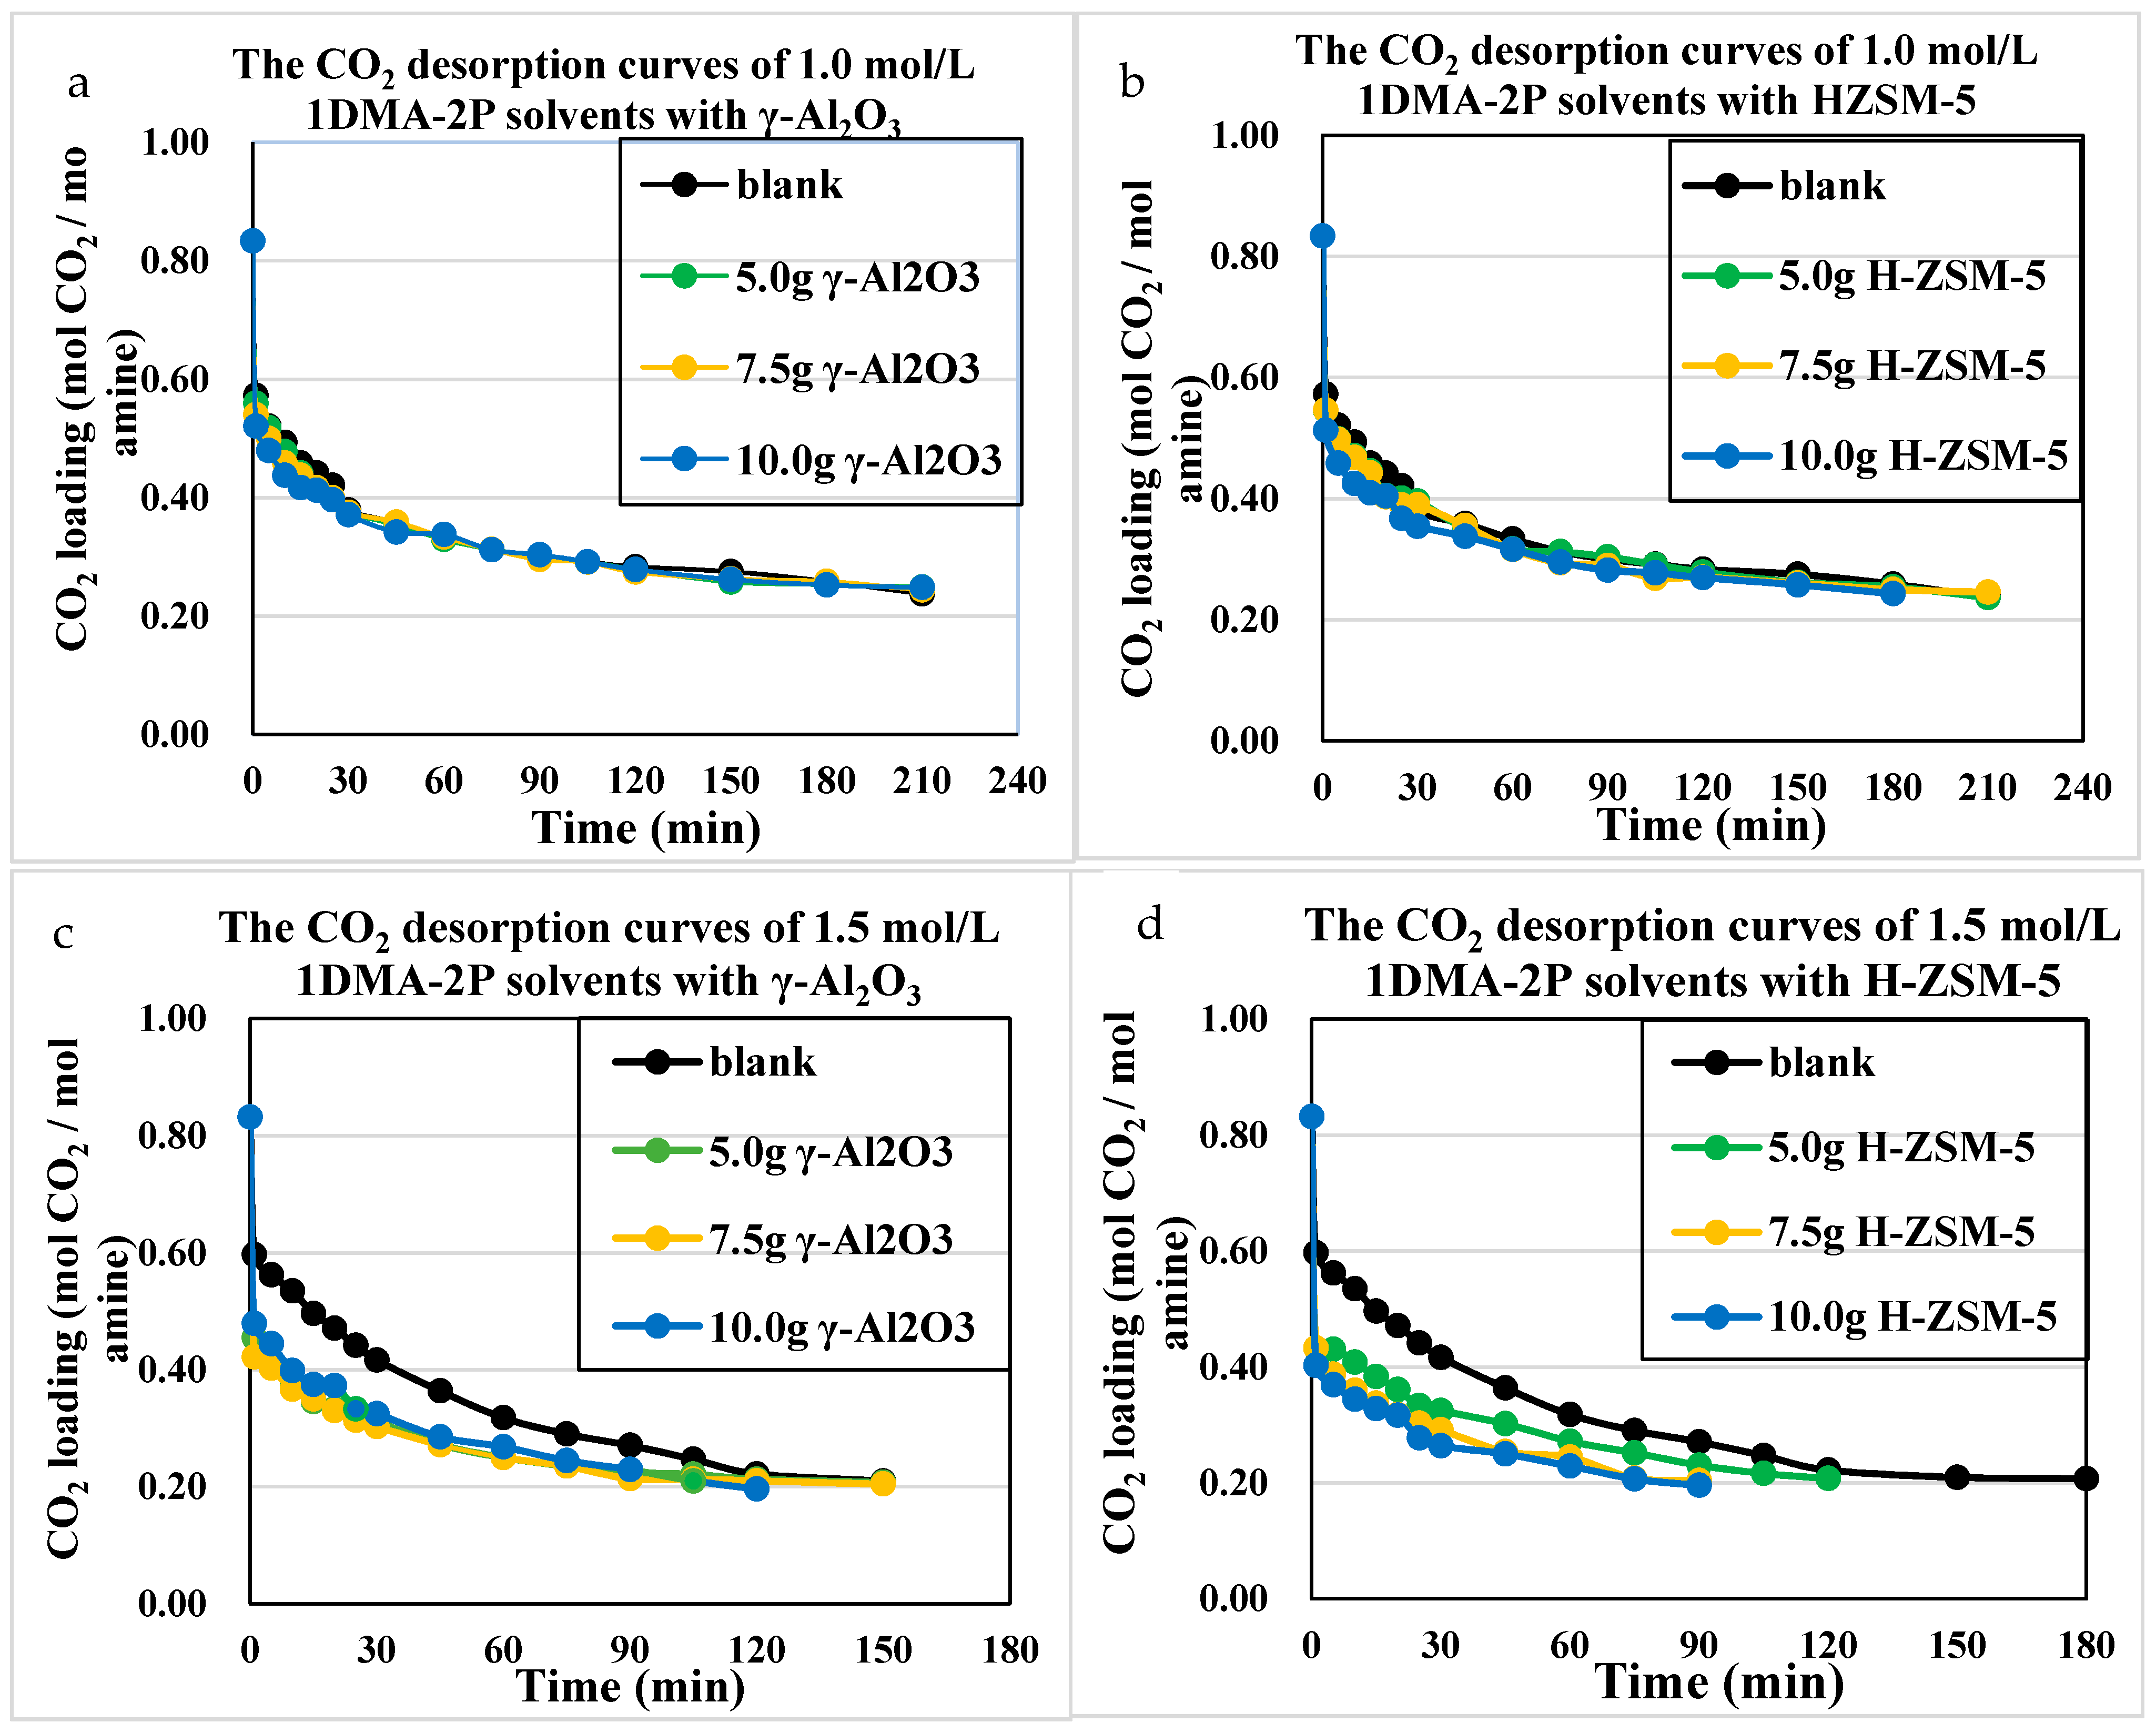
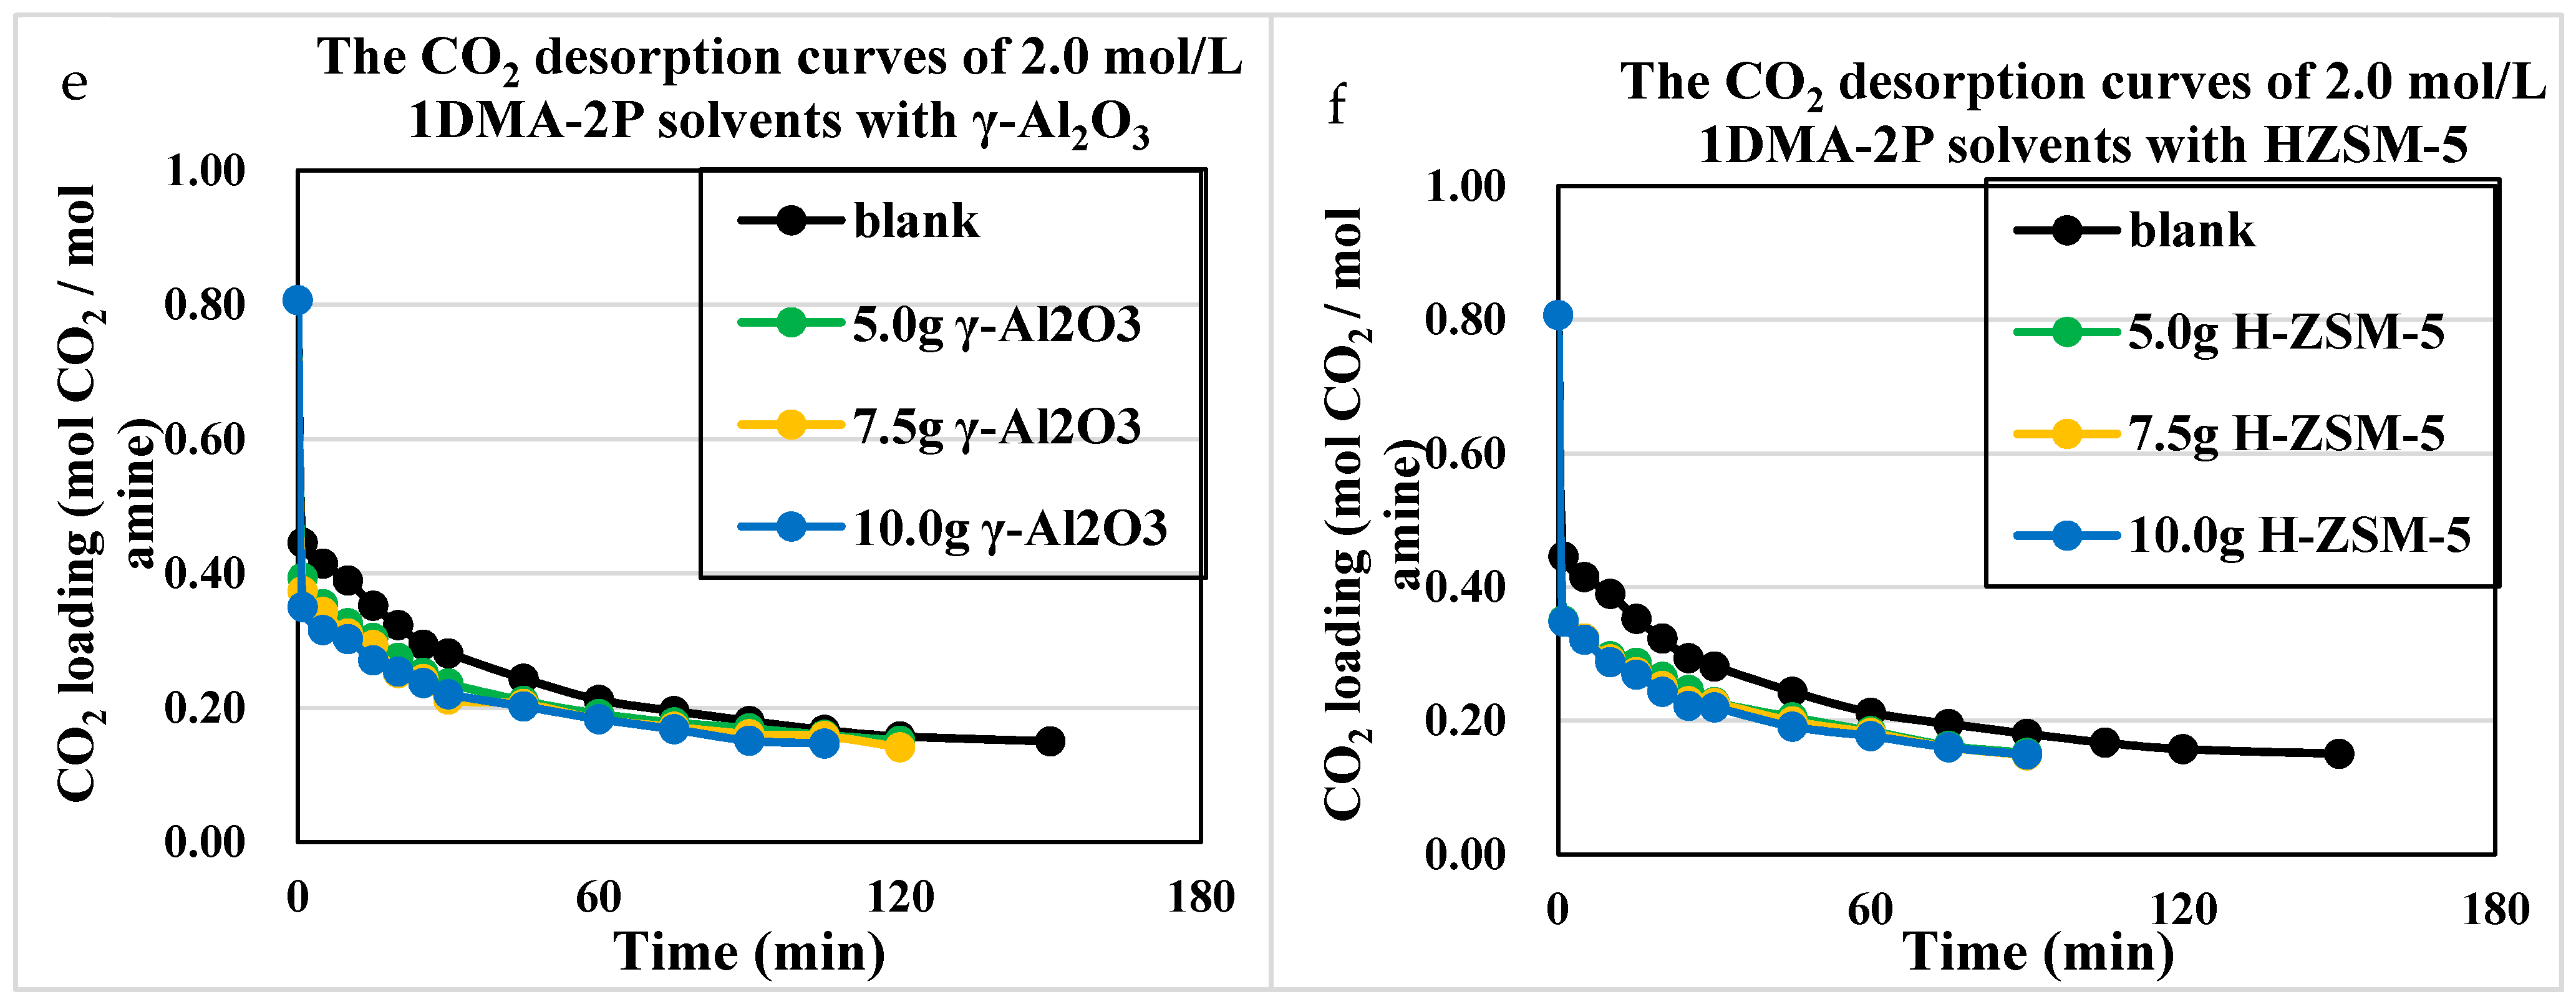
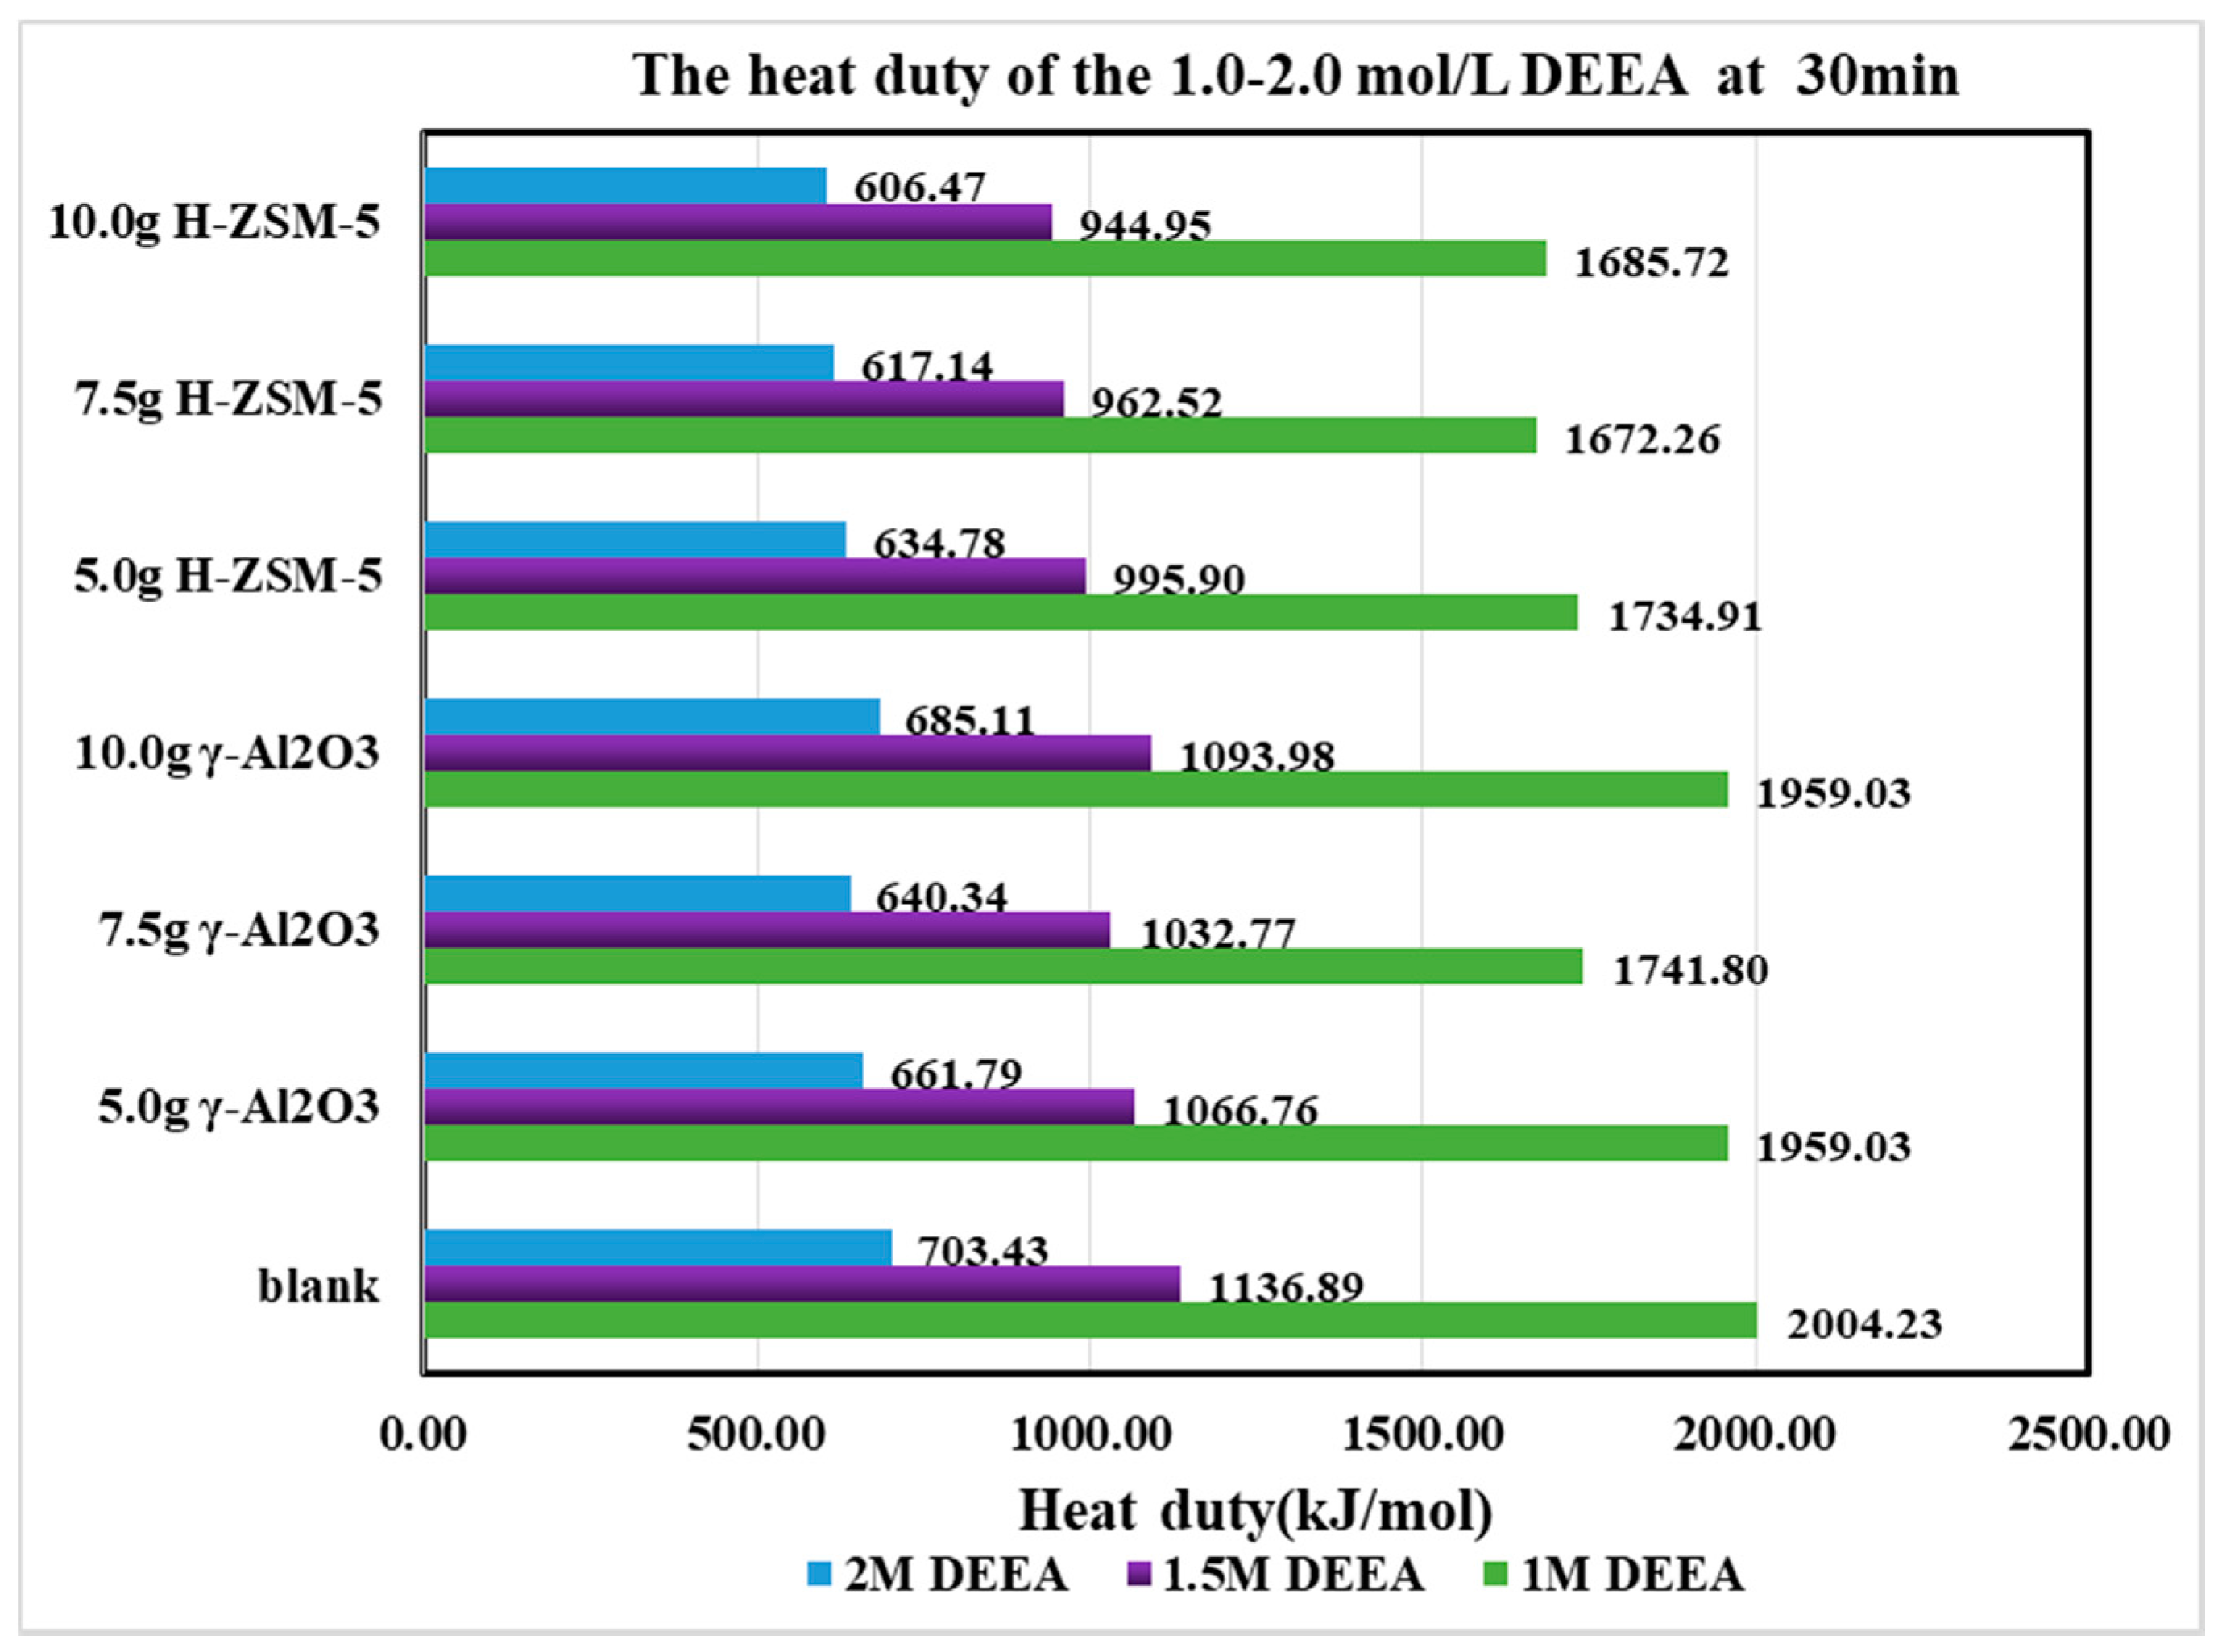
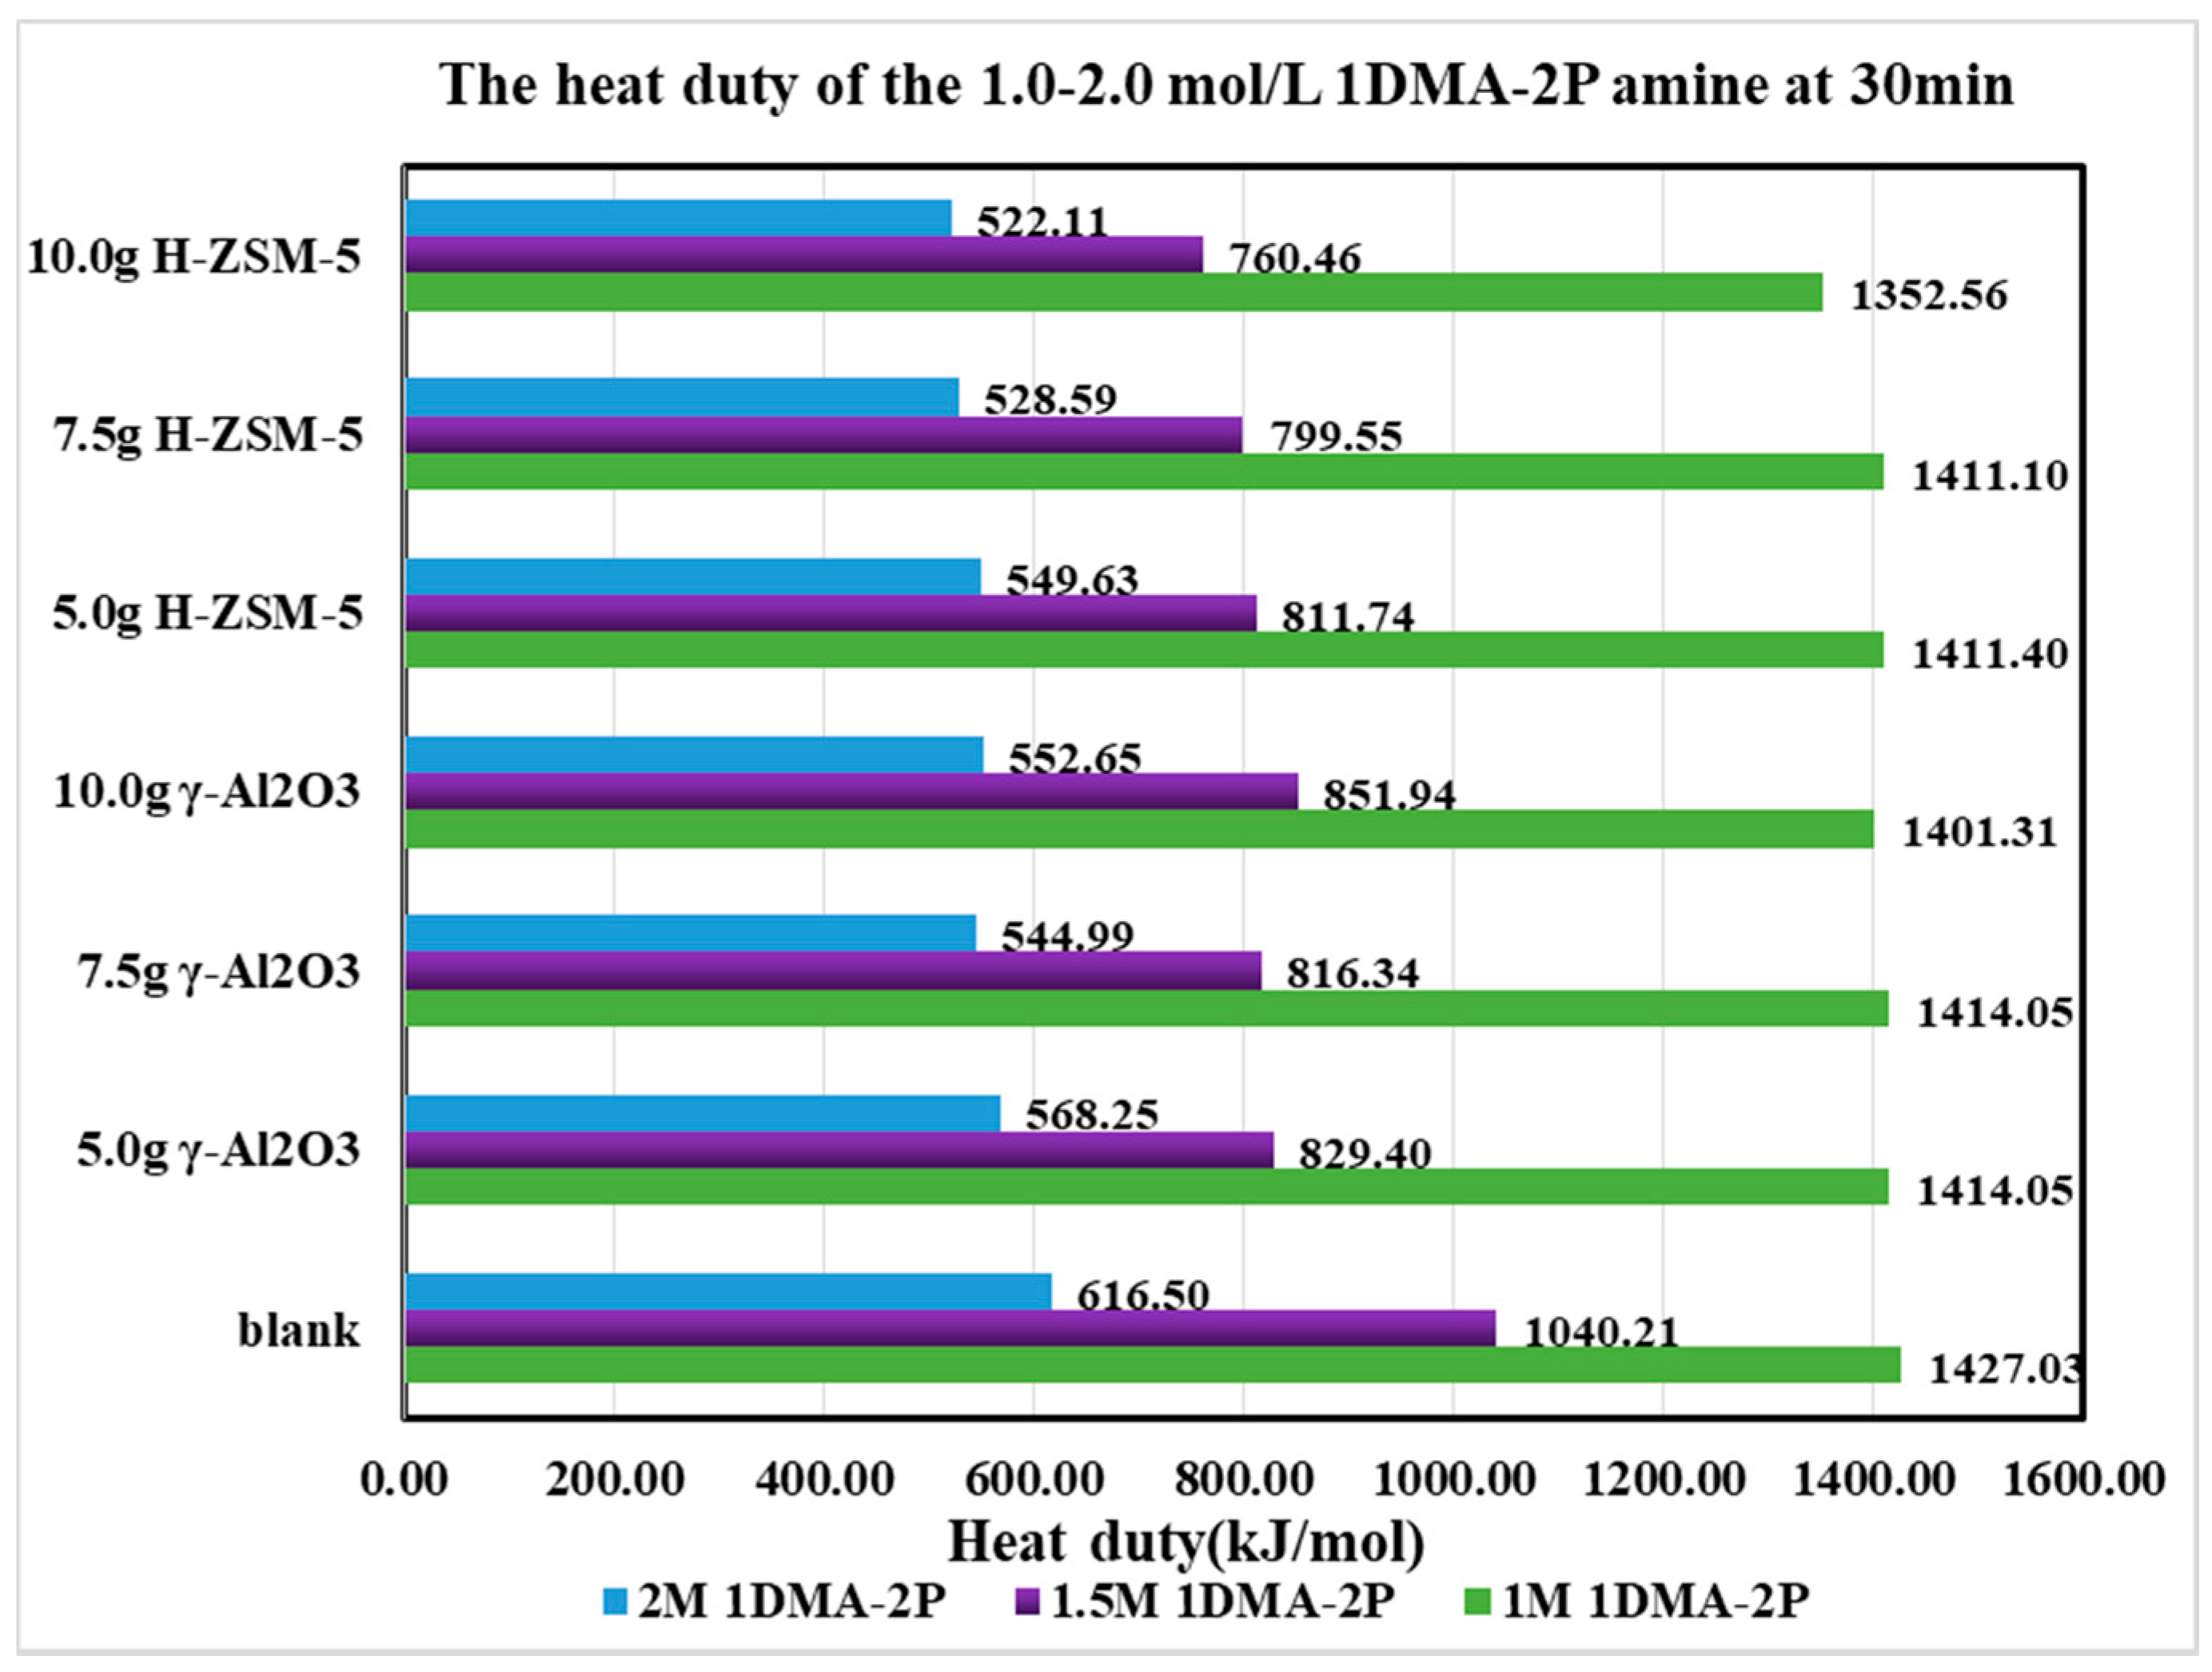
4.5. The CO2 Desorption Profiles with Heat Duty Analyses

The CO2 desorption profiles were plotted in Figure 8 and Figure 9 for 1~2 mol/L DEEA and 1DMA-2P solvents. This range of amine concentration was suitable for industrial application, for the 0–2 mol/L MDEA were usually blended with 5M MEA to prepare MEA-R3N solvents, usually 5 + 0.5, 5 + 1, 5 + 1.25, 5 + 1.5 M [6,7,9]. The operation condition of MEA-R3N was also 0.20~0.60 mol/mol. Moreover, for 1DMA-2P, the solubility was low. Small amounts of crystal were observed in 2.0 mol/L solvent at 293 K, but it was soluble in water at 363 K.
From the CO2 desorption curves, there were some clues. For DEEA, the catalytic desorption was better than the non-catalytic one, with the order of H-ZSM-5 > γ-Al2O3 > non-catalyst at 5.0 g, 7.5 g and 10 g through 1.0~2.0 mol/L. For 1DMA-2P, the effects of H-ZSM-5 ≈ γ-Al2O3 > non-catalyst at 5.0 and 7.5 g, but H-ZSM-5 > γ-Al2O3 > non-catalyst at 10 g at optimized amount of H-ZSM-5. This effect was reasonable because the CO2 loading decreased from 0.80 to 0.30 mol/mol at the first 30 min. There were abundant bicarbonates [HCO3], and more [R3NH+] from ion speciation plot, which made the CO2 production comparable with γ-Al2O3 and HZSM-5. Both solid acids could enhance the proton transfer process. However, at 10 g H-ZSM-5 of the series, an excess amount of H-ZSM-5 provided excessive protons into the solvents, and then fully reacted with [HCO3] and produced more CO2 to reduce heat duty.
The heat duty for the first 30 min was calculated in Figure 10 and Figure 11. The heat duty was mostly determined by the CO2 production (nCO2) as the heat inputs were similar for the first 30 min. During that period, most of the CO2 desorption process was completed as the CO2 loading decreased from 0.80 to 0.30 mol/mol. The CO2 desorption curves did not shift significantly after loading <0.30 mol/mol, since most [HCO3] was exhausted.
Based on Table 3, it was discovered that the heat duty was properly reduced. For γ-Al2O3, the order was 7.5 g > 10 ≈ 5 g > 0 g, and for H-ZSM-5, the order was 10 g > 7.5 g > 5 g > 0 g. At optimized catalytic conditions, the heat duty was reduced by about 83-98 % under different conditions. For DEEA, the reduction of heat duty followed the order of 1.5 > 1.0 > 2.0 mol/L. For 1DMA-2P, the reduction of heat duty followed the order of 1.5 > 2.0 > 1.0 mol/L. Hence, the amine concentration was preferred at 1.0–1.5 mol/L for DEEA and at 1.5–2.0 mol/L for 1DMA-2P with catalysts.

4.6. The Effect of Solid Acid to Tertiary Amine DEEA and 1DMA-2P and Compared with MEA and DEA

The effect of solid acids to 1DMA-2P and DEEA was shown in Table 3. Briefly, the effects of H-ZSM-5 and γ-Al2O3 were different due to different reaction schemes and mechanisms. For tertiary amine, HZSM-5 was better than γ-Al2O3 for DEEA within the scope of 1–2 mol/L and 0–10 g. For 1DMA-2P, H-ZSM-5 was comparable to γ-Al2O3 with inadequate catalysis (5 g and 7.5 g), and better than γ-Al2O3 at 10 g. The increased mass of H-ZSM-5 led to better desorption performance, with the order of: 10 g > 7.5 g > 5 g > 0 g.
This could be explained by the reactions (18) and (19) in Section 2.3. The Equation (18) reflected the fact that CO2 desorption rates were determined by mass of H-ZSM-5. Since H-ZSM-5 was a proton donor that reacted with bicarbonate right away, more H-ZSM-5 led to better desorption performance. After loading < 0.25 mol/mol, the effect of H-ZSM-5 was almost the same despite different masses because [HCO3] was exhausted from ion speciation plot [17].
On the other hand, the effect of γ-Al2O3 was complicated. In some cases, 10 g was the best, and in other cases, 7.5 g was the best, which was even better than 10 g and 5 g. This trend was quite different from MEA [21] and DEA [26]. In short, for single catalysts, the increased mass of solid acid led to better desorption performance for MEA [21] and DEA [26]. From Table S1 [26] it’s concluded that the order was H-ZSM-5 > blended catalyst (γ-Al2O3/H-ZSM-5) > γ-Al2O3 at 0.50–0.30 mol/mol for MEA, blended catalyst (γ-Al2O3/H-ZSM-5) > γ-Al2O3 > H-ZSM-5 at 0.30–0.15 mol/mol for MEA [21]. For DEA, HZSM-5 was better than γ-Al2O3 in both rich and lean regions [26]. However, excessive amounts of γ-Al2O3 might reduce the catalysis of tertiary amines from optimum dose, while the effect was still better than that of non-catalyst.
The reason was based on reactions (15)–(17), for the role of γ-Al2O3 was twofold. It had to accept [H+] from [R3NH+] first because it contained no proton, and then released [H+] to [HCO3]. The release of CO2 was determined by Equation (17), and it was affected by [HAlO2]. From Equation (16), HAlO2 was generated from proton release from [R3NH+] to [AlO2]. From Equation (15), the concentration of [AlO2] increased with increased amounts of γ-Al2O3. The increased [AlO2] enhanced the acceptance of [H+] in Equation (16), but the extra [AlO2] might inhibit the proton transfer to [HCO3] in Equation (17) and then affected the CO2 desorption rates. The increased mass of γ-Al2O3 enhanced desorption firstly, and then reduce desorption after the optimum, for the excessive amounts of [AlO2] might inhibit the proton transfer from [HAlO2] to [HCO3]. Similar to solid base (CaCO3 and MgCO3) to CO2 absorption, there was also an optimized dose of γ-Al2O3, and inadequate or excessive amounts of it would reduce the effects of CO2 desorption.

5. Conclusions

(1). The CO2 equilibrium solubility and pKa of DEEA and 1DMA-2P were comparable to published data, and the scope was expanded to 293 K from the previous 298–313 K.
(2). The existence of CaCO3 and MgCO3 as solid alkalis accelerated the CO2-R3N absorption, via the “base-catalyzed mechanism”. The effect of solid alkaline was indirect, it facilitated proton transfer from H2CO3 firstly, and the proton was then transferred to stronger base R3N. The increased mass of solid base boosted proton transfer, but the excess amount might inhibit the proton transfer from solid to R3N. Therefore, there was an optimized dose of CaCO3 and MgCO3 as catalysts. For solid alkalis, their effects were significant at 1.0 mol/L, but moderate at 1.5 mol/L because the increase of the amine concentration resulted in the increase of absorption rates and the increase of pH value. High amine concentration provided more free molecules into the solution to enhance the proton transfer of H2CO3.
(3). The solid acids could enhance the CO2 desorption and reduce the heat duties of both tertiary amines. The effect of catalytic desorption was better than that of non-catalytic ones. For DEEA, it was H-ZSM-5 > γ-Al2O3 > non-catalyst. For 1DMA-2P, it was H-ZSM-5 ≈ γ-Al2O3 > non-catalyst with inadequate catalysts, but H-ZSM-5 > γ-Al2O3 > non-catalyst at optimized performance.
(4). The effect of Bronsted acid/proton donor H-ZSM-5 to CO2 desorption was straightforward, that is, the more the better as it reacts with bicarbonate directly. The effect of Lewis acid such as γ-Al2O3 to CO2 desorption was indirect. The increased mass of γ-Al2O3 resulted in increased [AlO2], which could boost proton transfer of [R3NH+] to generate [HAlO2]. However, the excess amount of [AlO2] might inhibit the proton transfer of [HAlO2] to [HCO3] and release CO2. Therefore, there was surely an optimized dose of γ-Al2O3, which was not the more the better.

Supplementary Materials

The following are available online. Figure S1: Stirred Cell Reactor for CO2-Amine interactions with a water scrubbing process. Figure S2: The schematic diagram of the CO2 desorption process with oil bath. Figure S3: The CO2 equilibrium solubility of investigated amines and our graphical method of solubility test. Figure S4: The SEM and BET of pelletized CaCO3 and MgCO3. Table S1. The order of catalysis for MEA, DEA and MEA+DEA blended amines under different cases of blended solvents.

Author Contributions

H.S. completed the whole process of the literature survey, manuscript writing, and experiment designs. S.Z. analyzed the chemical reactions from the mechanism of CO2-R3N on a molecular level. L.C. helped to complete the catalysis part. M.H. completed the CO2 absorption experiments of DEEA and 1DMA-2P, and Q.W. completed the calculation of CO2 initial absorption rates. L.Z. completed the desorption process, and L.C. completed the calculation of heat duty study. P.T. helped the revision and proofreading.

Funding

The National Natural Science Foundation of China (NSFC Nos. 21606150) are gratefully acknowledged. It is also supported by Young Eastern Scholar with complement (QD 2016011, QD 2016011-005-011). Natural Sciences and Engineering Research Council of Canada (NSERC) are also acknowledged.

Conflicts of Interest

The authors declare no conflict of interest.

References

  1. Afkhamipour, M.; Mofarahi, M. A modeling-optimization framework for assessment of CO2 absorption capacity by novel amine solutions: 1DMA2P, 1DEA2P, DEEA, and DEAB. J. Clean. Prod. 2018, 171, 234–249. [Google Scholar]
  2. Liang, Z.; Rongwong, W.; Liu, H.; Fu, K.; Gao, H.; Cao, F.; Zhang, R.; Sema, T.; Henni, A.; Sumon, K.; et al. Recent progress and new developments in post-combustion carbon-capture technology with amine based solvents. Int. J. Greenh. Gas Control 2015, 40, 26–54. [Google Scholar] [CrossRef] [Green Version]
  3. Liu, H.; Xiao, M.; Tontiwachwuthikul, P.; Liang, Z. A Novel Model for Correlation and Predication of the Equilibrium CO2 Solubility in Seven Tertiary Solvents. Energy Procedia 2017, 105, 4476–4481. [Google Scholar] [CrossRef]
  4. Mofarahi, M.; Khojasteh, Y.; Khaledi, H.; Farahnak, A. Design of CO2 absorption plant for recovery of CO2 from flue gases of gas turbine. Energy 2008, 33, 1311–1319. [Google Scholar] [CrossRef]
  5. Min Xiao, H.L. Raphael Idem, Paitoon Tontiwachwuthikul, Zhiwu Liang, A study of structure–activity relationships of commercial tertiary amines for post-combustion CO2 capture. Appl. Energy 2016, 184, 219–229. [Google Scholar] [CrossRef]
  6. Shi, H.C.; Naami, A.; Idem, R.; Tontiwachwuthikul, P. Catalytic and non catalytic solvent regeneration during absorption-based CO2 capture with single and blended reactive amine solvents. Int. J. Greenh. Gas Control 2014, 26, 39–50. [Google Scholar] [CrossRef]
  7. Srisang, W.; Pouryousefi, F.; Osei, P.A.; Decardi-Nelson, B.; Akachuku, A.; Tontiwachwuthikul, P.; Idem, R. CO2 capture efficiency and heat duty of solid acid catalyst-aided CO2 desorption using blends of primary-tertiary amines. Int. J. Greenh. Gas Control 2018, 69, 52–59. [Google Scholar] [CrossRef]
  8. Srisang, W.; Pouryousefi, F.; Osei, P.A.; Decardi-Nelson, B.; Akachuku, A.; Tontiwachwuthikul, P.; Idem, R. Evaluation of the heat duty of catalyst aided amine post combustion CO2 capture. Chem. Eng. Sci. 2017, 170, 48–57. [Google Scholar] [CrossRef]
  9. Liu, H.L.; Zhang, X.; Gao, H.X.; Liang, Z.W.; Idem, R.; Tontiwachwuthikul, P. Investigation of CO2 Regeneration in Single and Blended Amine Solvents with and without Catalyst. Ind. Eng. Chem. Res. 2017, 56, 7656–7664. [Google Scholar] [CrossRef]
  10. Luo, X.; Chen, N.; Liu, S.; Rongwong, W.; Idem, R.O.; Tontiwachwuthikul, P.; Liang, Z. Experiments and modeling of vapor-liquid equilibrium data in DEEA-CO2-H2O system. Int. J. Greenh. Gas Control 2016, 53, 160–168. [Google Scholar] [CrossRef]
  11. Rayer, A.V.; Sumon, K.Z.; Jaffari, L.; Henni, A. Dissociation Constants (pKa) of Tertiary and Cyclic Amines: Structural and Temperature Dependences. J. Chem. Eng. Data 2014, 59, 3805–3813. [Google Scholar] [CrossRef]
  12. Xu, B.; Gao, H.; Luo, X.; Liao, H.; Liang, Z. Mass transfer performance of CO2 absorption into aqueous DEEA in packed columns. Int. J. Greenh. Gas Control 2016, 51, 11–17. [Google Scholar] [CrossRef]
  13. Kadiwala, S.; Rayer, A.V.; Henni, A. Kinetics of carbon dioxide (CO2) with ethylenediamine, 3-amino-1-propanol in methanol and ethanol, and with 1-dimethylamino-2-propanol and 3-dimethylamino-1-propanol in water using stopped-flow technique. Chem. Eng. J. 2012, 179, 262–271. [Google Scholar] [CrossRef]
  14. Liang, Y.J.; Liu, H.L.; Rongwong, W.; Liang, Z.W.; Idem, R.; Tontiwachwuthikul, P. Solubility, absorption heat and mass transfer studies of CO2 absorption into aqueous solution of 1-dimethylamino-2-propanol. Fuel 2015, 144, 121–129. [Google Scholar] [CrossRef]
  15. Liu, H.; Gao, H.; Idem, R.; Tontiwachwuthikul, P.; Liang, Z. Analysis of CO2 solubility and absorption heat into 1-dimethylamino-2-propanol solution. Chem. Eng. Sci. 2017, 170, 3–15. [Google Scholar] [CrossRef]
  16. Hamborg, E.S.; Versteeg, G.F. Dissociation Constants and Thermodynamic Properties of Amines and Alkanolamines from (293−353) K. Chem. Eng. Data 2009, 54, 1318–1328. [Google Scholar] [CrossRef]
  17. Liu, H.; Idem, R.; Tontiwachwuthikul, P.; Liang, Z. Study of Ion Speciation of CO2 Absorption into Aqueous 1-Dimethylamino-2-propanol Solution Using the NMR Technique. Ind. Eng. Chem. Res. 2017, 56, 8697–8704. [Google Scholar] [CrossRef]
  18. Narku-Tetteh, J.; Afari, D.B.; Coker, J.; Idem, R. Evaluation of the Roles of Absorber and Desorber Catalysts in the Heat Duty and Heat of CO2 Desorption from Butylethanolamine–2-Amino-2-methyl-1-propanol and Monoethanolamine–Methyldiethanolamine Solvent Blends in a Bench-Scale CO2 Capture Pilot Plant. Energy Fuels 2018, 32, 9711–9726. [Google Scholar] [CrossRef]
  19. Idem, R.; Shi, H.; Gelowitz, D.; Tontiwachwuthikul, P. Catalytic Method and Apparatus for Separation Gaseous Component from an Incoming Gas Stream. U.S. Patent US 2013/0108532 A1, 2 May 2013. [Google Scholar]
  20. Shi, H.C.; Zhou, Y.L.; Zuo, Y.H.; Cui, L.F.; Idem, R.; Tontiwachwuthikul, P. Heterogeneous catalysis of CO2-diethanolamine absorption with MgCO3 and CaCO3 and comparing to non-catalytic CO2-monoethanolamine interactions. React. Kinet. Mech. Catal. 2017, 122, 539–555. [Google Scholar] [CrossRef]
  21. Liang, Z.W.; Idem, R.; Tontiwachwuthikul, P.; Yu, F.H.; Liu, H.L.; Rongwong, W. Experimental study on the solvent regeneration of a CO2-loaded MEA solution using single and hybrid solid acid catalysts. AIChE J. 2016, 62, 753–765. [Google Scholar] [CrossRef]
  22. Shi, H.C.; Zhou, Y.L.; Si, M.Y.; Zuo, Y.H.; Kang, S.F.; Wang, Y.G.; Cui, L.F.; Idem, R.; Tontiwachwuthikul, P.; Liang, Z.W. Amine Regeneration tests on MEA, DEA and MMEA with respect to carbamate stability analyses. Can. J. Chem. Eng. 2017, 95, 1471–1479. [Google Scholar] [CrossRef]
  23. Decardi-Nelson, B.; Akachuku, A.; Osei, P.; Srisang, W.; Pouryousefi, F.; Idem, R. A flexible and robust model for low temperature catalytic desorption of CO2 from CO2-loaded amines over solid acid catalysts. Chem. Eng. Sci. 2017, 170, 518–529. [Google Scholar] [CrossRef]
  24. Bhatti, U.H.; Shah, A.K.; Kim, J.N.; You, J.K.; Choi, S.H.; Lim, D.H.; Nam, S.; Park, Y.H.; Baek, H. Effects of transition metal oxide catalysts on MEA solvent regeneration for the post-combustion carbon capture process. ACS Sustain. Chem. Eng. 2017, 5, 5862–5868. [Google Scholar] [CrossRef]
  25. Qinghua, L.; Sam, T.; Mohammed, A.A.; Huaigang, C.; Armistead, G.R.; Hertanto, A.; Maciej, R.; Maohong, F. Catalyst-TiO(OH)2 could drastically reduce the energy consumption of CO2 capture. Nat. Commun. 2018, 9, 2672. [Google Scholar]
  26. Shi, H.C.; Zheng, L.N.; Huang, M.; Zuo, Y.H.; Kang, S.F.; Huang, Y.D.; Idem, R.; Tontiwachwuthikul, P. Catalytic-CO2-Desorption Studies of DEA and DEA-MEA Blended Solutions with the Aid of Lewis and Bronsted Acids. Ind. Eng. Chem. Res. 2018, 57, 11505–11516. [Google Scholar] [CrossRef]
  27. Teerawat Sema, A.N. Zhiwu Liang, Huancong Shi, Aravind V Rayer, Kazi Z Sumon, Pathamaporn Wattanaphan, Amr Henni, Raphael Idem, Chintana Saiwan, Paitoon Tontiwachwuthikul, Part 5b: Solvent chemistry: Reaction kinetics of CO2 absorptoin into reactive amine solutions. Carbon Manag. 2012, 3, 201–220. [Google Scholar]
  28. Caplow, M. Kinetics of carbamate formation and breakdown. J. Am. Chem. Soc. 1968, 90, 6795–6803. [Google Scholar] [CrossRef]
  29. Aboudheir, A.; Tontiwachwuthikul, P.; Chakma, A.; Idem, R. Kinetics of the reactive absorption of carbon dioxide in high CO2 -loaded, concentrated aqueous monoethanolamine solutions. Chem. Eng. Sci. 2003, 58, 5195–5210. [Google Scholar] [CrossRef]
  30. Donaldson, T.L.; Nguyen, N.Y. Carbon dioxide reaction kinetics and transport in aqueous amine membranes. Ind. Eng. Chem. Fundam. 1980, 19, 260–266. [Google Scholar] [CrossRef]
  31. Yu, W.C.; Astarita, G.; Savage, D.W. Kinetics of carbon dioxide absorption in solutions of methyldiethanolamine. Chem. Eng. Sci. 1985, 40, 1585–1590. [Google Scholar] [CrossRef]
  32. Shi, H.C.; Naami, A.; Idem, R.; Tontiwachwuthikul, P. 1D NMR Analysis of a Quaternary MEA-DEAB-CO2-H2O Amine System: Liquid Phase Speciation and Vapor-Liquid Equilibria at CO2 Absorption and Solvent Regeneration Conditions. Ind. Eng. Chem. Res. 2014, 53, 8577–8591. [Google Scholar] [CrossRef]
  33. Narku-Tetteh, J.; Muchan, P.; Saiwan, C.; Supap, T.; Idem, R. Selection of components for formulation of amine blends for post combustion CO2 capture based on the side chain structure of primary, secondary and tertiary amines. Chem. Eng. Sci. 2017, 170, 542–560. [Google Scholar] [CrossRef]
  34. Muchan, P.; Saiwan, C.; Narku-Tetteh, J.; Idem, R.; Supap, T.; Tontiwachwuthikul, P. Screening tests of aqueous alkanolamine solutions based on primary, secondary, and tertiary structure for blended aqueous amine solution selection in post combustion CO2 capture. Chem. Eng. Sci. 2017, 170, 574–582. [Google Scholar] [CrossRef]
  35. Singto, S.; Supap, T.; Idem, R.; Tontiwachwuthikul, P.; Tantayanon, S.; Al-Marri, M.J.; Benamor, A. Synthesis of new amines for enhanced carbon dioxide (CO2) capture performance: The effect of chemical structure on equilibrium solubility, cyclic capacity, kinetics of absorption and regeneration, and heats of absorption and regeneration. Sep. Purif. Technol. 2016, 167, 97–107. [Google Scholar] [CrossRef]
  36. Horwitz, W. Association of Official Analytical Chemists (AOAC) Methods; George Banta Co.: Menasha, WI, USA, 1975. [Google Scholar]
  37. Shi, H.C.; Zheng, L.N.; Huang, M.; Zuo, Y.H.; Li, M.Y.; Jiang, L.H.; Idem, R.; Tontiwachwuthikul, P. CO2 desorption tests of blended monoethanolamine-diethanolamine solutions to discover novel energy efficient solvents. Asia-Pac. J. Chem. Eng. 2018, 13, e2186–e2199. [Google Scholar] [CrossRef]
  38. Uyan, M.; Sieder, G.; Ingram, T.; Held, C. Predicting CO2 solubility in aqueous N-methyldiethanolamine solutions with ePC-SAFT. Fluid Phase Equilib. 2015, 393, 91–100. [Google Scholar] [CrossRef]
  39. Wangler, A.; Sieder, G.; Ingram, T.; Heilig, M.; Held, C. Prediction of CO2 and H2S solubility and enthalpy of absorption in reacting N-methyldiethanolamine /water systems with ePC-SAFT. Fluid Phase Equilib. 2018, 461, 15–27. [Google Scholar] [CrossRef]
  40. Afari, D.B.; Coker, J.; Narku-Tetteh, J.; Idem, R. Comparative kinetic studies of solid absorber catalyst (K/MgO) and solid desorber catalyst (HZSM-5)-aided CO2 absorption and desorption from aqueous solutions of MEA and blended solutions of BEA-AMP and MEA-MDEA. Ind. Eng. Chem. Res. 2018, 57, 15824–15839. [Google Scholar] [CrossRef]
Sample Availability: Samples of the compounds are available from the authors, the solid catalysts are commercially available, and the amines are also commercial available to prepare solutions.
Figure 1. The critical point of CO2 absorption curves at 1 atm and 293 K, and CO2 equilibrium solubility of DEEA and 1DMA-2P at pressure of 1 atm and 298–313 K [5].
Molecules 24 01009 g001
Figure 2. The pKa of 1DMA-2P at 293–333 K and 1 atm a. a The equation above is for the pKa at 298–333 K and 1 atm from literature, [15] and the equation below is the calibration curve of 4 points at the range of 293–333 K.
Molecules 24 01009 g002
Figure 3. Catalytic CO2 absorption curves of 1.0 mol/L DEEA solvents at 293 K and 1 atm. (A) CaCO3 0–10 g; (B) MgCO3 0–10 g.
Molecules 24 01009 g003
Figure 4. Catalytic CO2 absorption curves of 1.5 mol/L DEEA solvents at 293 K and 1 atm. (A) CaCO3 0–10 g (B) MgCO3 0–10 g.
Molecules 24 01009 g004
Figure 5. Catalytic CO2 absorption curves of 1.0 mol/L 1DMA-2P solvents at 293 K and 1 atm. (A). CaCO3 0–10 g. (B). MgCO3 0–10 g.
Molecules 24 01009 g005
Figure 6. Catalytic CO2 absorption curves of 1.5 mol/L 1DMA-2P solvents at 293 K and 1 atm. (A) CaCO3 0–10 g. (B) MgCO3 0–10 g.
Molecules 24 01009 g006aMolecules 24 01009 g006b
Figure 7. Initial Absorption rates for DEEA and 1DMA-2P with optimized amount of CaCO3 and MgCO3, from 1.0–1.5 mol/L at 293 K and 1 atm. (a) 1.0 mol/L DEEA, (b) 1.5 mol/L DEEA, (c) 1.0 mol/L 1DMA-2P, (d) 1.5 mol/L 1DMA-2P.
Molecules 24 01009 g007aMolecules 24 01009 g007b
Figure 8. Catalytic CO2 desorption curves of 1.0–2.0 mol/L DEEA solvents at 363 K and 1 atm, with 0–10 g γ-Al2O3 and H-ZSM-5. (a,b) 1.0 mol/L with γ-Al2O3 and HZSM-5; (c,d) 1.5 mol/L with γ-Al2O3 and HZSM-5; (e,f) 2.0 mol/L with γ-Al2O3 and HZSM-5.
Molecules 24 01009 g008aMolecules 24 01009 g008b
Figure 9. Catalytic CO2 desorption curves of 1.0–2.0 mol/L 1DMA-2P solvents at 363 K and 1 atm, with γ-Al2O3 and H-ZSM-5. (a,b) 1.0 mol/L with γ-Al2O3 and HZSM-5; (c,d) 1.5 mol/L with γ-Al2O3 and HZSM-5; (e,f) 2.0 mol/L with γ-Al2O3 and HZSM-5.
Molecules 24 01009 g009aMolecules 24 01009 g009b
Figure 10. The heat duty of the DEEA at first 30 min from 1.0 to 2.0 mol/L at 363 K and 1 atm.
Molecules 24 01009 g010
Figure 11. The heat duty of 1DMA-2P at first 30 min from 1.0 to 2.0 mol/L at 363 K and 1 atm.
Molecules 24 01009 g011
Table 1. pKa of investigates amines at 293 K and 1 atm.
AminePredicted pKaReferenceMeasured This Work
DEEA9.60 (298 K) [5]9.73 (298 K) [11]
9.82 (293 K) [11]
9.82 (293 K)
1DMA-2P9.20 (298 K) [5]9.67 (301 K) [17]
9.41 (298 K) [15]
9.51 (293 K)
Table 2. The optimized mass of CaCO3 and MgCO3 for different amine solvents at 293 K and 1 atm.
Amine SolventsCaCO3 (g)MgCO3 (g)
1.0 M DEEA7.510
1.5 M DEEA7.55
1.0 M 1DMA-2P7.510
1.5 M 1DMA-2P105
Table 3. The relative heat duty (%) of different amine solvents under optimized catalysis at 363 K and 1 atm.
Amine SolventsOptimized CatalystsHeat Duty (kJ/mol CO2)
Optimized CatalysisNon-CatalystRatio (%)
DEEA
1.0 mol/L
7.5 g γ-Al2O31741.82004.286.91%
10 g HZSM-51685.72004.284.11%
1.5 mol/L7.5 g γ-Al2O31032.81136.990.84%
10 g HZSM-5945.01136.983.12%
2.0 mol/L7.5 g γ-Al2O3640.3703.491.03%
10 g HZSM-5606.5703.486.22%
1DMA-2P
1.0 mol/L
10 g γ-Al2O31401.3 1427.0 98.20%
10 g HZSM-51352.6 1427.0 94.78%
1.5 mol/L7.5 g γ-Al2O3816.3 1040.2 78.48%
10 g HZSM-5760.5 1040.2 73.11%
2.0 mol/L10 g γ-Al2O3545.0 616.5 88.40%
10 g HZSM-5522.1 616.5 84.69%

