Machine Learning Analyses on Data including Essential Oil Chemical Composition and In Vitro Experimental Antibiofilm Activities against Staphylococcus Species

 , , ,
, , ,  , ,
, ,
Abstract
:
1. Introduction
2. Results
2.1. Antimicrobials Activity of EOs
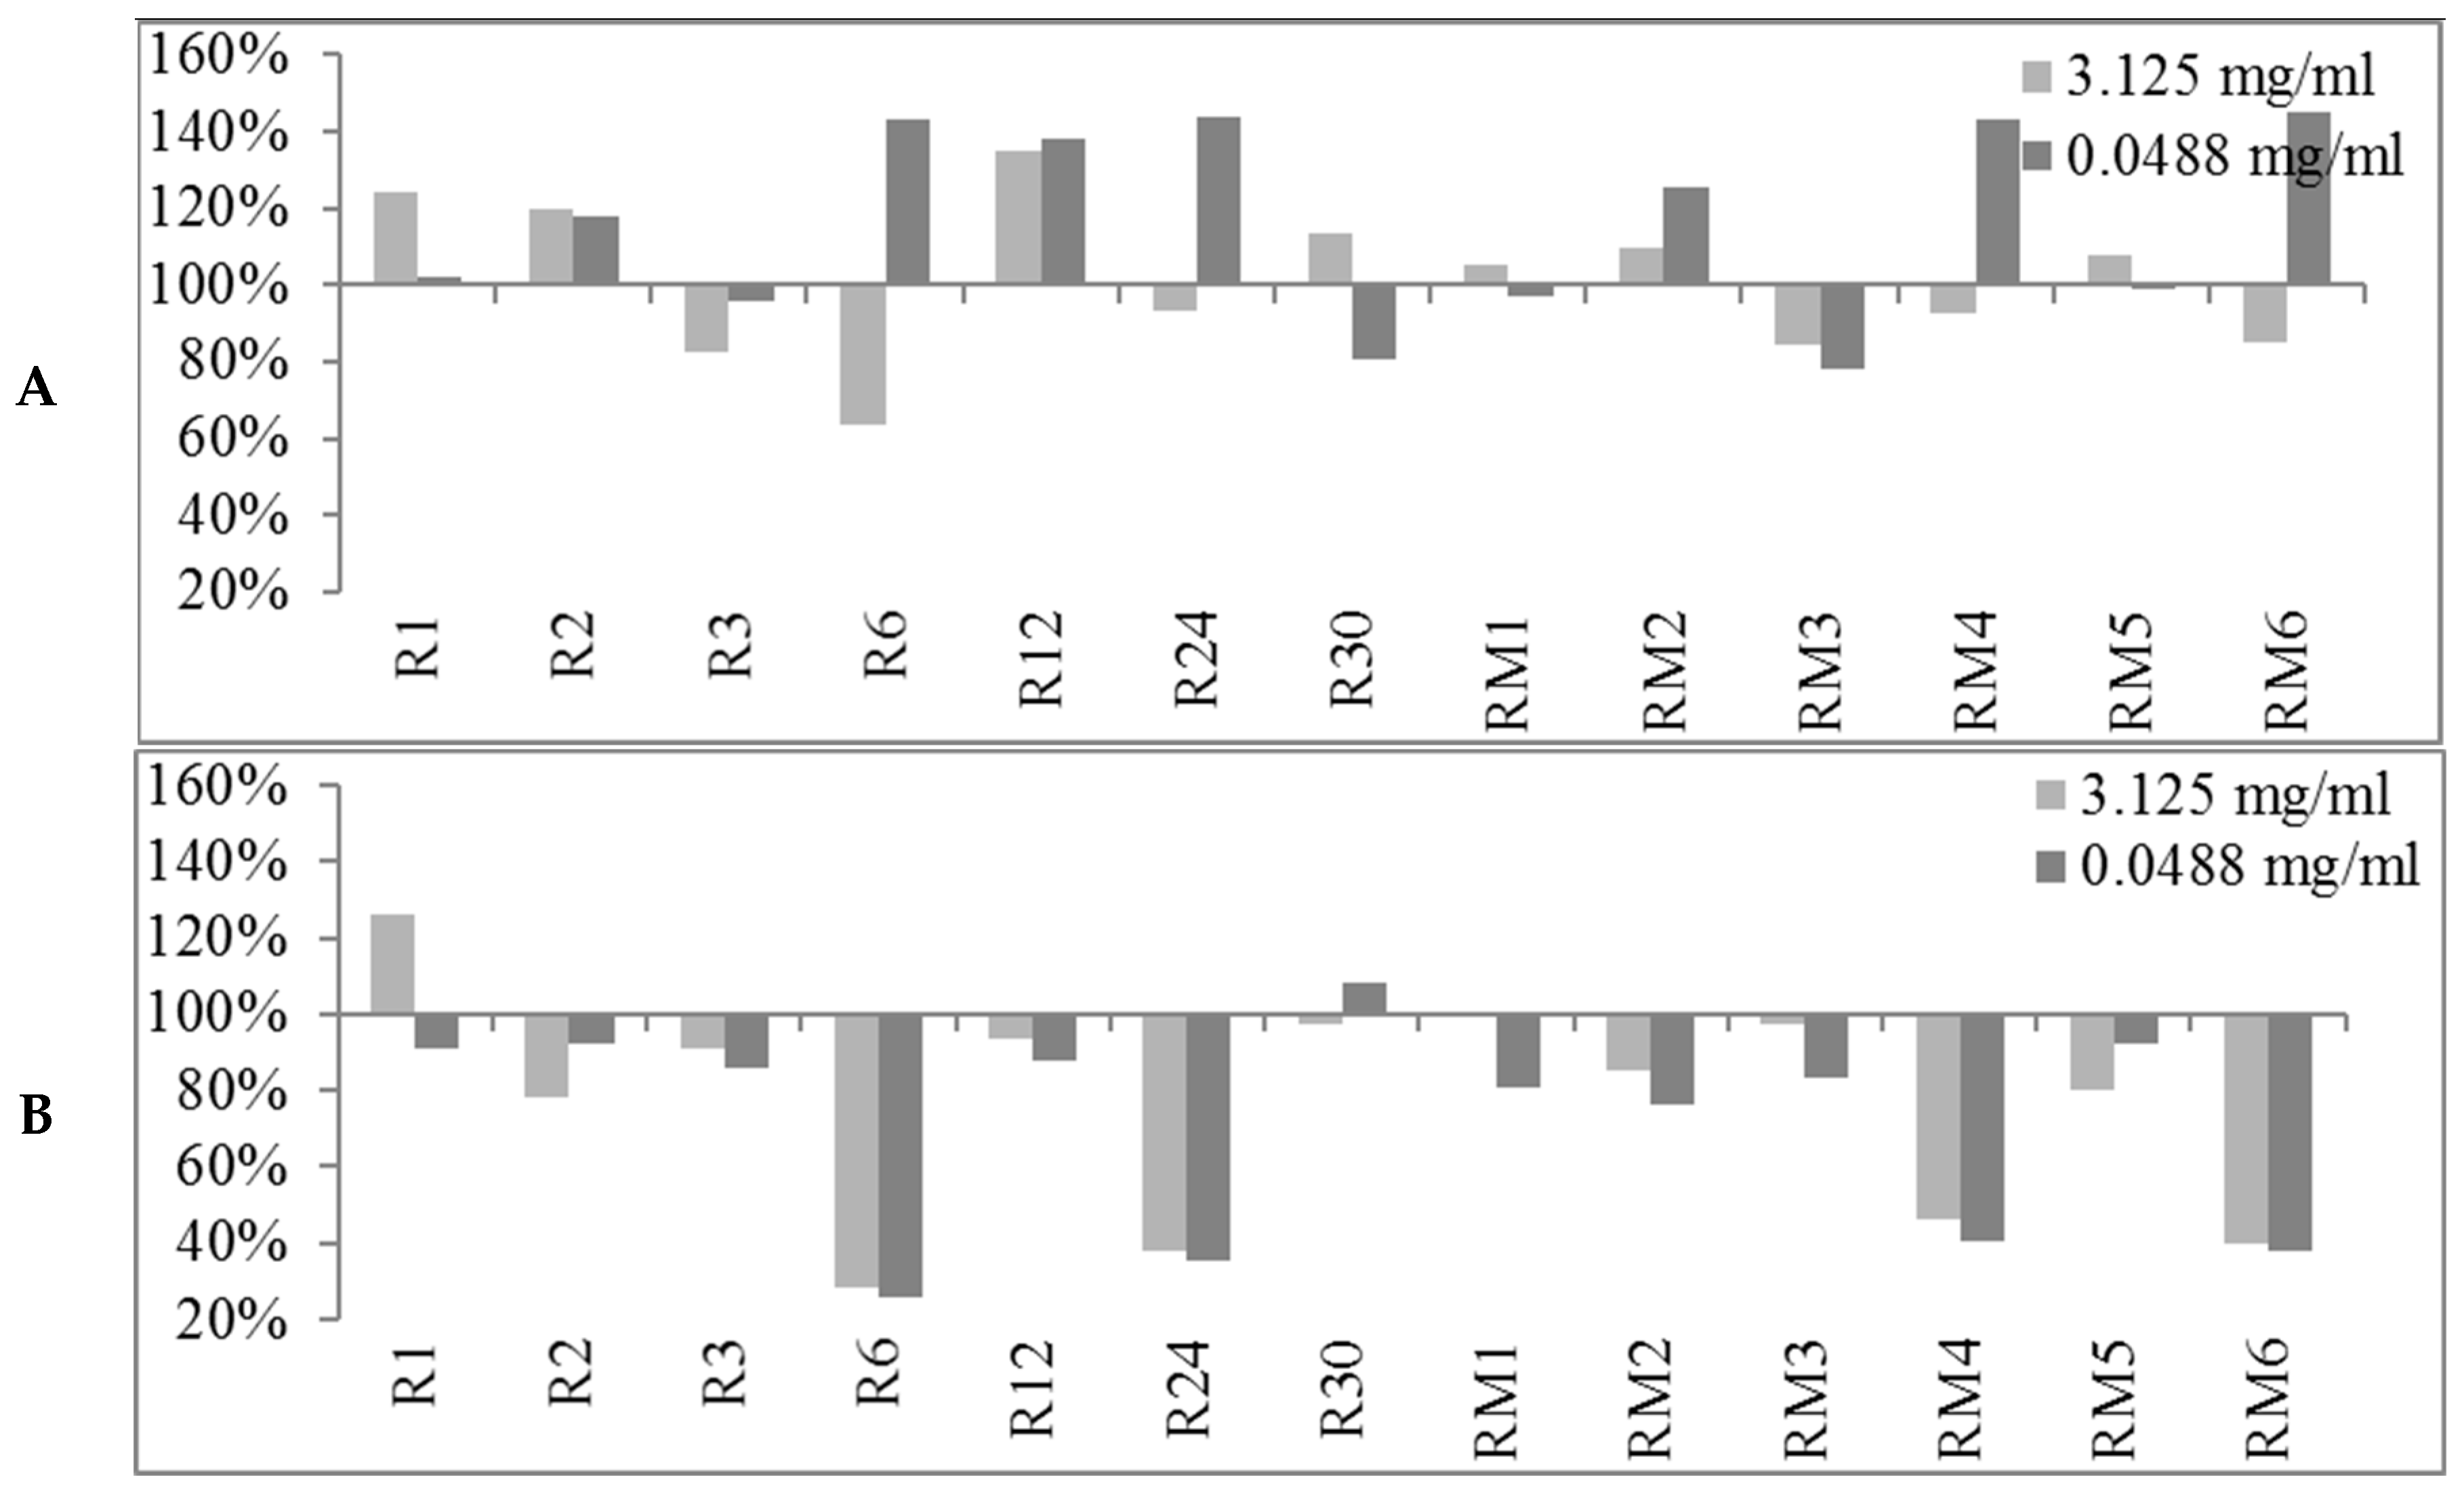
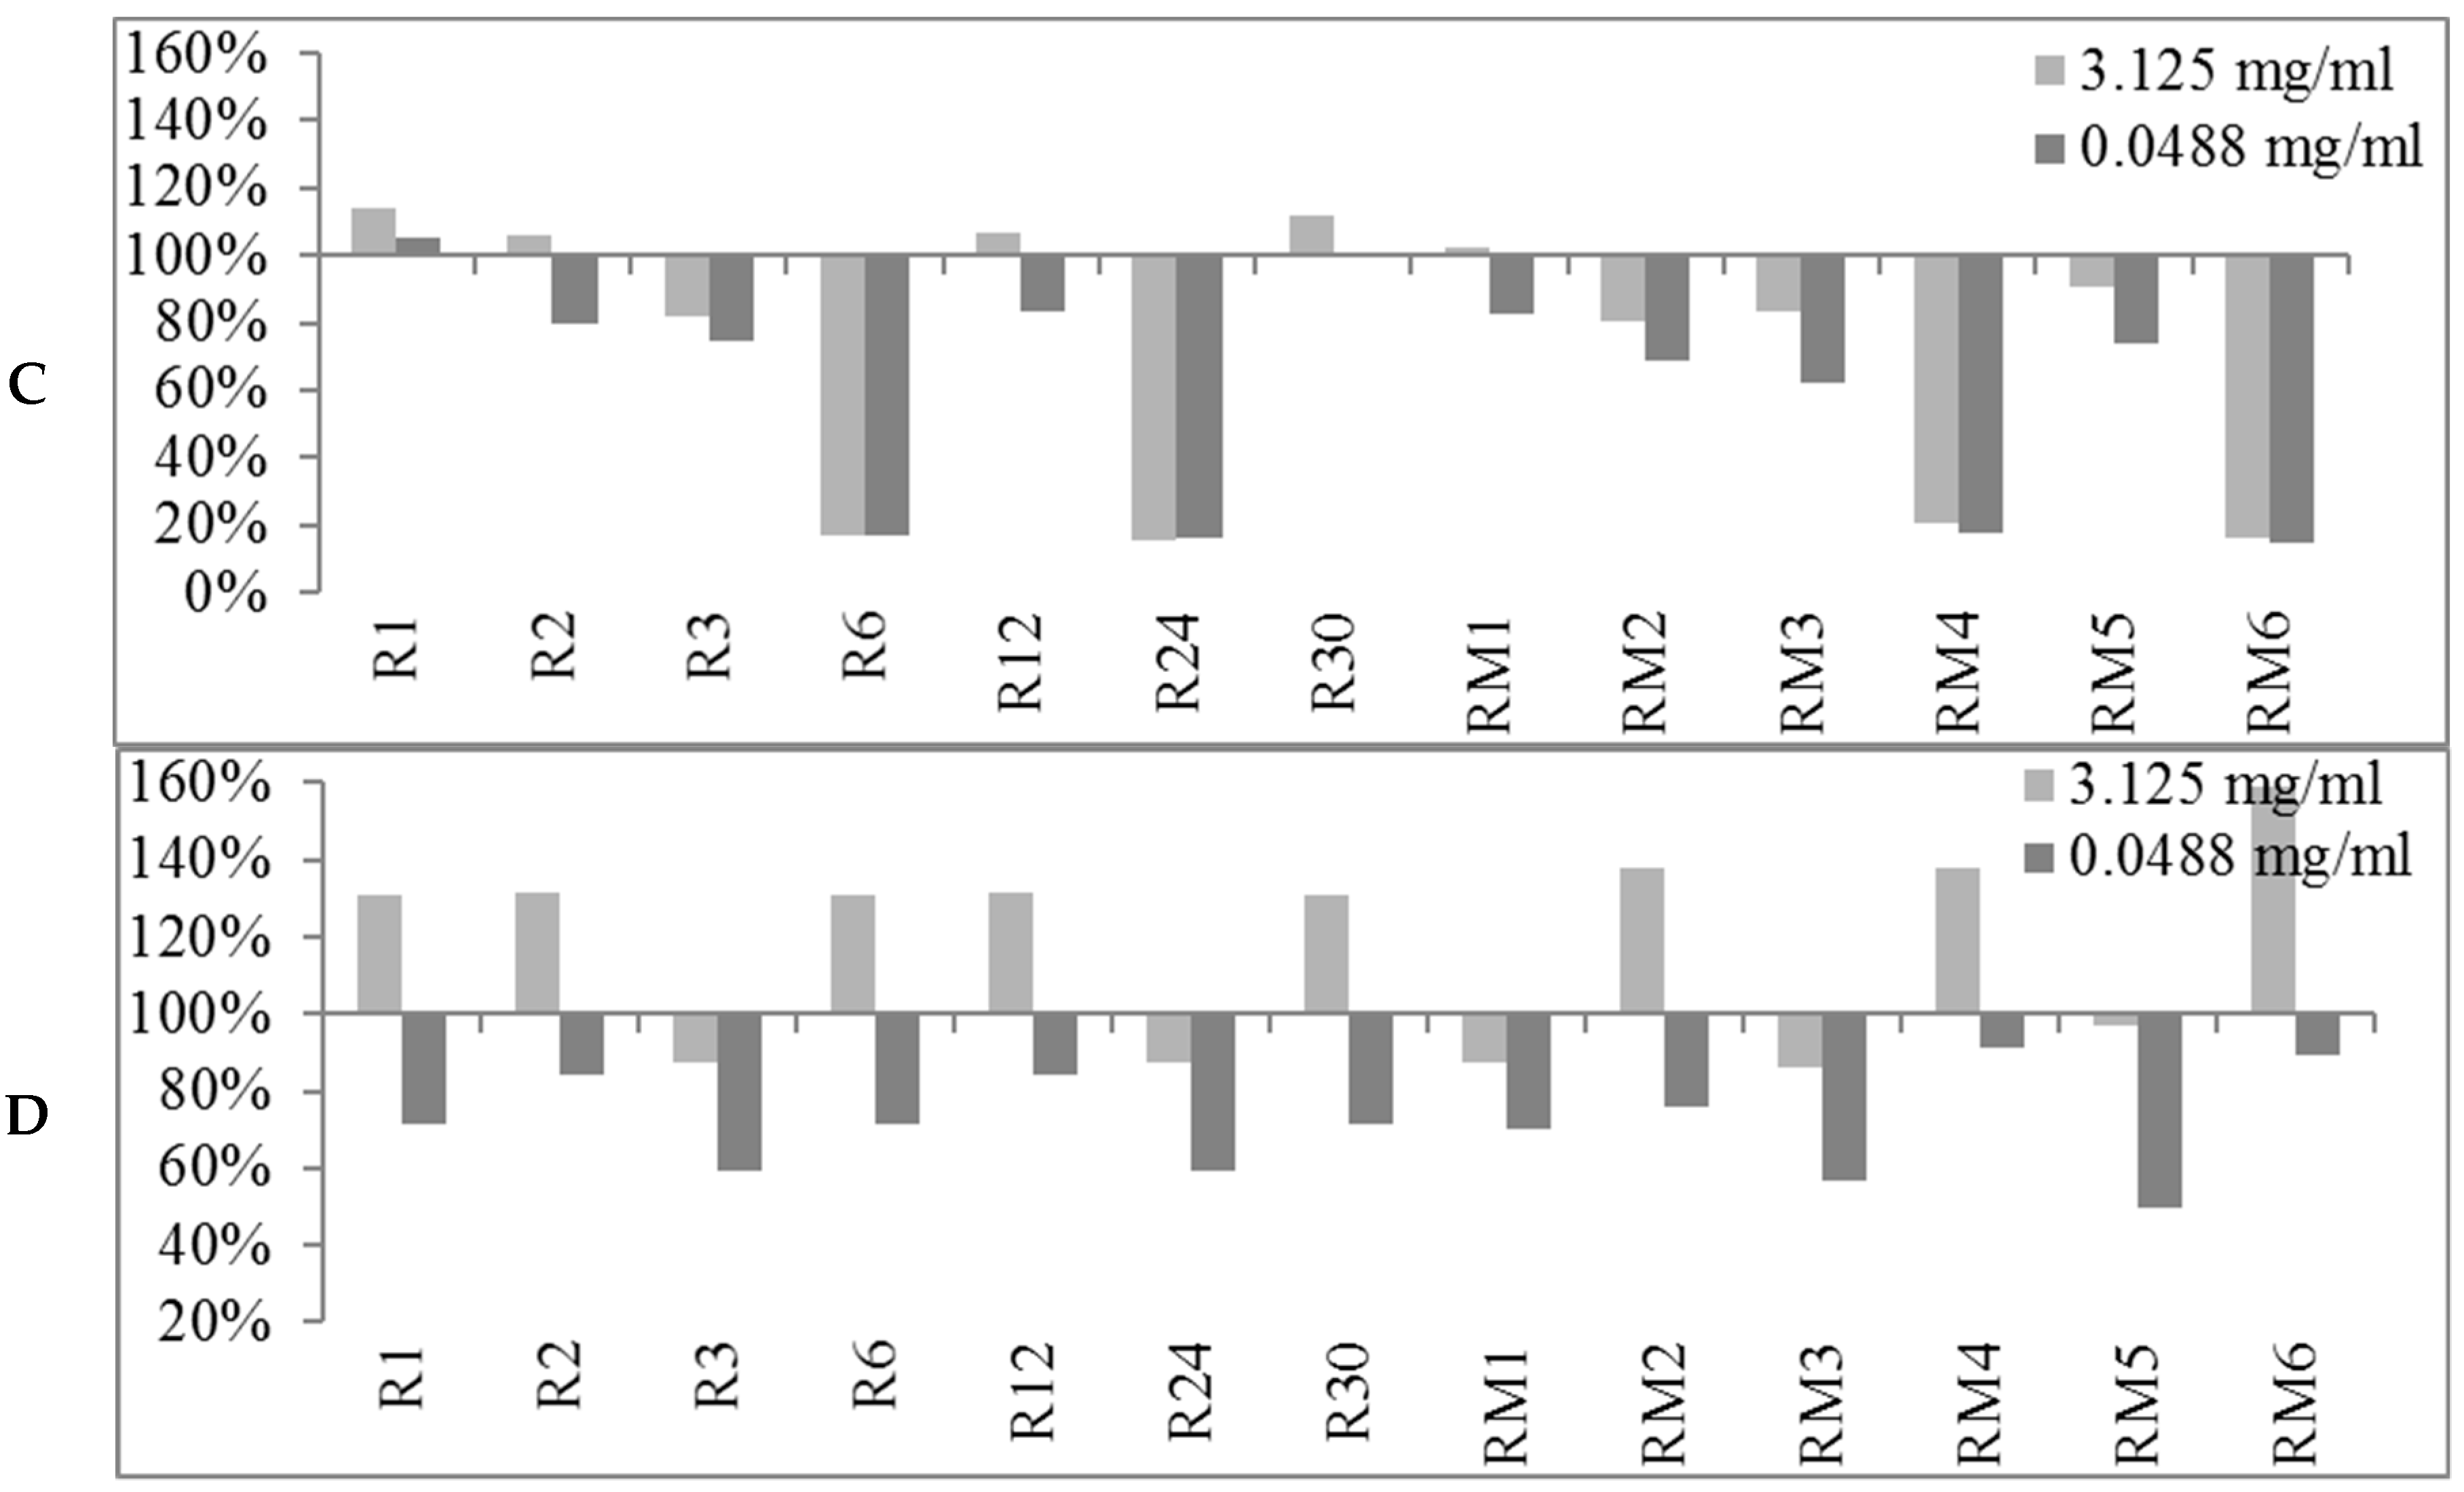
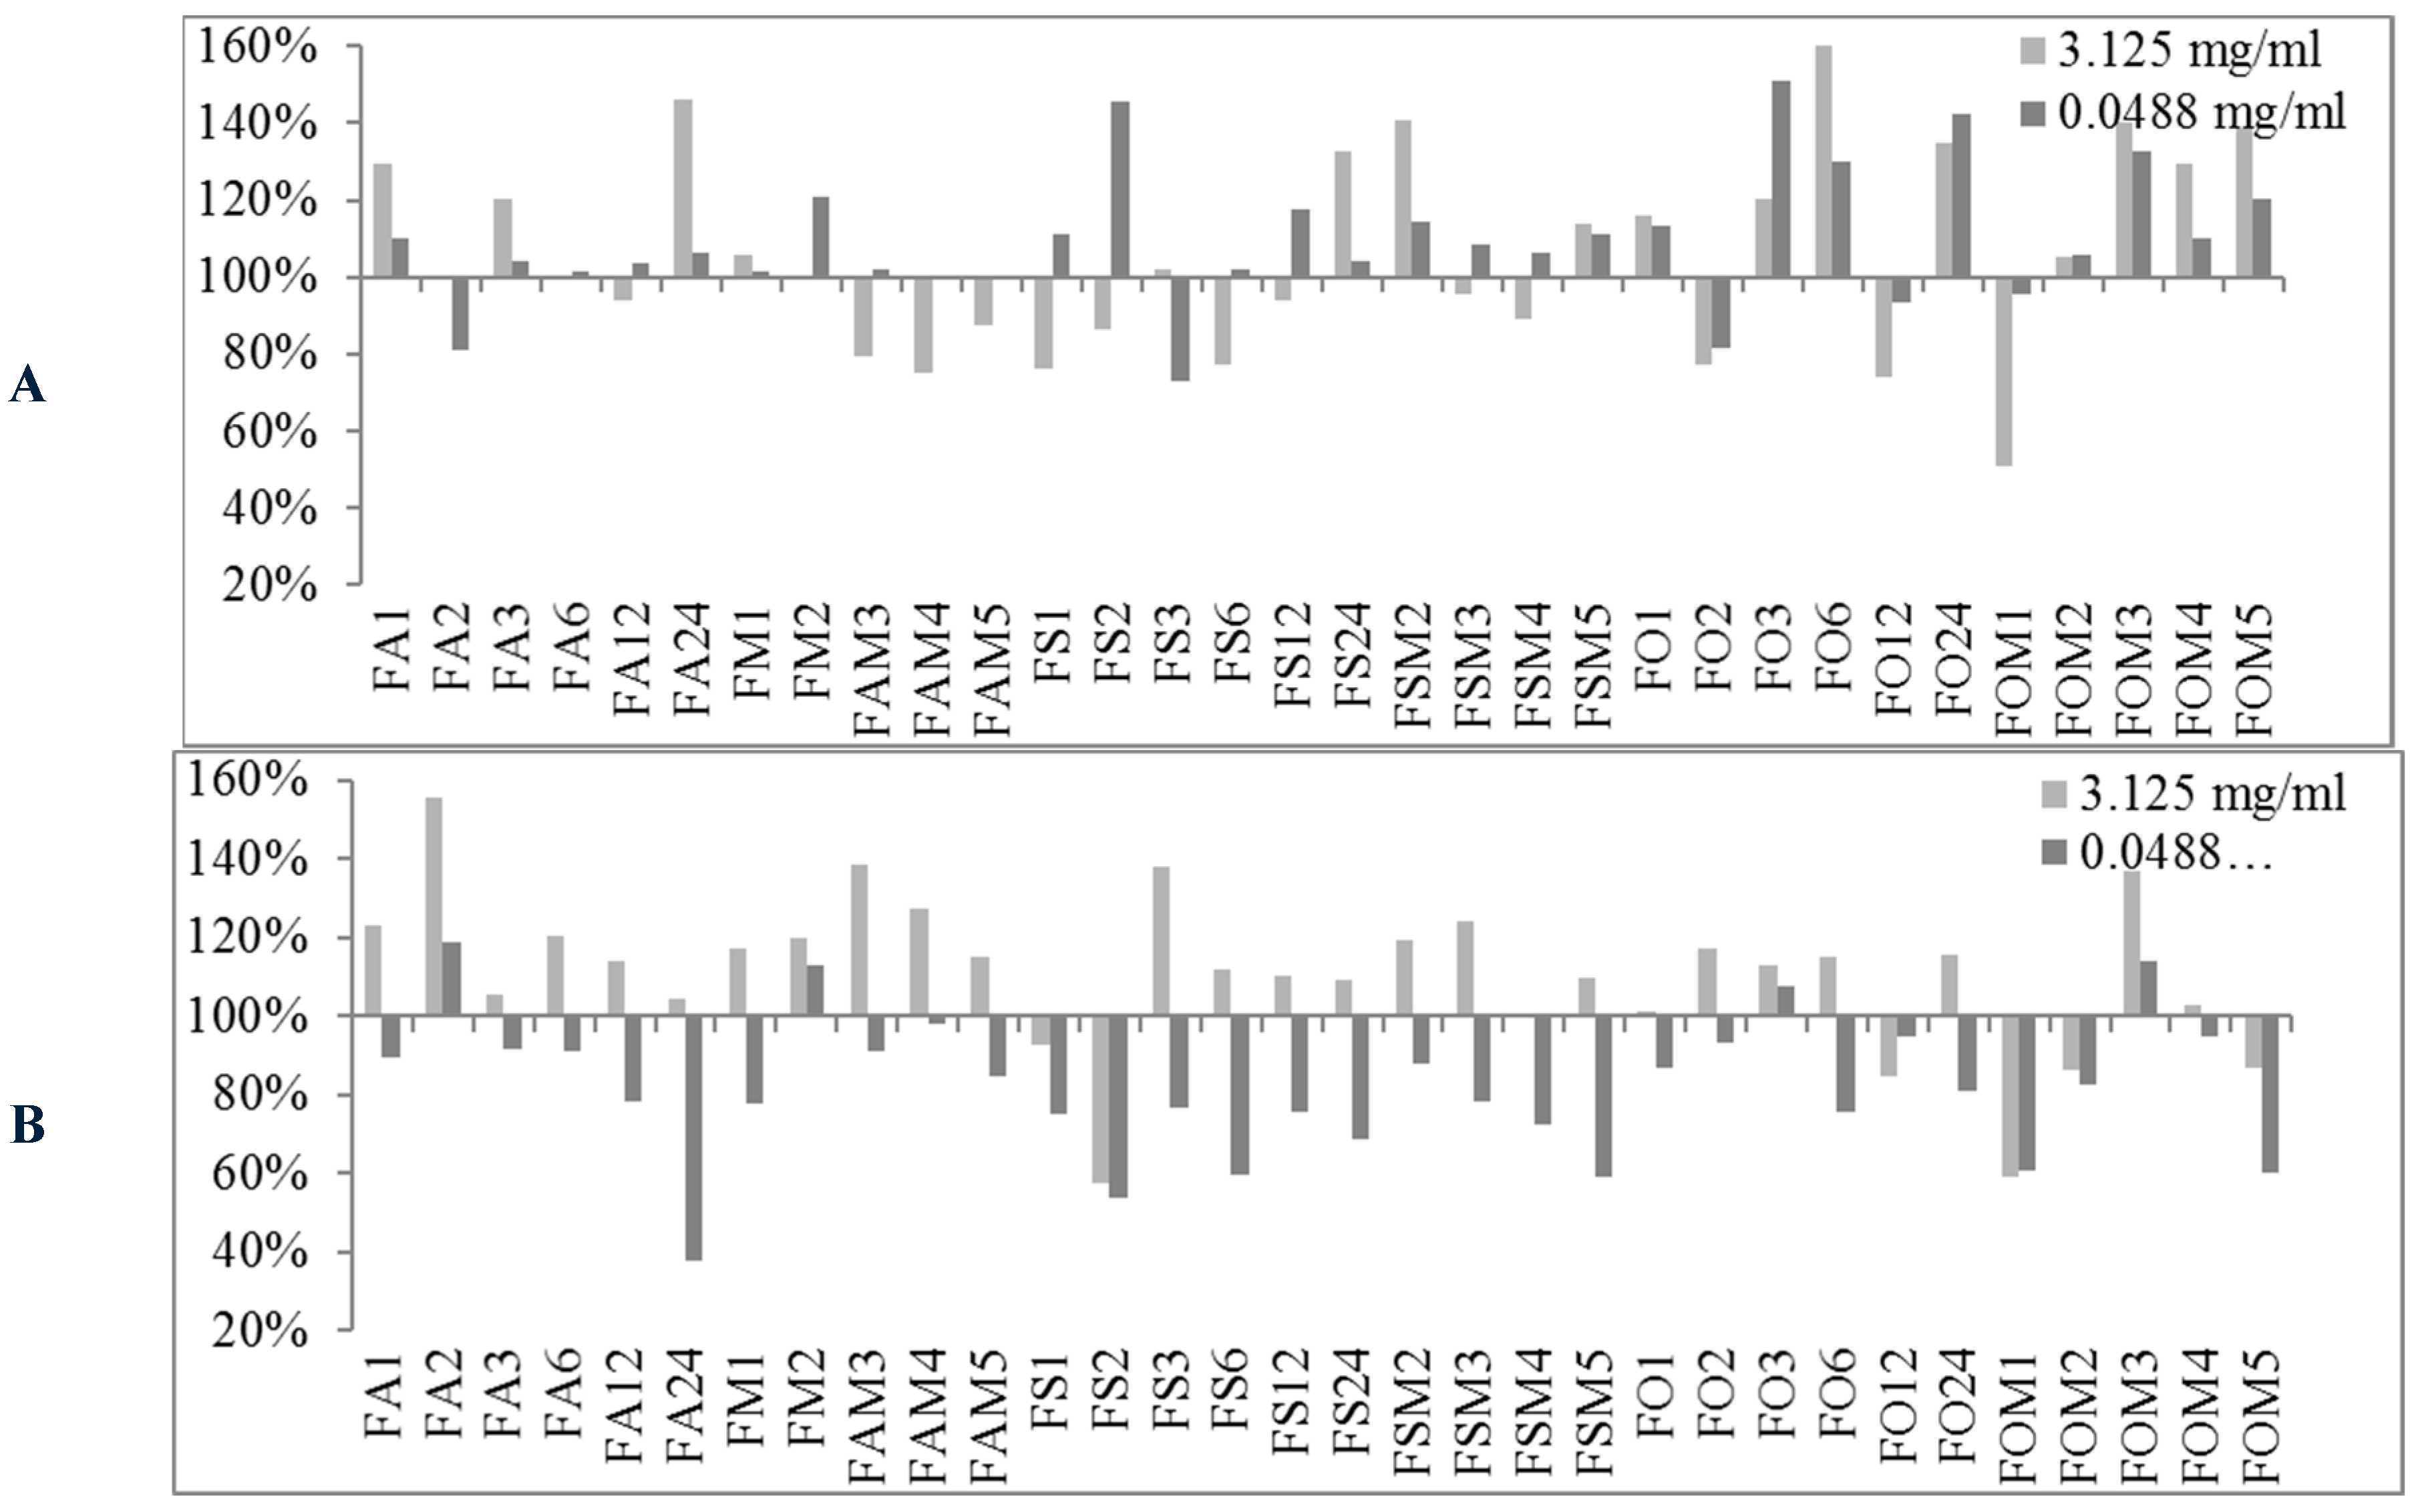
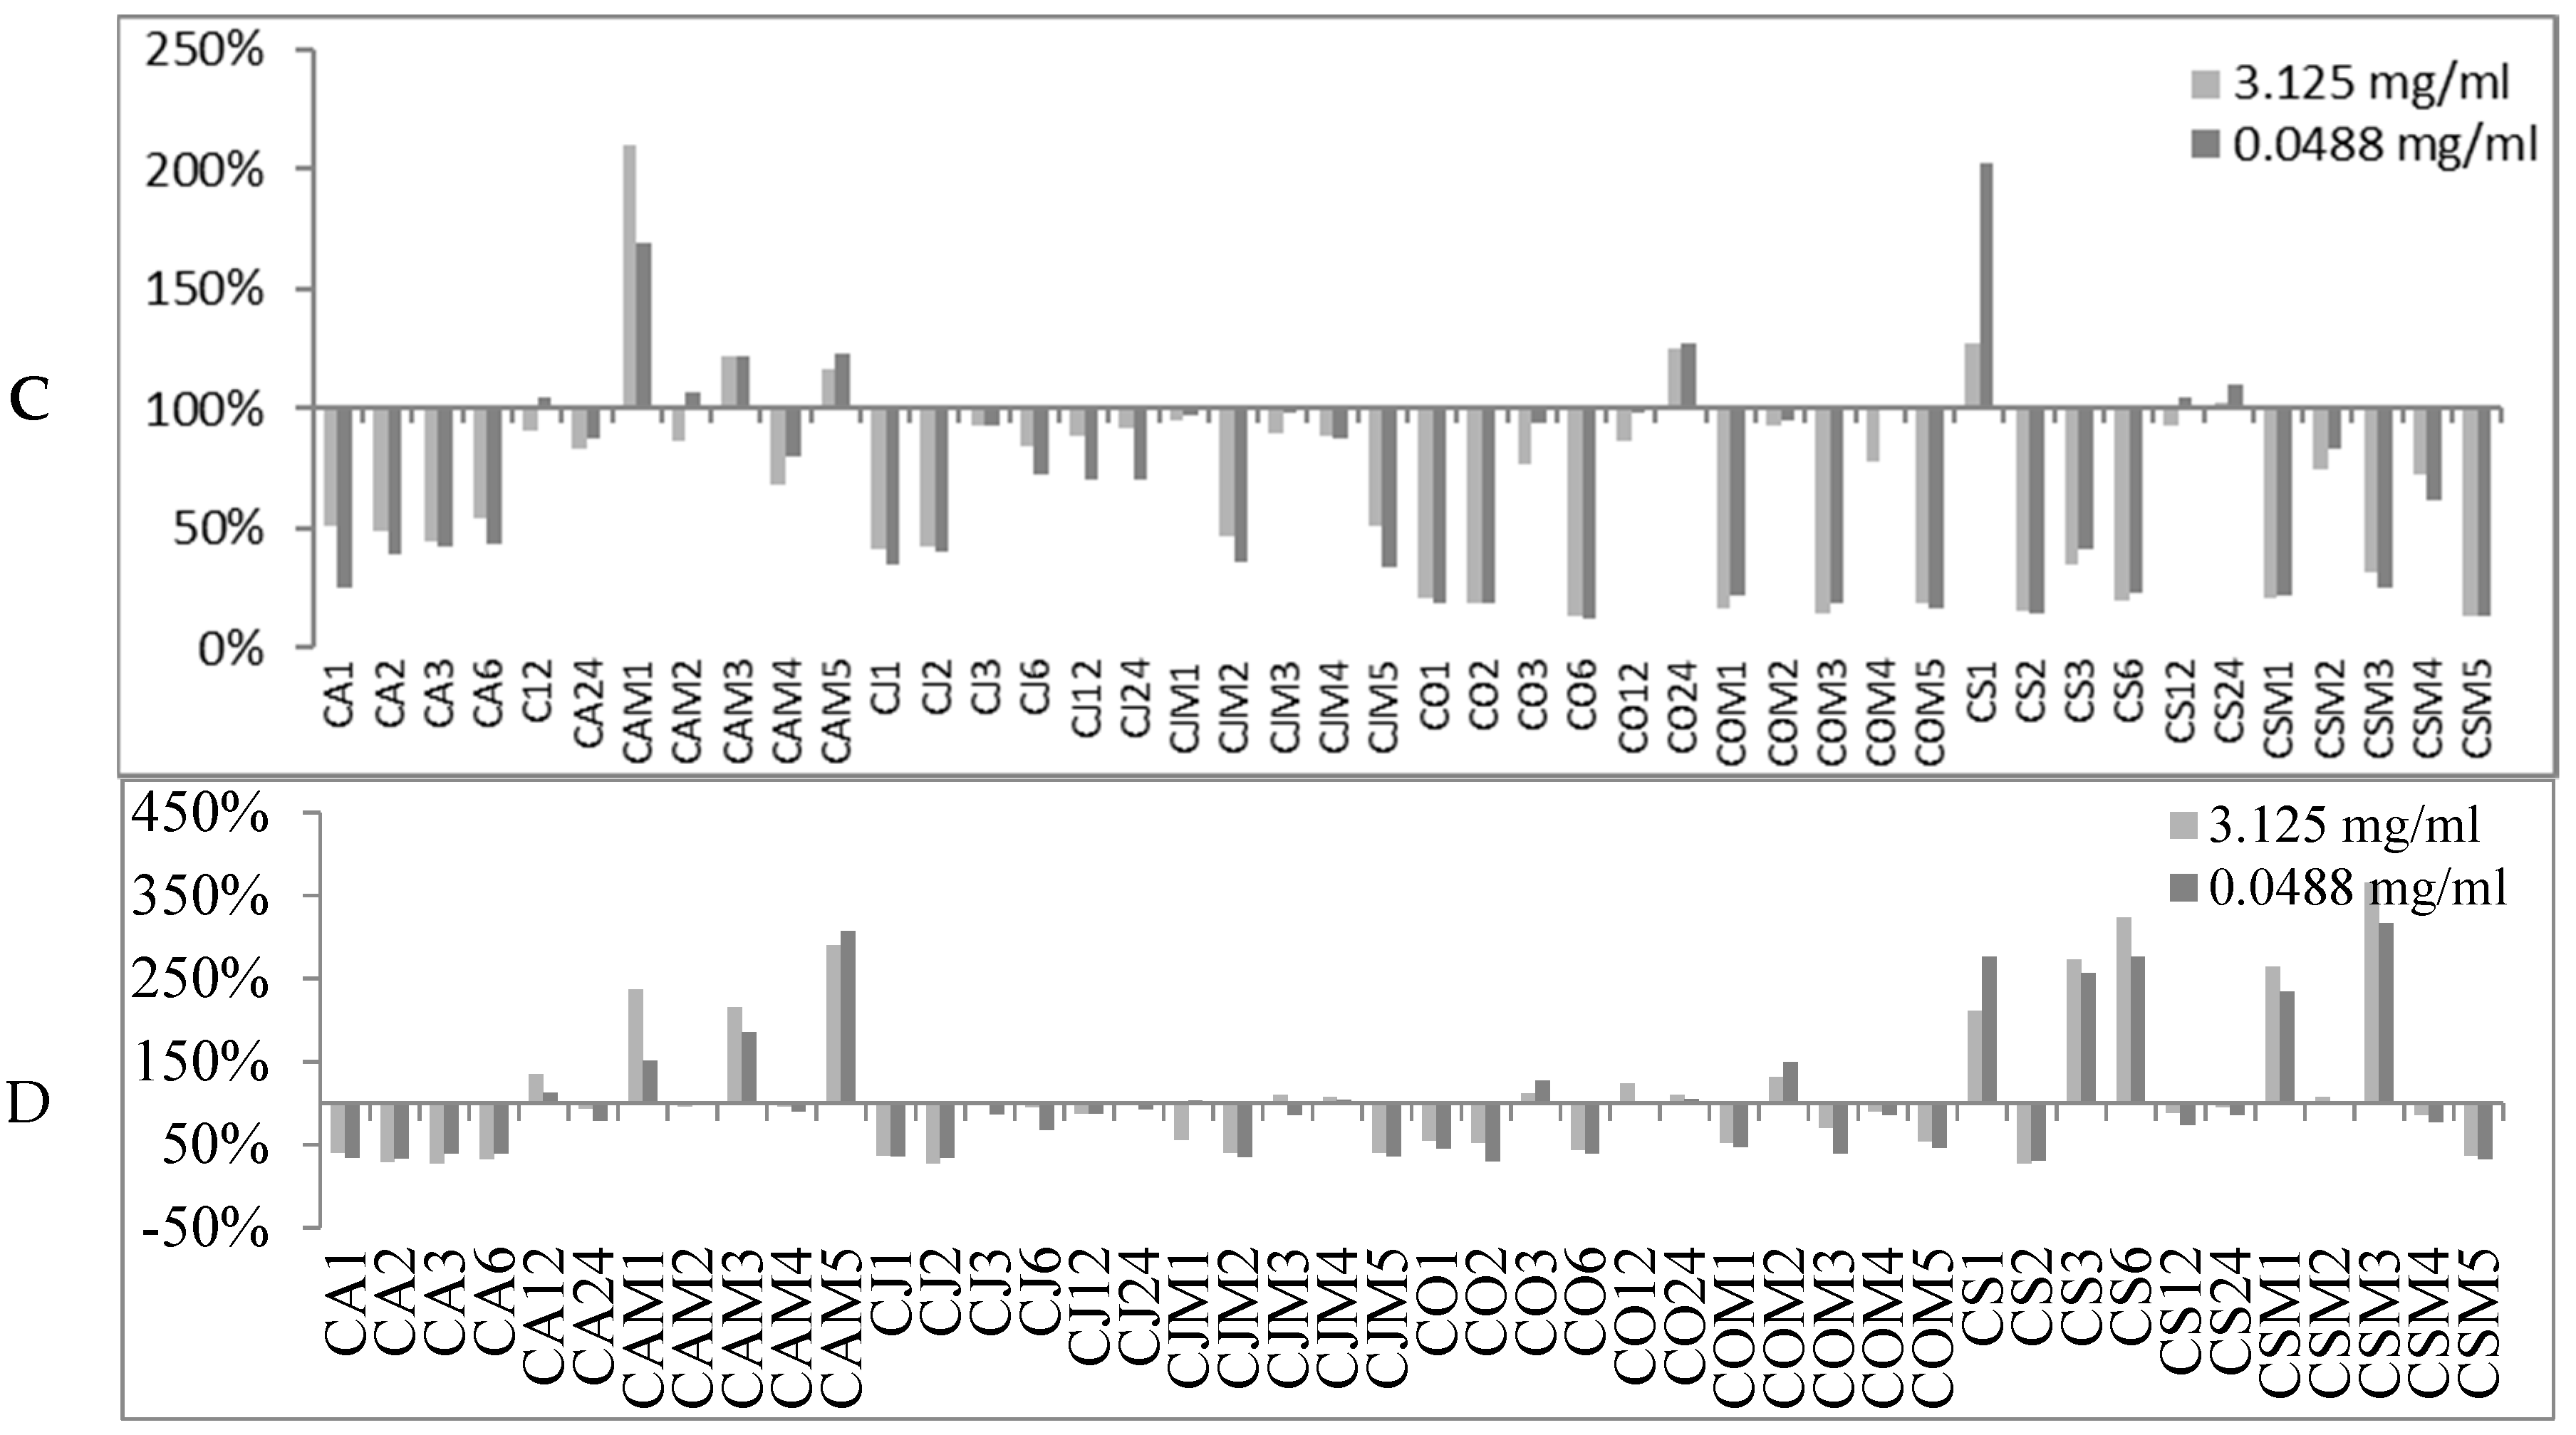
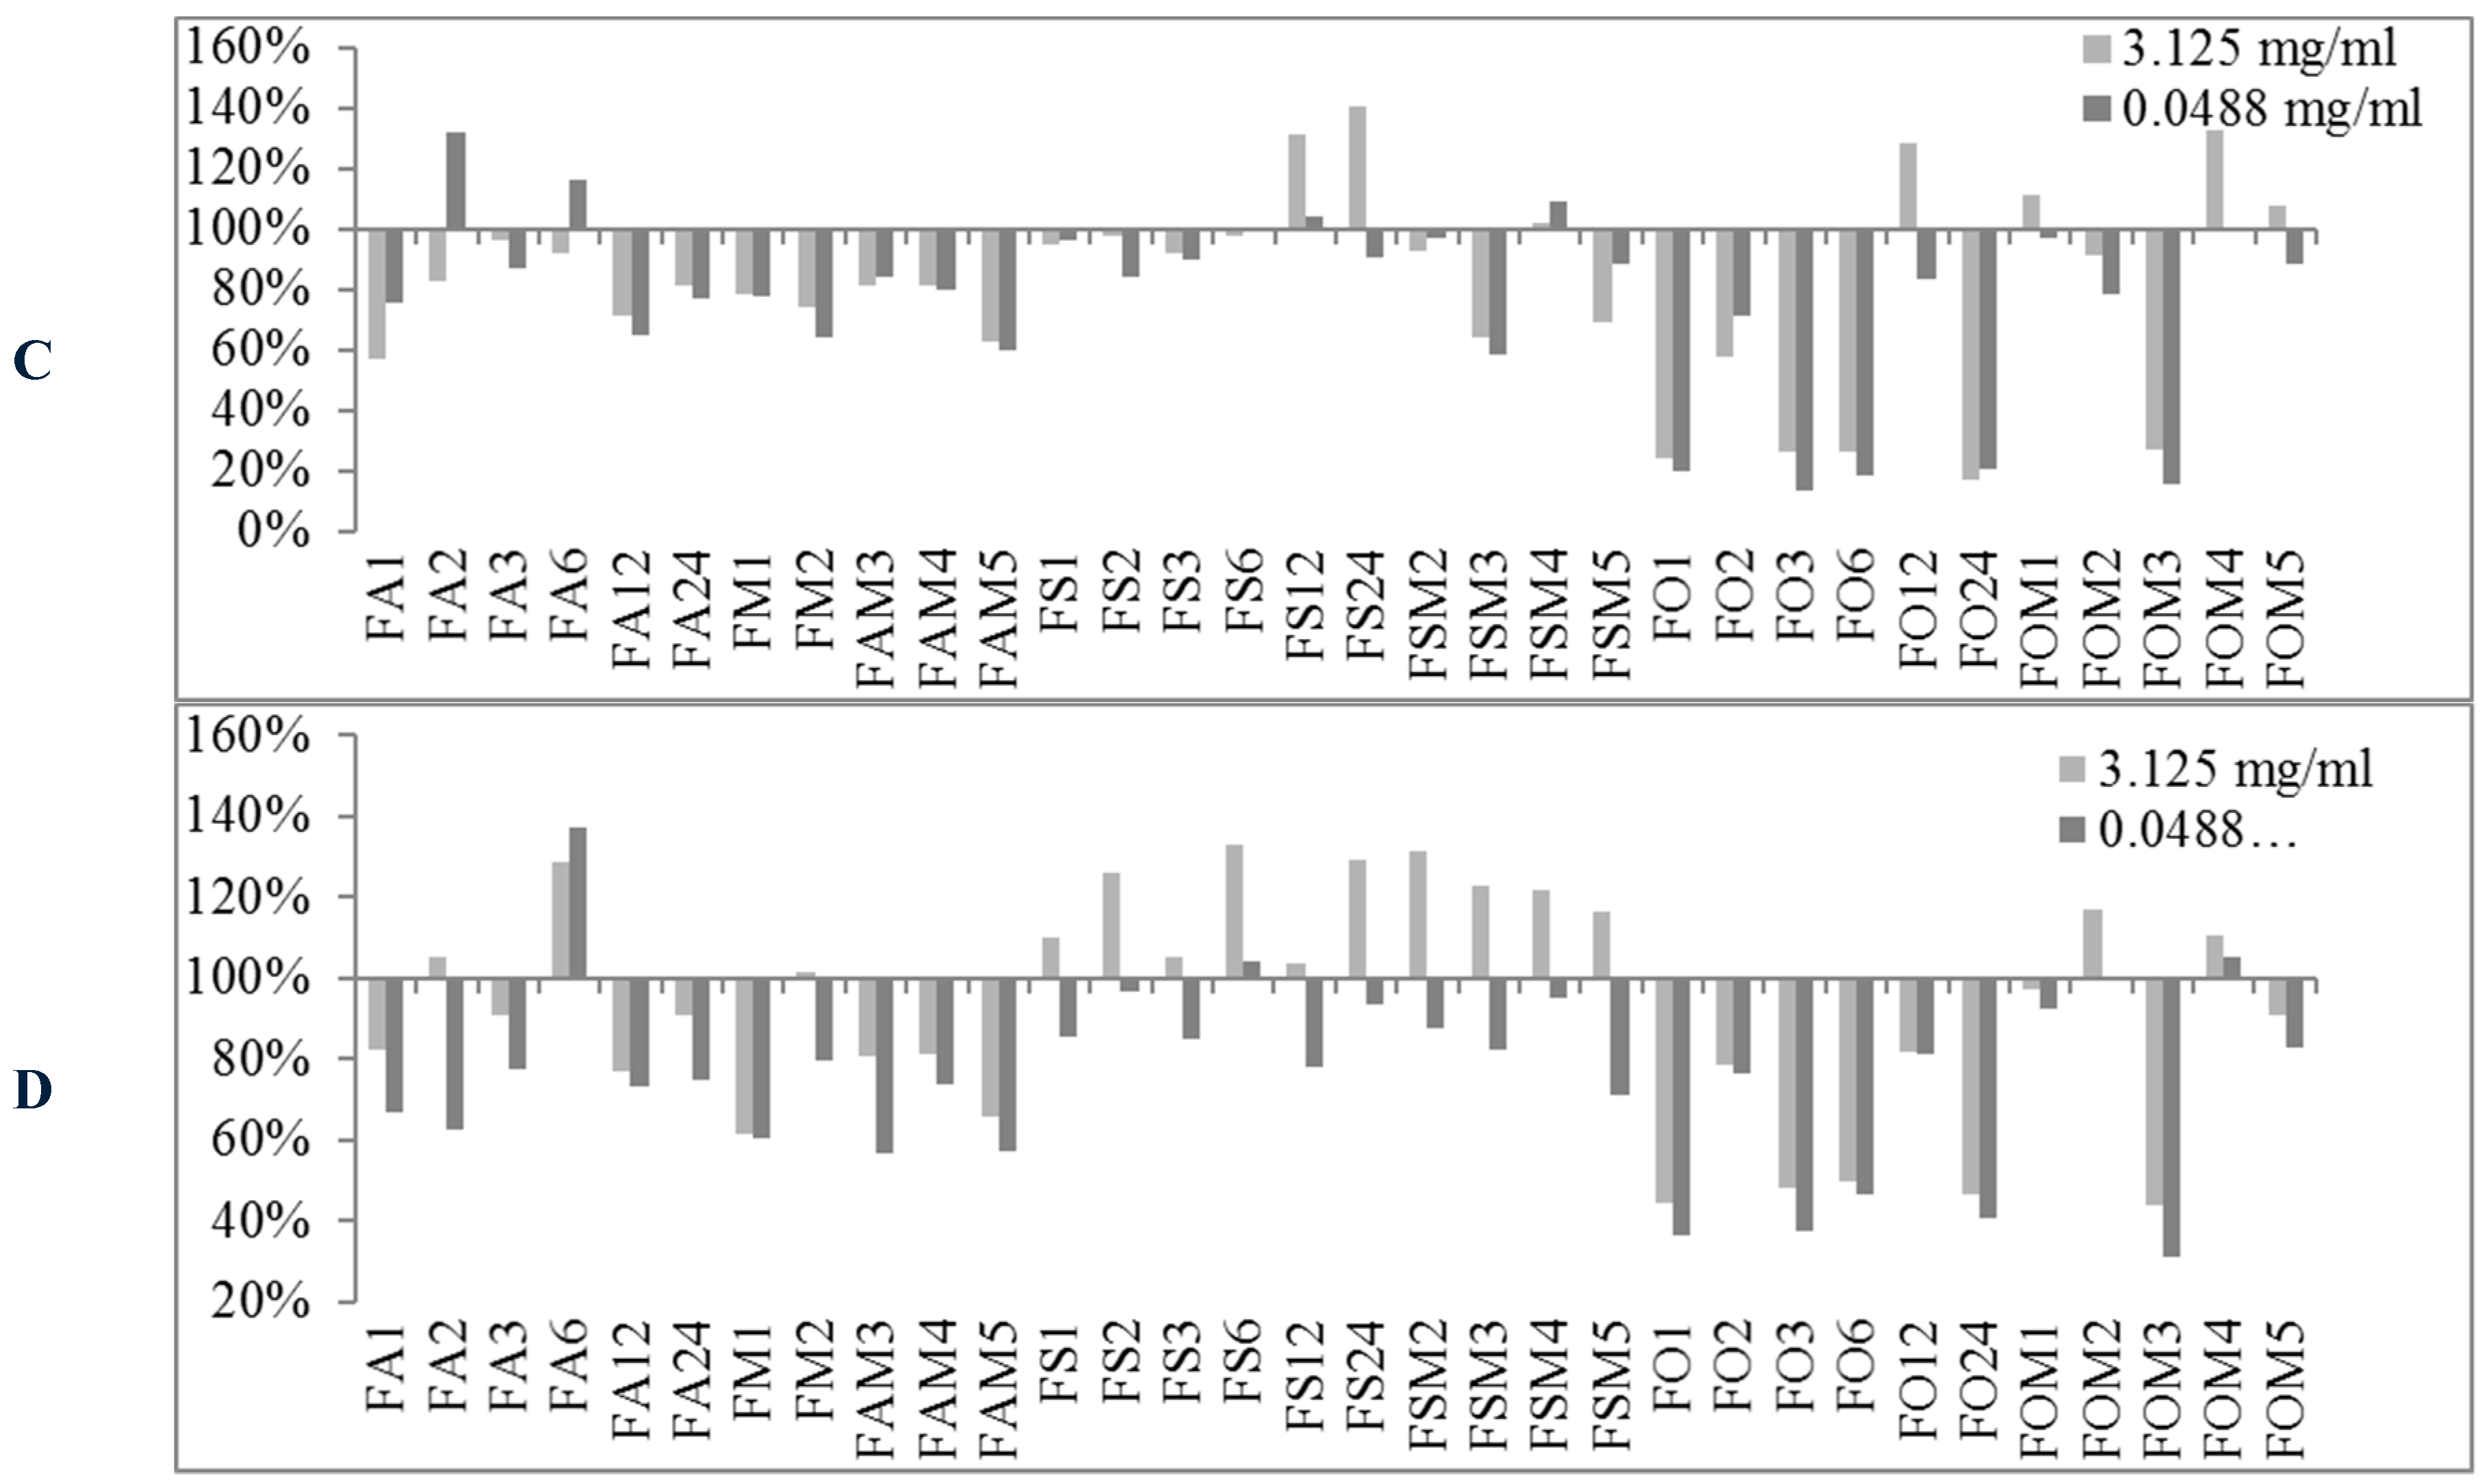
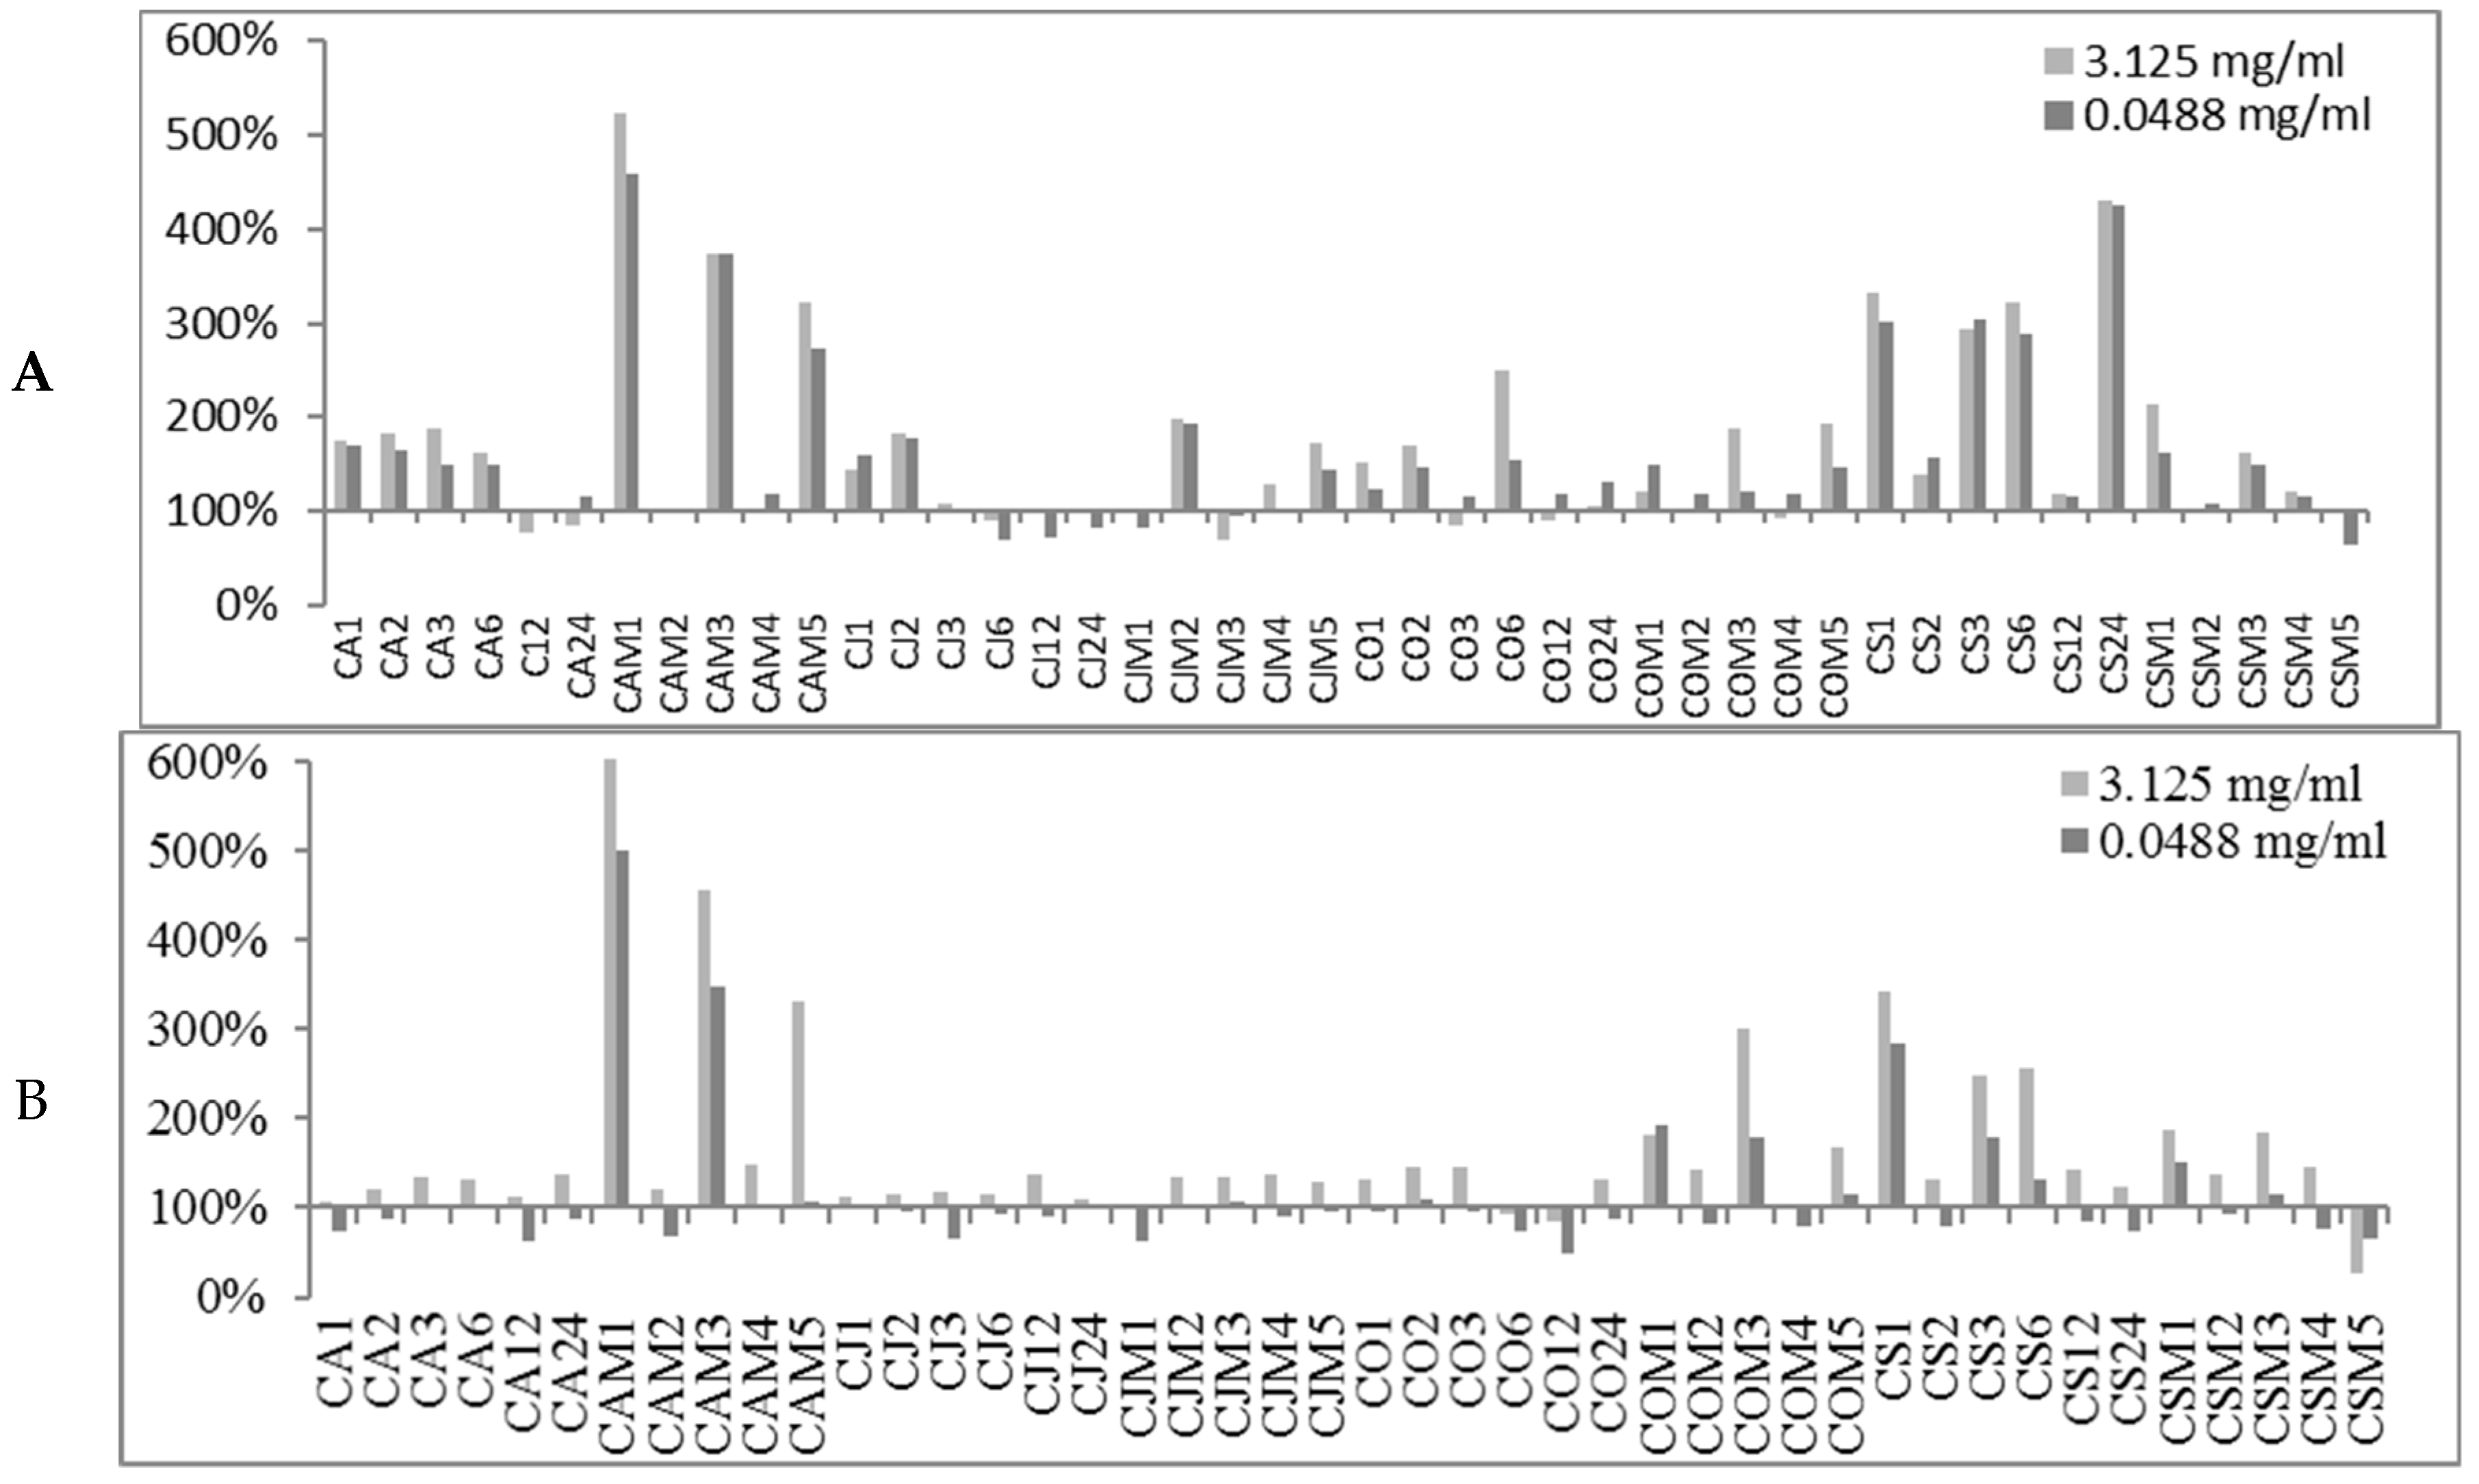
2.2. Biofilm Production Modulation by EOs at Selected Fixed Concentrations
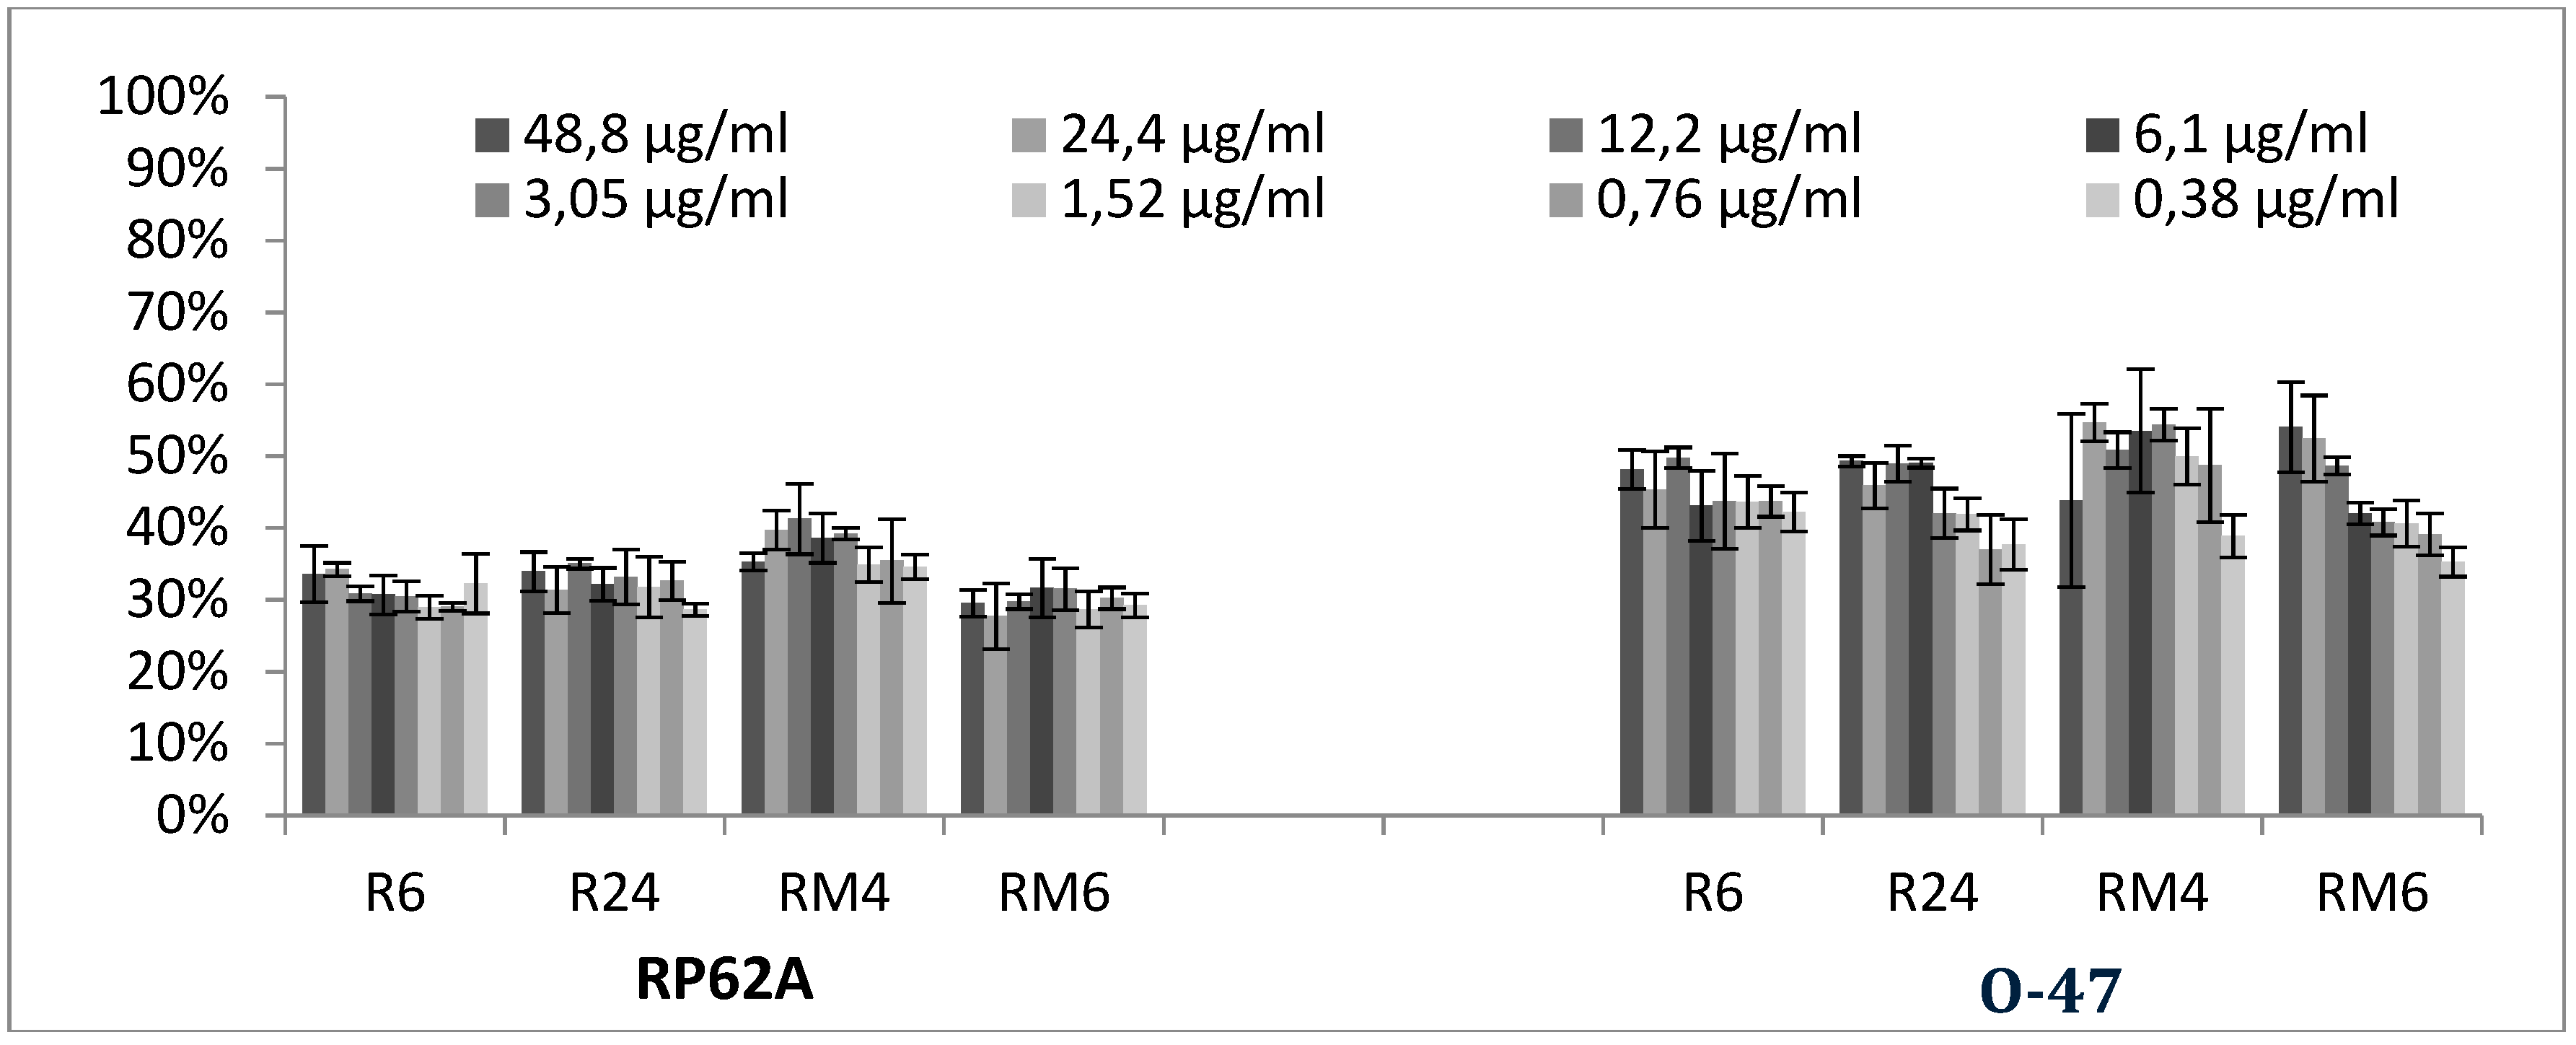
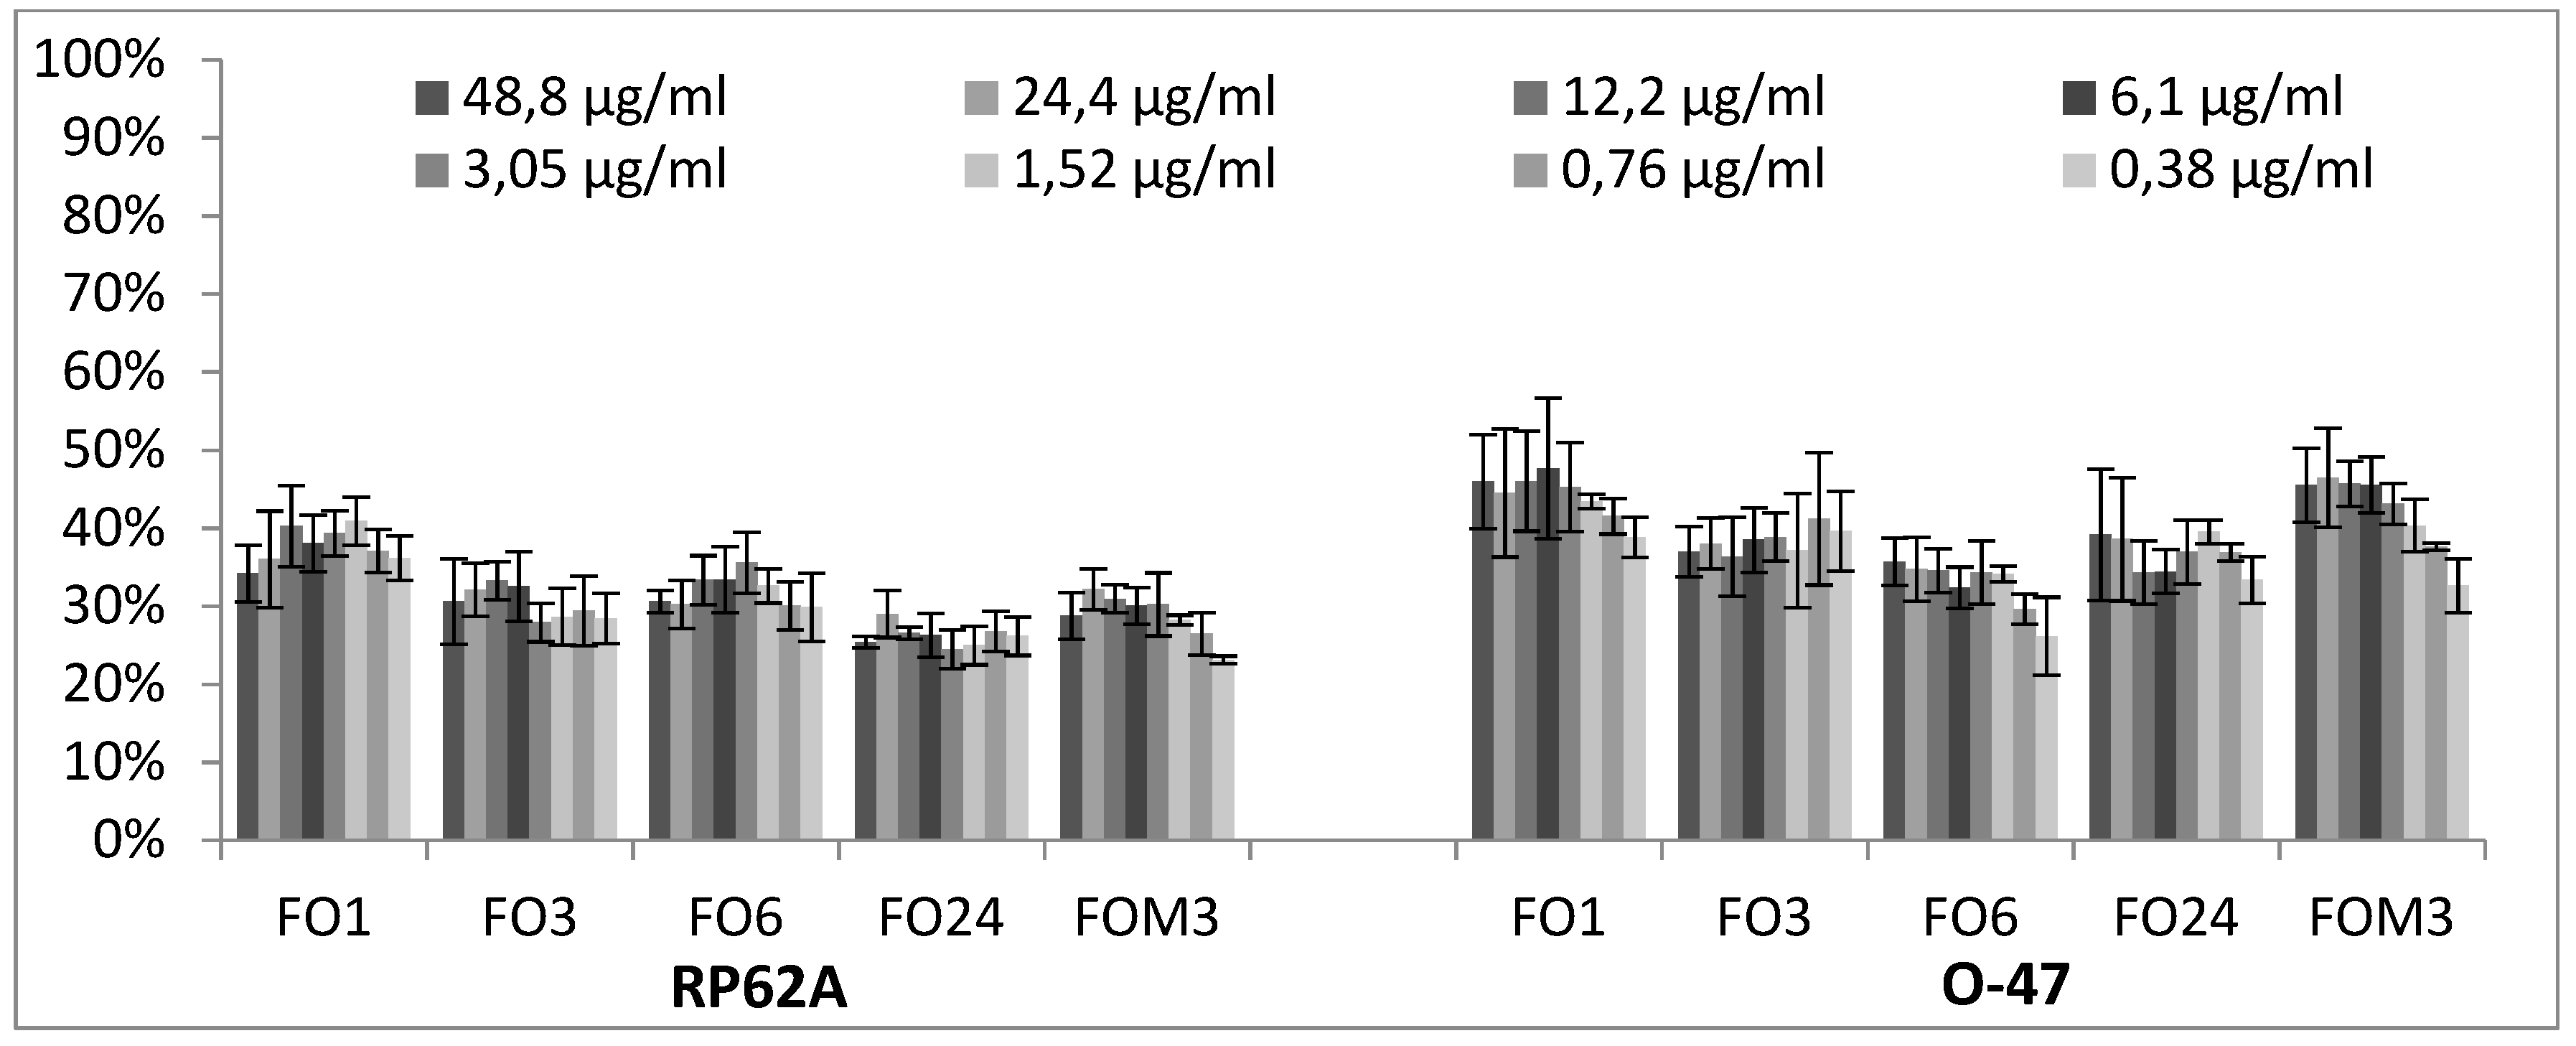
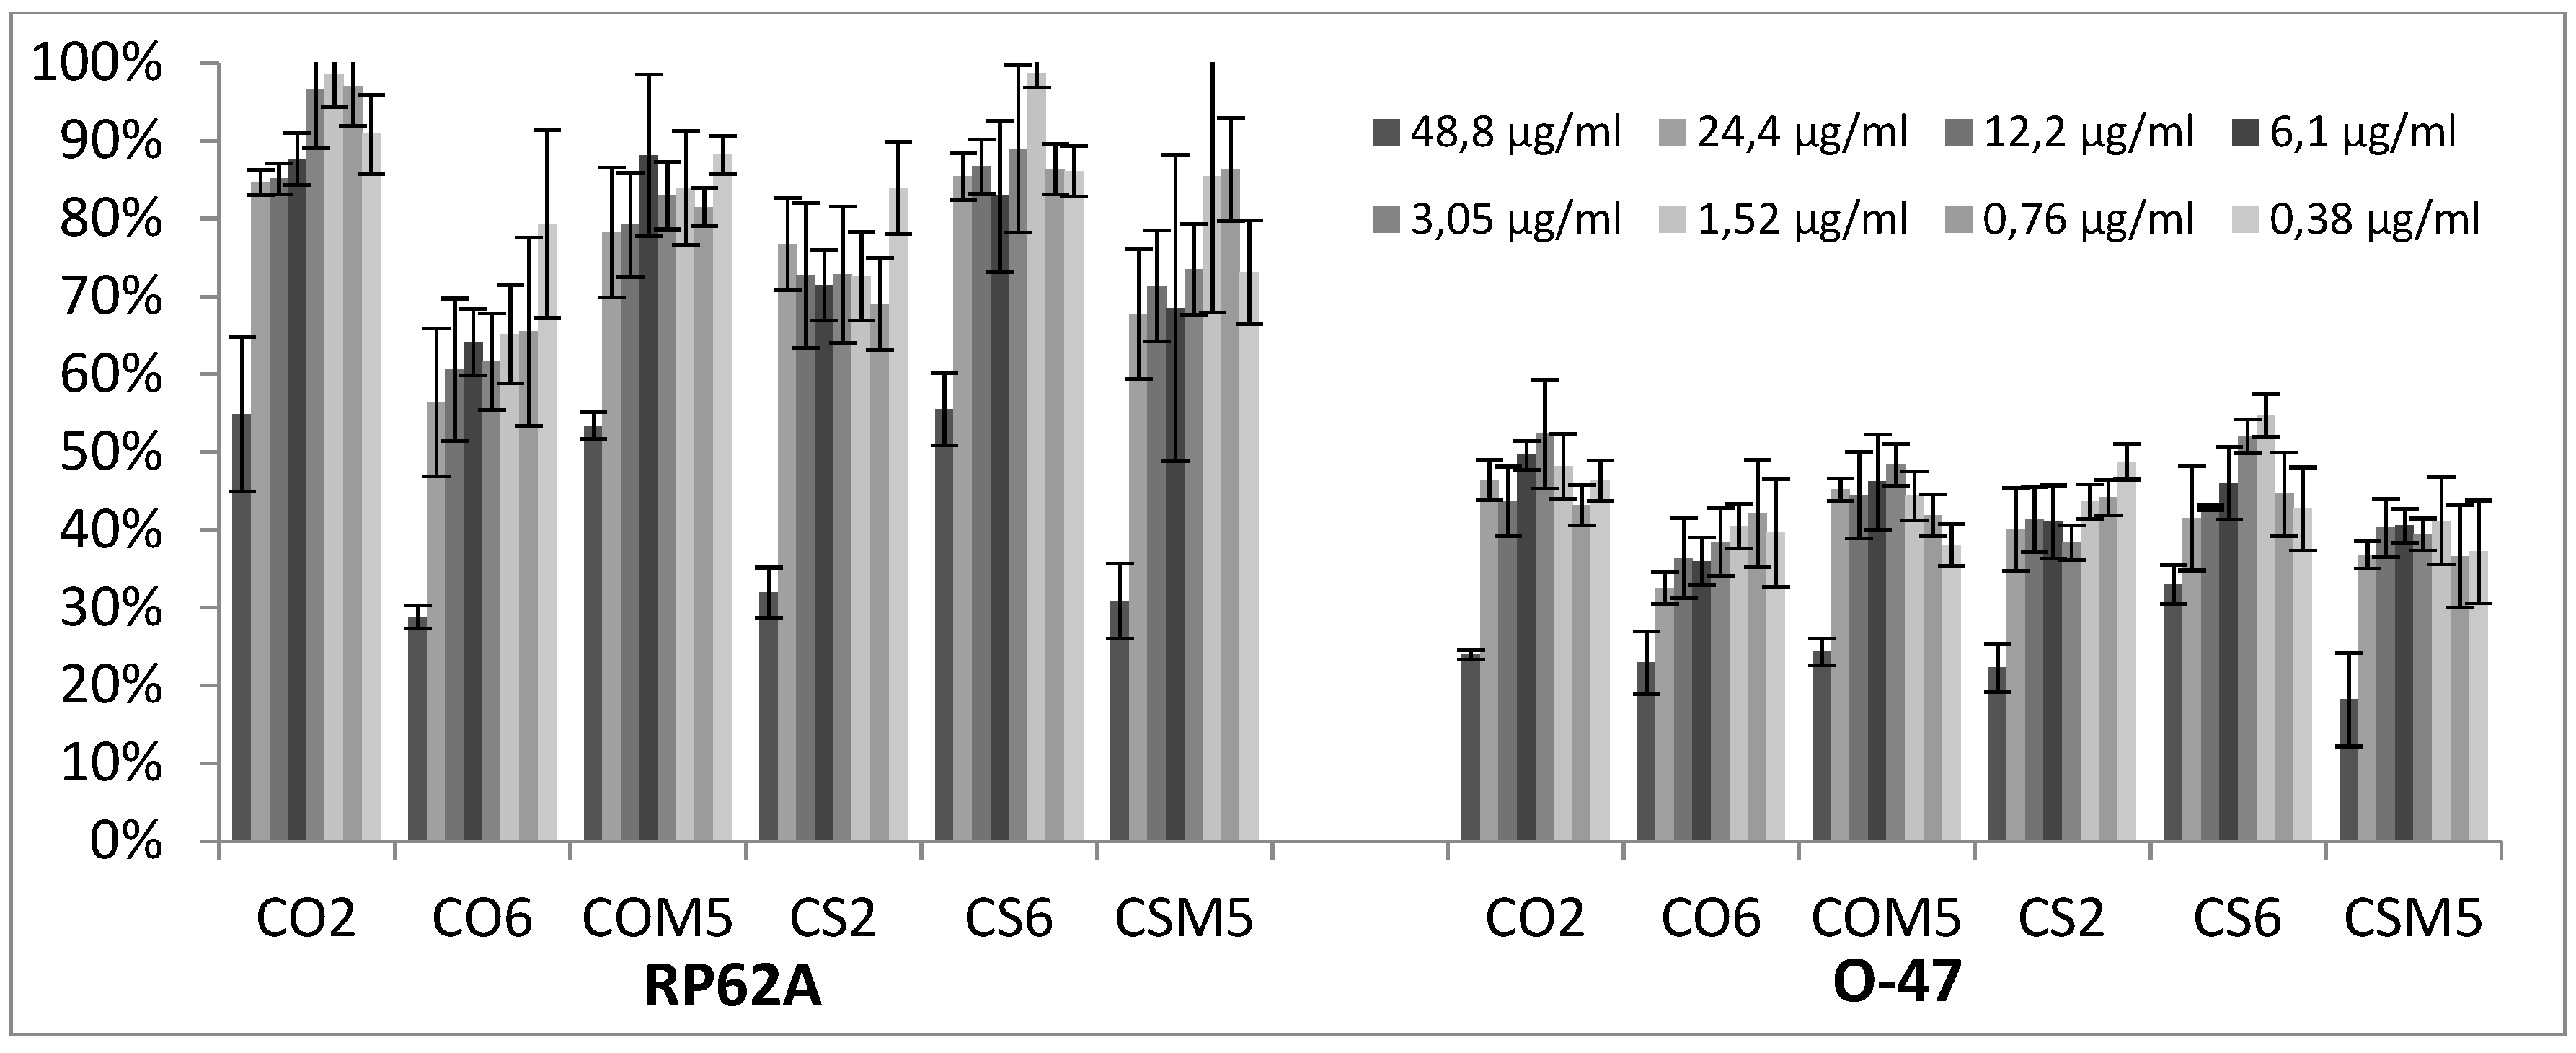
2.3. Quantitative Analysis of Selected EOs against Different Strains of S. epidermidis
2.4. Application of Machine Learning Algorithms
2.4.1. PCA Analysis of Datasets
2.4.2. Binary Classification Models
General Results
Binary Classification Model for 6538P Biofilm Production Activation
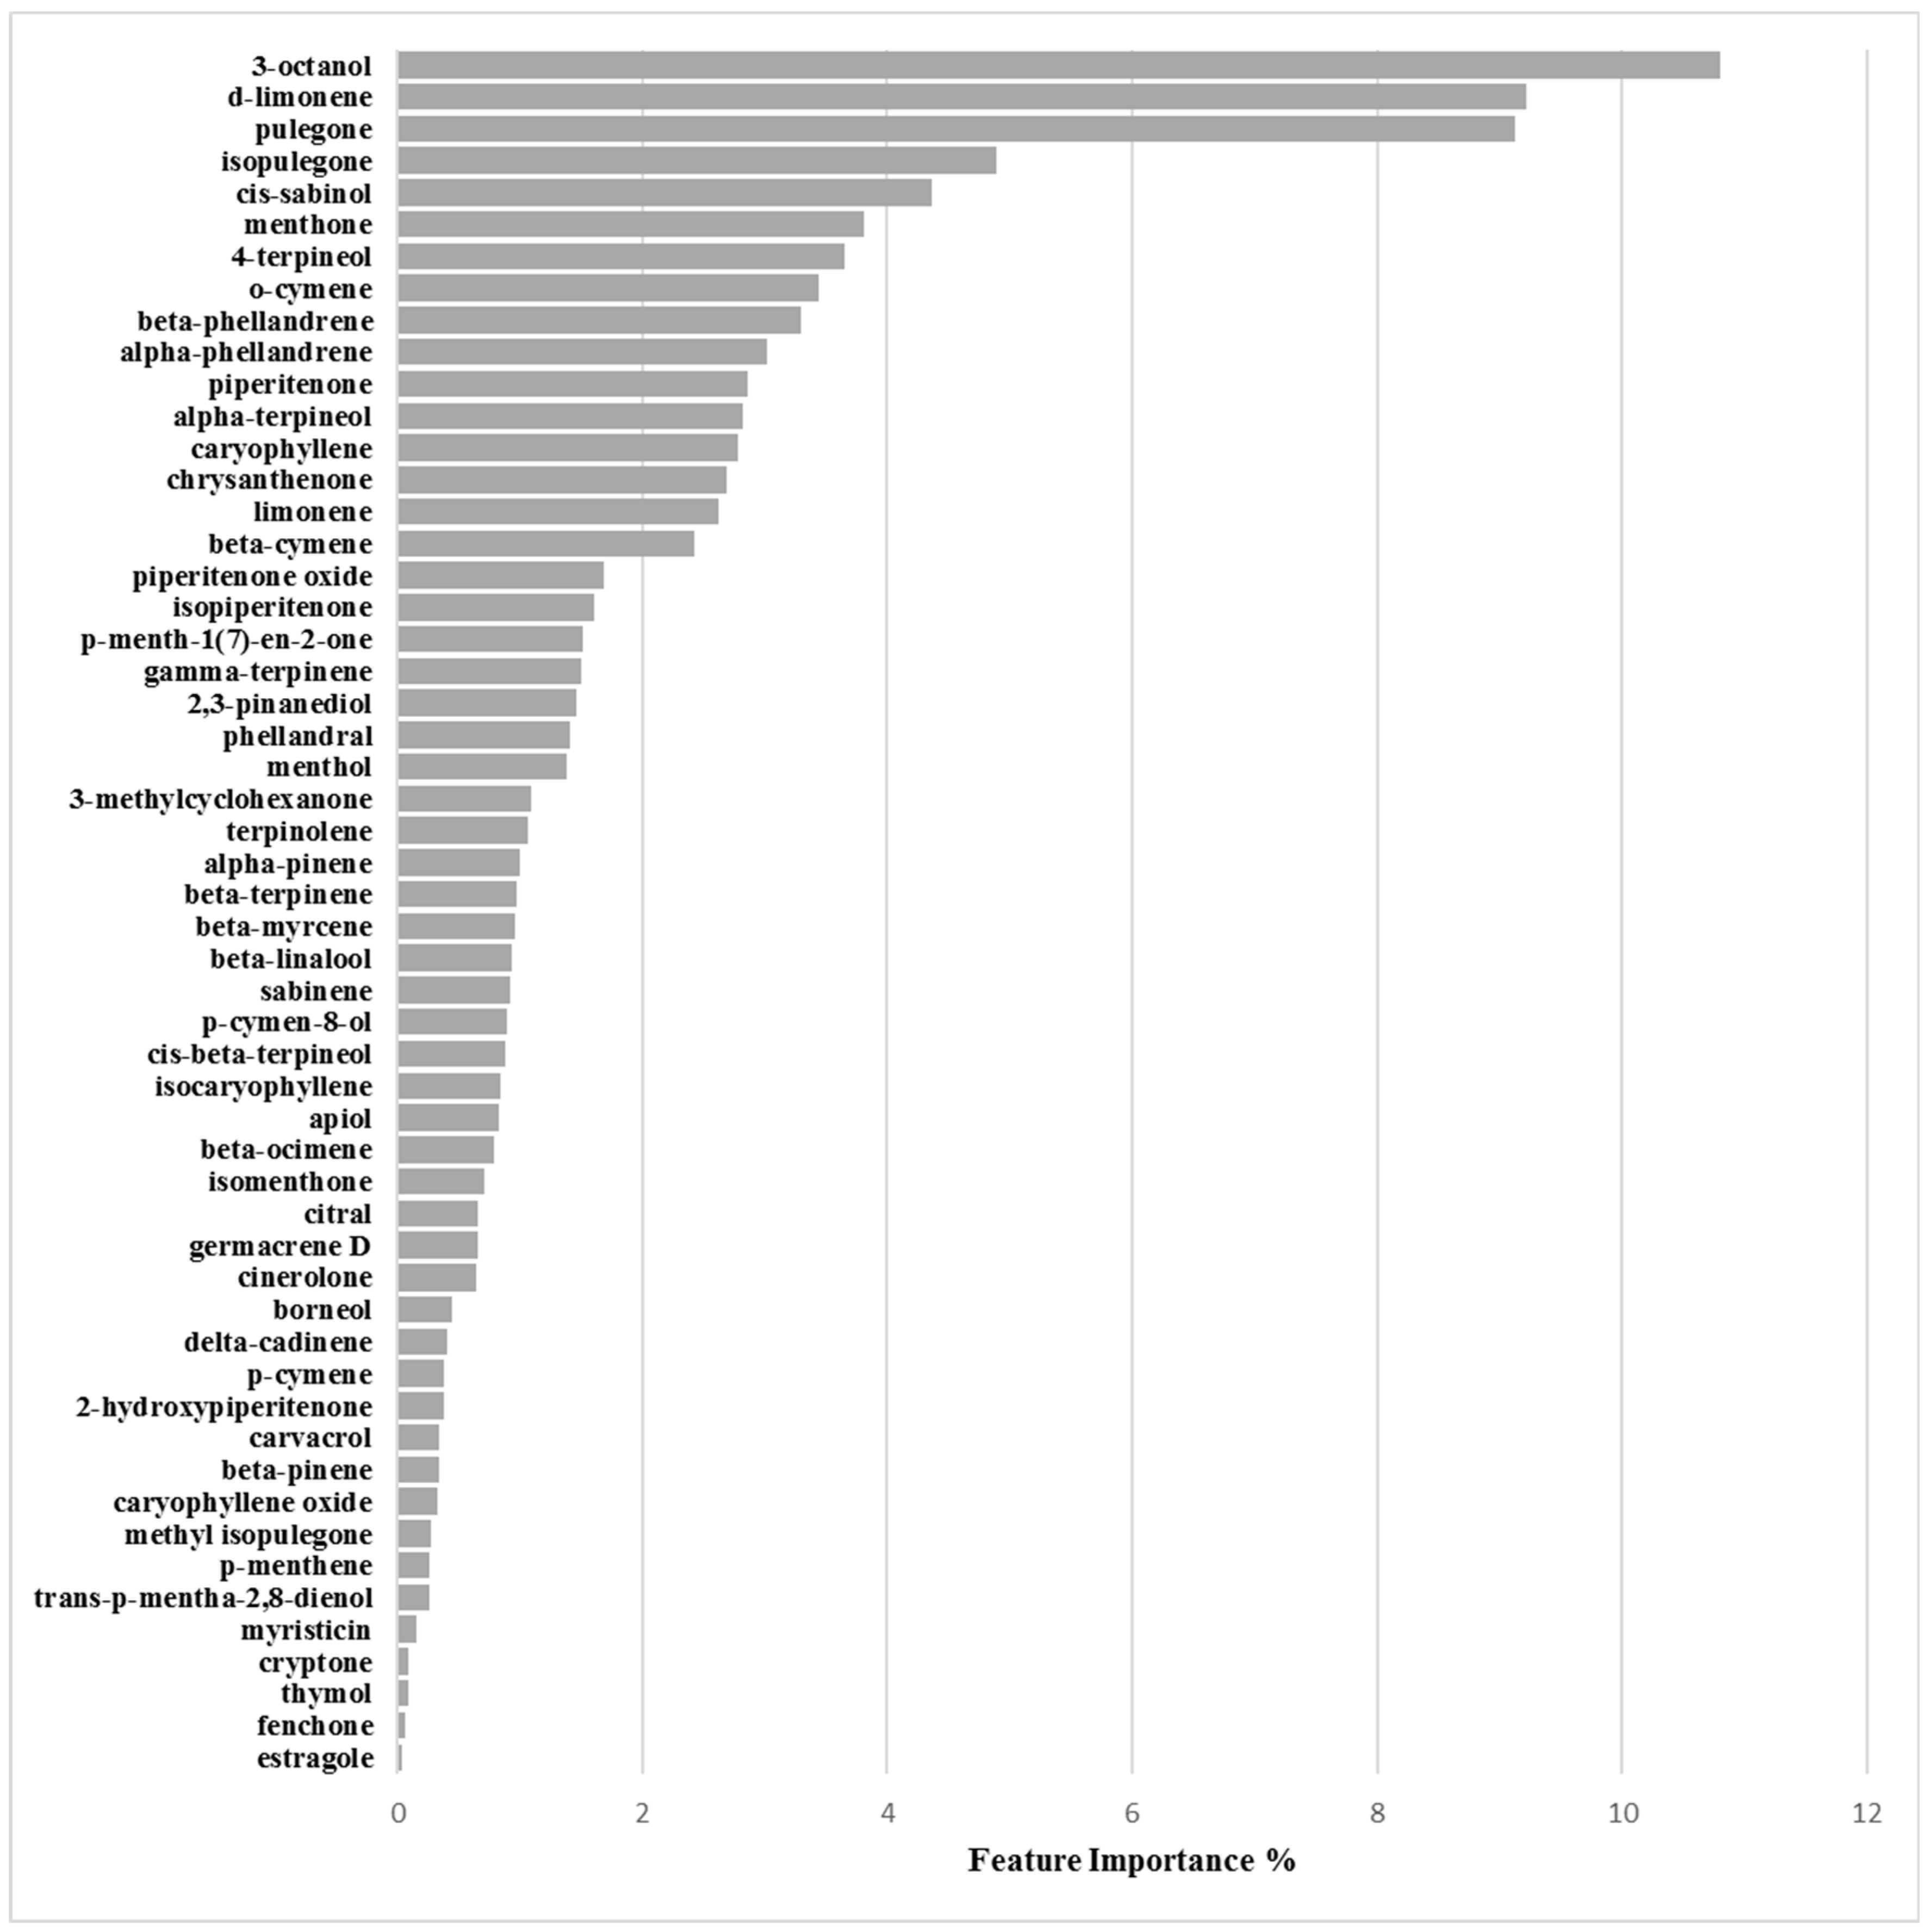
Binary Classification Model for RP62A biofilm production inhibition
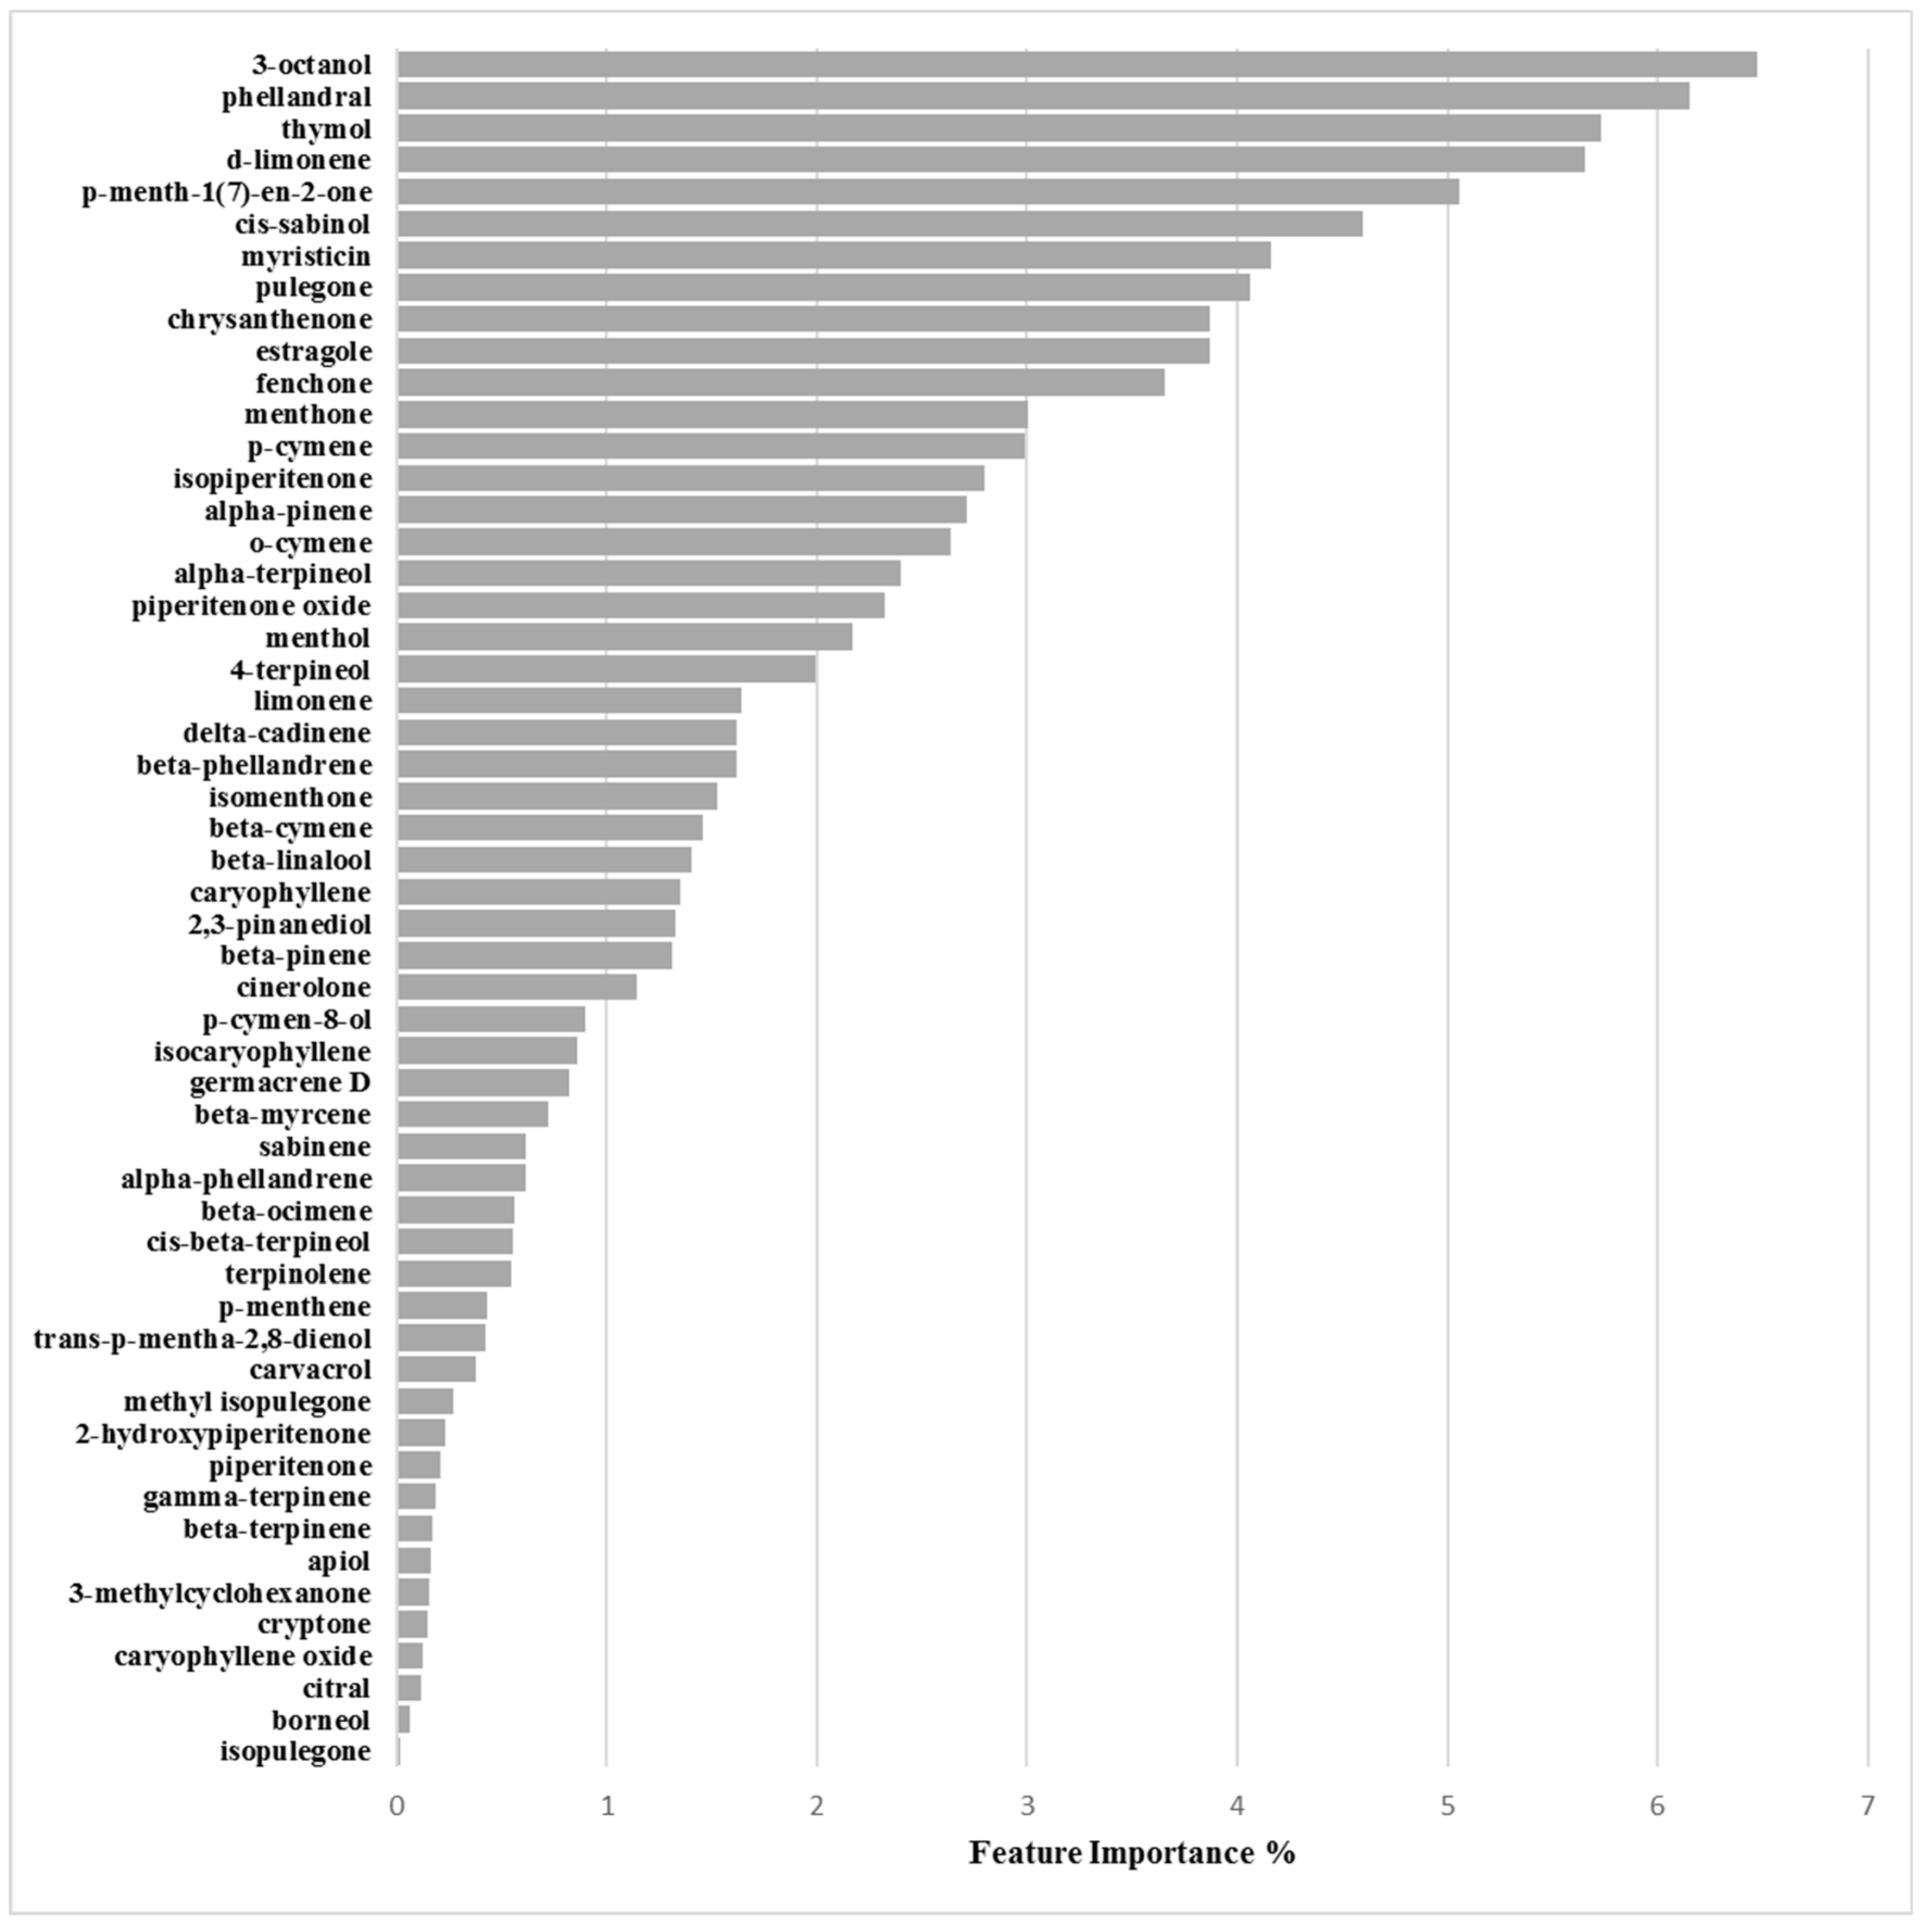
Binary Classification Model for O-47 Biofilm Production Inhibition
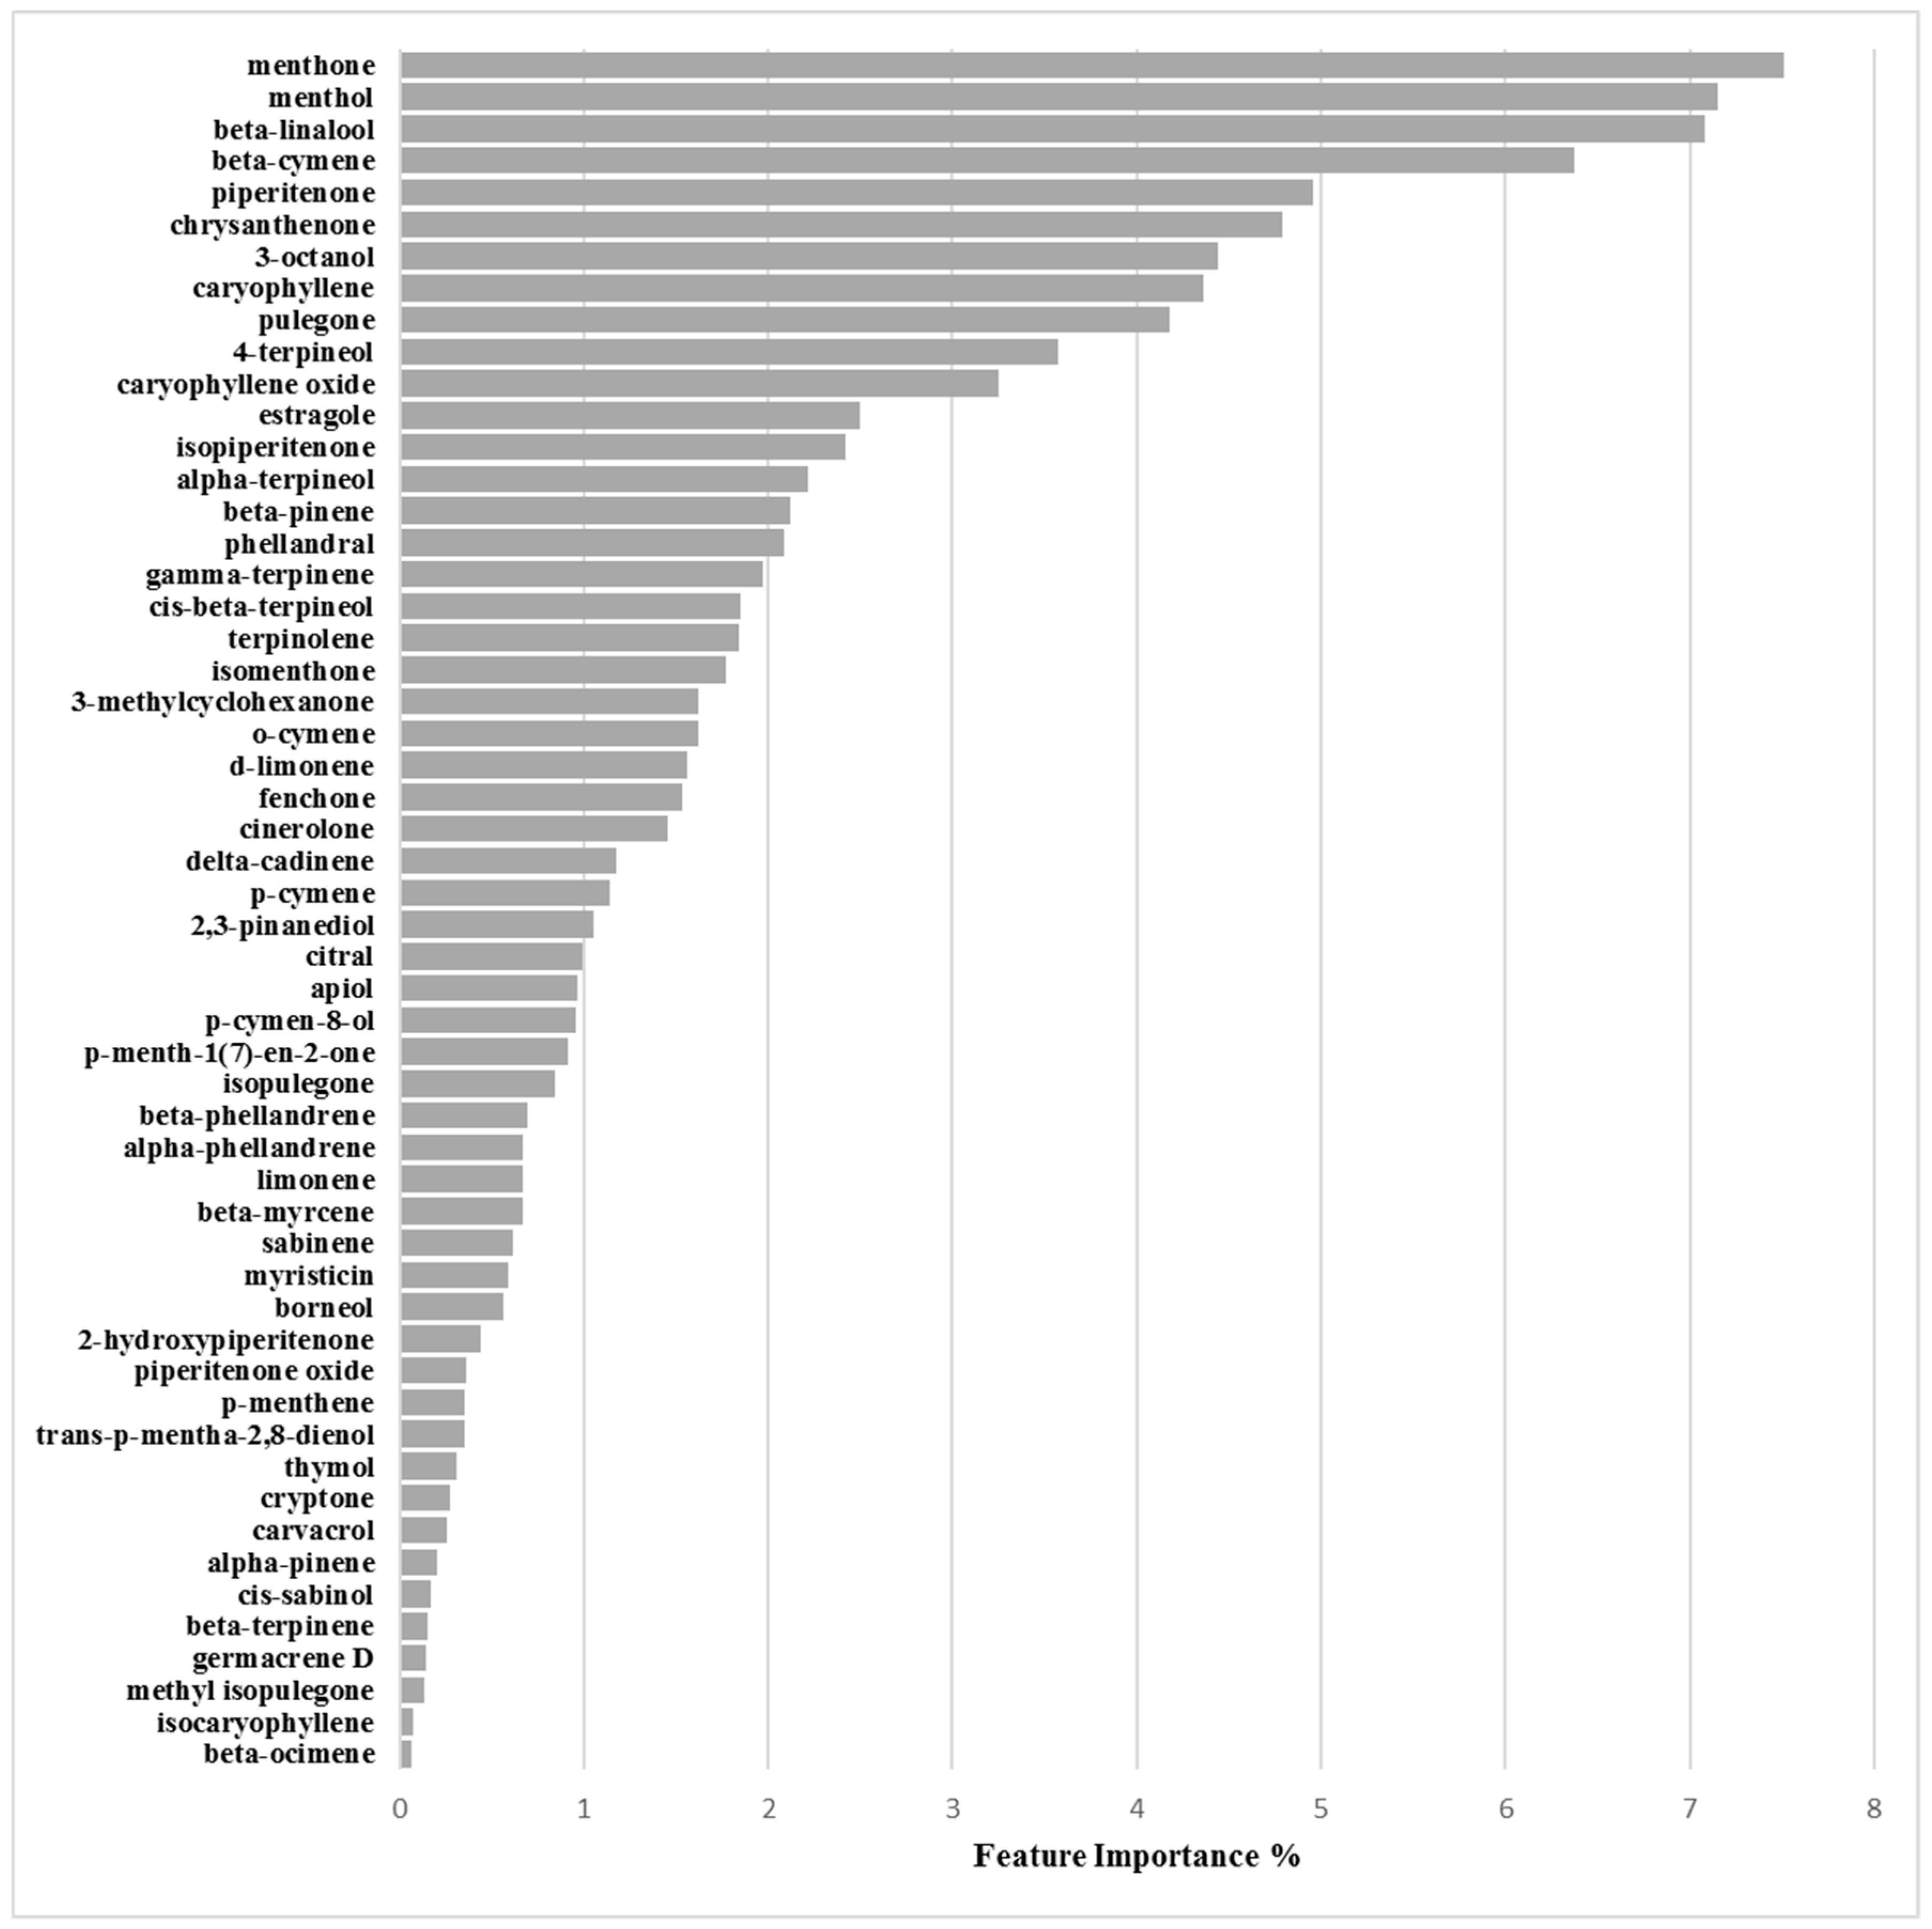
Binary Classification Model for 25923 Biofilm Production Activation
3. Discussion and Conclusions
3.1. EOs Biofilm Bioactivity General Consideration
3.1.1. Bioactivity of RSEOs
3.1.2. Bioactivity of FVEOs
3.1.3. Bioactivity of CGEOs
3.2. Machine Learning Classification Models
3.2.1. Biofilm Activation ML Model on 6538P
3.2.2. Biofilm Activation ML Model on 25923
3.2.3. Biofilm Inhibition ML Model on RP62A
3.2.4. Biofilm Inhibition ML Model on O-47
3.2.5. General Consideration on ML Models
4. Materials and Methods
4.1. Essential oil and Chemical Composition Analysis
4.2. Bacterial Strains and Culture Conditions
4.3. Determination of Minimal Inhibitory Concentration (MIC)
4.4. Biofilm Production Assay
4.5. Statistical Analysis of Biological Evaluation
4.6. Machine Learning Binary Classification
4.6.1. General Methods
4.6.2. Classification Models’ Validation
Supplementary Materials
Author Contributions
Funding
Acknowledgments
Conflicts of Interest
References
- Donlan, R.M.; Costerton, J.W. Biofilms: Survival mechanisms of clinically relevant microorganisms. Clin. Microbiol. Rev. 2002, 15, 167–193. [Google Scholar] [CrossRef] [PubMed]
- Da Costa Krewer, C.; Santos Amanso, E.; Veneroni Gouveia, G.; de Lima Souza, R.; da Costa, M.M.; Aparecido Mota, R. Resistance to antimicrobials and biofilm formation in Staphylococcus spp. isolated from bovine mastitis in the Northeast of Brazil. Trop Anim. Health Prod. 2015, 47, 511–518. [Google Scholar] [CrossRef] [PubMed]
- Furuya, E.Y.; Lowy, F.D. Antimicrobial-resistant bacteria in the community setting. Nat. Rev. Microbiol. 2006, 4, 36–45. [Google Scholar] [CrossRef] [PubMed]
- Satpathy, S.; Sen, S.K.; Pattanaik, S.; Raut, S. Review on bacterial biofilm: An universal cause of contamination. Biocatal. Agric. Biotech. 2016, 7, 56–66. [Google Scholar] [CrossRef]
- Koo, H.; Allan, R.N.; Howlin, R.P.; Stoodley, P.; Hall-Stoodley, L. Targeting microbial biofilms: Current and prospective therapeutic strategies. Nat. Rev. Microbiol. 2017, 15, 740–755. [Google Scholar] [CrossRef] [PubMed]
- Otto, M. Staphylococcal biofilms. Curr. Top Microbiol. Immunol. 2008, 322, 207–228. [Google Scholar] [PubMed]
- Li, Z. A review of Staphylococcus aureus and the emergence of drug-resistant problem. Adv. Microbiol. 2018, 8, 65–76. [Google Scholar] [CrossRef]
- Nicholson, T.L.; Shore, S.M.; Smith, T.C.; Frana, T.S. Livestock-associated methicillin-resistant Staphylococcus aureus (LA-MRSA) isolates of swine origin form robust biofilms. PLoS ONE 2013, 8, e73376. [Google Scholar] [CrossRef]
- Dohar, J.E.; Hebda, P.A.; Veeh, R.; Awad, M.; Costerton, J.W.; Hayes, J.; Ehrlich, G.D. Mucosal biofilm formation on middle-ear mucosa in a nonhuman primate model of chronic suppurative otitis media. Laryngoscope 2005, 115, 1469–1472. [Google Scholar] [CrossRef] [PubMed]
- Rogers, K.L.; Fey, P.D.; Rupp, M.E. Coagulase-negative staphylococcal infections. Infect. Dis. Clin. North Am. 2009, 23, 73–98. [Google Scholar] [CrossRef] [PubMed]
- Wang, Z.; Bai, H.; Lu, C.; Hou, C.; Qiu, Y.; Zhang, P.; Duan, J.; Mu, H. Light controllable chitosan micelles with ROS generation and essential oil release for the treatment of bacterial biofilm. Carbohydr. Polym. 2019, 205, 533–539. [Google Scholar] [CrossRef] [PubMed]
- Zhao, X.; Liu, Z.; Liu, Z.; Meng, R.; Shi, C.; Chen, X.; Bu, X.; Guo, N. Phenotype and RNA-seq-based transcriptome profiling of Staphylococcus aureus biofilms in response to tea tree oil. Microb. Pathog. 2018, 123, 304–313. [Google Scholar] [CrossRef] [PubMed]
- Vazquez-Sanchez, D.; Galvao, J.A.; Mazine, M.R.; Gloria, E.M.; Oetterer, M. Control of Staphylococcus aureus biofilms by the application of single and combined treatments based in plant essential oils. Int. J. Food Microbiol. 2018, 286, 128–138. [Google Scholar] [CrossRef] [PubMed]
- Vaillancourt, K.; LeBel, G.; Yi, L.; Grenier, D. In vitro antibacterial activity of plant essential oils against Staphylococcus hyicus and Staphylococcus aureus, the causative agents of exudative epidermitis in pigs. Arch. Microbiol. 2018, 200, 1001–1007. [Google Scholar] [CrossRef] [PubMed]
- Scaffaro, R.; Lopresti, F.; D’Arrigo, M.; Marino, A.; Nostro, A. Efficacy of poly(lactic acid)/carvacrol electrospun membranes against Staphylococcus aureus and Candida albicans in single and mixed cultures. Appl. Microbiol. Biotechnol. 2018, 102, 4171–4181. [Google Scholar] [CrossRef] [PubMed]
- Merghni, A.; Noumi, E.; Hadded, O.; Dridi, N.; Panwar, H.; Ceylan, O.; Mastouri, M.; Snoussi, M. Assessment of the antibiofilm and antiquorum sensing activities of Eucalyptus globulus essential oil and its main component 1,8-cineole against methicillin-resistant Staphylococcus aureus strains. Microb. Pathog. 2018, 118, 74–80. [Google Scholar] [CrossRef] [PubMed]
- Kot, B.; Wierzchowska, K.; Gruzewska, A.; Lohinau, D. The effects of selected phytochemicals on biofilm formed by five methicillin-resistant Staphylococcus aureus. Nat. Prod. Res. 2018, 32, 1299–1302. [Google Scholar] [CrossRef] [PubMed]
- Chovanova, R.; Mezovska, J.; Vaverkova, S.; Mikulasova, M. The inhibition the Tet(K) efflux pump of tetracycline resistant Staphylococcus epidermidis by essential oils from three Salvia species. Lett. Appl. Microbiol. 2015, 61, 58–62. [Google Scholar] [CrossRef] [PubMed]
- Chovanova, R.; Mikulasova, M.; Vaverkova, S. In vitro antibacterial and antibiotic resistance modifying effect of bioactive plant extracts on methicillin-resistant Staphylococcus epidermidis. Int. J. Microbiol. 2013, 2013, 7. [Google Scholar] [CrossRef] [PubMed]
- Nostro, A.; Sudano Roccaro, A.; Bisignano, G.; Marino, A.; Cannatelli, M.A.; Pizzimenti, F.C.; Cioni, P.L.; Procopio, F.; Blanco, A.R. Effects of oregano, carvacrol and thymol on Staphylococcus aureus and Staphylococcus epidermidis biofilms. J. Med. Microbiol. 2007, 56, 519–523. [Google Scholar] [CrossRef] [PubMed]
- Taghadomi-Saberi, S.; Mas Garcia, S.; Allah Masoumi, A.; Sadeghi, M.; Marco, S. Classification of bitter orange essential oils according to fruit ripening stage by untargeted chemical profiling and machine learning. Sensors 2018, 18, 14. [Google Scholar] [CrossRef] [PubMed]
- Artini, M.; Patsilinakos, A.; Papa, R.; Bozovic, M.; Sabatino, M.; Garzoli, S.; Vrenna, G.; Tilotta, M.; Pepi, F.; Ragno, R.; et al. Antimicrobial and antibiofilm activity and machine learning classification analysis of essential oils from different mediterranean plants against pseudomonas aeruginosa. Molecules 2018, 23, 13. [Google Scholar] [CrossRef] [PubMed]
- Riahi, S.; Pourbasheer, E.; Ganjali, M.R.; Norouzi, P. Investigation of different linear and nonlinear chemometric methods for modeling of retention index of essential oil components: Concerns to support vector machine. J. Hazard Mater. 2009, 166, 853–859. [Google Scholar] [CrossRef] [PubMed]
- Drevinskas, T.; Mickienė, R.; Maruška, A.; Stankevičius, M.; Tiso, N.; Šalomskas, A.; Lelešius, R.; Karpovaitė, A.; Ragažinskienė, O. Confirmation of the antiviral properties of medicinal plants via chemical analysis, machine learning methods and antiviral tests: A methodological approach. Anal. Methods 2018, 10, 1875–1885. [Google Scholar] [CrossRef]
- Cortes, C.; Vapnik, V. Support-vector networks. Mach. Learn. 1995, 20, 273–297. [Google Scholar] [CrossRef]
- Ho, T.K. The random subspace method for constructing decision forests. IEEE Trans. Pattern Anal. 1998, 20, 832–844. [Google Scholar]
- Vert, J.-P. Kernel methods in genomics and computational biology. arXiv, 2005; arXiv:q-bio/0510032. [Google Scholar]
- Friedman, J.H. Greedy function approximation: A gradient boosting machine. Ann. Stat. 2001, 29, 1189–1232. [Google Scholar] [CrossRef]
- Sandasi, M.; Leonard, C.M.; Viljoen, A.M. The in vitro antibiofilm activity of selected culinary herbs and medicinal plants against Listeria monocytogenes. Lett. Appl. Microbiol. 2010, 50, 30–35. [Google Scholar] [CrossRef] [PubMed]
- Sandasi, M.; Leonard, C.M.; Viljoen, A.M. The effect of five common essential oil components on Listeria monocytogenes biofilms. Food Control 2008, 19, 1070–1075. [Google Scholar] [CrossRef]
- Negreiros, M.O.; Pawlowski, A.; Zini, C.A.; Soares, G.L.; Motta, A.S.; Frazzon, A.P. Antimicrobial and antibiofilm activity of Baccharis psiadioides essential oil against antibiotic-resistant Enterococcus faecalis strains. Pharm. Biol. 2016, 54, 3272–3279. [Google Scholar] [CrossRef] [PubMed]
- Szczepanski, S.; Lipski, A. Essential oils show specific inhibiting effects on bacterial biofilm formation. Food Control. 2014, 36, 224–229. [Google Scholar] [CrossRef]
- Kannappan, A.; Sivaranjani, M.; Srinivasan, R.; Rathna, J.; Pandian, S.K.; Ravi, A.V. Inhibitory efficacy of geraniol on biofilm formation and development of adaptive resistance in Staphylococcus epidermidis RP62A. J. Med. Microbiol. 2017, 66, 1506–1515. [Google Scholar] [CrossRef] [PubMed]
- Nuryastuti, T.; van der Mei, H.C.; Busscher, H.J.; Iravati, S.; Aman, A.T.; Krom, B.P. Effect of cinnamon oil on icaA expression and biofilm formation by Staphylococcus epidermidis. Appl. Environ. Microbiol. 2009, 75, 6850–6855. [Google Scholar] [CrossRef] [PubMed]
- Chueca, B.; Pagan, R.; Garcia-Gonzalo, D. Differential mechanism of Escherichia coli inactivation by (+)-limonene as a function of cell physiological state and drug’s concentration. PLoS ONE 2014, 9, e94072. [Google Scholar] [CrossRef] [PubMed]
- Rummaneethorn, N.; Caoili, C.M. d-limonene Increases Efficacy of Rifampicin as an Inhibitor of In Vitro Growth of Opportunistic Staphylococcus epidermidis RP62A. In Proceedings of the National Conference On Undergraduate Research (NCUR), Asheville, NC, USA, 7–9 April 2016; University of North Carolina at Asheville: Asheville, NC, USA. [Google Scholar]
- Subramenium, G.A.; Vijayakumar, K.; Pandian, S.K. Limonene inhibits streptococcal biofilm formation by targeting surface-associated virulence factors. J. Med. Microbiol. 2015, 64, 879–890. [Google Scholar] [CrossRef] [PubMed]
- Cerioli, M.F.; Moliva, M.V.; Cariddi, L.N.; Reinoso, E.B. Effect of the essential oil of minthostachys verticillata (Griseb.) epling and limonene on biofilm production in pathogens causing bovine mastitis. Front. Vet. Sci. 2018, 5, 146. [Google Scholar] [CrossRef] [PubMed]
- Espina, L.; Pagan, R.; Lopez, D.; Garcia-Gonzalo, D. Individual constituents from essential oils inhibit biofilm mass production by multi-drug resistant Staphylococcus aureus. Molecules 2015, 20, 11357–11372. [Google Scholar] [CrossRef] [PubMed]
- Majumdar, S.; Mondal, S. Perspectives on quorum sensing in Fungi. bioRxiv 2015, 019034. [Google Scholar] [CrossRef]
- Cafiso, V.; Bertuccio, T.; Santagati, M.; Demelio, V.; Spina, D.; Nicoletti, G.; Stefani, S. agr-Genotyping and transcriptional analysis of biofilm-producing Staphylococcus aureus. FEMS Immunol. Med. Microbiol. 2007, 51, 220–227. [Google Scholar] [CrossRef] [PubMed]
- Heilmann, C.; Gerke, C.; Perdreau-Remington, F.; Gotz, F. Characterization of Tn917 insertion mutants of Staphylococcus epidermidis affected in biofilm formation. Infect. Immun. 1996, 64, 277–282. [Google Scholar] [PubMed]
- Vuong, C.; Gerke, C.; Somerville, G.A.; Fischer, E.R.; Otto, M. Quorum-sensing control of biofilm factors in Staphylococcus epidermidis. J. Infect. Dis. 2003, 188, 706–718. [Google Scholar] [CrossRef] [PubMed]
- Buttner, H.; Mack, D.; Rohde, H. Structural basis of Staphylococcus epidermidis biofilm formation: Mechanisms and molecular interactions. Front. Cell Infect. Microbiol. 2015, 5, 14. [Google Scholar] [PubMed]
- Garzoli, S.; Bozovic, M.; Baldisserotto, A.; Sabatino, M.; Cesa, S.; Pepi, F.; Vicentini, C.B.; Manfredini, S.; Ragno, R. Essential oil extraction, chemical analysis and anti-Candida activity of Foeniculum vulgare Miller—new approaches. Nat. Prod. Res. 2017, 32, 1–6. [Google Scholar] [CrossRef] [PubMed]
- Bozovic, M.; Garzoli, S.; Sabatino, M.; Pepi, F.; Baldisserotto, A.; Andreotti, E.; Romagnoli, C.; Mai, A.; Manfredini, S.; Ragno, R. Essential oil extraction, chemical analysis and anti-Candida Activity of Calamintha nepeta (L.) Savi subsp. glandulosa (Req.) ball-new approaches. Molecules 2017, 22, 13. [Google Scholar] [CrossRef] [PubMed]
- Bozovic, M.; Navarra, A.; Garzoli, S.; Pepi, F.; Ragno, R. Esential oils extraction: A 24-h steam distillation systematic methodology. Nat. Prod. Res. 2017, 31, 2387–2396. [Google Scholar] [CrossRef] [PubMed]
- Garzoli, S.; Pirolli, A.; Vavala, E.; Di Sotto, A.; Sartorelli, G.; Bozovic, M.; Angiolella, L.; Mazzanti, G.; Pepi, F.; Ragno, R. Multidisciplinary approach to determine the optimal time and period for extracting the essential oil from mentha suaveolens Ehrh. Molecules 2015, 20, 9640–9655. [Google Scholar] [CrossRef] [PubMed]
- Humphries, R.M.; Ambler, J.; Mitchell, S.L.; Castanheira, M.; Dingle, T.; Hindler, J.A.; Koeth, L.; Sei, K.; Development, C.M.; Standardization Working Group of the Subcommittee on Antimicrobial Susceptibility Testing. CLSI methods development and standardization working group best practices for evaluation of antimicrobial susceptibility tests. J. Clin. Microbiol. 2018, 56, 10. [Google Scholar] [CrossRef] [PubMed]
- Papa, R.; Selan, L.; Parrilli, E.; Tilotta, M.; Sannino, F.; Feller, G.; Tutino, M.L.; Artini, M. Anti-biofilm activities from marine cold adapted bacteria against Staphylococci and Pseudomonas aeruginosa. Front. Microbiol. 2015, 6, 10. [Google Scholar] [CrossRef] [PubMed]
- Perkel, J.M. Pick up Python. Nature 2015, 518, 125–126. [Google Scholar] [CrossRef] [PubMed]
- Kluyver, T.; Ragan-Kelley, B.; Pérez, F.; Granger, B.; Bussonnier, M.; Frederic, J.; Kelley, K.; Hamrick, J.; Grout, J.; Corlay, S.; et al. Jupyter Notebooks—A publishing format for reproducible computational workflows. In Positioning and Power in Academic Publishing: Players, Agents and Agendas; Loizides, F., Scmidt, B., Eds.; IOS Press: Amsterdam, The Netherlands, 2016; pp. 87–90. [Google Scholar] [CrossRef]
- McKinney, W. Data Structures for Statistical Computing in Python. In Proceedings of the Python for Scientific Computing, Astin, TX, USA, 28 June–3 July 2010; pp. 51–56. Available online: https://conference.scipy.org/scipy2010/ (accessed on 2 March 2019).
- Pedregosa, F.; Varoquaux, G.; Gramfort, A.; Michel, V.; Thirion, B.; Grisel, O.; Blondel, M.; Prettenhofer, P.; Weiss, R.; Dubourg, V.; et al. Scikit-learn: Machine learning in Python. J. Mach. Learn. Res. 2011, 12, 2825–2830. [Google Scholar]
- Tipping, M.E.; Bishop, C.M. Probabilistic principal component analysis. J. R. Stat. Soc. B 1999, 61, 611–622. [Google Scholar] [CrossRef]
- Hunter, J.D. Matplotlib: A 2D graphics environment. Comput. Sci. Eng. 2007, 9, 90–95. [Google Scholar] [CrossRef]
- Snoek, J.; Larochelle, H.; Adams, R.P. Practical Bayesian optimization of machine learning algorithms. In Proceedings of the 25th International Conference on Neural Information Processing Systems—Volume 2; Curran Associates Inc.: Lake Tahoe, NV, USA, 2012; pp. 2951–2959. [Google Scholar]
- Choudhary, P.; Kramer, A.; datascience.com team. Datascienceinc/skater: Enable interpretability via rule extraction(BRL). Zenodo, 2018. Available online: https://zenodo.org/record/1198885#.XHsqergRXIU (accessed on 2 March 2019).
- Wei, P.; Lu, Z.; Song, J. Variable importance analysis: A comprehensive review. Reliab. Eng. Syst. Saf. 2015, 142, 399–432. [Google Scholar] [CrossRef]
- Baldi, P.; Brunak, S.; Chauvin, Y.; Andersen, C.A.F.; Nielsen, H. Assessing the accuracy of prediction algorithms for classification: An overview. Bioinformatics 2000, 16, 412–424. [Google Scholar] [CrossRef] [PubMed]
- Klopman, G.; Kalos, A.N. Causality in Structure Activity Studies. J. Comput. Chem. 1985, 6, 492–506. [Google Scholar] [CrossRef]
- Rucker, C.; Rucker, G.; Meringer, M. Y-Randomization and its variants in QSPR/QSAR. J. Chem. Inf. Model. 2007, 47, 2345–2357. [Google Scholar] [CrossRef] [PubMed]
Sample Availability: Samples of the compounds are not available from the authors. |


| EOID | S. aureus 6538P | S. aureus 25923 | S. epidermidis RP62A | S. epidermidis O-47 |
|---|---|---|---|---|
| CJ1 | >25 | >25 | >25 | >25 |
| CJ2 | >25 | >25 | 50 | >25 |
| CJ3 | 25 | 25 | >25 | >25 |
| CJ6 | 25 | 25 | >25 | >25 |
| CJ12 | 25 | >25 | >25 | >25 |
| CJ24 | >25 | >25 | >25 | >25 |
| CJM1 | 12.5 | 25 | >25 | >25 |
| CJM2 | >25 | >25 | >25 | >25 |
| CJM3 | 12.5 | 25 | 25–12.5 | 25–12.5 |
| CJM4 | 12.5 | 25 | 25 | >25 |
| CJM5 | >25 | >25 | >25 | >25 |
| CA1 | >25 | >25 | >25 | >25 |
| CA2 | >25 | >25 | >25 | >25 |
| CA3 | 25 | >25 | >25 | >25 |
| CA6 | 25–12.5 | >25 | 25 | 25 |
| CA12 | 12.5 | 12.5 | 12.5 | >25 |
| CA24 | 12.5 | 12.5 | >25 | >25 |
| CAM1 | >25 | >25 | >25 | >25 |
| CAM2 | 12.5–6.25 | 12.5–6.25 | 12.5 | 12.5 |
| CAM3 | >25 | >25 | >25 | >25 |
| CAM4 | 6.25 | 6.25 | 12.5 | 12.5 |
| CAM5 | >25 | >25 | >25 | >25 |
| CS1 | >25 | >25 | >25 | >25 |
| CS2 | >25 | >25 | >25 | >25 |
| CS3 | >25 | >25 | >25 | >25 |
| CS6 | >25 | >25 | >25 | >25 |
| CS12 | 12.5–6.25 | 12.5 | 12.5 | 12.5 |
| CS24 | 6.25 | 12.5–6.25 | >25 | 12.5 |
| CSM1 | >25 | >25 | >25 | >25 |
| CSM2 | 12.5 | 12.5 | 12.5 | 12.5 |
| CSM3 | >25 | >25 | >25 | >25 |
| CSM4 | 12.5–6.25 | 12.5–6.25 | 12.5 | 12.5 |
| CSM5 | >25 | >25 | >25 | >25 |
| CO1 | >25 | >25 | >25 | >25 |
| CO2 | >25 | >25 | >25 | >25 |
| CO3 | 25–12.5 | 25 | 25 | 25 |
| CO6 | 25–12.5 | 25–12.5 | 25–12.5 | 25–12.5 |
| CO12 | 12.5 | 12.5 | 12.5 | 12.5 |
| CO24 | >25 | >25 | >25 | >25 |
| COM1 | 25 | 25 | 25–12.5 | 25–12.5 |
| COM2 | 25–12.5 | 25–12.5 | 25–12.5 | 25–12.5 |
| COM3 | 25 | 25 | 25–12.5 | 25–12.5 |
| COM4 | 12.5 | 25 | 25 | 25 |
| COM5 | >25 | >25 | >25 | >25 |
| Ofloxacin | 0.0002–0.0004 | 0.0004–0.0008 | 0.0002–0.0004 | 0.0002–0.0004 |
| EOID | S. aureus 6538P | S. aureus 25923 | S. epidermidis RP62A | S. epidermidis O-47 |
|---|---|---|---|---|
| FA1 | >25 | >25 | >25 | >25 |
| FA2 | 25–12.5 | 25–12.5 | >25 | >25 |
| FA3 | >25 | >25 | >25 | >25 |
| FA6 | >25 | >25 | >25 | >25 |
| FA12 | >25 | >25 | >25 | >25 |
| FA24 | 12.5–6.25 | >25 | >25 | >25 |
| FAM1 | >25 | >25 | >25 | >25 |
| FAM2 | >25 | >25 | >25 | >25 |
| FAM3 | >25 | >25 | >25 | >25 |
| FAM4 | >25 | >25 | >25 | >25 |
| FAM5 | >25 | >25 | >25 | 25 |
| FS1 | >25 | >25 | >25 | >25 |
| FS2 | >25 | >25 | >25 | >25 |
| FS3 | >25 | >25 | >25 | >25 |
| FS6 | >25 | >25 | >25 | >25 |
| FS12 | >25 | >25 | >25 | >25 |
| FS24 | >25 | >25 | >25 | >25 |
| FSM1 | >25 | >25 | >25 | >25 |
| FSM2 | >25 | >25 | >25 | >25 |
| FSM3 | 12.5–6.25 | >25 | >25 | >25 |
| FSM4 | >25 | >25 | >25 | >25 |
| FSM5 | 25–12.5 | 12.5 | >25 | >25 |
| FO1 | 25 | 25 | >25 | >25 |
| FO2 | >25 | >25 | >25 | >25 |
| FO3 | 25 | 25 | >25 | >25 |
| FO6 | 25 | 25 | >25 | >25 |
| FO12 | >25 | >25 | >25 | >25 |
| FO24 | >25 | >25 | >25 | >25 |
| FOM1 | >25 | >25 | >25 | >25 |
| FOM2 | >25 | >25 | >25 | >25 |
| FOM3 | 25–12.5 | 12.5 | >25 | >25 |
| FOM4 | >25 | >25 | >25 | >25 |
| FOM5 | >25 | >25 | >25 | >25 |
| Ofloxacin | 0.0002–0.0004 | 0.0004–0.0008 | 0.0002–0.0004 | 0.0002–0.0004 |
| EOID | S. aureus 6538P | S. aureus 25923 | S. epidermidis RP62A | S. epidermidis O-47 |
|---|---|---|---|---|
| R1 | >25 | >25 | >25 | >25 |
| R2 | >25 | >25 | >25 | >25 |
| R3 | >25 | >25 | >25 | >25 |
| R6 | >25 | >25 | >25 | >25 |
| R12 | >25 | >25 | >25 | >25 |
| R24 | 25 | >25 | >25 | >25 |
| R30 | 25 | 25 | 25 | 25 |
| RM1 | >25 | >25 | >25 | >25 |
| RM2 | >25 | >25 | >25 | >25 |
| RM3 | >25 | >25 | >25 | >25 |
| RM4 | >25 | >25 | >25 | >25 |
| RM5 | >25 | >25 | >25 | >25 |
| RM6 | >25 | >25 | >25 | >25 |
| Ofloxacin | 0.0002–0.0004 | 0.0004–0.0008 | 0.0002–0.0004 | 0.0002–0.0004 |
| Conc. μg/mL | S. spp Strains | Biofilm Production % | Number EOs Samples at Biofilm Production % | |||||||
|---|---|---|---|---|---|---|---|---|---|---|
| MIN | MAX | <50% | <80% | <100% | ≥100% | ≥120% | ≥150% | ≥200% | ||
| 3125 | 6538P | 50.98 | 523.83 | 0 | 10 | 31 | 58 | 38 | 22 | 9 |
| 25923 | 26.92 | 697.45 | 1 | 4 | 16 | 73 | 47 | 14 | 9 | |
| RP62A | 13.04 | 209.69 | 26 | 42 | 71 | 18 | 8 | 1 | 1 | |
| O-47 | 27.12 | 289.88 | 24 | 35 | 61 | 28 | 14 | 4 | 4 | |
| 48.8 | 6538P | 62.80 | 459.46 | 0 | 5 | 20 | 69 | 37 | 17 | 7 |
| 25923 | 37.91 | 501.01 | 3 | 34 | 67 | 22 | 10 | 7 | 3 | |
| RP62A | 11.79 | 202.57 | 29 | 48 | 74 | 15 | 6 | 2 | 1 | |
| O-47 | 0.44 | 306.60 | 31 | 48 | 74 | 15 | 7 | 4 | 2 | |
| Assayed Conc. (μg/mL) | Models’ Parameters | Biofilm Inhibition Models | Biofilm Activation Models | |||||
|---|---|---|---|---|---|---|---|---|
| RP62A | O-47 | 25923 | RP62A | O-47 | 6538P | 25923 | ||
| 3125 | PCs 1 | 5 | 19 | 22 | 9 | 12 | 9 | 25 |
| Actives 2 | 31 | 30 | 4 | 6 | 4 | 27 | 20 | |
| Non-actives 3 | 58 | 59 | 85 | 83 | 85 | 62 | 69 | |
| cutoff | 62 | 62 | 63 | 126 | 133 | 139 | 139 | |
| 48.8 | PCs 1 | 8 | 9 | 24 | 15 | 8 | 9 | 20 |
| Actives 2 | 32 | 30 | 3 | 7 | 4 | 30 | 45 | |
| Non-actives 3 | 57 | 59 | 86 | 82 | 85 | 59 | 44 | |
| Cutoff4 | 63 | 63 | 62 | 124 | 138 | 133 | 121 | |
| Validation | Assayed Conc. (μg/mL) | Coefficient | Biofilm Inhibition Models | Biofilm Activation Models | ||
|---|---|---|---|---|---|---|
| RP62A | O-47 | 6538P | 25923 | |||
| Fitting | 3125 | Accuracy | 0.721 | 0.771 | 0.832 | 0.906 |
| MCC | 0.455 | 0.590 | 0.667 | 0.826 | ||
| Precision-Recall | 0.657 | 0.682 | 0.772 | 0.956 | ||
| ROC-AUC | 0.742 | 0.753 | 0.824 | 0.961 | ||
| 48.8 | Accuracy | 0.722 | 0.780 | 0.806 | 0.763 | |
| MCC | 0.452 | 0.604 | 0.632 | 0.533 | ||
| Precision-Recall | 0.659 | 0.681 | 0.757 | 0.824 | ||
| ROC-AUC | 0.735 | 0.752 | 0.815 | 0.834 | ||
| Cross-Validation | 3125 | AccuracyCV | 0.687 | 0.738 | 0.805 | 0.784 |
| MCCCV | 0.392 | 0.517 | 0.613 | 0.568 | ||
| Precision-RecallCV | 0.584 | 0.589 | 0.698 | 0.782 | ||
| ROC-AUCCV | 0.683 | 0.659 | 0.743 | 0.845 | ||
| 48.8 | AccuracyCV | 0.663 | 0.721 | 0.722 | 0.606 | |
| MCCCV | 0.335 | 0.474 | 0.450 | 0.214 | ||
| Precision-RecallCV | 0.577 | 0.591 | 0.668 | 0.533 | ||
| ROC-AUCCV | 0.666 | 0.660 | 0.753 | 0.599 | ||
| Type of Model | Strain | Coefficient | Mean | St Dev | Max | Min |
|---|---|---|---|---|---|---|
| Biofilm Inhibition Models | RP62A | AccuracyY-S | 0.500 | 0.079 | 0.644 | 0.219 |
| MCCY-S | 0.000 | 0.159 | 0.290 | −0.567 | ||
| Precision-RecallY-S | 0.496 | 0.063 | 0.643 | 0.353 | ||
| ROC-AUCY-S | 0.459 | 0.094 | 0.627 | 0.198 | ||
| O-47 | AccuracyY-S | 0.494 | 0.081 | 0.665 | 0.286 | |
| MCCY-S | −0.011 | 0.164 | 0.342 | −0.429 | ||
| Precision-RecallY-S | 0.506 | 0.068 | 0.668 | 0.377 | ||
| ROC-AUCY-S | 0.474 | 0.089 | 0.645 | 0.241 | ||
| Biofilm Activation Models | 6538P | AccuracyY-S | 0.492 | 0.082 | 0.637 | 0.249 |
| MCCY-S | −0.017 | 0.169 | 0.275 | −0.522 | ||
| Precision-RecallY-S | 0.507 | 0.071 | 0.661 | 0.347 | ||
| ROC-AUCY-S | 0.470 | 0.100 | 0.644 | 0.166 | ||
| 25923 | AccuracyY-S | 0.508 | 0.083 | 0.680 | 0.292 | |
| MCCY-S | 0.013 | 0.170 | 0.361 | −0.433 | ||
| Precision-RecallY-S | 0.524 | 0.071 | 0.746 | 0.355 | ||
| ROC-AUCY-S | 0.490 | 0.102 | 0.675 | 0.179 |
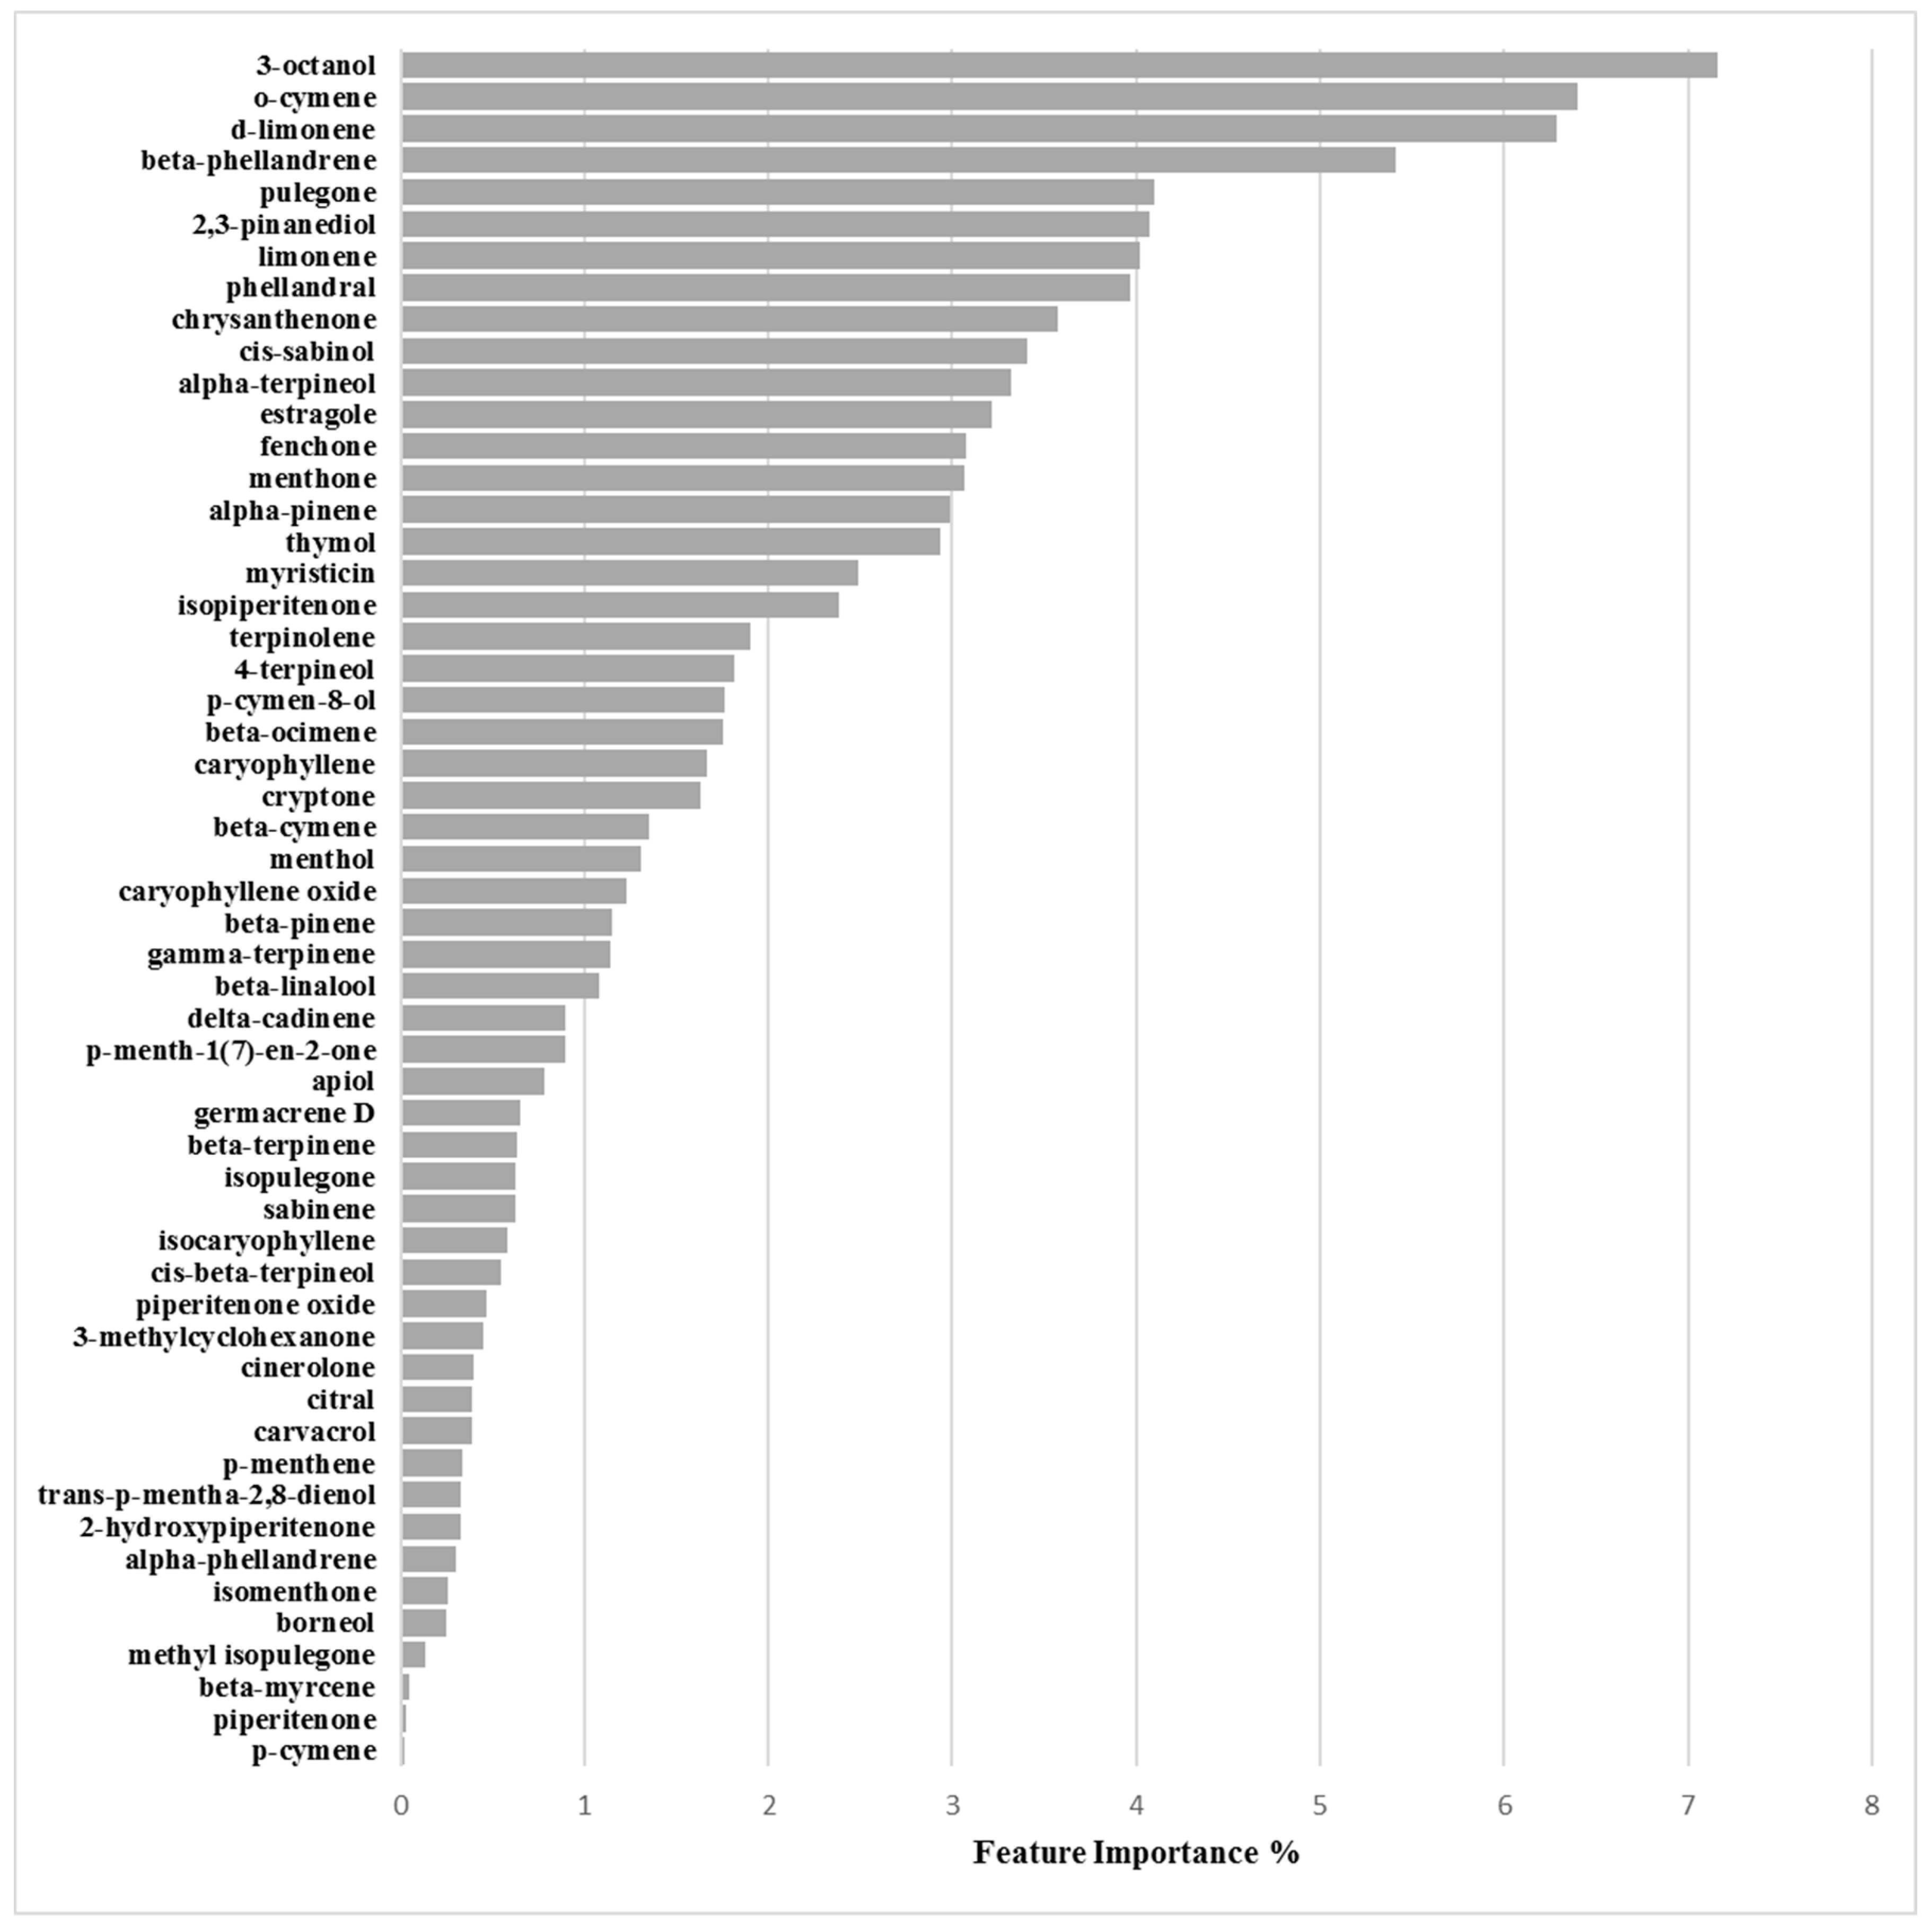
| Chemical Component | Biofilm Inhibition Models | Biofilm Inhibition Models | ||
|---|---|---|---|---|
| RP62A | O-47 | 6538P | 25923 | |
| 2-Hydroxypiperitenone | 0.23 | 0.32 | 0.38 | 0.44 |
| 2,3-Pinanediol | 1.33 | 4.07 | 1.47 | 1.05 |
| 3-Methylcyclohexanone | 0.16 | 0.45 | 1.09 | 1.62 |
| 3-Octanol | 6.47 | 7.16 | 10.80 | 4.44 |
| 4-Terpineol | 1.99 | 1.81 | 3.65 | 3.57 |
| α-Phellandrene | 0.61 | 0.30 | 3.02 | 0.67 |
| α-Pinene | 2.71 | 2.98 | 1.00 | 0.21 |
| α-Terpineol | 2.40 | 3.32 | 2.81 | 2.22 |
| Apiol | 0.17 | 0.78 | 0.83 | 0.97 |
| β-Cymene | 1.46 | 1.35 | 2.42 | 6.37 |
| β-Linalool | 1.40 | 1.08 | 0.93 | 7.08 |
| β-Myrcene | 0.72 | 0.05 | 0.95 | 0.67 |
| β-Ocimene | 0.56 | 1.75 | 0.78 | 0.06 |
| β-Phellandrene | 1.62 | 5.42 | 3.30 | 0.69 |
| β-Pinene | 1.31 | 1.15 | 0.34 | 2.12 |
| β-Terpinene | 0.17 | 0.63 | 0.97 | 0.15 |
| Borneol | 0.07 | 0.25 | 0.45 | 0.56 |
| Carvacrol | 0.38 | 0.38 | 0.34 | 0.26 |
| Caryophyllene | 1.35 | 1.67 | 2.78 | 4.36 |
| Caryophyllene oxide | 0.13 | 1.23 | 0.32 | 3.25 |
| Chrysanthenone | 3.87 | 3.58 | 2.68 | 4.79 |
| Cinerolone | 1.14 | 0.40 | 0.64 | 1.45 |
| cis-β-Terpineol | 0.55 | 0.55 | 0.88 | 1.85 |
| cis-Sabinol | 4.60 | 3.40 | 4.36 | 0.17 |
| Citral | 0.12 | 0.39 | 0.65 | 0.99 |
| Cryptone | 0.15 | 1.63 | 0.09 | 0.27 |
| d-Limonene | 5.66 | 6.29 | 9.22 | 1.56 |
| delta-Cadinene | 1.62 | 0.90 | 0.40 | 1.17 |
| Estragole | 3.87 | 3.21 | 0.04 | 2.49 |
| Fenchone | 3.66 | 3.08 | 0.06 | 1.54 |
| γ-Terpinene | 0.19 | 1.14 | 1.51 | 1.97 |
| Germacrene D | 0.82 | 0.65 | 0.65 | 0.14 |
| Isocaryophyllene | 0.86 | 0.58 | 0.84 | 0.07 |
| Isomenthone | 1.53 | 0.26 | 0.71 | 1.77 |
| Isopiperitenone | 2.80 | 2.38 | 1.61 | 2.42 |
| Isopulegone | 0.01 | 0.63 | 4.89 | 0.85 |
| Limonene | 1.64 | 4.02 | 2.62 | 0.67 |
| Menthol | 2.17 | 1.30 | 1.38 | 7.16 |
| Menthone | 3.00 | 3.07 | 3.81 | 7.51 |
| Methyl isopulegone | 0.27 | 0.14 | 0.27 | 0.13 |
| Myristicin | 4.16 | 2.48 | 0.16 | 0.59 |
| o-Cymene | 2.64 | 6.40 | 3.44 | 1.62 |
| p-Cymen-8-ol | 0.90 | 1.76 | 0.89 | 0.96 |
| p-Cymene | 2.99 | 0.02 | 0.39 | 1.14 |
| p-Menth-1(7)-en-2-one | 5.06 | 0.89 | 1.51 | 0.91 |
| p-Menthene | 0.43 | 0.33 | 0.26 | 0.35 |
| Phellandral | 6.15 | 3.97 | 1.40 | 2.08 |
| Piperitenone | 0.21 | 0.03 | 2.86 | 4.95 |
| Piperitenone oxide | 2.32 | 0.46 | 1.68 | 0.36 |
| Pulegone | 4.06 | 4.10 | 9.12 | 4.18 |
| Sabinene | 0.61 | 0.62 | 0.91 | 0.62 |
| Terpinolene | 0.55 | 1.90 | 1.07 | 1.84 |
| Thymol | 5.73 | 2.94 | 0.08 | 0.31 |
| trans-p-Mentha-2,8-dienol | 0.43 | 0.33 | 0.26 | 0.35 |
| Strain | Name | Type | Isolation |
|---|---|---|---|
| S. aureus 6538P | 6538P | clinical isolate | ATCC collection |
| S. aureus 25923 | 25923 | clinical isolate | ATCC collection |
| S. epidermidis RP62A | RP62A | infected catheter isolated strain | ATCC collection |
| S. epidermidis O-47 | O-47 | septic arthritis clinical isolate | Heilmann et al., 1996 [29] |
© 2019 by the authors. Licensee MDPI, Basel, Switzerland. This article is an open access article distributed under the terms and conditions of the Creative Commons Attribution (CC BY) license (http://creativecommons.org/licenses/by/4.0/).
Share and Cite
Patsilinakos, A.; Artini, M.; Papa, R.; Sabatino, M.; Božović, M.; Garzoli, S.; Vrenna, G.; Buzzi, R.; Manfredini, S.; Selan, L.; et al. Machine Learning Analyses on Data including Essential Oil Chemical Composition and In Vitro Experimental Antibiofilm Activities against Staphylococcus Species. Molecules 2019, 24, 890. https://doi.org/10.3390/molecules24050890
Patsilinakos A, Artini M, Papa R, Sabatino M, Božović M, Garzoli S, Vrenna G, Buzzi R, Manfredini S, Selan L, et al. Machine Learning Analyses on Data including Essential Oil Chemical Composition and In Vitro Experimental Antibiofilm Activities against Staphylococcus Species. Molecules. 2019; 24(5):890. https://doi.org/10.3390/molecules24050890
Chicago/Turabian StylePatsilinakos, Alexandros, Marco Artini, Rosanna Papa, Manuela Sabatino, Mijat Božović, Stefania Garzoli, Gianluca Vrenna, Raissa Buzzi, Stefano Manfredini, Laura Selan, and et al. 2019. "Machine Learning Analyses on Data including Essential Oil Chemical Composition and In Vitro Experimental Antibiofilm Activities against Staphylococcus Species" Molecules 24, no. 5: 890. https://doi.org/10.3390/molecules24050890