Isatin-1,8-Naphthalimide Hydrazones: A Study of Their Sensor and ON/OFF Functionality

 , , ,
, , ,
Abstract
:1. Introduction
2. Results and Discussion
2.1. Synthesis
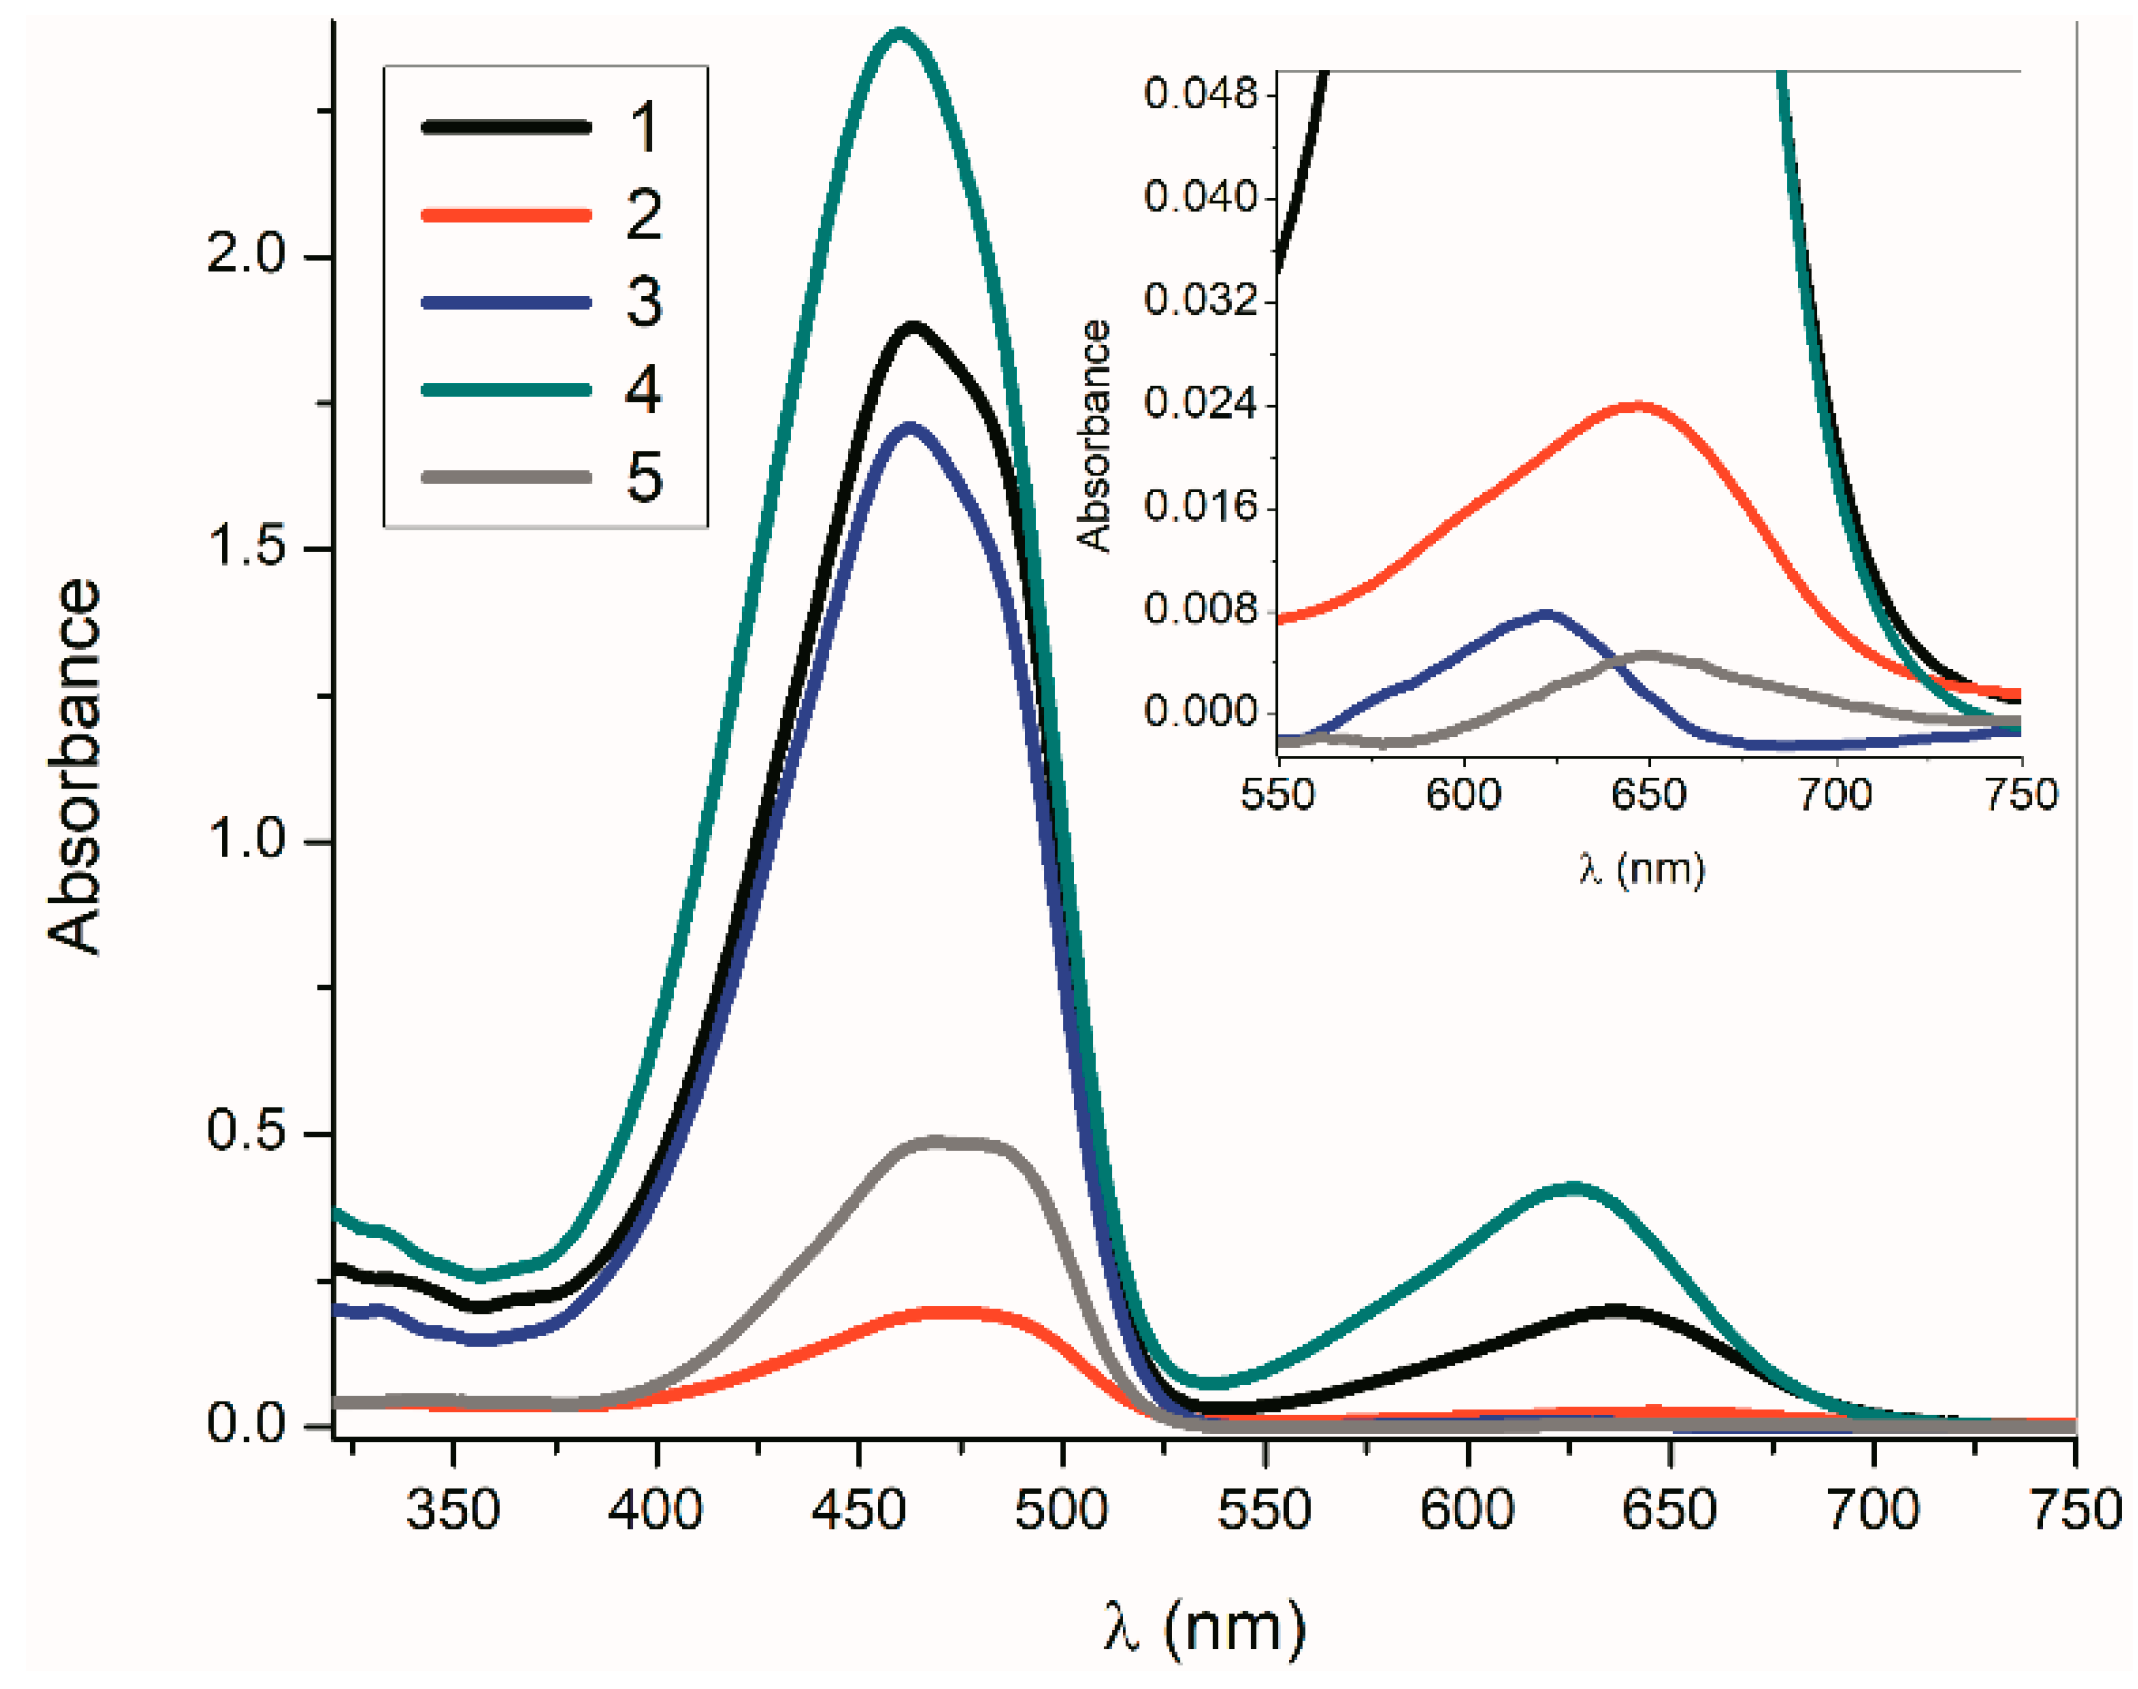
2.2. UV-VIS Spectra
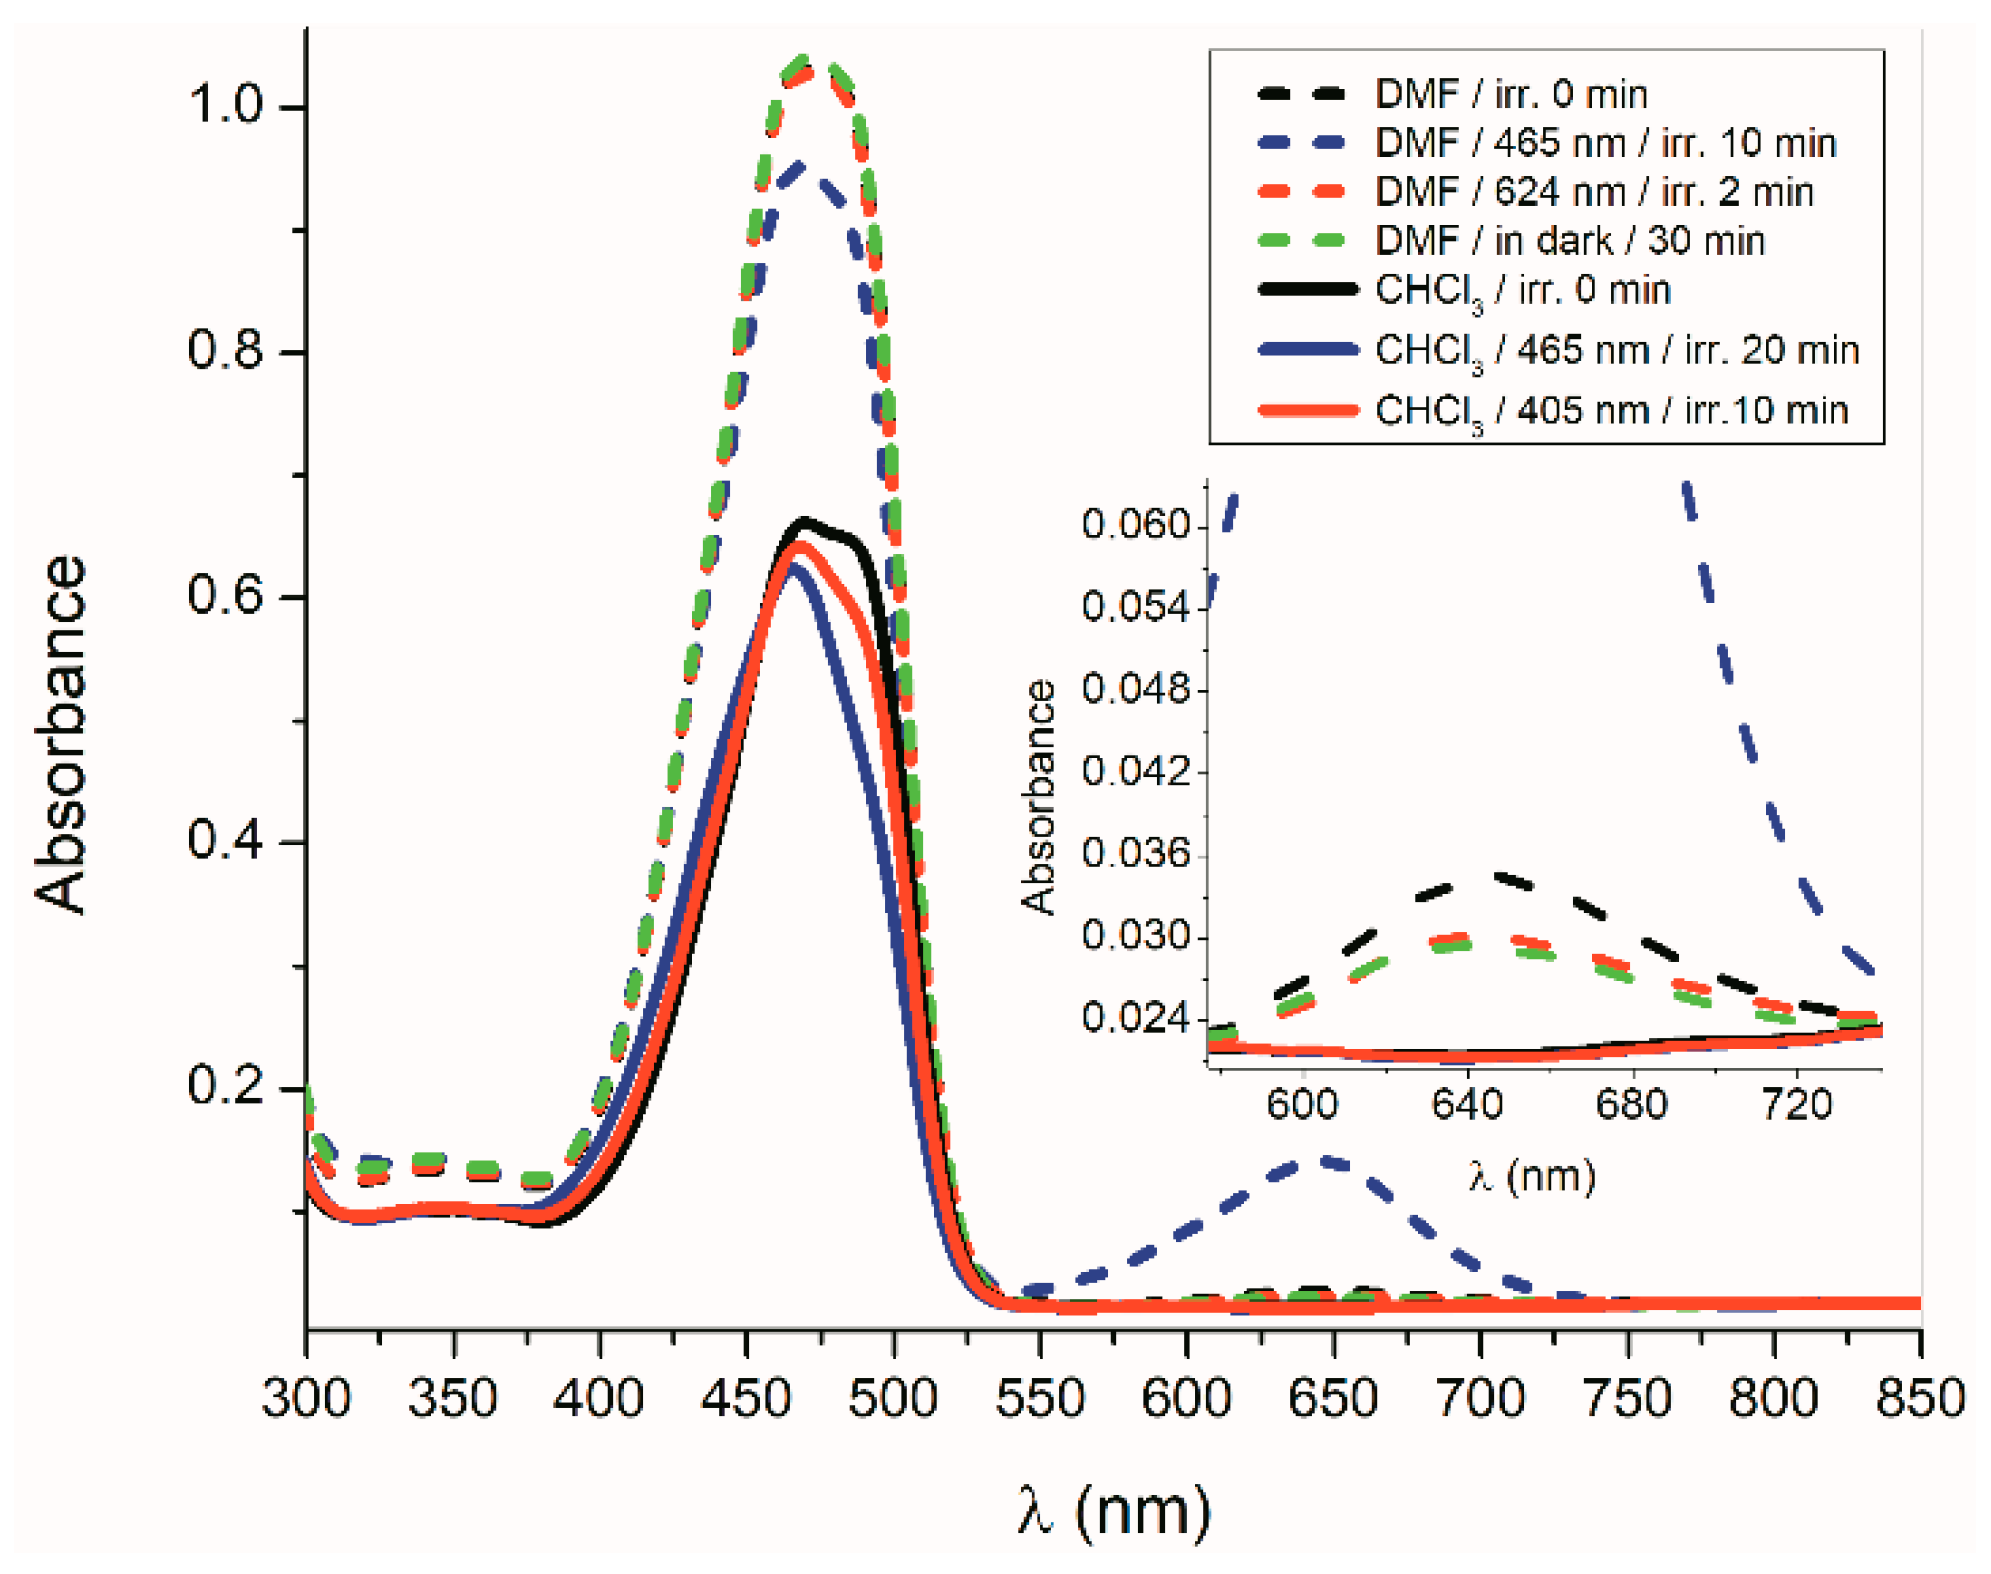
2.3. Tautomeric Equilibrium Z-E and E-Z Isomerization
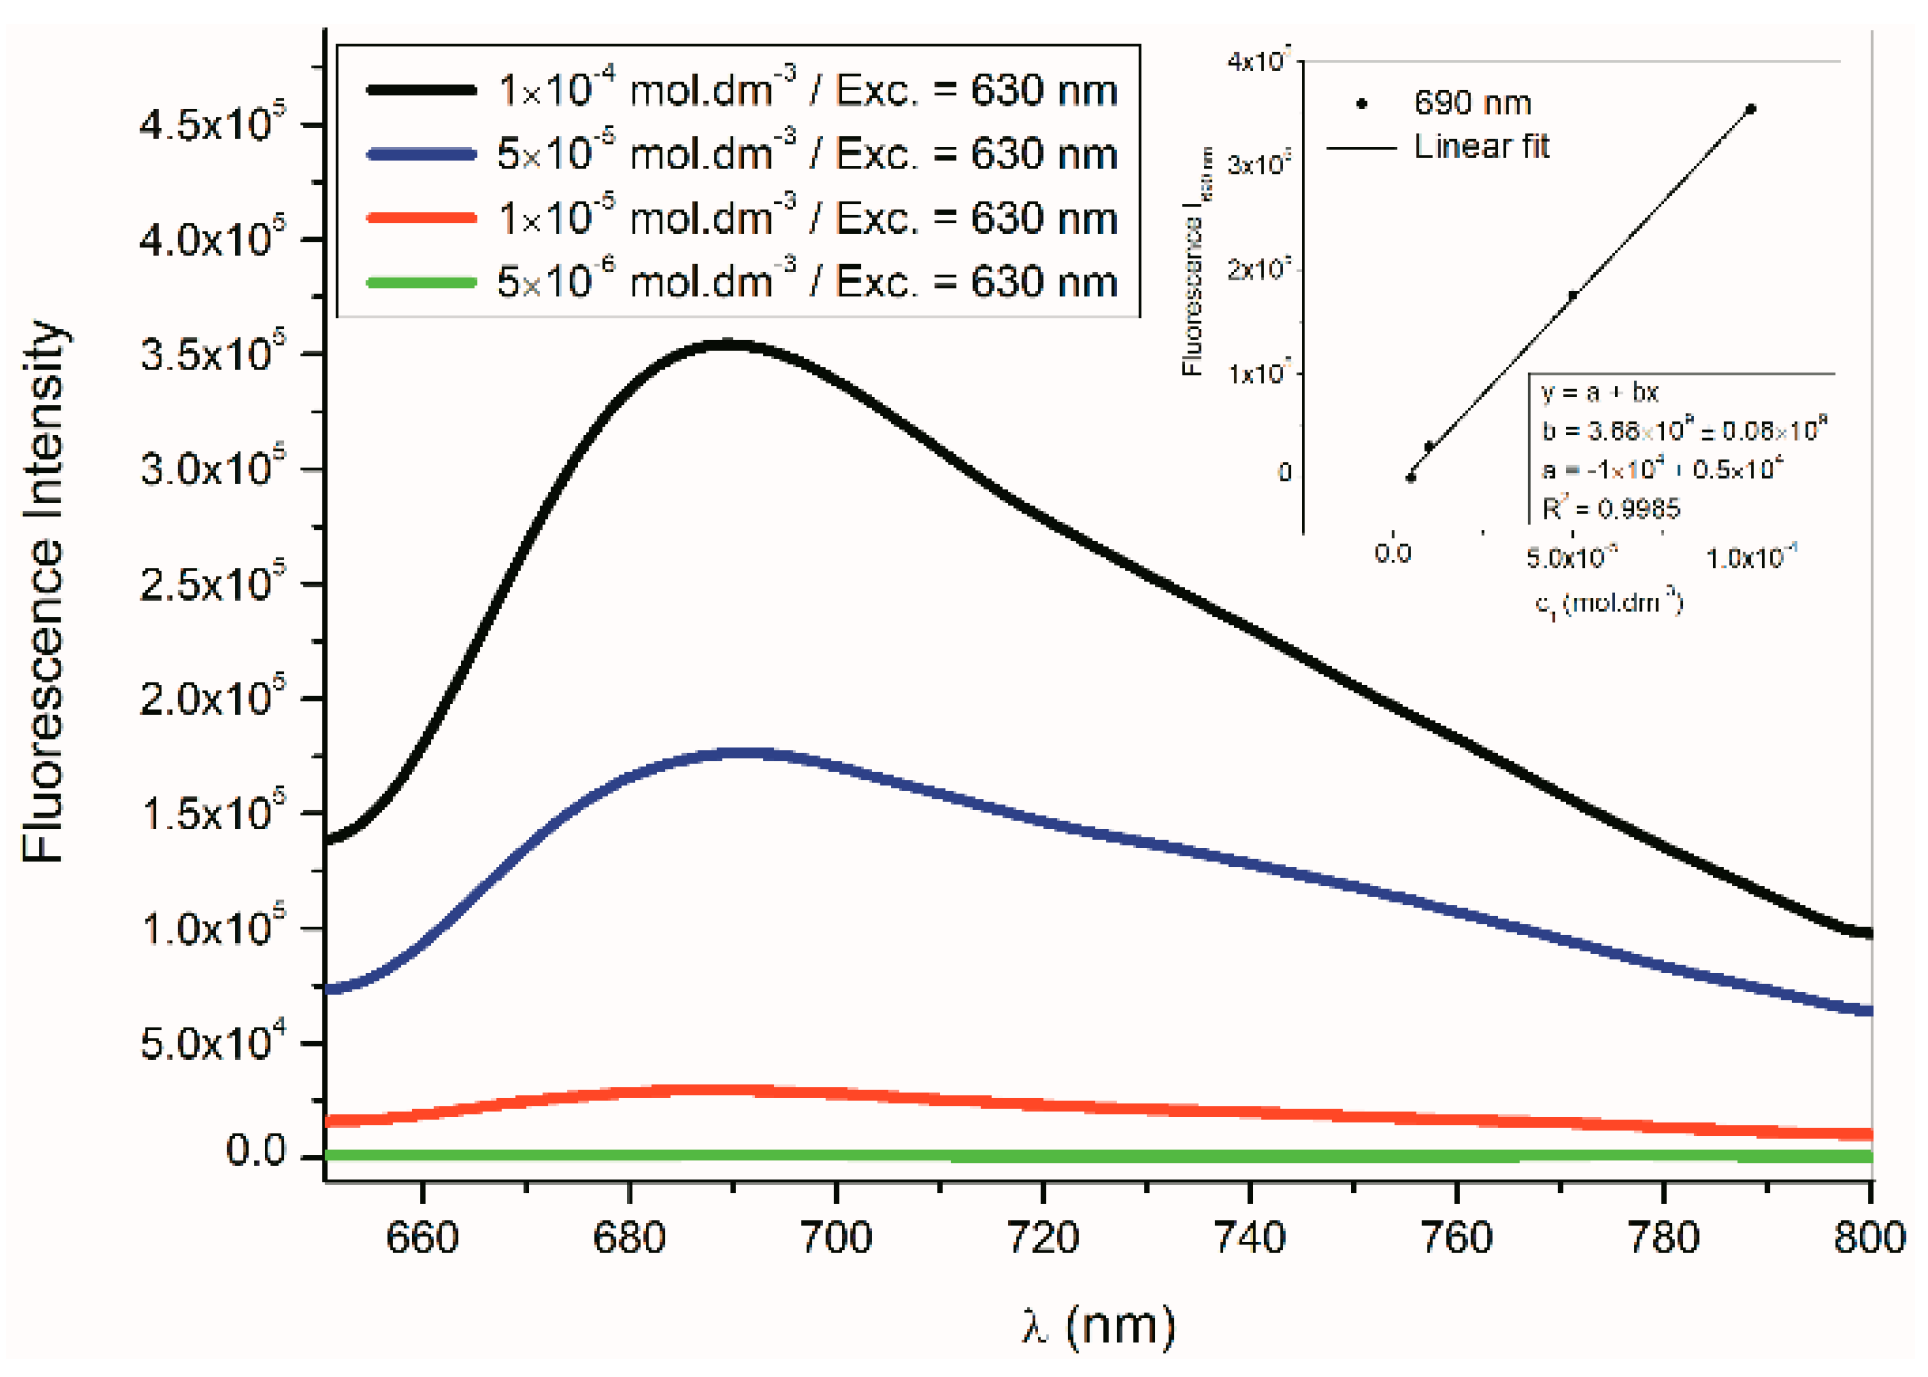
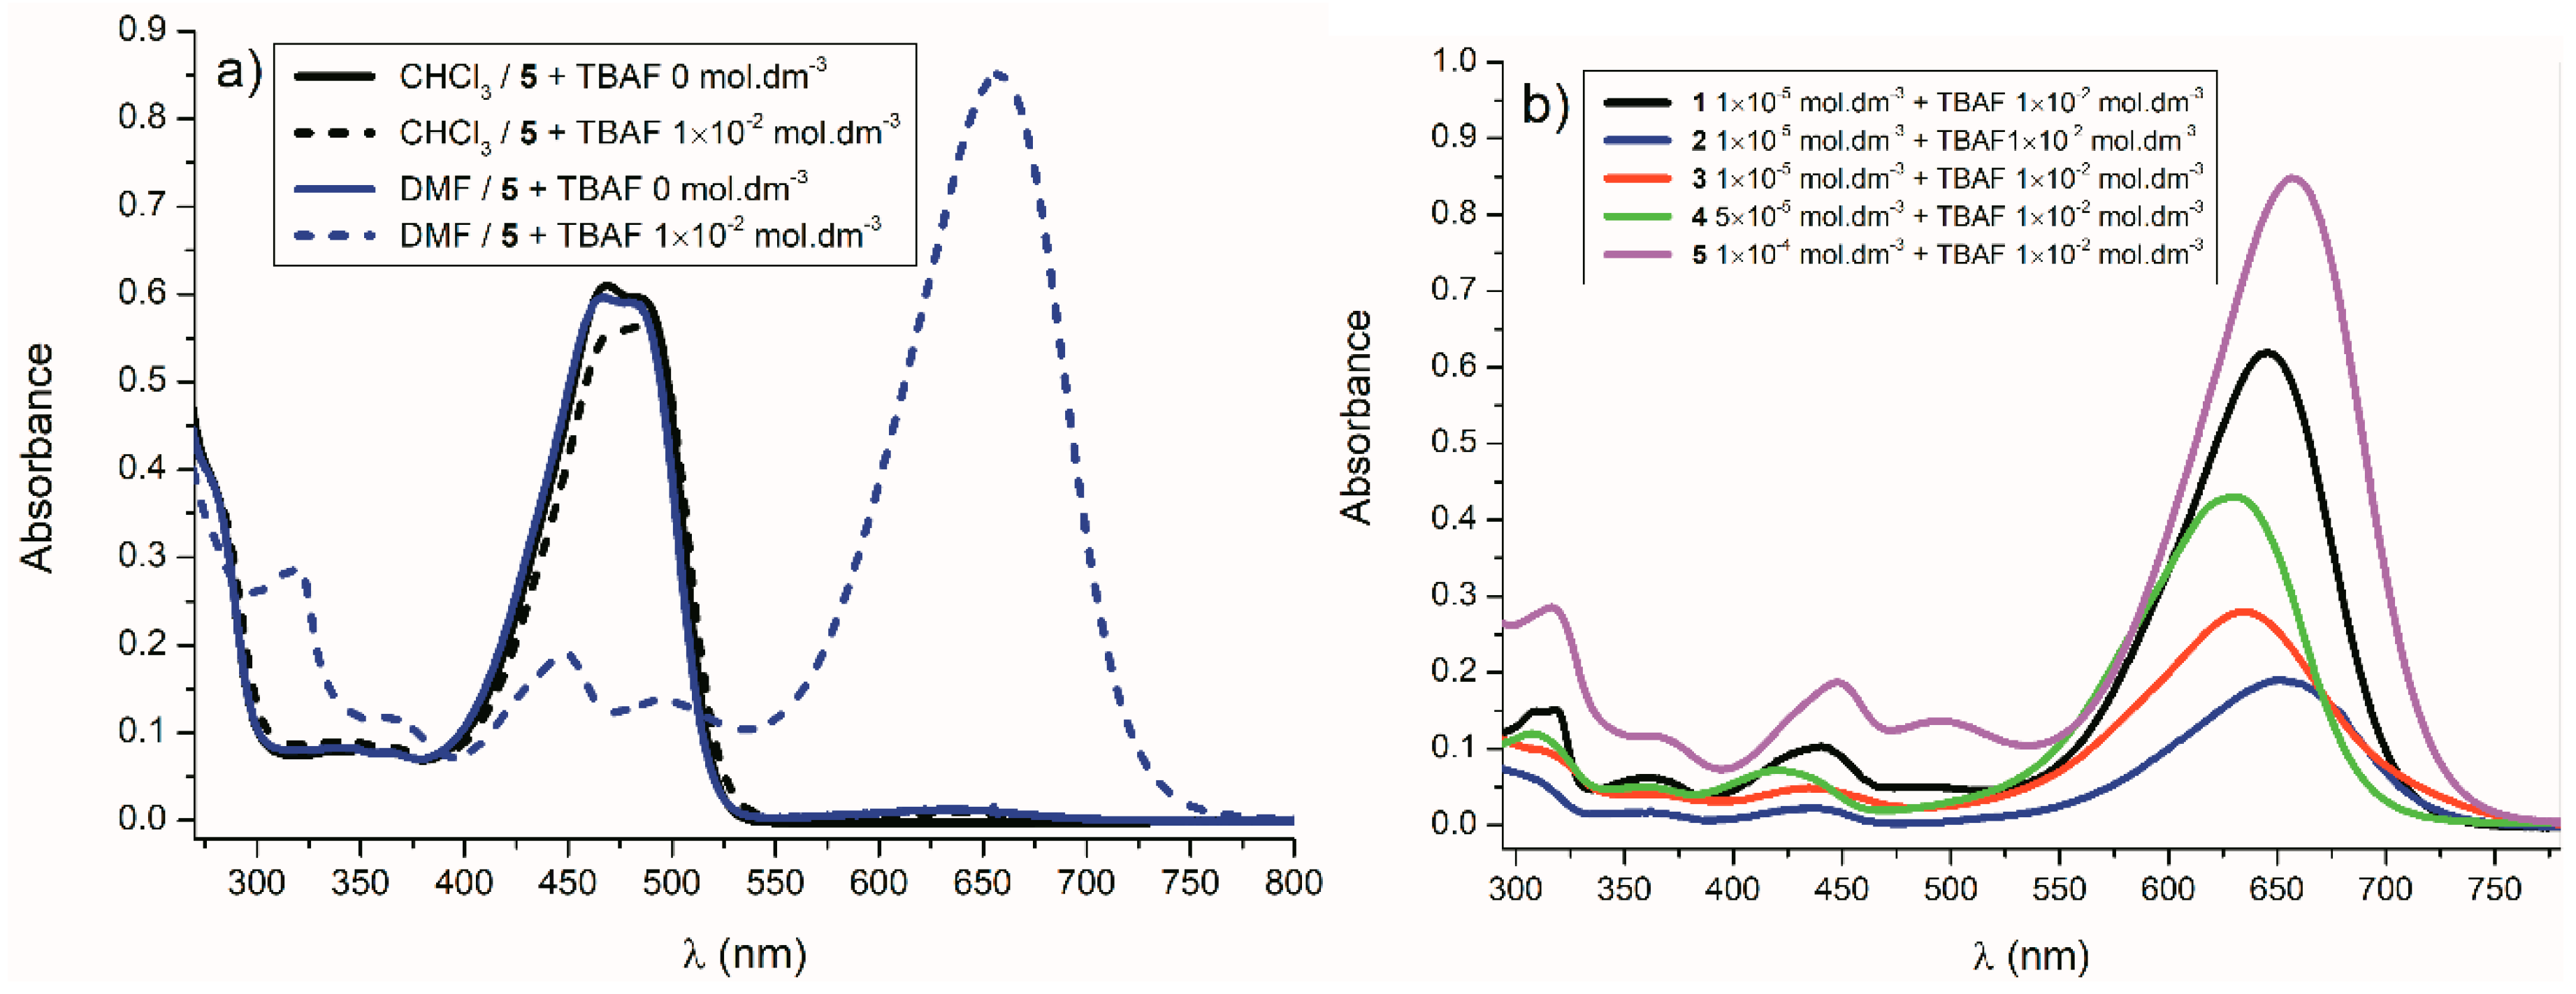
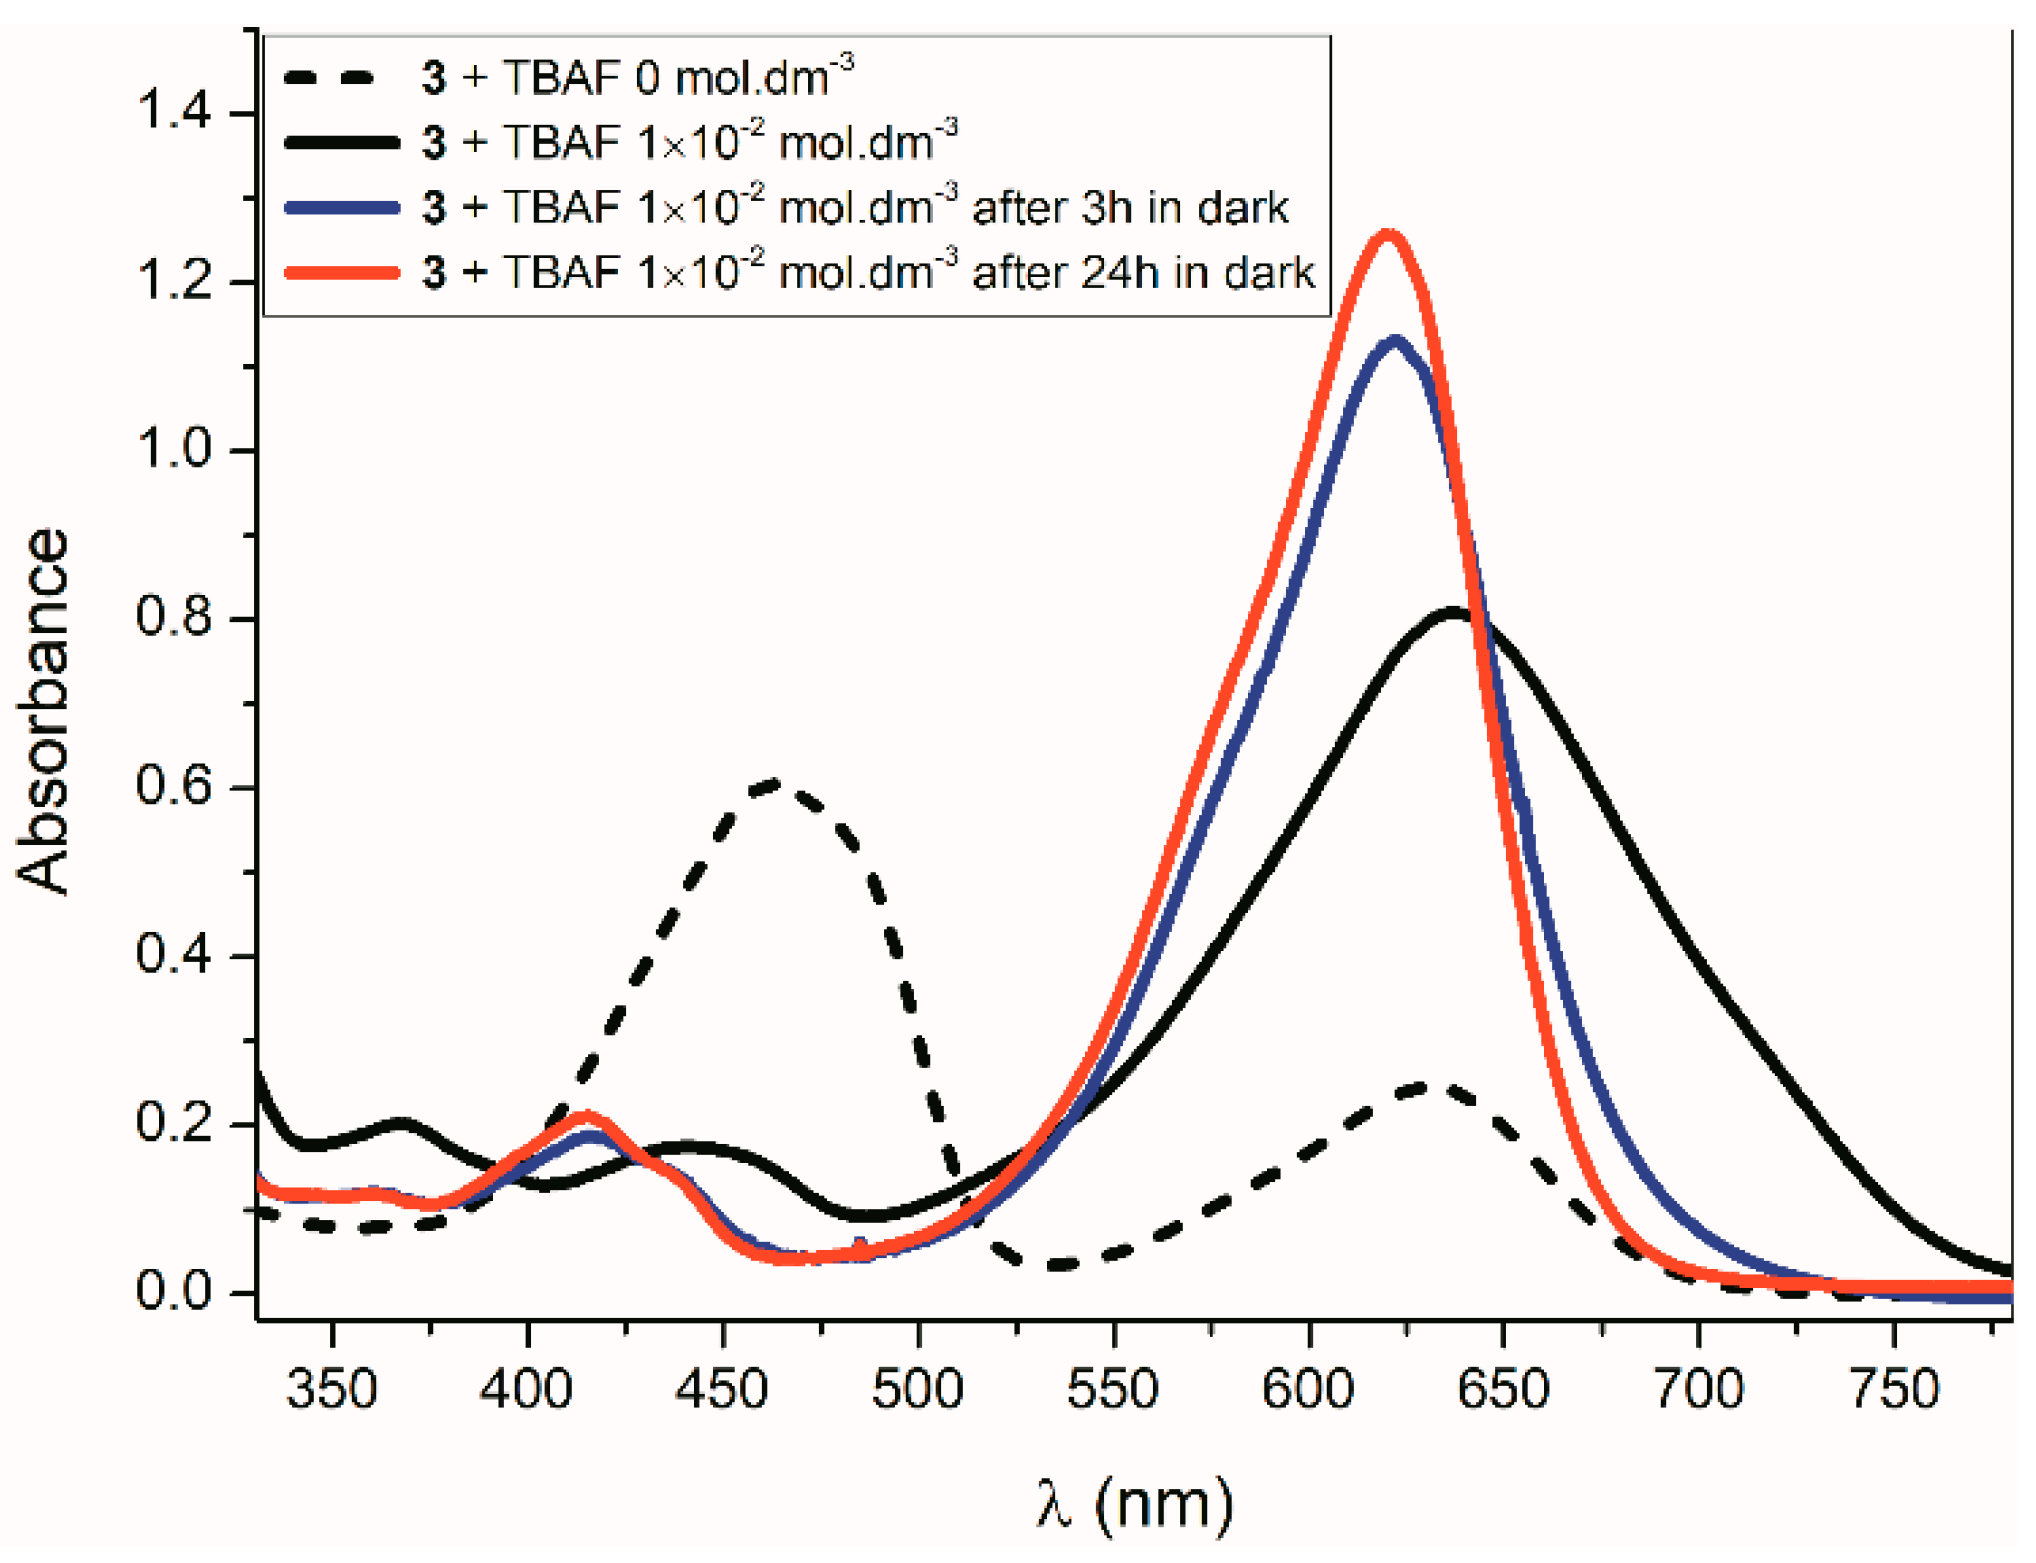
2.4. The Ions Effect on UV-Vis and Fluorescence Spectra of Isatin 1,8-Naphthalimide Hydrazones—Anion Sensors
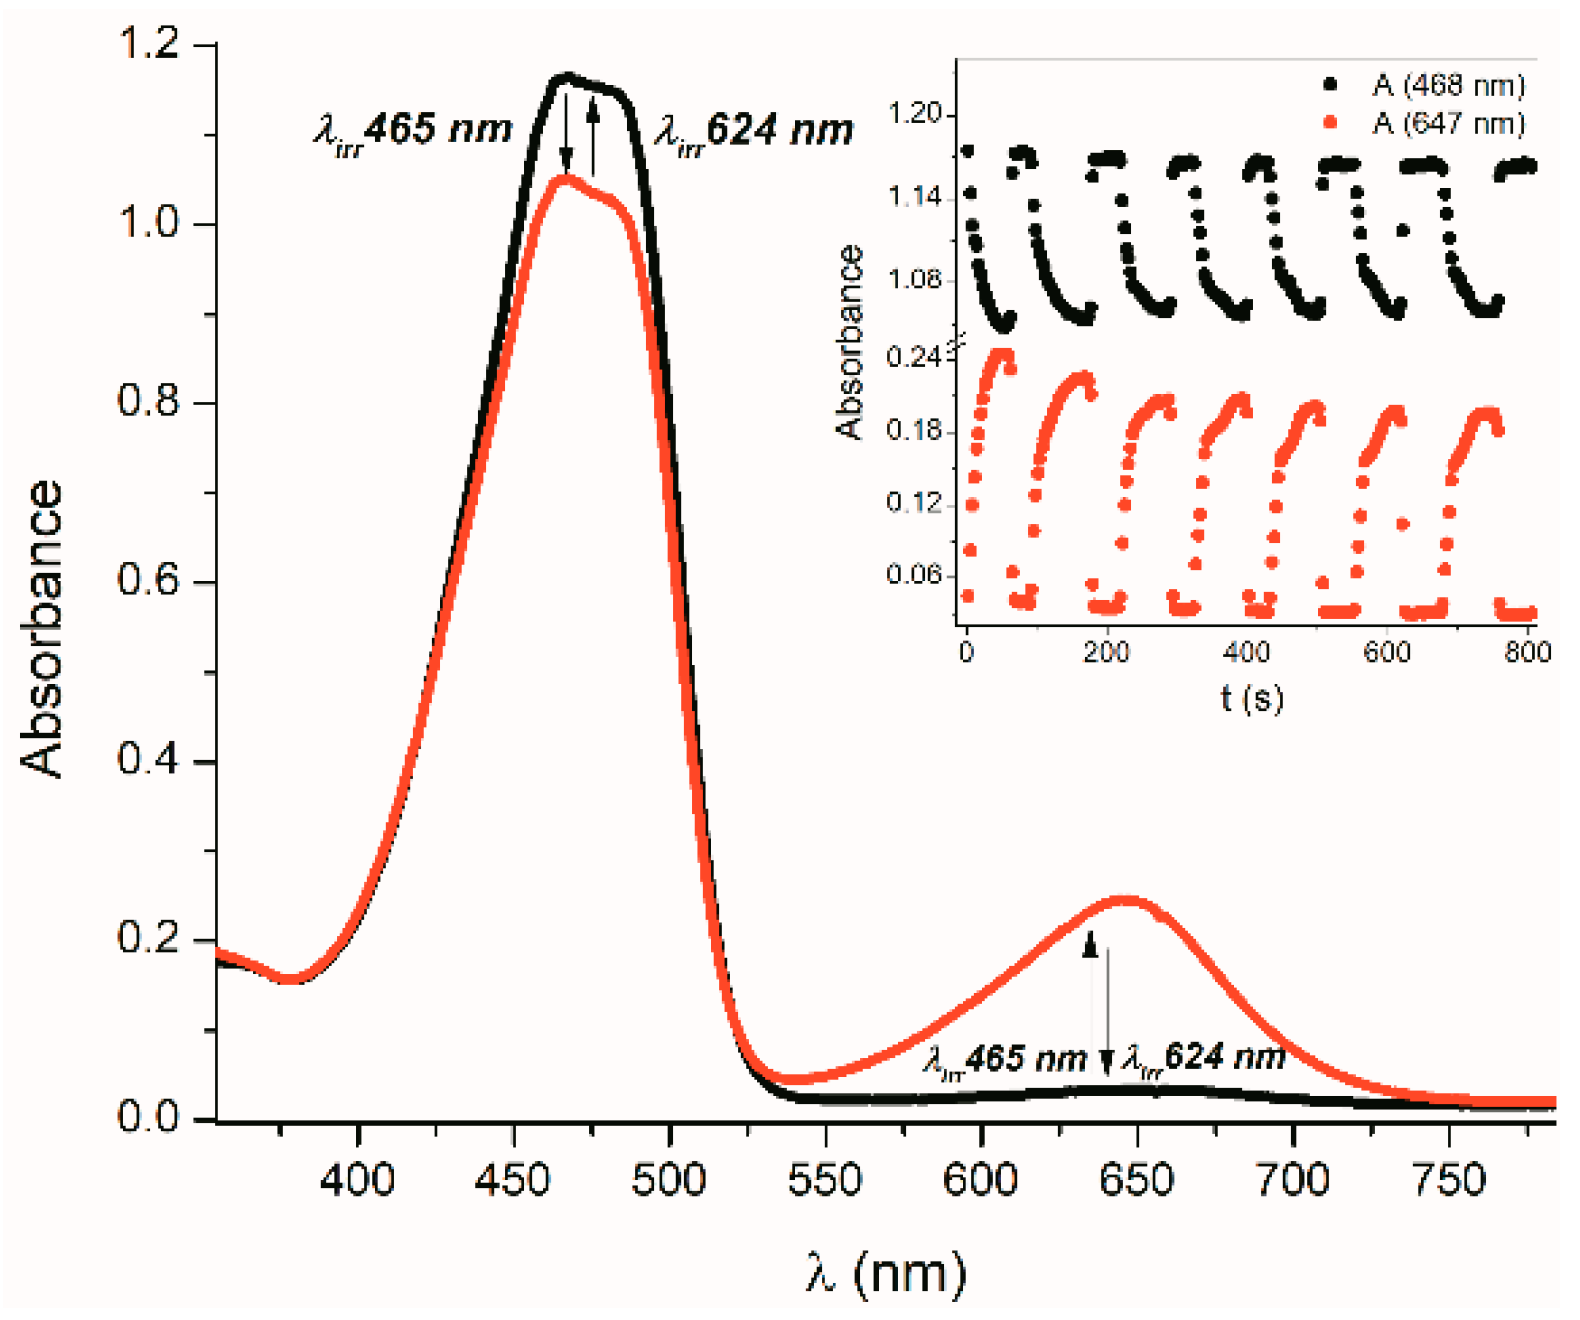
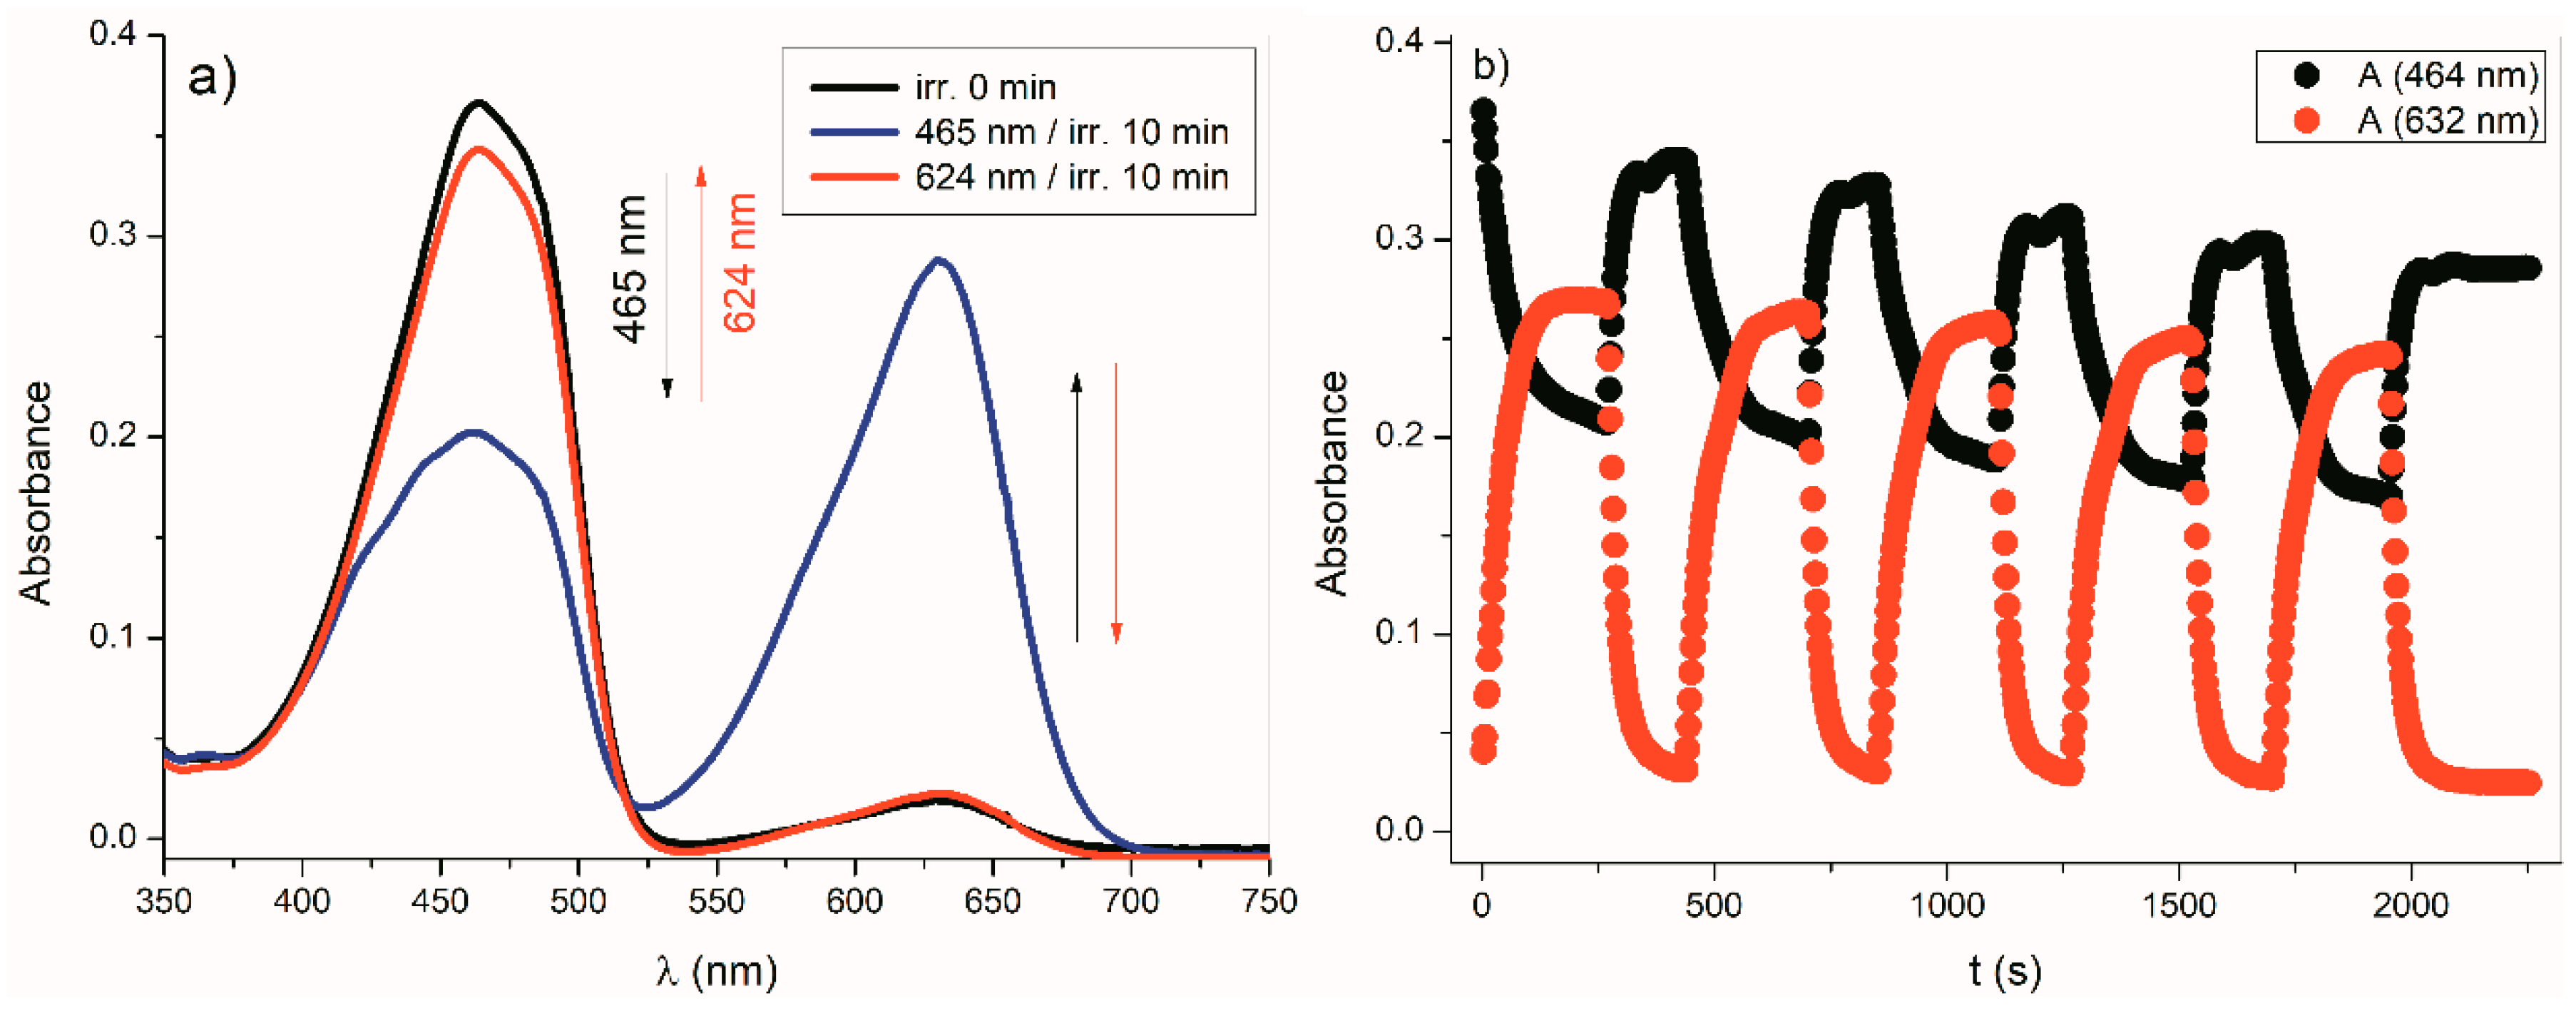
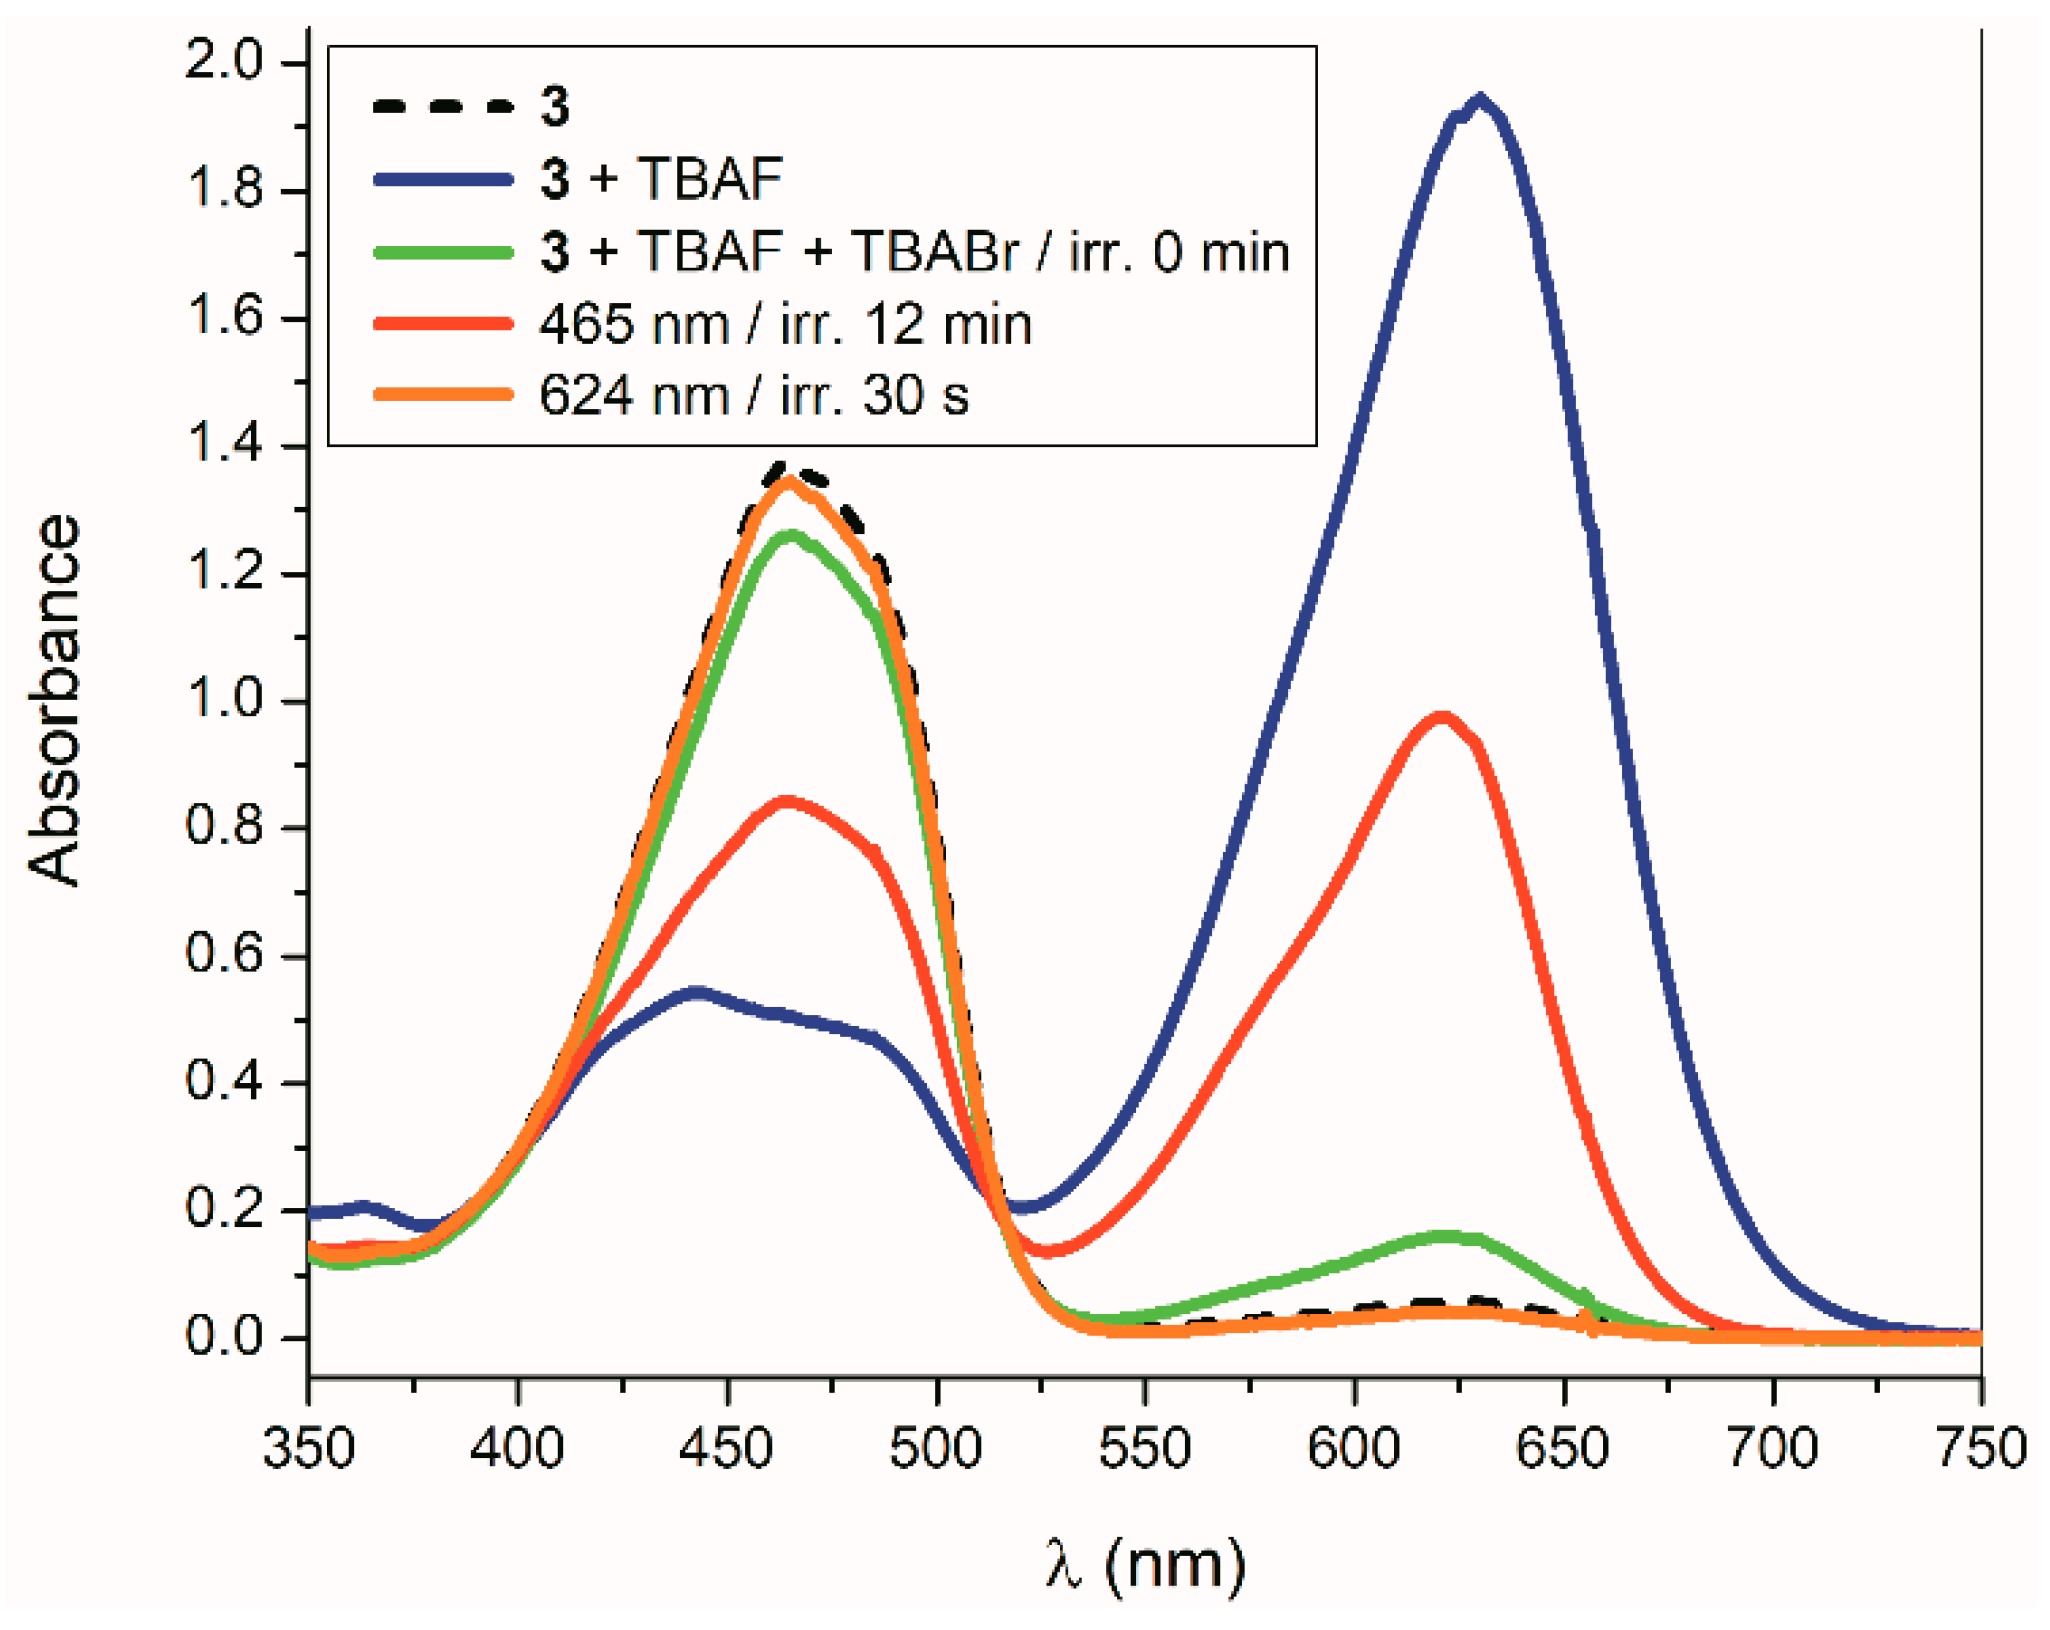
2.5. Light-Stimulated Isatin 1,8-Naphthalimide Hydrazones ON/OFF Properties or the System Isatin 1,8-Naphthalimide Hydrazone + Anions
3. Materials and Methods
3.1. General Information
3.2. Synthesis
3.3. Spectroscopic Measurements
3.4. HPLC Chromatography
4. Conclusions
Supplementary Materials
Author Contributions
Funding
Conflicts of Interest
References
- Cigáň, M.; Gáplovský, M.; Jakusová, K.; Donovalová, J.; Horváth, M.; Filo, J.; Gáplovský, A. Isatin N2-diphenylhydrazones: New easily synthesized Vis-Vis molecular photoswitches. RSC Adv. 2015, 5, 62449–62459. [Google Scholar] [CrossRef]
- Cigáň, M.; Jakusovsá, K.; Gáplovský, M.; Donovalová, J.; Filo, J.; Gáplovský, A. Isatin phenylhydrazones: Anion enhanced photochromic behavior. Photochem. Photobiol. Sci. 2015, 14, 2064–2073. [Google Scholar] [CrossRef] [PubMed]
- Horváth, M.; Cigáň, M.; Filo, J.; Jakusová, K.; Gáplovský, M.; Šandrik, R.; Gáplovský, A. Isatin pentafluorophenylhydrazones: Interesting conformational change during anion sensing. RSC Adv. 2016, 6, 109742–109750. [Google Scholar] [CrossRef]
- Tian, H.; Xu, T.; Zhao, Y.; Chen, K. Two-path photo-induced electron transfer in naphthalimide-based model compound. J. Chem. Soc. Perkin Trans. 1999, 2, 545–550. [Google Scholar] [CrossRef]
- De Silva, A.P.; Rice, T.E. A small supramolecular system which emulates the unidirectional, path-selective photoinduced electron transfer (PET) of the bacterial photosynthetic reaction centre (PRC). Chem. Commun. 1999, 163–164. [Google Scholar] [CrossRef]
- Liu, X.L.; Du, X.J.; Dai, C.G.; Song, Q.H. Ratiometric Two-Photon Fluorescent Probes for Mitochondrial Hydrogen Sulfide in Living Cells. J. Org. Chem. 2014, 79, 9481–9489. [Google Scholar] [CrossRef] [PubMed]
- Manjare, S.T.; Kim, Y.; Churchill, D.G. Selenium- and Tellurium-Containing Fluorescent Molecular Probes for the Detection of Biologically Important Analytes. Acc. Chem. Res. 2014, 47, 2985–2988. [Google Scholar] [CrossRef]
- Wu, W.; Guo, H.; Wu, W.; Ji, S.; Zhao, J. Long-Lived Room Temperature Deep-Red/Near-IR Emissive Intraligand Triplet Excited State (3IL) of Naphthalimide in Cyclometalated Platinum(II) Complexes and Its Application in Upconversion. Inorg. Chem. 2011, 50, 11446–11460. [Google Scholar] [CrossRef] [PubMed]
- Xiao, P.; Dumur, F.; Graff, B.; Gigmes, D.; Fouassier, J.P.; Lalevée, J. Blue Light Sensitive Dyes for Various Photopolymerization Reactions: Naphthalimide and Naphthalic Anhydride Derivatives. Macromolecules 2014, 47, 601–608. [Google Scholar] [CrossRef]
- Li, X.; Zhou, Y.; Zhang, Y.; Son, Y.A. Investigation of a Naphthalimide Based OH– Sensor with Quinoline Attached. Mol. Cryst. Liq. Cryst. 2015, 622, 84–93. [Google Scholar] [CrossRef]
- Wang, C.; Feng, S.; Feng, S.; Wu, L.; Yan, S.; Zhong, C.; Guo, P.; Huang, R.; Weng, X.; Zhou, X. A new fluorescent turn-on probe for highly sensitive and selective detection of sulfite and bisulfite. Sens. Actuators B 2014, 190, 792–799. [Google Scholar] [CrossRef]
- Wang, P.; Liu, J.; Lv, X.; Liu, Y.; Zhao, Y.; Guo, W. A Naphthalimide-Based Glyoxal Hydrazone for Selective Fluorescence Turn-On Sensing of Cys and Hcy. Org. Lett. 2012, 14, 520–523. [Google Scholar] [CrossRef] [PubMed]
- Jiang, J.; Jiang, H.; Liu, W.; Tang, X.; Zhou, X.; Liu, W.; Liu, R. A Colorimetric and Ratiometric Fluorescent Probe for Palladium. Org. Lett. 2011, 13, 4922–4925. [Google Scholar] [CrossRef] [PubMed]
- Spangler, C.W. Recent development in the design of organic materials for optical power limiting. J. Mater. Chem. 1999, 9, 2013–2020. [Google Scholar] [CrossRef]
- Zhang, G.F.; Aldred, M.P.; Gong, W.L.; Li, C.; Zhu, M.Q. Utilising tetraphenylethene as a dual activator for intramolecular charge transfer and aggregation induced emission. Chem. Commun. 2012, 48, 7711–7713. [Google Scholar] [CrossRef] [PubMed]
- Tian, Y.; Su, F.; Weber, W.; Nandakumar, V.; Shumway, B.R.; Jin, Y.; Zhou, X.; Holl, M.R.; Johnson, R.H.; Meldrum, D.R. A series of naphthalimide derivatives as intra and extracellular pH sensors. Biomaterials 2010, 31, 7411–7422. [Google Scholar] [CrossRef] [PubMed] [Green Version]
- Gan, J.; Tian, H.; Wang, Z.; Chen, K.; Hill, J.; Lane, P.A.; Rahn, M.D.; Fox, A.M.; Bradley, D.D.C. Synthesis and luminescence properties of novel ferrocene–naphthalimides dyads. J. Organomet. Chem. 2002, 645, 168–175. [Google Scholar] [CrossRef]
- Guha, S.; Saha, S. Fluoride Ion Sensing by an Anion-π Interaction. J. Am. Chem. Soc. 2010, 132, 17674–17677. [Google Scholar] [CrossRef]
- Cheshmedzhieva, D.; Ivanova, P.; Stoyanov, S.; Tasheva, D.; Dimitrova, M.; Ivanov, I.; Illieva, S. Experimental and theoretical study on the absorption and fluorescence properties of substituted aryl hydrazones of 1,8-naphthalimide. Phys. Chem. Chem. Phys. 2011, 13, 18530–18538. [Google Scholar] [CrossRef]
- Zhang, W.; Xu, Y.; Hanif, M.; Zhang, S.; Zhou, J.; Hu, D.; Xie, D.; Ma, Y. Enhancing Fluorescence of Naphthalimide Derivatives by Suppressing the Intersystem Crossing. J. Phys. Chem. C 2017, 121, 23218–23223. [Google Scholar] [CrossRef]
- Tarai, A.; Baruah, J.B. Changing π-Interactions and Conformational Adjustments of N-(Isonicotinylhydrazide)-1,8-naphthalimide by Hydration and Complexation Affect Photophysical Properties. Cryst. Growth Des. 2018, 18, 456–465. [Google Scholar] [CrossRef]
- Gu, P.; Xu, X.; Zhou, F.; Zhao, T.; Ye, G.; Liu, G.; Xu, Q.; Ge, J.; Xu, Q.; Lu, J. Study of Linear and Nonlinear Optical Properties of Four Derivatives of Substituted Aryl Hydrazones of 1,8-Naphthalimide. Chin. J. Chem. 2014, 32, 205–211. [Google Scholar] [CrossRef]
- Tisovský, P.; Šandrik, R.; Horváth, M.; Donovalová, J.; Gáplovský, M.; Jakusová, K.; Cigáň, M.; Sokolík, R.; Gáplovský, A. Effect of structure on charge distribution in the Isatin Anions in aprotic environment: Spectral study. Molecules 2017, 22, 1961. [Google Scholar] [CrossRef] [PubMed]
- Mati, S.S.; Chall, S.; Bhattacharya, S.C. Aggregation-Induced Fabrication of Fluorescent Organic Nanorings: Selective Biosensing of Cysteine and Application to Molecular Logic Gate. Langmuir 2015, 31, 5025–5032. [Google Scholar] [CrossRef]
- Saha, S.; Samanta, A. Influence of the Structure of the Amino Group and Polarity of the Medium on the Photophysical Behavior of 4-Amino-1,8-naphthalimide Derivatives. J. Phys. Chem. A 2002, 106, 4763–4771. [Google Scholar] [CrossRef]
- Pike, S.J.; Hutchinson, J.J.; Hunter, C.A. H-Bond Acceptor Parameters for Anions. J. Am. Chem. Soc. 2017, 139, 6700–6706. [Google Scholar] [CrossRef] [PubMed]
- Chereddy, N.R.; Nagaraju, P.; Raju, M.V.N.; Saranraj, K.; Thennarasu, S.; Rao, V.J. A two fluorophore embedded probe for collective and ratiometric detection of Hg2+ and F− ions. Dyes Pigment. 2015, 112, 201–209. [Google Scholar] [CrossRef]
Sample Availability: Samples of the compounds 1–5 are available from the authors. |


| Compound | UV-VIS | Fluorescence | |||
|---|---|---|---|---|---|
| DMF | CHCl3 | DMF | CHCl3 | ||
| λ1 (nm) | λ2 (nm) | λ (nm) | λ (nm) | λ (nm) | |
| 1 Z | 463 | 634 | 464 | 532/exc.465 686/exc.630 | 533/exc. 465 -/exc.630 |
| 2 Z | 468 | 645 | 468 | 553/exc.465 | -/exc.465 |
| 3 Z | 462 | 625 | 464 | 544/exc.465 688/exc.630 | 564/exc.465 687/exc.630 |
| 4 Z | 460 | 625 | 464 | 537/exc.465 687/exc.630 | 556/exc.465 -/exc.630 |
| 5 Z | 474 | 650 * | 468 486 ** | 532/exc.465 -/exc.630 | 537,558 **/exc.465 -/exc.630 |
| Compound | CHCl3 | DMF |
|---|---|---|
| Z/E | Z/E | |
| 1 | 1.1 | 3.5 |
| 3 | 3.3 | 5.9 |
| 4 | 16.2 | 18.1 |
| 5 | 1.9 | 11.4 |
| Compound | ΦF | τ1[ns] | % | τ2[ns] | % | τ3[ns] | % | χ2 | |
|---|---|---|---|---|---|---|---|---|---|
1 | DMF | 0.04 | 0.028 | 23.5 | 3.41 | 48.9 | 9.02 | 27.6 | 1.3 |
| CHCl3 | - | 0.06 | 76.9 | - | - | 7.44 | 23.1 | 1.34 | |
| CH3OH | 0.03 | 0.04 | 53.7 | 3.7 | 15.7 | 9.03 | 30.6 | 1.4 | |
2 | DMF | <0.01 | 0.04 | 37 | 3.2 | 52.5 | 10.6 | 10.5 | 1.13 |
| CH3OH | <0.01 | 0.08 | 27.3 | 0.98 | 33.5 | 6.1 | 39.1 | 1.26 | |
3 | DMF | <0.01 | 0.03 | 20. 1 | 3.51 | 13.3 | 8.78 | 66.6 | 1.48 |
| CHCl3 | - | 0.1 | 59.1 | - | - | 8.9 | 40.9 | - | |
| CH3OH | <0.01 | 0.14 | 61.2 | 2.87 | 8.1 | 8.88 | 30.7 | 1.16 | |
4 | DMF | <0.01 | 0.12 | 7.1 | 4.73 | 24.7 | 9.16 | 68.2 | 1.03 |
| CH3OH | 0.03 | 0.25 | 19.9 | 3.42 | 18.9 | 7.89 | 61.2 | 1.26 | |
5 | DMF | <0.01 | 0.07 | 32.3 | - | - | 8.2 | 63.7 | 1.16 |
| CHCl3 | - | 0.28 | 93.4 | - | - | 8.3 | 6.6 | - | |
| CH3OH | 0.02 | 0.12 | 73.4 | - | - | 7.5 | 26.6 | 1.18 |
| Compound | 3σ/S F− (mol·dm−3) | 10σ/S F− (mol·dm−3) | 3σ/S CH3COO− (mol·dm−3) | 10σ/S CH3COO− (mol·dm−3) |
|---|---|---|---|---|
| 1 | 4.7 × 10⁻⁷ | 1.6 × 10⁻⁶ | 1.8 × 10⁻⁶ | 6.0 × 10⁻⁶ |
| 2 | 1.7 × 10⁻⁶ | 5.7 × 10⁻⁶ | 1.3 × 10⁻⁶ | 4.4 × 10⁻⁶ |
| 3 | 3.3 × 10⁻⁸ | 1.1 × 10⁻⁷ | 2.0 × 10⁻⁷ | 6.6 × 10⁻⁷ |
| 4 | 8.3 × 10⁻⁸ | 2.8 × 10⁻⁷ | 8.5 × 10⁻⁸ | 2.8 × 10⁻⁷ |
| 5 | 8.3 × 10⁻⁷ | 2.8 × 10⁻⁶ | 2.9 × 10⁻⁶ | 9.7 × 10⁻⁶ |
© 2019 by the authors. Licensee MDPI, Basel, Switzerland. This article is an open access article distributed under the terms and conditions of the Creative Commons Attribution (CC BY) license (http://creativecommons.org/licenses/by/4.0/).
Share and Cite
Tisovský, P.; Horváth, M.; Csicsai, K.; Donovalová, J.; Filo, J.; Cigáň, M.; Sokolík, R.; Addová, G.; Gáplovský, A. Isatin-1,8-Naphthalimide Hydrazones: A Study of Their Sensor and ON/OFF Functionality. Molecules 2019, 24, 397. https://doi.org/10.3390/molecules24030397
Tisovský P, Horváth M, Csicsai K, Donovalová J, Filo J, Cigáň M, Sokolík R, Addová G, Gáplovský A. Isatin-1,8-Naphthalimide Hydrazones: A Study of Their Sensor and ON/OFF Functionality. Molecules. 2019; 24(3):397. https://doi.org/10.3390/molecules24030397
Chicago/Turabian StyleTisovský, Pavol, Miroslav Horváth, Klaudia Csicsai, Jana Donovalová, Juraj Filo, Marek Cigáň, Róbert Sokolík, Gabriela Addová, and Anton Gáplovský. 2019. "Isatin-1,8-Naphthalimide Hydrazones: A Study of Their Sensor and ON/OFF Functionality" Molecules 24, no. 3: 397. https://doi.org/10.3390/molecules24030397