Article

Symmetrical Heterocyclic Cage Skeleton: Synthesis, Urease Inhibition Activity, Kinetic Mechanistic Insight, and Molecular Docking Analyses

1
State Key Laboratory for Modification of Chemicals Fibers and Polymer Materials, College of Chemistry, Chemical Engineering and Biotechnology, Donghua University, Shanghai 201620, China
2
Department of Chemistry, GC University Faisalabad, Sub campus Layyah 31200, Pakistan
3
Department of Physiology and Biochemistry, Cholistan University of Veterinary and Animal Sciences, Bahawalpur 63100, Pakistan
4
College of Natural Science, Department of Biology, Kongju National University, Gongju, Chungcheongnam 32588, Korea
5
Department of Chemistry, University of Sargodha, Sub-campus Bhakkar 30000, Pakistan
*
Authors to whom correspondence should be addressed.
Molecules 2019, 24(2), 312; https://doi.org/10.3390/molecules24020312
Submission received: 7 December 2018 / Revised: 8 January 2019 / Accepted: 10 January 2019 / Published: 16 January 2019

Abstract

:
The present study focuses on the design and synthesis of a cage-like organic skeleton containing two triazole rings jointed via imine linkage. These molecules can act as urease inhibitors. The in-vitro urease inhibition screening results showed that the combination of the two triazole skeleton in the cage-like morphology exhibited comparable urease inhibition activity to that of the reference thiourea while the metallic complexation, especially with copper, nickel, and palladium, showed excellent activity results with IC50 values of 0.94 ± 0.13, 3.71 ± 0.61, and 7.64 ± 1.21 (3ac), and 1.20 ± 0.52, 3.93 ± 0.45, and 12.87 ± 2.11 µM (4ac). However, the rest of compounds among the targeted series exhibited a low to moderate enzyme inhibition potential. To better understand the compounds’ underlying mechanisms of the inhibitory effect (3a and 4a) and their most active metal complexes (3b and 4b), we performed an enzymatic kinetic analysis using the Lineweaver–Burk plot in the presence of different concentrations of inhibitors to represent the non-competitive inhibition nature of the compounds, 3a, 4a, and 4b, while mixed type inhibition was represented by the compound, 3b. Moreover, molecular docking confirmed the binding interactive behavior of 3a within the active site of the target protein.

1. Introduction

The development of competitive and non-competitive enzyme inhibitors based on a metalloskeleton has attracted wide interest of the scientific community because metal ions are found in the active sites of a large number of metalloproteins, such as hemocyanin, and also in metalloenzymes, like ureases, tyrosinase, laccase, and ascorbate oxidase [1,2,3,4,5,6,7,8]. The enzyme inhibition by the metallocompouds is due to the reaction of the organic skeleton as well as the transition metal ions with the sulfhydryl group in the active center of the enzyme [9]. Urease action results in an elevation of pH, which exerts harmful effects where it occurs whether in soil or inside the human body [10].
Urease inhibitors contain two general classifications, including pure organic based compounds and organic compounds, in ligation with transition metals, as some transition metals themselves possess a slight urease inhibition potential [11]. The literature survey showed excellent urease inhibition potential for candidates exhibiting hydroxamic acids, phosphoramides, and thiols’ skeleton [12]. Compounds with thiol functional groups inhibit urease competitively in their thiolate anion form, R-S [13]. Imine derivatives of organic compounds have been extensively employed as ligands for several ions, and have been utilized as pigments, catalysts, drugs, and polymer stabilizers [14]. The interested drug candidate can be designed and synthesized via a Schiff base skeleton either through insilico/bioinformatics study or by synthesizing analogues that are structurally close to the reference drug. Some of urease inhibitors cannot be used in vivo because of their toxicity or instability. Thus, seeking novel urease inhibitors with good bioavailability and low toxicity is our main focus [15]. Here, we report the synthesis and urease inhibition evaluation of metal complexes of substituted triazole based Schiff base ligands containing thiols and alcoholic moiety connected to a triazole backbone.

2. Results and Discussion

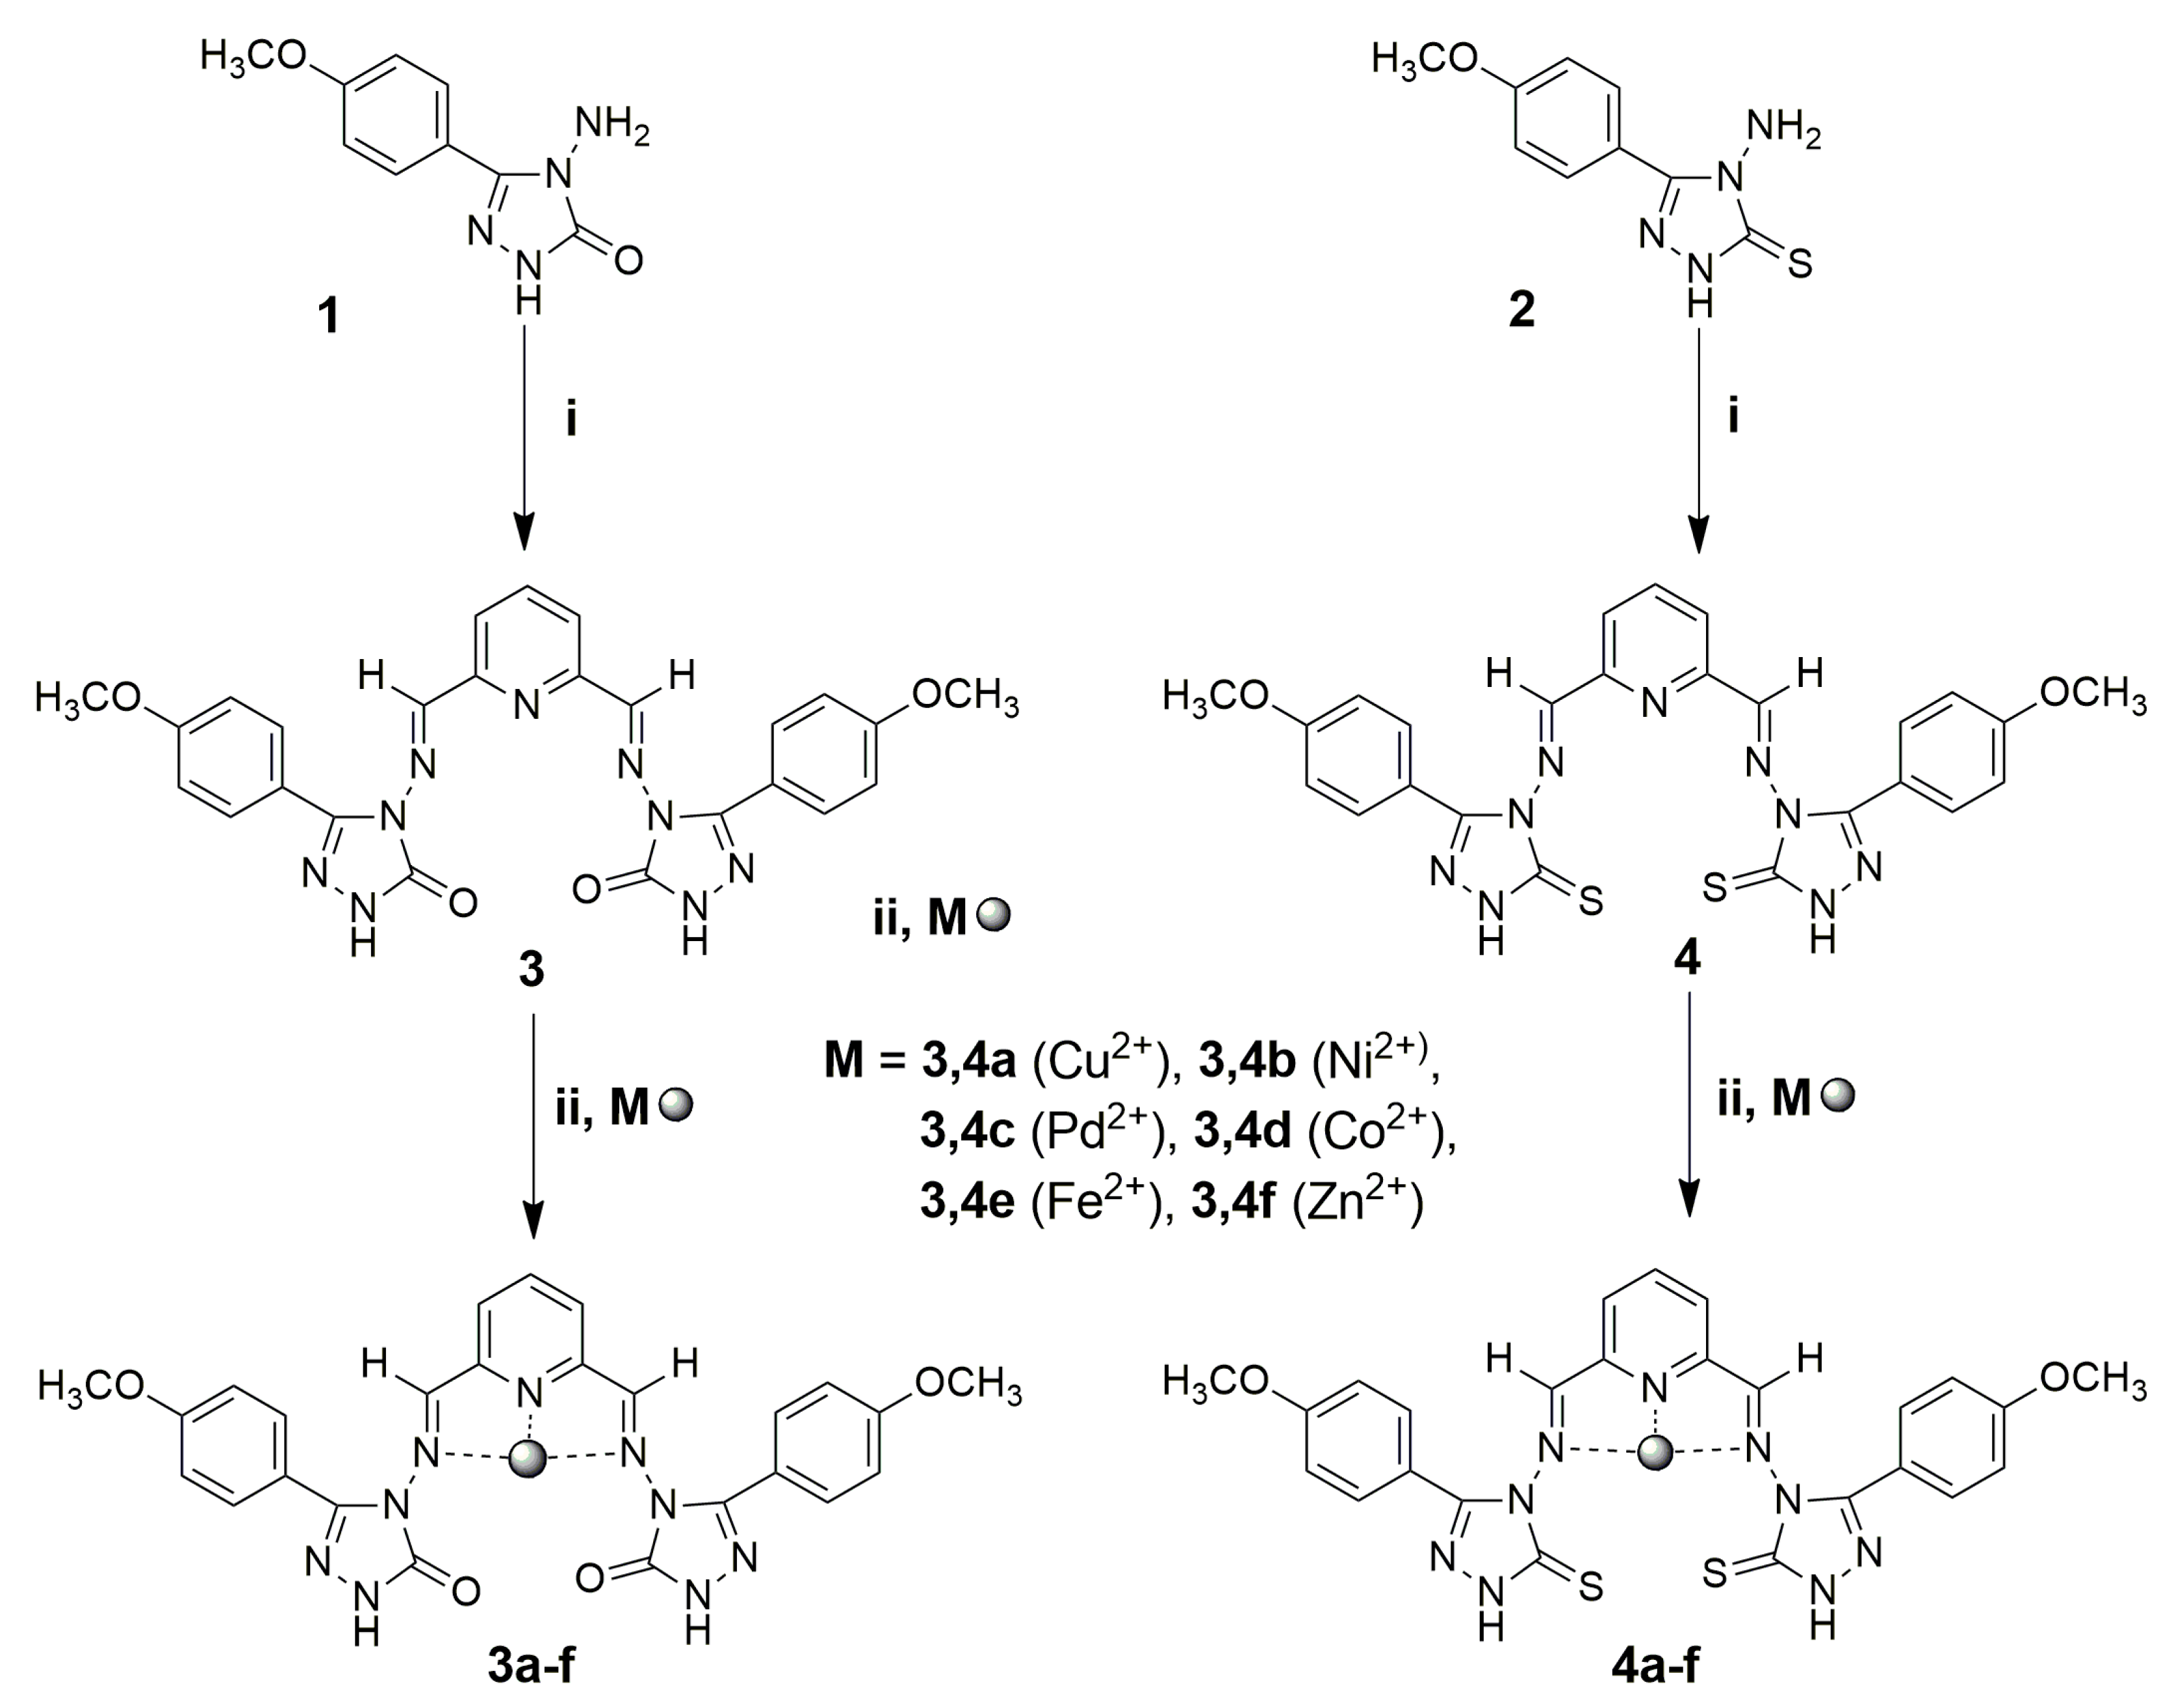
2.1. Synthesis of Schiff Base Ligands 1 and 2

4-Methoxyphenylacetic acid was taken as starting material and then esterified into their aralkylethanoate in the presence of a catalytic amount of sulfuric acid. First, thin layer chromatographic analysis confirmed the ester formation. The acid spot remained at the bottom due to acidic protons in the hydrogen bonding with silica gel while that of ester traveled along with the direction of the solvent front. Secondly, FT-IR spectral measurement by the absence of a hydroxyl signal in the range of 3400–2500 cm−1 further confirmed the esterification reaction. The resulting esters were then converted to their corresponding acid hydrazides by the treatment with hydrazine hydrate in the presence of ethanol as the solvent. The new broad band signal in the range of 3342, 3287, and 3158 cm−1 corresponds to primary and secondary amino group stretching vibrations. Moreover, the resonance effect due to amide functionality exerts partial single bond characters in the carbonyl double bond compared to that of ester, shifting the carbonyl group signal from 1711 to 1674 cm−1. The emergence of signals at 1628 and 1610 cm−1 confirms imines’ synthesis due to the C=N stretching vibration.

2.2. Ligand-Metals Complexation

The ligand-metal complexation causes a shift in the physical appearances of the ligand before and after metal-complexation, corroborated by differences in their melting points. Further, FT-IR analysis showed that both ligands 3 and 4 contain the labile protons, which can stay inside the triazole ring nitrogen atom as well as outside the ring to the oxygen in molecule 3 and sulfur in molecule 4. This protonic shift leads to the existence of the ligand in the tautomeric conformation. Among the tautomers, the keto tautomer seems more stable in comparison to its enol form and the same for compounds exhibiting thiol-thione tautomerism. Therefore, both ligands preferably stayed in the keto (in case of ligand 3) and thione (in case of ligand 4) conformation as indicated in their FT-IR absorption spectral analysis due to the appearance of signals at 1680 and 1272 cm−1 for ligands 3 and 4, respectively. The spectral position for both these ligands shifts to lower frequencies after complexation, evidence for these molecular sites’ involvement during the ligation with metals. Moreover, complete disappearance of the signal at 2500 cm−1 in ligand 4 after metal complexation further confirms sulfur’s participation in metal binding. The similar disappearance of ligand 3’s broad peak at 3468 cm−1 after metal chelation represents the interaction of undersigned oxygen with the transition metal (Table 1). The schematic representations of the synthetic route adopted to obtain the target molecule (3a-f and 4a-f) are given in Scheme 1. The detailed synthetic procedure adopted for the accomplishment of precursors 1 and 2 is inserted in the supporting information.

2.3. Optical Analysis

Ligand synthesis and their ligation with several metals were determined by recording their photophysical parameters via absorption spectral analysis. Ligand 3 showed two absorption bands at 240 and 304 nm while ligand 4 exhibited the maximum absorption at 247 and 292 nm, respectively. Several heteroatoms in the ligands’ red-shifts the absorption wavelength while the pi-electronic transition blue-shifts the wavelength due to a typical longer energy gap between the ground and excited state for labile π-electrons systems. Complexation leads to almost negligible variation in the absorption maxima position due to π-electrons systems. However, ligation caused a red-shift due to non-bonding electrons, which indicates the affiliation of lone pair electrons of heteroatoms toward metals (Table 2).

2.4. Ligand Safety Profiles

The ligand safety was assessed after 4 and 24 h treatment to the cells by MTT [3-(4,5-dimethylthiazol-2-yl)-2,5-diphenyltetrazolium bromide] assay. The results showed no toxicity for L-929 cells at 50 μM ligand concentrations. The safe profile of the ligand towards the living cells might open the ligands’ possibility as bioimaging probes. The safe nature of the triazole skeleton warrants further characterization of the compound.

2.5. Bio-Evaluation

Urease Inhibition Activity

We tested our synthesized compounds, 3a-f and 4a-f, for their inhibitory effects on urease. Besides current urease inhibitors [16], we aimed to investigate the effect of the two triazole ring structure mutually coupled with each other toward urease inhibition as well as to understand the effect of metal complexation toward the bio-profile of the designed nucleus. The in-vitro screening results showed that the combination of the two triazole skeleton in the cage like morphology exhibited comparable urease inhibition potential to that of the reference. The metallic chelation with copper, nickel, and palladium showed inhibition with IC50 values of 0.94 ± 0.13, 3.71 ± 0.61, and 7.64 ± 1.21 (3ac) and 1.20 ± 0.52, 3.93 ± 0.45, and 12.87 ± 2.11 µM (4ac). Copper chelation produced a maximum inhibitory profile possibly due to interactions with the tested protein. The overall bioprofile of oxygen containing the triazole cage and their metal complexes exhibited higher inhibition than the sulfur containing triazole cage and their corresponding metal complexes. In general, iron and zinc compounds displayed the least inhibition, while the cobalt complex fell in the middle (Table 3).

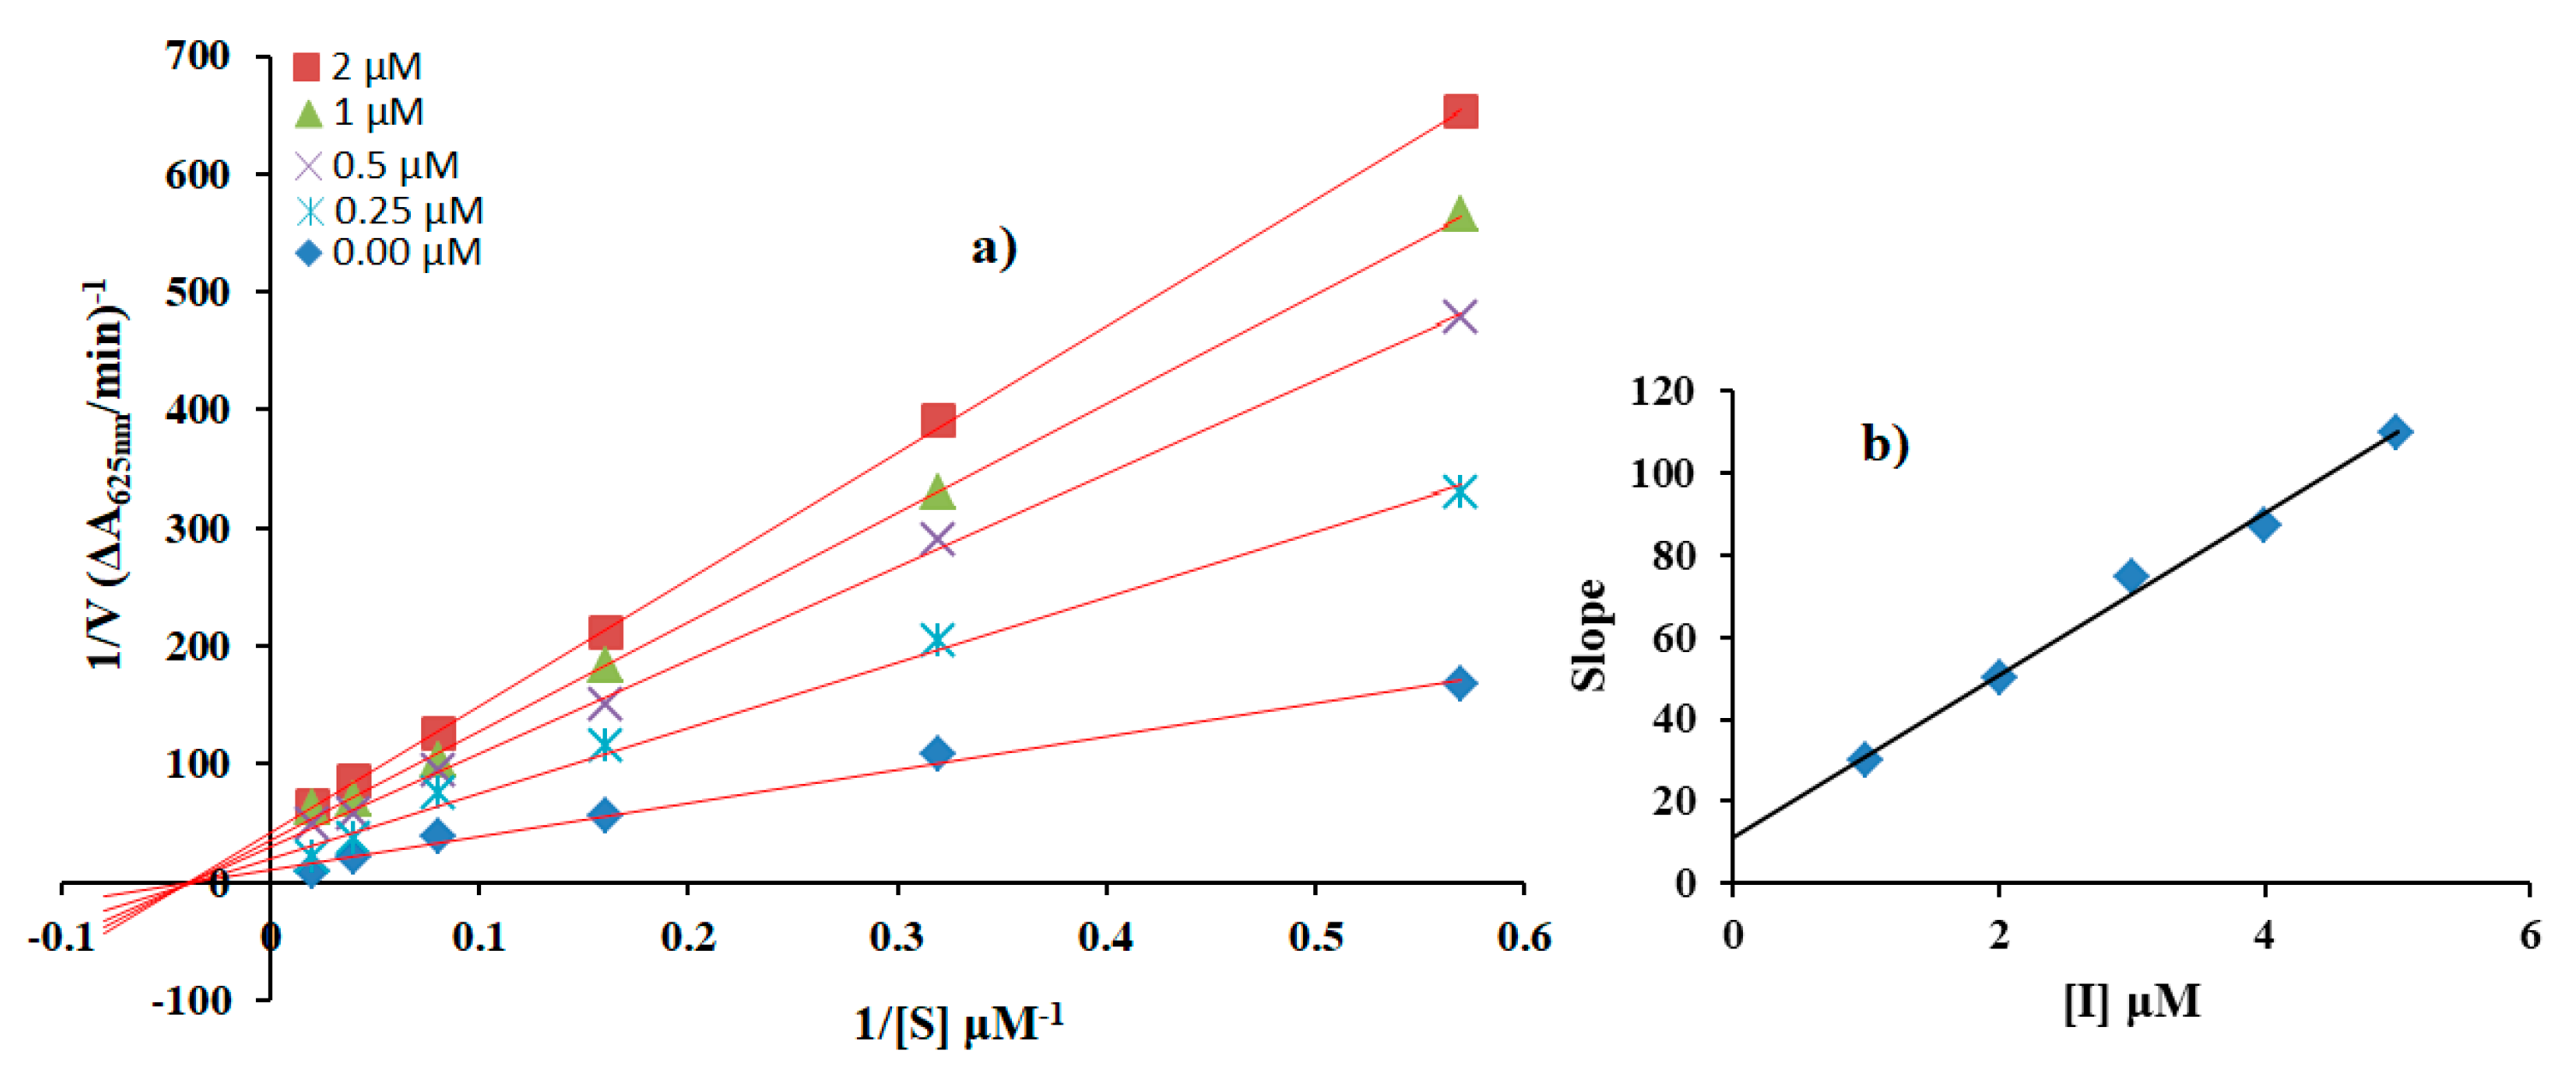
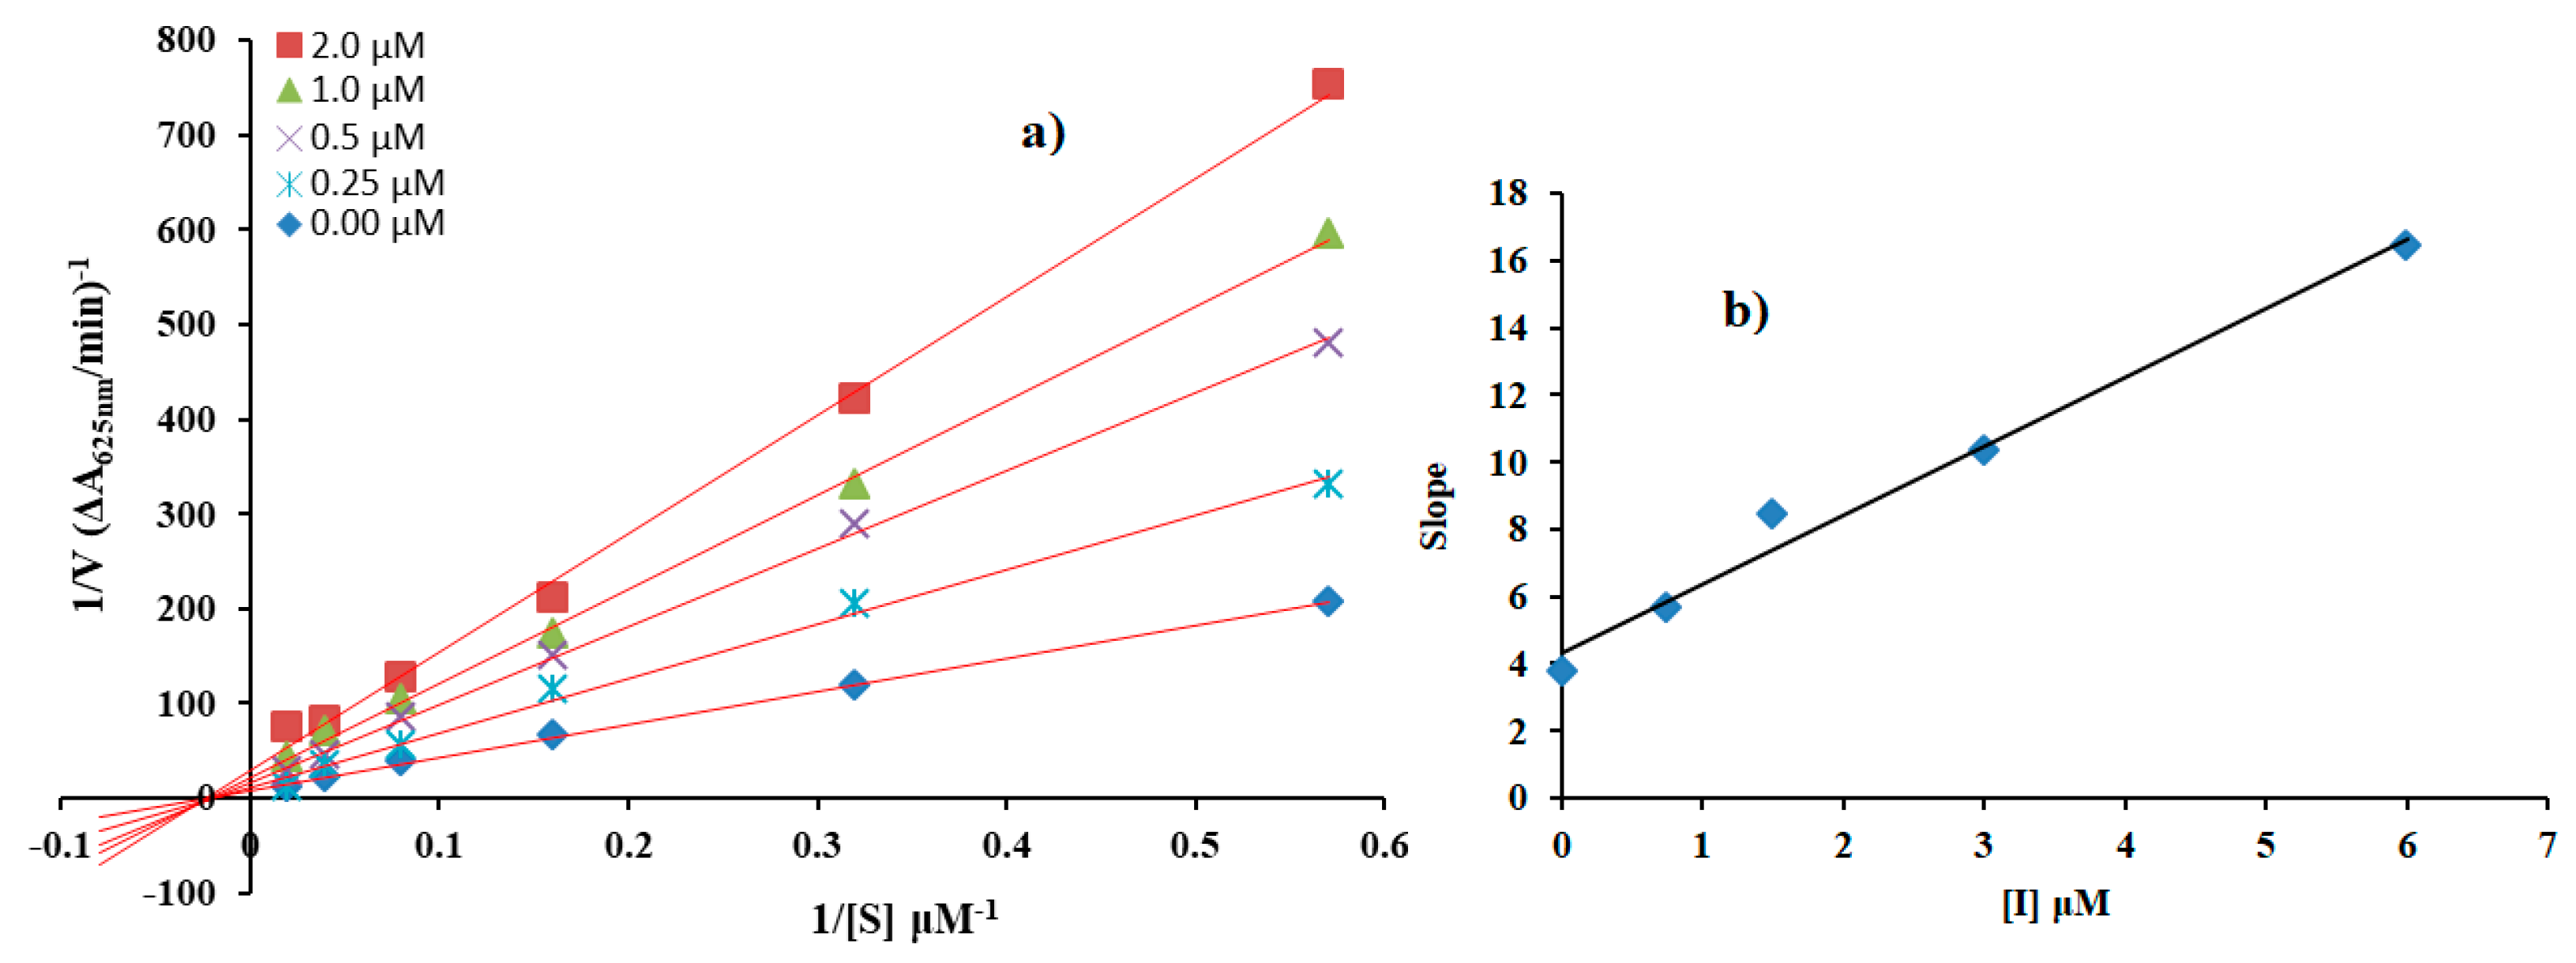
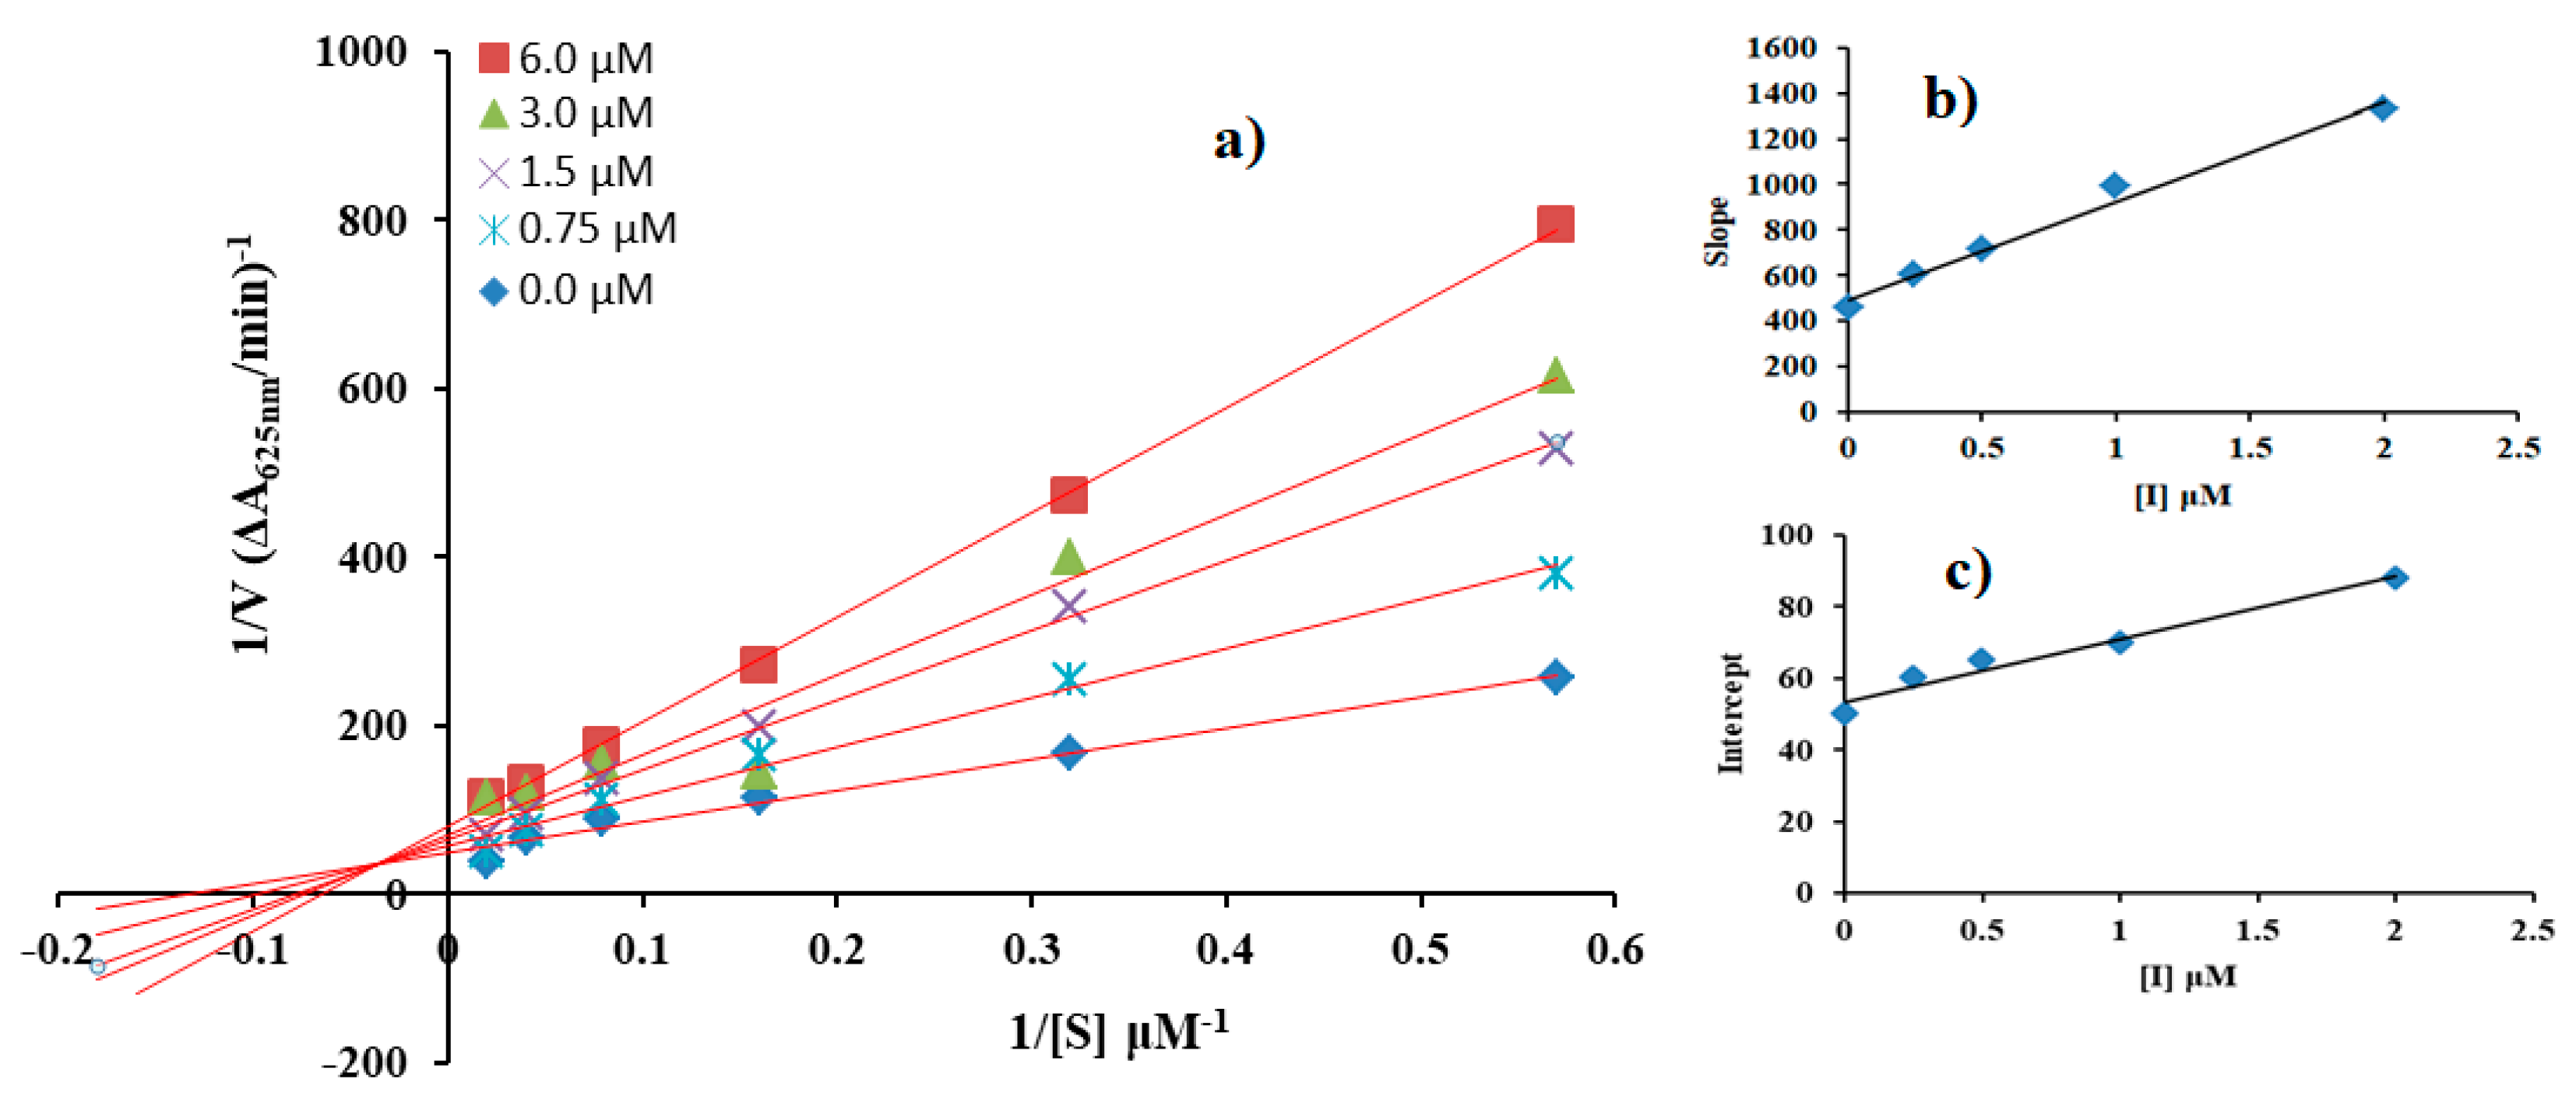
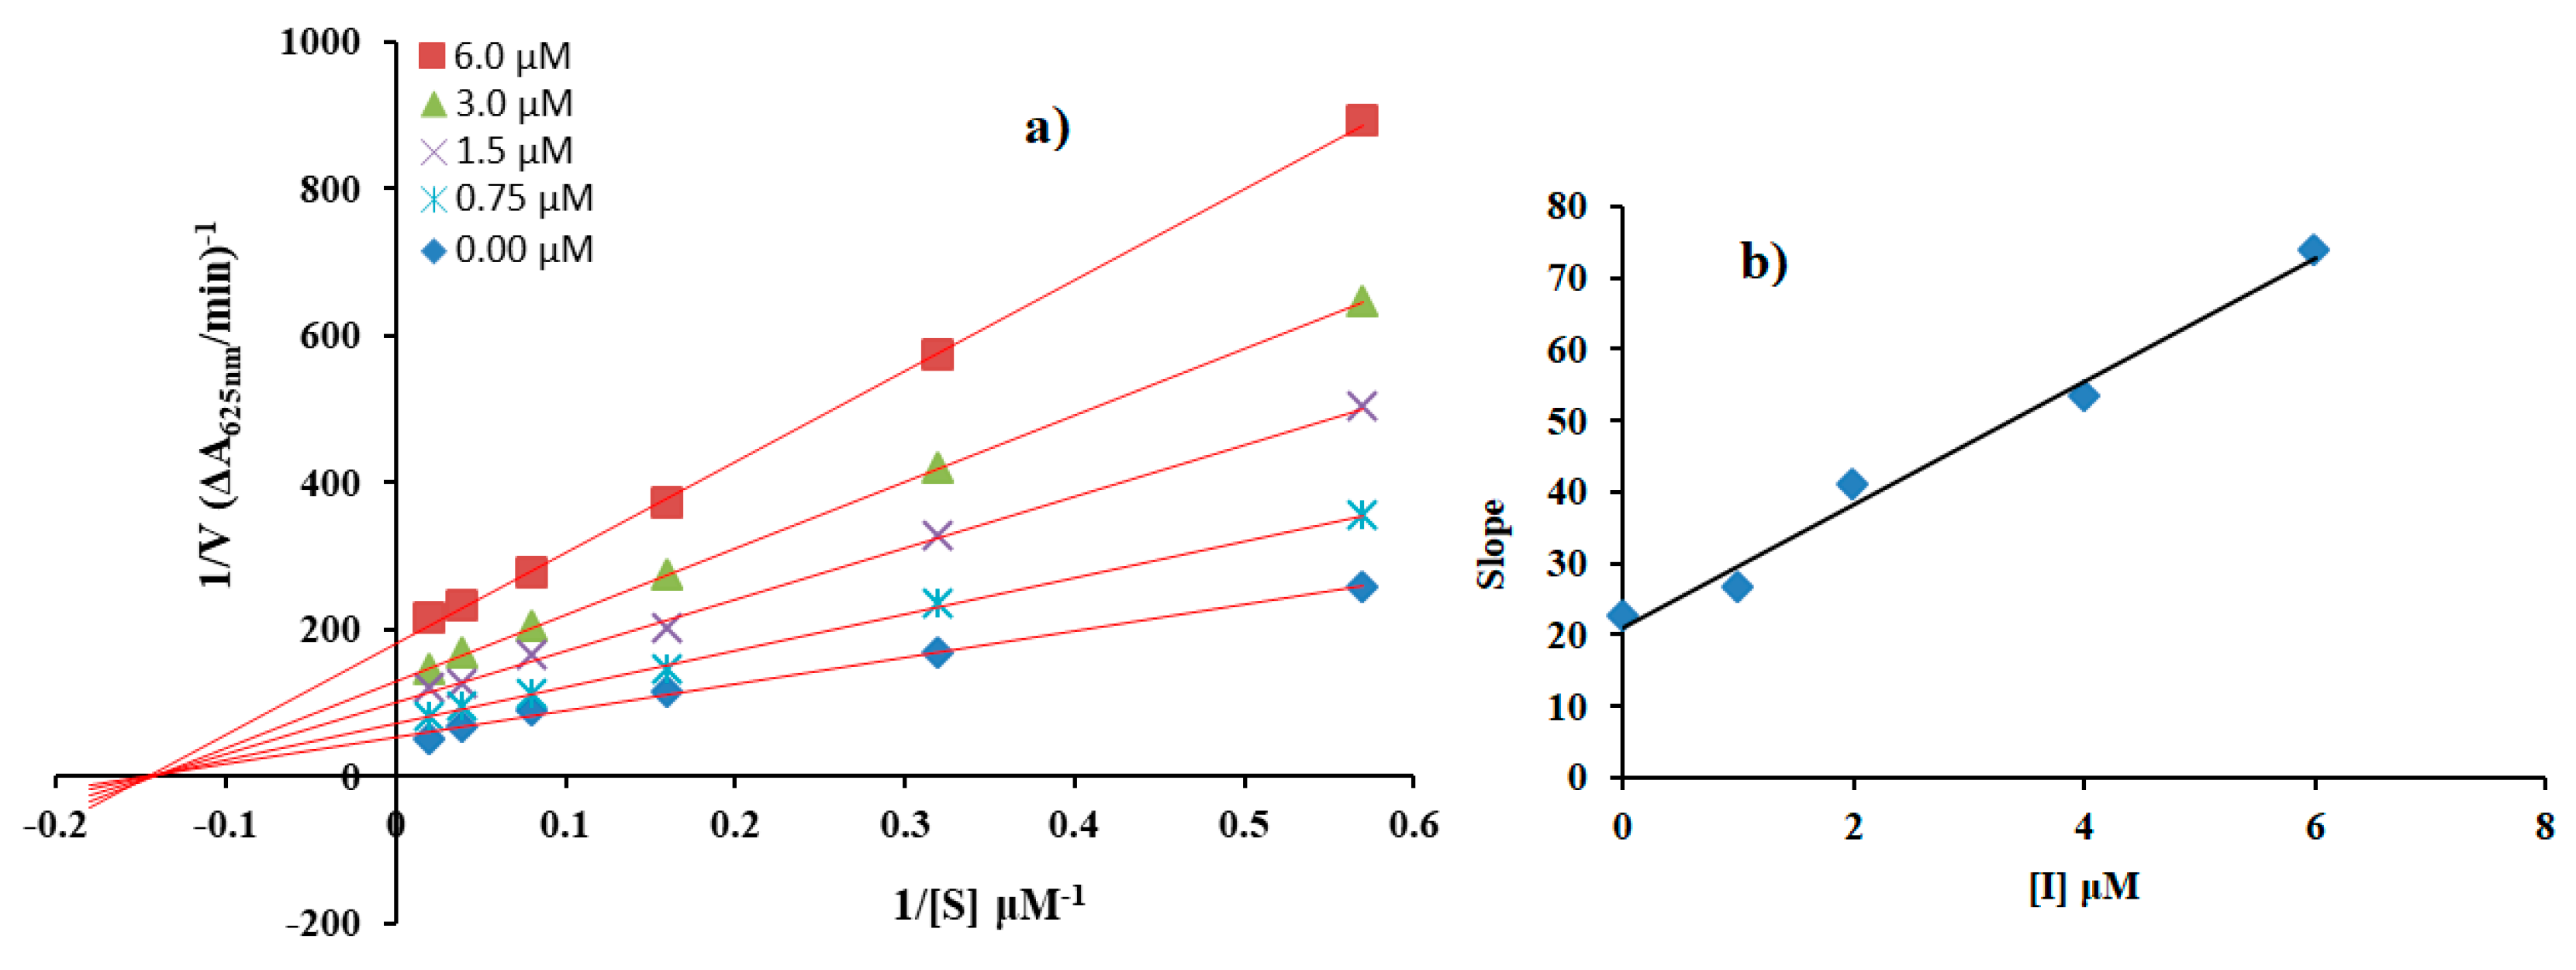
2.6. Mechanism Underlying Inhibitory Effect of Compounds 3a, 4a, 3b, and 4b

Next, we picked compound 3a, 4a, 3b, and 4b for further tests against the urease enzyme to investigate the underlying mechanism. We plotted 1/V versus 1/[S] in the presence of different concentrations of inhibitors, 3a, 4a, 3b, and 4b, using the Lineweaver-Burke plot to study the resulting enzyme kinetics (Figure 1, Figure 2, Figure 3 and Figure 4a,b) show the inhibition constants (Ki) calculated from the Lineweaver-Burke plots. The results showed that compounds 3a, 4a, and 4b behaved as a non-competitive inhibitor (Figure 1, Figure 2 and Figure 4a), which means that 1/Vmax increased while Km remained constant under increasing concentrations of compounds 3a, 4a, and 4b, respectively. This behavior indicated that compounds 3a, 4a, and 4b inhibit urease non-competitively to form enzyme inhibitor (EI) complex [16]. Specifically, data from compound 3b, with an increasing the concentration of the substrate (urea), all intersected within the second quadrant. This result showed that Vmax decreased with increasing Km with increasing concentrations of 3b. This behavior indicated that compound 3b is a mixed type inhibitor with respect to the substrate, urea, with a Ki value of 1.2 µM and a Ki' value of 3.0 µM as shown in Figure 3b,c. The results of the kinetic constants and inhibition constants are summarized in Table 4. The kinetic data is graphically explained in Figure 1, Figure 2, Figure 3 and Figure 4.

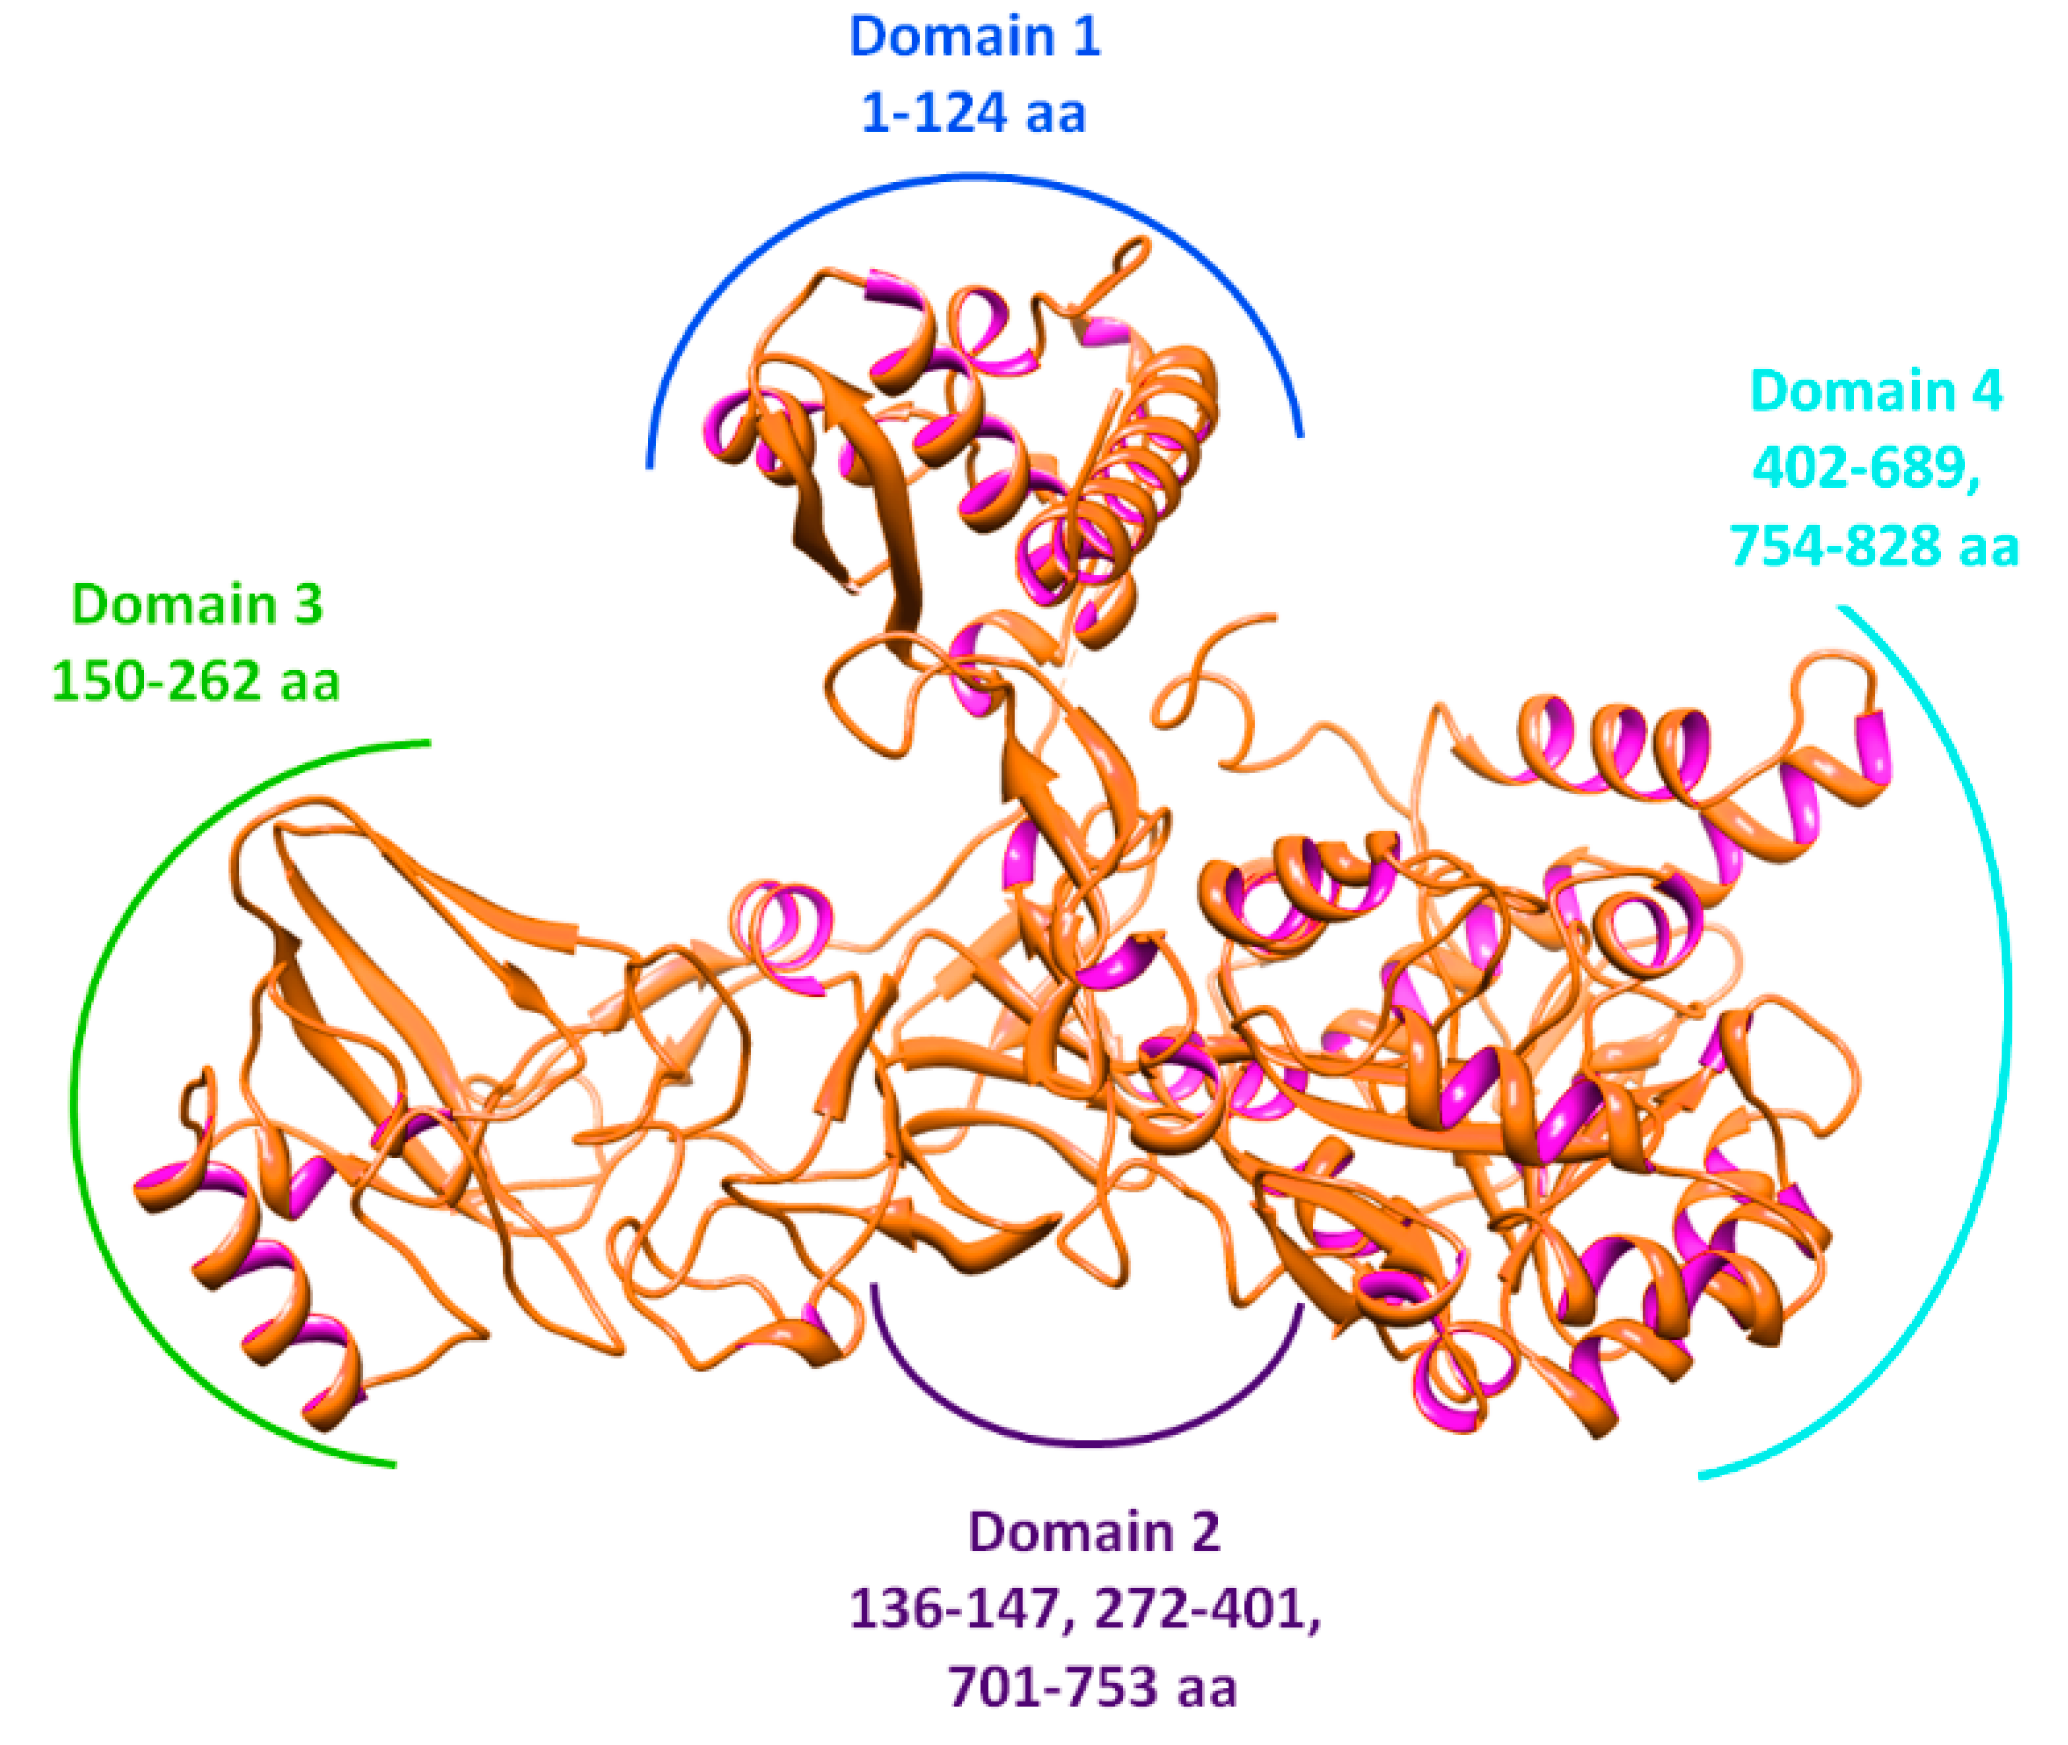
2.7. Structural Assessment of Jack Bean Urease

The metal-containing jack bean urease contains four unique structural domains (Figure 5) [17]. Two nickel atoms coordinate key structural interactions in domain four. Structural data revealed that copper atoms can directly interact with His545, His519, His409, His407, and Asp633 within the active binding pocket of jack bean urease. The VADAR analysis showed that the protein contains 27% helices, 31% β sheets, and 41% coils, while the Ramachandran plot indicated that 97.5% of residues fall in favored regions. The Ramachandran graph is mentioned in the supplementary data.

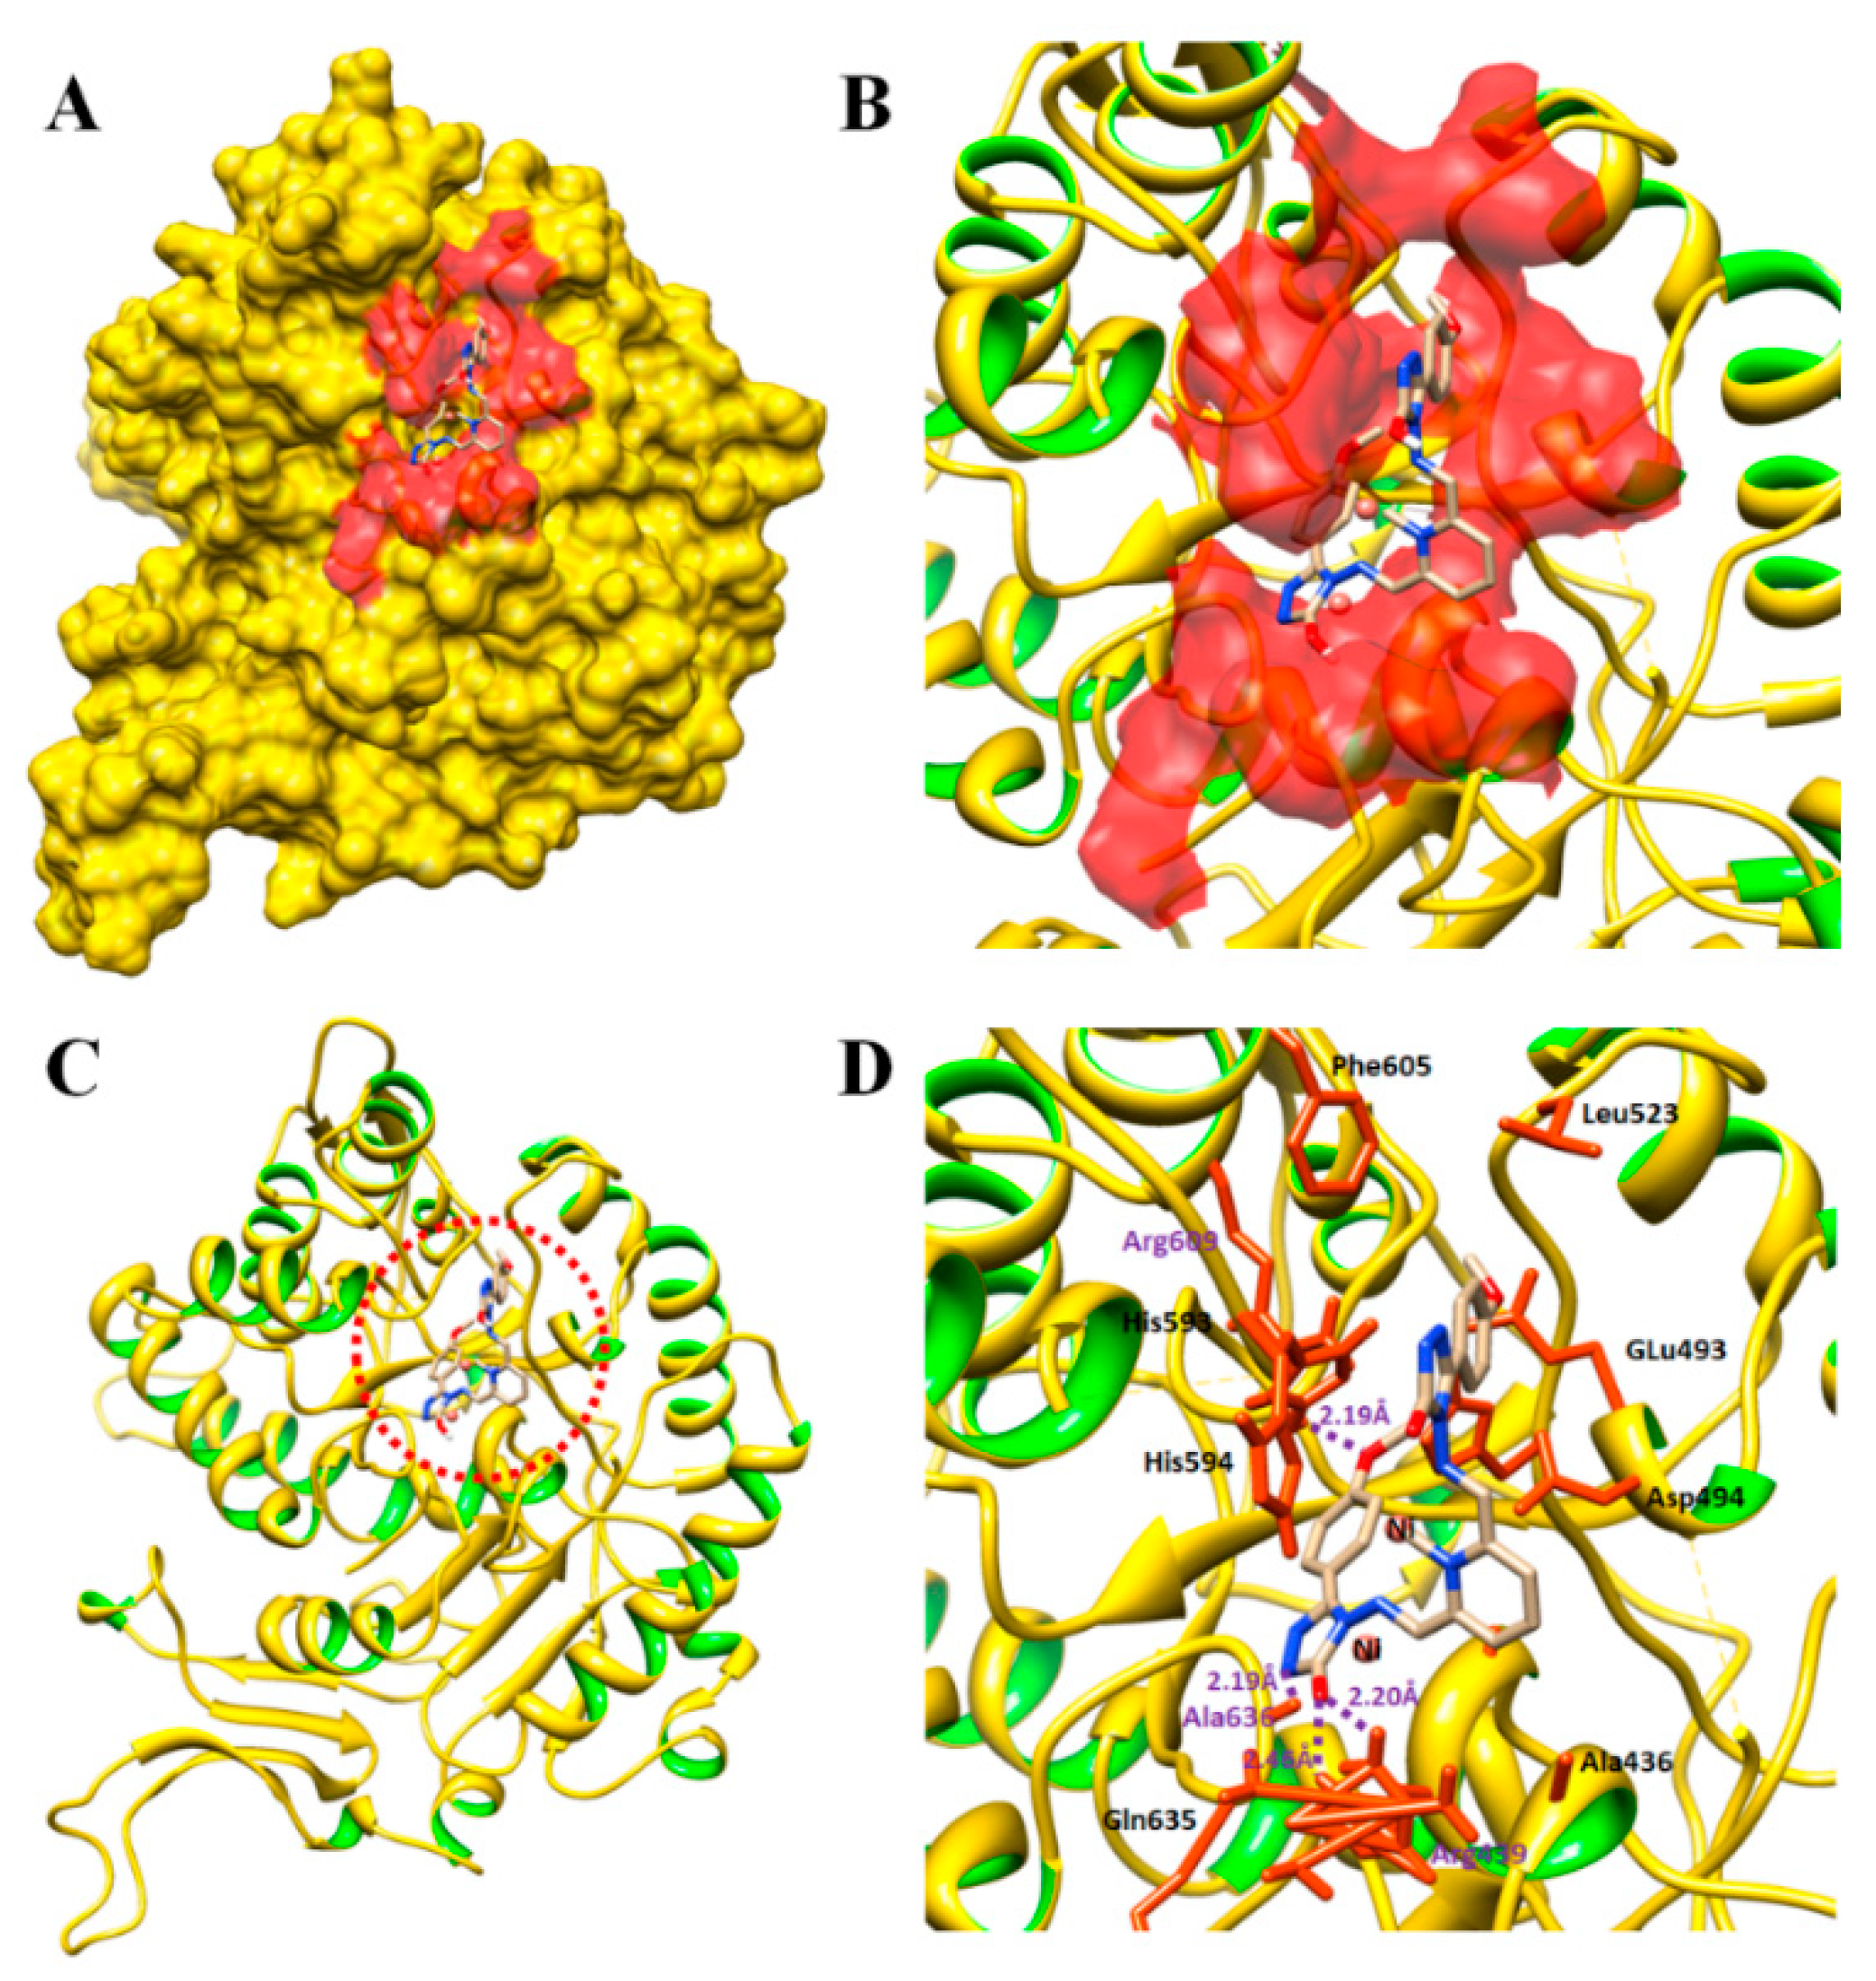
2.8. Docking Shows Binding Energy and Conformation

Based on in vitro results, we chose 3a for binding conformation inside the active site of jack bean urease. Docking and fitting (3a) calculated a binding energy value of −10.40 kcal/mol. The 3a-docked complex showed that compound 3a was enclosed in the active site of the jack bean urease. Compound 3a formed four active hydrogen bonds with the protein active site. The carbonyl oxygen atom on the triazole ring was H-bonds with Arg439 residue with bond lengths of 2.20 and 2.46 Å, respectively. Similarly, the triazole N2 hydrogen likely interacted with Ala636 through hydrogen bonding, having a bond length of 2.19 Å. Moreover, the carbonyl oxygen formed another hydrogen bond with Arg609 with a bond length of 2.19 Å (Figure 6). The detailed interactive behavior of 3a and urease showed that in Arg609 bonding, the oxygen atom of 3a acts as an acceptor whereas the hydrogen atom of Arg609 behave as a donor atom. Similarly, the oxygen and nitrogen atoms act as acceptors and donor atoms in Ala636 bonding, respectively. The significant binding was observed with Arg439 at two different positions against 3a, the oxygen atom of compound 3a behaves as an acceptor while the hydrogen atoms of Arg439 behaves as donor atoms in both bonding. The literature also shows similar results with other urease inhibitors, which corroborates our docking results [18,19,20]. These combined results indicate that the 3a compound may be a potent inhibitor of jack bean urease. Docking results of 3a complexed with jack bean urease are exhibited in Figure 6.

3. Materials and Methods

3.1. Substrate and Reagents

The 4-methoxybenzoic acid, pyridine-2,6-dicarbaldehyde, phosphorous oxychloride, carbohydrazide, isocyanate and isothiocyanates, Hydrazine hydrate (80%), TEA, CS2, KOH, sodium hydrogen carbonate, and glacial acetic acid were purchased from Sigma-Aldrich, Darmstadt, Germany. The chloride salts of the transition metals were obtained from Aldrich and Alfa Aesar. Ethanol, methanol, chloroform, deionized water, acetonitrile, dimethyl sulfoxide, petroleum ether, ethyl acetate, n-hexane, toluene (Samchun Chemicals, Seoul, Korea), H2SO4, acetic acid, and HCl (Jin Chemical and Pharmaceutical Co. Ltd., Seoul, Korea) were used in this experiment. Urease from jack bean (EC 3.5.1.5), Thio-urea, sodium nitroprusside, and active chloride were purchased from Sigma (St. Louis, MO, USA). Stock solutions of the reducing substrates were prepared in phosphate buffer (20 mM, pH 6.8).

3.2. Instrumentations

The reaction progress was monitored by thin layer chromatography (TLC), and the Rf values were determined with pre-coated silica gel aluminum plates, Kieselgel 60 F254 from Merck (Darmstadt, Germany). TLC plates were visualized under a UV lamp (VL–4 LC, Collégien, France). The melting points were determined on a Fisher Scientific (Waltham, MA, USA) melting point apparatus. The FT-IR spectra were recorded in KBr pellets on a Shimadzu FTIR–8400S spectrometer (Kyoto, Japan). Proton and carbon nuclear magnetic resonance (1H-NMR and 13C-NMR) spectra were recorded on a Bruker Avance 400 MHz spectrometer with TMS as an internal standard. The chemical shifts are reported as δ values (ppm) downfield from the internal tetramethylsilane of the indicated organic solution. Peak multiplicities are expressed as follows: S, singlet; d, doublet; and m, multiplet. Mass spectra were recorded on the AB SCIEX Co. 4000 QTRAP LC/MS/MS System. The UV-visible absorption measurements were carried out using [SCINCO] UV-Vis Spectrophotometer “S-3100” (SCINCO, Seoul, Korea). Abbreviations are as follows: CD3OD, deuterated methanol; DMSO–d6, dimethyl sulfoxide-d6, and FT-IR spectroscopy, Fourier transform infrared spectroscopy.

3.3. Synthesis of 4-amino-3-(4-methoxyphenyl)-1H-1,2,4-triazol-5(4H)-one (1 and 2)

The 4-methoxybenzoyl chloride was synthesized by reacting 4-methoxybenzoic acid (1 mmol) in the presence of 1,2–dichloroethane (12 mL) solvent and phosphorous oxychloride (0.4 mL) as the chlorinating agent under reflux for 3 h. Then, the resulting solution was cooled to room temperature, and the solvent was removed under reduced pressure. The 4-methoxybenzoyl chloride and carbohydrazide were separately dissolved in the dichloromethane and mixed together slowly at low temperature with continuous stirring followed by reflux for 3 h. The reaction progress was continuously monitored after every 30 min by using aluminium pre-coated silica gel TLC plates. The product was extracted by using dichloromethane and anhydrous magnesium sulfate and purified by column chromatography employing a dichloromethane:hexane solvent system. Compound 2 was prepared according to our previously reported procedure [21].

3.4. Synthesis of Schiff Base Derivative 3, 4 and Their Metal Complexes

The Schiff base derivative 3 and 4 were synthesized following our previously reported methods [21]. The metal complexes 3,4a-f were synthesized by refluxing an equimolar quantity of the respective metal salts with the Schiff base ligands 3 and 4, utilizing ethanol as the solvent. The formation of the transition metal complexes was initially indicated by the TLC analysis as well as by visual detection due to a colorimetric change in the reaction mixture. Further characterization was performed by the FT-IR, UV-visible, and fluorescence spectroscopic analysis. Anal. Calcd. for target: 3, C25H21N9O4: C, 58.70; H, 4.14; N, 24.65; found: C, 58.66; H, 4.11; N, 24.21. for target: 4, C25H21N9O2S2: C, 55.23; H, 3.89; N, 23.19, found: C, 55.18; H, 3.85; N, 23.16.

3.5. General Procedure for Spectroscopic Measurement

The ligands (3 and 4) and their metal complexes (3-f and 4a-f) stock solution (1 mM) were prepared by dissolving 5.11 and 5.43 mg of desired compounds in THF (total volume 10 mL). For spectroscopic measurements, the test solution of 3 mL was prepared with 2.34 mL of THF, 90 μL of ligand stock solution, 0.3 mL of buffer solution (EtOH/PBS buffer saline, 100 mM), and 90 μL of ionic stock solution. The resulting solutions were mixed before measurement and the final volume was fixed as 3 mL for UV-visible and fluorescent studies. All recognition studies were performed at 25 °C while the samples were shaken to ensure solution uniformity prior to spectrum recording. The limit of detection and association constants for the probe on metal binding were found by the absorption titration experiments while the average Stern-Volmer quenching constants for the probe towards cobalt, mercury, and copper were calculated by fitting the emission titration results to the Stern-Volmer plot [22,23,24].

3.6. General Procedure for MTT Assay

MTT assay was done following the reported procedure [25]. Briefly, the cells were incubated with ligand and their metal complexes (3 and 4; 3a-f and 4a-f) (60 μM) for 24 h. Then, cells were washed with phosphate buffered saline (PBS), and incubated with Dulbecco’s Modified Eagle’s medium (DMEM medium, 200 μL/well) containing 50 μL of MTT [3-(4,5-dimethylthiazol-2-yl)-2,5-diphenyltetrazolium bromide, 5 mg/mL] solution. Following 2 h of incubation at 37 °C, growth medium was removed gently from the plate and 200 μL/well dimethyl sulfoxide was added to solubilize the produced purple formazan crystals. Later, the absorbance for each well was measured at 570 nm using microplate spectrophotometer systems (BioTek, synergy HT) and results were calculated in percentage with respect to the untreated sample called the control. The same procedure was adopted for all the compounds and their metal complexes.

3.7. General Procedure for Urease Inhibition Assay

The urease activity was determined by measuring the amount of ammonia produced with the indophenols method previously described [26,27]. The reaction mixtures, comprising 20 µL of enzyme (jack bean urease, 5 U/mL) and 20 μL of test compounds in 50 μL buffer (100 mM urea, 0.01 M K2HPO4, 1 mM EDTA, and 0.01 M LiCl2, pH 8.2), were incubated for 30 min at 37 °C in a 96-well plate. Briefly, 50 μL each of phenol reagents (1%, w/v phenol and 0.005%, w/v sodium nitroprusside) and 50 μL of alkali reagent (0.5%, w/v NaOH and 0.1% active chloride NaOCl) were added to each well. The absorbance at 625 nm was measured after 10 min, using a microplate reader (OPTI Max, Tunable). All reactions were performed in triplicate. The urease inhibition activities were calculated according to the following formula:
Urease inhibition activity (%) = (ODcontrol − ODsample × 100)/ODcontrol
where ODcontrol and ODsample represents the optical densities in the absence and presence of the sample, respectively. Thiourea was used as the standard inhibitor for urease.

3.8. Computational Methodology

Retrieval of Jack Bean Urease

The three-dimensional protein structure of jack bean urease (C. ensiformis) was accessed from the Protein Data Bank (PDB) (www.rcsb.org) with PDBID 4H9M. The selected protein structure was minimized by employing UCSF Chimera 1.10.1 [28]. Molprobity server [29] was used to predict the Ramachandran plot and values of the target structure [30]. The protein architecture and statistical percentage values of receptor proteins, helices, beta-sheets, coils, and turns were predicted from the online server, VADAR 1.8 [31].

3.9. Molecular Docking

Based on the in vitro results, 3a was selected for the docking experiment to check the binding against the target protein. Before the docking experiment, the synthesized ligand (3a) was sketched in the ACD/ChemSketch tool and accessed in the mol format. Furthermore, the UCSF Chimera 1.10.1 tool was employed for energy minimization of 3a having default parameters. The steepest descent steps were adjusted to 100 with a step size of 0.02 (Å), conjugate gradient steps also fixed to 100 with a step size of 0.02 (Å), and the update interval was retrained at 10. Finally, Gasteiger charges were added using Dock Prep in the ligand structure to obtain the good structure conformation. The molecular docking experiment was run through the PyRx virtual screening tool with the AutoDock VINA Wizard approach [32,33]. The grid box center values (X = 10.22, Y = 24.56 and Z = 46.18) were adjusted with default exhaustiveness value = 8 to maximize the binding conformational analysis. The generated docked complexes were evaluated based on the lowest binding energy (Kcal/mol) values and structure activity relationship (SAR) analyses. The three dimensional (3D) graphical depictions of the 3a-docked complex were accomplished by Chimera 1.10.1.

4. Conclusions

In this study, we joined two triazole rings to form a series of Schiff base derivatives into a cage-like structure. Then, we evaluated their urease inhibition activity as well as their underlying mechanism for inhibition with enzyme kinetics studies. Among the tested series, copper, nickel, and palladium complexes displayed appreciable enzyme inhibition results, while the rest showed low to moderate enzyme inhibition potential. The kinetic analysis by the Lineweaver–Burk plot suggested the non-competitive inhibition nature of the compounds, 3a, 4a, and 4b, while mixed type inhibition by the compound, 3b. Further, molecular docking studies showed that 3a interacted within the active region of jack bean urease and exhibited a good binding energy value of −10.40 kcal/mol. These combined results showed that synthesized molecules can serve as structural templates in the design of novel drugs against the urease enzyme.

Supplementary Materials

Supplementary Materials are available online.

Author Contributions

Conceptualization, T.C. and M.S.; Data curation, M.M. and M.S.; Formal analysis, M.M. and Y.Z.; Funding acquisition, C.L.; Investigation, M.R. and Mubashir Hassan; Methodology, Muhammad Hanif; Project administration, Mubashir Hassan, Y.Z. and T.C.; Resources, C.L.; Software, F.K., C.L. and M.S.; Supervision, S.-Y.S. and C.L.; Validation, S.-Y.S. and T.C.; Visualization, M.R.; Writing—original draft, Muhammad Hanif; Writing—review & editing, F.K.

Funding

Research funding and APC was provided by the Natural Science Foundation of China (31300603), Program for Professor of Special Appointment (Eastern Scholar) at Shanghai Institutions of Higher Learning (No.2012-28), Fundamental Research Funds for the Central Universities (15D110508, 15D110527, 15D110527, 13D110522, 17D210502, 17D310512, 18D210501, 18D310507, 2232014D3-39), the National College Student Innovation Experiment Program (14T10501), General Financial Grant from the China Postdoctoral Science Foundation (2015M571455). Work in the Dr. Muhammad Saleem lab was sponsored by the University of Sargodha, Sub-campus Bhakkar, Pakistan.

Acknowledgments

We thank Dr. Chen, Peiran, and Dr. Ishtiaq Qadri for helpful discussions.

Conflicts of Interest

Authors declare no conflict of interest.

References

  1. Habala, L.; Varényi, S.; Bilková, A.; Herich, P.; Valentová, J.; Kožíšek, J.; Devínsky, F. Antimicrobial Activity and Urease Inhibition of Schiff Bases Derived from Isoniazid and Fluorinated Benzaldehydes and of Their Copper(II) Complexes. Molecules 2016, 21, 1742. [Google Scholar] [CrossRef] [PubMed]
  2. Hassan, S.T.S.; Švajdlenka, E.; Berchová-Bímová, K. Hibiscus sabdariffa L. and Its Bioactive Constituents Exhibit Antiviral Activity against HSV-2 and Anti-Enzymatic Properties against Urease by an ESI-MS Based Assay. Molecules 2017, 22, 722. [Google Scholar] [CrossRef] [PubMed]
  3. Hassan, S.T.S.; Švajdlenka, E. Biological Evaluation and Molecular Docking of Protocatechuic Acid from Hibiscus sabdariffa L. as a Potent Urease Inhibitor by an ESI-MS Based Method. Molecules 2017, 22, 1696. [Google Scholar] [CrossRef] [PubMed]
  4. Xu, Y.P.; Chen, Y.H.; Chen, Z.J.; Qin, J.; Qian, S.S.; Zhu, H.L. Synthesis, Crystal Structures, Molecular Docking, and urease Inhibitory Activities of Transition-Metal Complexes with a 1,2,4-Triazolecarboxylic Acid Derived Ligand. Eur. J. Inorg. Chem. 2015, 2015, 2076–2084. [Google Scholar] [CrossRef]
  5. You, Z.; Liu, M.; Wang, C.; Sheng, G.; Zhao, X.; Qua, D.; Niu, F. Inhibition studies of Helicobacter pylori urease with Schiff base copper(II) complexes. RSC Adv. 2016, 6, 16679–16690. [Google Scholar] [CrossRef]
  6. You, Z.; Yu, H.; Zheng, B.; Zhang, C.; Lv, C.; Li, K.; Pan, L. Syntheses, structures, and inhibition studies of Jack bean urease by copper(II) complexes derived from a tridentate hydrazone ligand. Inorg. Chim. Acta 2018, 469, 44–50. [Google Scholar] [CrossRef]
  7. You, Z.L.; Ni, L.L.; Shi, D.H.; Bai, S. Synthesis, structures, and urease inhibitory activities of three copper(II) and zinc(II) complexes with 2-{[2-(2-hydroxyethylamino)ethylimino]methyl}-4-nitrophenol. Eur. J. Med. Chem. 2010, 45, 3196–3199. [Google Scholar] [CrossRef] [PubMed]
  8. Ikram, M.; Rehman, S.; Faridoon; Baker, R.J.; Rehman, H.U.; Khan, A.; Choudhary, M.I.; Rehman, S.U. Synthesis and distinct urease enzyme inhibitory activities of metal complexes of Schiff-base ligands: Kinetic and thermodynamic parameters evaluation from TG-DTA analysis. Thermochim. Acta 2013, 555, 72–80. [Google Scholar] [CrossRef]
  9. Du, N.; Chen, M.; Liu, Z.; Sheng, L.; Xu, H.; Chen, S. Kinetics and mechanism of jack bean urease inhibition by Hg2+. Chem. Cent. J. 2012, 6, 154–161. [Google Scholar] [CrossRef] [PubMed]
  10. Benini, S.; Rypniewski, W.R.; Wilson, K.S.; Mangani, S.; Ciurli, S. Molecular Details of urease Inhibition by Boric Acid: Insights into the Catalytic Mechanism. J. Am. Chem. Soc. 2004, 126, 3714–3715. [Google Scholar] [CrossRef]
  11. Habal, L.; Roller, A.; Matušk, M.; Valentová, J.; Rompel, A.; Devínsky, F. Complexes of N-hydroxyethyl-N-benzimidazolylmethylethylenediaminediacetic acid with copper(II) and cobalt(II): Preparation, crystal structure and urease inhibitory activity. Inorg. Chim. Acta 2014, 421, 423–426. [Google Scholar] [CrossRef]
  12. Dong, X.; Li, Y.; Li, Z.; Cui, Y.; Zhu, H. Synthesis, structures and urease inhibition studies of copper(II) and nickel(II) complexes with bidentate N,O-donor Schiff base ligands. J. Inorg. Biochem. 2012, 108, 22–29. [Google Scholar] [CrossRef] [PubMed]
  13. Gul, S.; Sultana, N.; Arayne, M.S.; Shamim, S.; Akhtar, M.; Khan, A. Sparfloxacin-Metal Complexes as urease Inhibitors: Their Synthesis, Characterization, Antimicrobial, and Antienzymatic Evaluation. J. Chem. 2013, 1–12. [Google Scholar] [CrossRef]
  14. Fátima, A.D.; Pereira, C.P.; Olímpio, C.R.S.D.G.; Oliveira, B.G.F.O.; Franco, L.L.F.; Silva, P.H.C. Schiff bases and their metal complexes as urease inhibitors—A brief review. J. Adv. Res. 2018. [Google Scholar] [CrossRef]
  15. Cui, Y.; Dong, X.; Li, Y.; Li, Z.; Chen, W. Synthesis, structures and urease inhibition studies of Schiff base metal complexes derived from 3,5-dibromosalicylaldehyde. Eur. J. Med. Chem. 2012, 58, 323–331. [Google Scholar] [CrossRef]
  16. Ashraf, Z.; Rafiq, M.; Seo, S.Y.; Babar, M.M.; Zaidi, N.S.S. Synthesis, kinetic mechanism and docking studies of vanillin derivatives as inhibitors of mushroom tyrosinase. Bioorg. Med. Chem. 2015, 23, 5870–5880. [Google Scholar] [CrossRef]
  17. Abbasi, M.A.; Raza, H.; Siddiqui, S.Z.; Shah, S.A.; Hassan, M.; Seo, S.Y. Synthesis of novel N-(1,3-thiazol-2-yl)benzamide clubbed oxadiazole scaffolds: Urease inhibition, Lipinski rule and molecular docking analyses. Bioorg Chem. 2018, 83, 63–75. [Google Scholar] [CrossRef] [PubMed]
  18. Saeed, A.; Ur-Rehman, S.; Channar, P.A.; Larik, F.A.; Abbas, Q.; Hassan, M.; Raza, H.; Seo, S.Y. Jack Bean urease Inhibitors, and Antioxidant Activity Based on Palmitic acid Derived 1-acyl-3- Arylthioureas: Synthesis, Kinetic Mechanism and Molecular Docking Studies. Drug Res. 2017, 67, 596–605. [Google Scholar] [CrossRef] [PubMed]
  19. Channar, P.A.; Saeed, A.; Albericio, F.; Larik, F.A.; Abbas, Q.; Hassan, M.; Raza, H.; Seo, S.Y. Sulfonamide-Linked Ciprofloxacin, Sulfadiazine and Amantadine Derivatives as a Novel Class of Inhibitors of Jack Bean urease; Synthesis, Kinetic Mechanism and Molecular Docking. Molecules 2017, 16, 1352. [Google Scholar] [CrossRef]
  20. Abbasi, M.A.; Hassan, M.; Aziz-Ur-Rehman Siddiqui, S.Z.; Raza, H.; Shah, S.A.A.; Seo, S.Y. Synthesis, in vitro and in silico studies of novel potent urease inhibitors: N-[4-({5-[(3-Un/substituted-anilino-3-oxopropyl)sulfanyl]-1,3,4-oxadiazol-2-yl}methyl)-1,3-thiazol-2-yl]benzamides. Bioorg. Med. Chem. 2018, 30, 3791–3804. [Google Scholar] [CrossRef]
  21. Saleem, M.; Khang, C.H.; Kim, M.; Lee, K.H. Chromo/Fluorogenic Detection of Co(2+), Hg(2+) and Cu(2+) by the Simple Schiff Base Sensor. J. Fluoresc. 2016, 26, 11–22. [Google Scholar] [CrossRef] [PubMed]
  22. Muhammad Saleem, Muhammad Rafiq, Muhammad Hanif, Organic material based fluorescent sensor for Hg2+: A brief review on recent development. J. Fluoresc. 2017, 27, 31–58. [CrossRef]
  23. Saleem, M.; Lee, L.P.; Lee, K.H. Photoluminescent Sensor for Acetylcholinesterase Inhibitor Determination. J. Mater. Chem. B 2014, 2, 6802–6808. [Google Scholar] [CrossRef]
  24. Saleem, M.; Kang, S.K.; Lee, K.H. Microwave assisted synthesis of a novel optical chemosensor for selective Fe3+ detection. J. Lumin. 2015, 162, 14–24. [Google Scholar] [CrossRef]
  25. Saleem, M.; Abdullah, R.; Ali, A.; Park, B.J.; Choi, E.H.; Hong, I.S.; Lee, K.H. Facile synthesis, cytotoxicity and bioimaging of Fe3+ selective fluorescent chemosensor. Bioorg. Med. Chem. 2014, 22, 2045–2051. [Google Scholar] [CrossRef]
  26. Weatherburn, M.W. Phenol-Hypochlorite Reaction for Determination of Ammonia. Anal. Chem. 1967, 39, 971–974. [Google Scholar] [CrossRef]
  27. Mojzych, M.; Tarasiuk, P.; Mojzych, K.K.; Rafiq, M.; Seo, S.-Y.; Nicewicz, M.; Fornal, E. Synthesis of chiral pyrazolo[4,3-e][1,2,4]triazine sulfonamides with tyrosinase and urease inhibitory activity. J. Enzyme Inhib. Med. Chem. 2017, 32, 99–105. [Google Scholar] [CrossRef]
  28. Pettersen, E.F.; Goddard, T.D.; Huang, C.C.; Couch, G.S.; Greenblatt, D.M.; Meng, E.C.; Ferrin, T.E. UCSF Chimera—A visualization system for exploratory research and analysis. J. Comput. Chem. 2004, 25, 1605–1612. [Google Scholar] [CrossRef] [PubMed]
  29. Chen, V.B.; Arendall, W.B.; 3rd Headd, J.J.; Keedy, D.A.; Immormino, R.M. MolProbity: All-atom structure validation for macromolecular crystallography. Acta Crystallogr. D Biol. Crystallogr. 2010, 66, 12–21. [Google Scholar] [CrossRef]
  30. Lovell, S.C.; Davis, I.W.; Arendall, W.B., III; de Bakker, P.I.; Word, J.M. Structure validation by Calpha geometry: Phi, psi and Cbeta deviation. Proteins 2003, 50, 437–450. [Google Scholar] [CrossRef]
  31. Willard, L.; Ranjan, A.; Zhang, H.; Monzavi, H.; Boyko, R.F. VADAR: A web server for quantitative evaluation of protein structure quality. Nucleic Acids Res. 2003, 31, 3316–3319. [Google Scholar] [CrossRef] [PubMed]
  32. Dallakyan, S.; Olson, A.J. Small-molecule library screening by docking with PyRx. Methods Mol. Biol. 2015, 1263, 243–250. [Google Scholar] [PubMed]
  33. Rafiq, M.; Saleem, M.; Jabeen, F.; Hanif, M.; Seo, Su.; Kang, S.K.; Lee, K.H. Facile synthesis, biological evaluation and molecular docking studies of novel substituted azole derivatives. J. Mol. Struct. 2017, 1138, 177–191. [Google Scholar] [CrossRef]
Sample Availability: Samples of the compounds are available from the authors.
Scheme 1. Synthesis of target molecule 3a-f and 4a-f; reagents and conditions: (i) Pyridine-2,6-dicarbaldehyde, glacial acetic acid (3–4 drops), absolute methanol, reflux 8 h; (ii) chloride salts of transition metals, ligands (3 and 4), methanol, reflux 2–3 h.
Molecules 24 00312 sch001
Figure 1. Kinetic analysis results for target molecule 3a. (a) Lineweaver-Burk plots for the inhibition of urease in the presence of compound 3a; concentrations of 3a of 0, 0.25, 0.5, 1, and 2 µM, respectively. Substrate urea concentrations were 1.57, 3.12, 6.25, 12.5, 25, and 50 µM, used respectively; (b) The secondary replot of the Lineweaver-Burk plot, slope vs. various concentrations of 3a.
Molecules 24 00312 g001
Figure 2. Kinetic analysis results for target molecule 4a. (a) Lineweaver-Burk plots for the inhibition of urease in the presence of compound 4a. Concentrations of 4a of 0, 0.75, 1.5, 3, and 6 µM, respectively. Substrate urea concentrations were 1.57, 3.12, 6.25, 12.5, 25, and 50 µM, used respectively; (b) The secondary replot of the Lineweaver-Burk plot, slope vs. various concentrations of 4a.
Molecules 24 00312 g002
Figure 3. Kinetic analysis results for target molecule 3b. (a) Double reciprocal Lineweaver-Burk plots for the inhibition of Jack bean urease in the presence of compound 3b. Concentrations of 3b were 0, 0.25, 0.5, 1, and 2 µM, respectively. Substrate urea concentrations were 1.57, 3.12, 6.25, 12.5, 25, and 50 µM, used respectively; (b) The secondary replot of the Lineweaver-Burk plot, slope vs. various concentrations of 3b; (c) The secondary replot of the Lineweaver-Burk plot, Intercept vs. various concentrations 3b.
Molecules 24 00312 g003
Figure 4. Kinetic analysis results for target molecule 4b. (a) Lineweaver-Burk plots for the inhibition of urease in the presence of compound 4b; concentrations of 4b were used as 0, 1, 2, 4, and 6 µM, respectively. Substrate (urea) concentrations, 1.57, 3.12, 6.25, 12.5, 25, and 50 µM, were used, respectively; (b) The secondary replot of the Lineweaver-Burk plot, slope vs. various concentrations of 4b.
Molecules 24 00312 g004
Figure 5. Crystal structure of jack bean urease.
Molecules 24 00312 g005
Figure 6. Docking results of 3a complex with jack bean urease. (A) the protein molecule is rendered as the yellow surface, whereas the binding pocket is highlighted in maroon. (B) The closer view of the docking complex with the 3a ligand. Two nickel atoms are labeled in brown. (C) The ribbon format protein structure with the interactive ligand. (D) The interactive residues are highlighted in the dark brown color and the ligand (3a) is justified in grey color with different moieties’ colors. The purple lines represent hydrogen bonding and the distance mentioned in angstrom (Å).
Molecules 24 00312 g006
Table 1. FT-IR spectroscopic data for ligands 3 and 4 before and after complexation.
S. No.Compounds-N-HC-H C=NC=CC=SC=OC-O-C
1ligand (3)3519–37383138–29491638–16201511–1400--16801176
23a (ligand+Cu2+)3491–33703190–29011610, 1584 1521–1411--16401171
33b (ligand+Ni2+)3481–34013200–29111612, 15881505–1431--16381176
43c (ligand+Pd2+)3499–33783205–29331620, 15911505–1430--16381170
53d (ligand+Co2+)3501–33913178–29181620, 15881508–1428--16401170
63e (ligand+Fe2+)3511–33813186–29131618, 16011515–1429--16381168
73f (ligand+Zn2+)3508–34023191–29391622, 16011511–1401--16381180
8ligand (4)3523–33903196–29501628, 16101504–14241272--1176
94a (ligand+Cu2+)3505–34013190–29401618, 16021511–14381231--1188
104b (ligand+Ni2+)3511–33703188–29111609, 16081521–14111241--1178
114c (ligand+Pd2+)3500–33883201–29331622, 15991518–14211238--1178
124d (ligand+Co2+)3511–34013174–29191613, 15841515–14091232--1187
134e (ligand+Fe2+)3508–33913181–29091617, 16021511–14341240--1188
144f (ligand+Zn2+)3508–34003199–29191611, 16021505–14191236--1175
Table 2. Physical characteristics and optical analysis results for ligands 3 and 4 before and after complexation.
S. No.CompoundsAppearancem.p. °Cλabs (nm) aε 105 (M−1cm−1) b
1ligand (3)yellow powder211–213240, 3046.4, 3.8
23a (ligand+Cu2+)dark yellow232–240240, 3616.4, 3.41
33b (ligand+Ni2+)purple241–243240, 3506.31, 3.84
43c (ligand+Pd2+)barn red240–242241, 3316.54, 3.58
53d (ligand+Co2+)light green238–240246, 3336.11, 3.61
63e (ligand+Fe2+)chocolate243–245240, 3406.76, 3.58
73f (ligand+Zn2+)sage230–232240, 3246.39, 3.38
8ligand (4)light yellow183–185247, 2925.04, 2.7
94a (ligand+Cu2+)dark yellow236–238247, 3215.11, 2.78
104b (ligand+Ni2+)purple235–237247, 3115.21, 2.38
114c (ligand+Pd2+)chili244–246247, 3335.21, 2.81
124d (ligand+Co2+)dark green233–235247, 3385.08, 2.11
134e (ligand+Fe2+)chocolate239–241247, 3025.18, 2.02
144f (ligand+Zn2+)sage229–231247, 3335.18, 3.34
a UV-visible absorption maxima; b Molar absorption coefficient.
Table 3. The inhibitory effect of synthesized compounds toward urease.
Compounds CodeUrease Inhibition IC50 (µM)
318.92 ± 1.81
3a0.94 ± 0.13
3b3.71 ± 0.61
3c7.64 ± 1.21
3d28.93 ± 3.11
3e37.46 ± 4.23
3f45.78 ± 5.24
429.33 ± 3.32
4a1.20 ± 0.52
4b3.93 ± 0.45
4c12.87 ± 2.11
4d23.72 ± 3.33
4e58.83 ± 7.31
4f39.89 ± 6.93
Thio-Urea20.7 ± 0.45
Table 4. Kinetic analysis of compounds, 3a, 4a, 3b, and 4b.
CompoundsDose (µM)1/Vmax
(ΔA/Sec)
Km (µM)Inhibition TypeKi (µM)Kiʹ (µM)
3a0.0122.5Non-competitive0.6---
0.25202.5
0.50302.5
1.0352.5
2.0442.5
4a0.080.47Non-competitive2.1---
0.75120.47
1.5180.47
3.0220.47
6.0350.47
3b0.0507.14Mixed-inhibition1.23.0
0.256010
0.56512.5
1.07014.2
2.08016.6
4b0.0550.41Non-competitive2.4---
1.0650.41
2.01000.41
4.01300.41
6.01800.41
Vmax is the reaction velocity; Km is the Michaelis-Menten constant; Ki is the EI dissociation constant; Kiʹ is the ESI dissociation constant; ---: not determined

