
Ultrasound-Assisted Extraction Optimization of Phenolic Compounds from Citrus latifolia Waste for Chitosan Bioactive Nanoparticles Development

 , , and
Abstract
: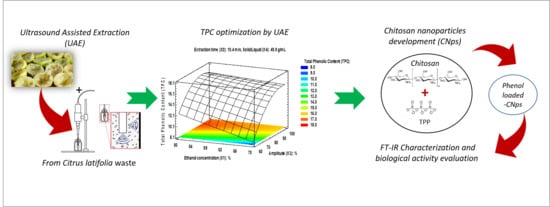
1. Introduction
2. Results and Discussion
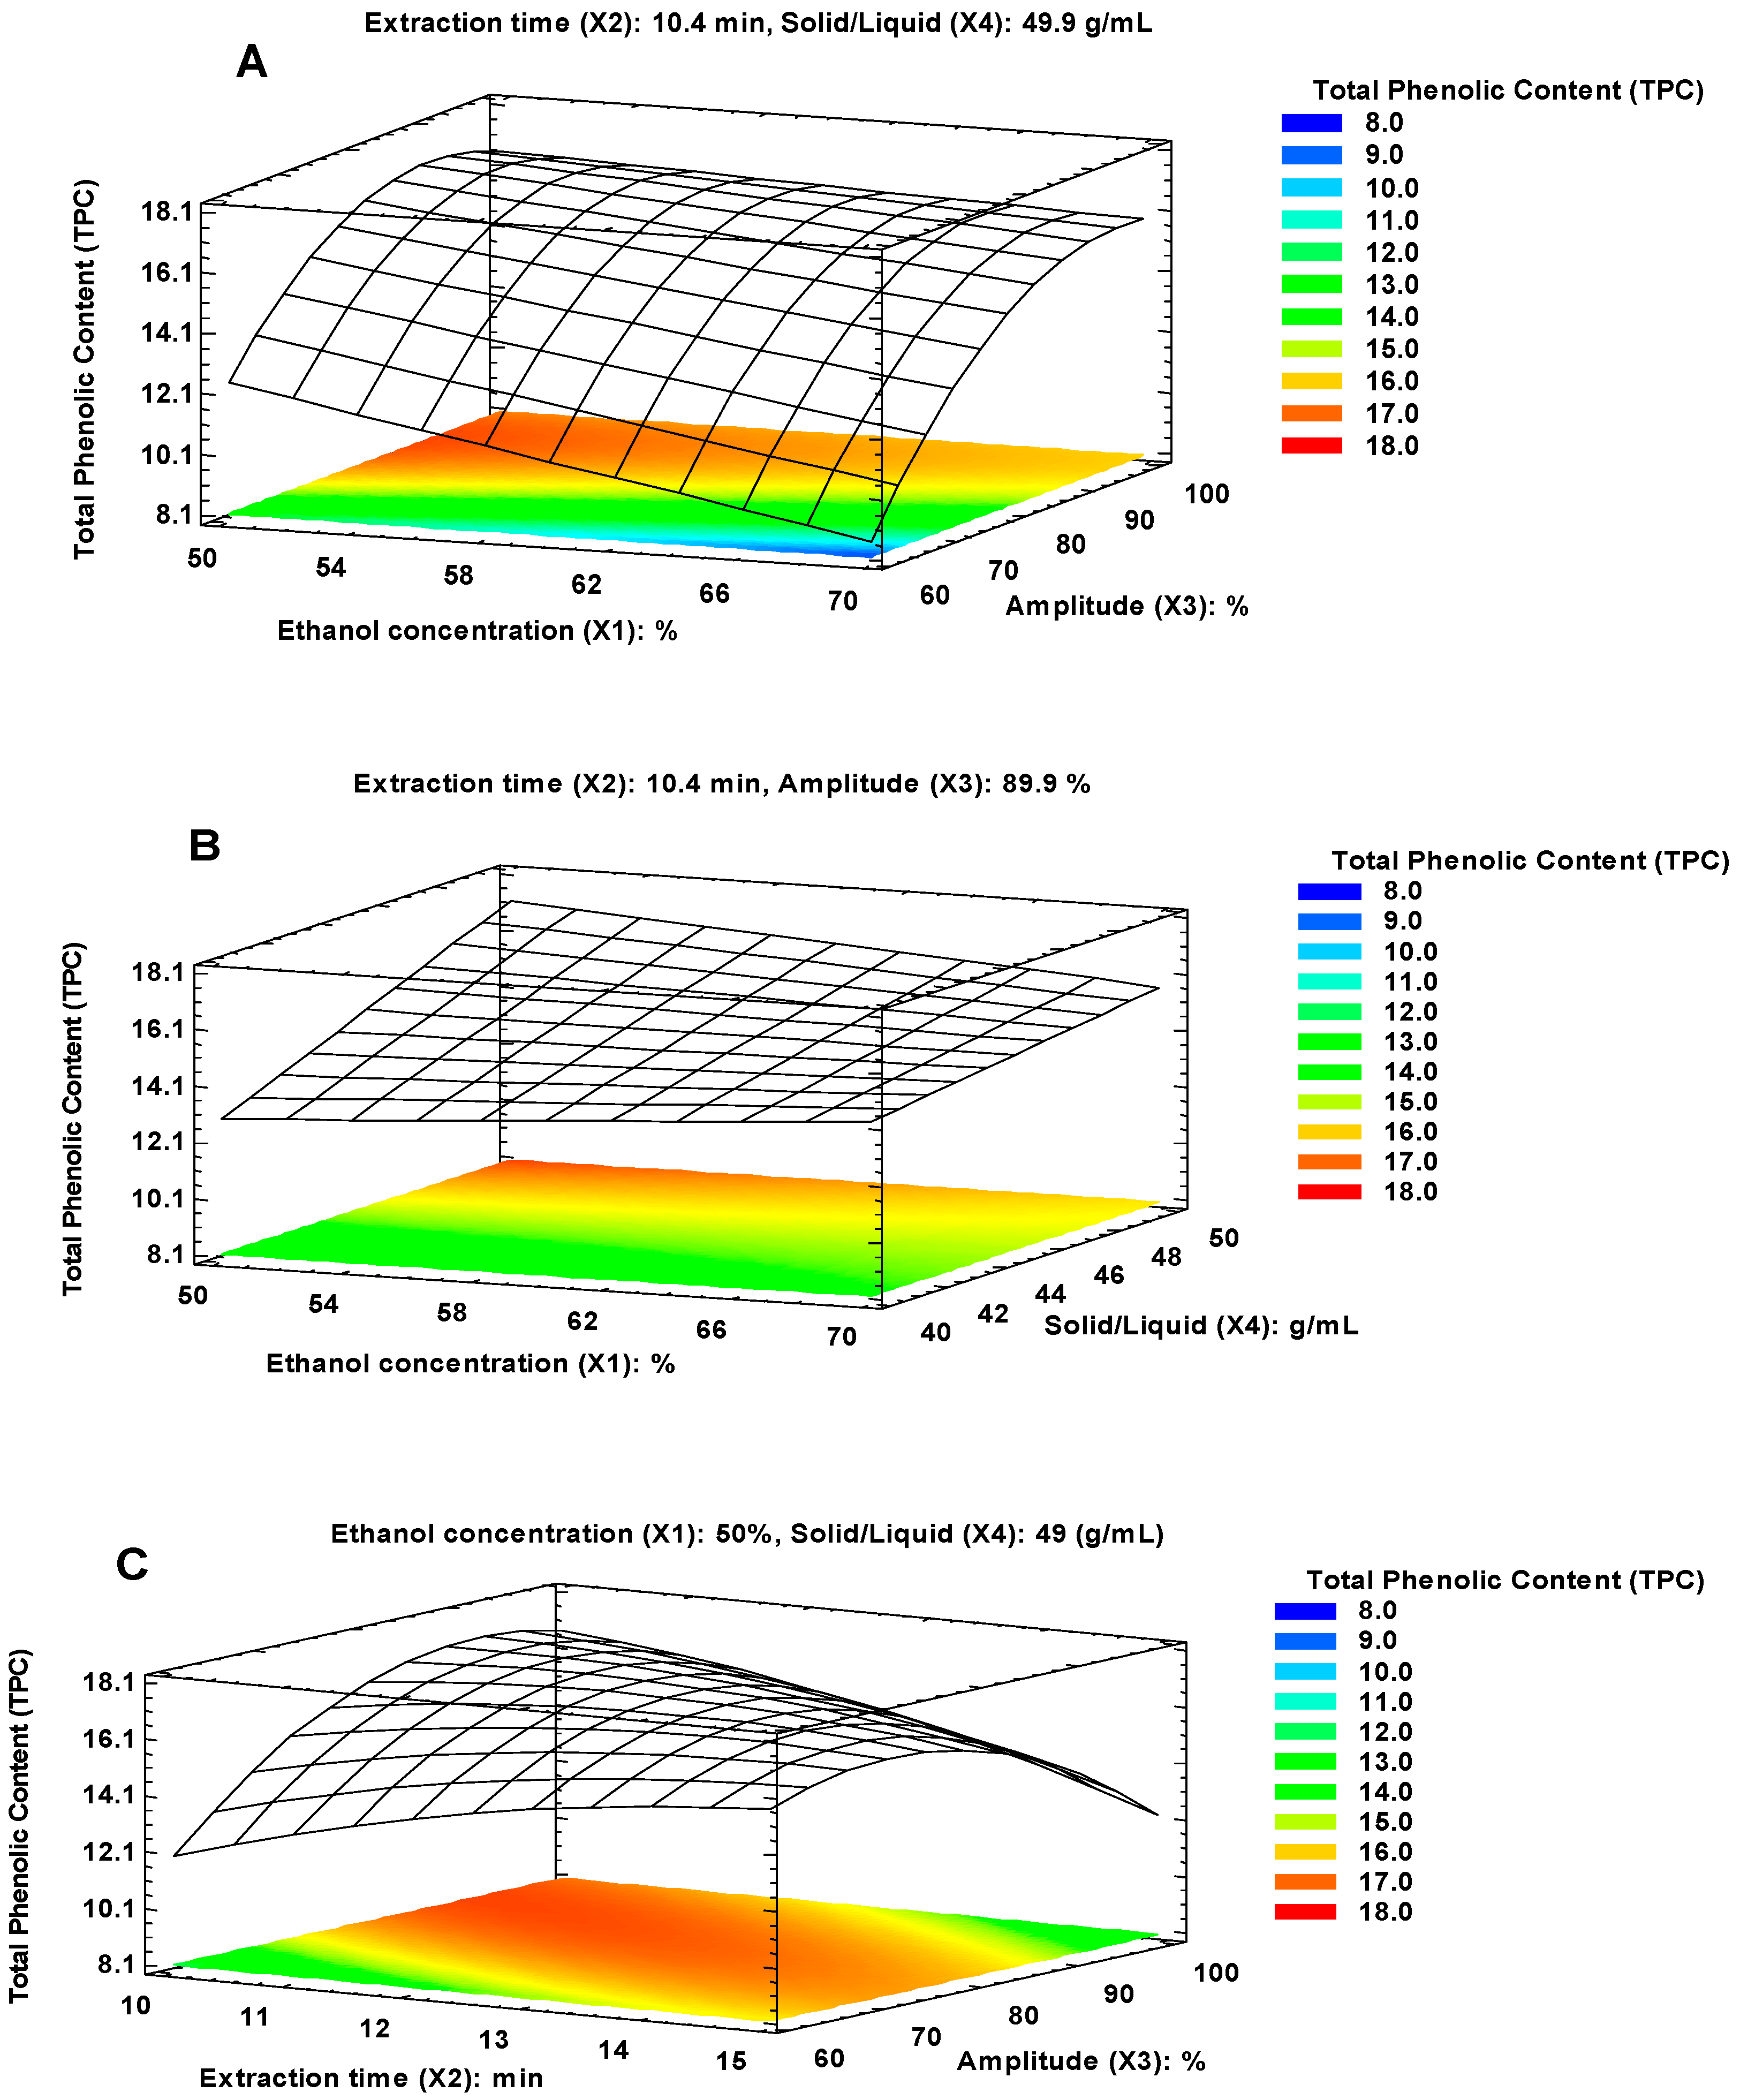
2.1. Modeling and Optimization of UAE for TPC Recovery
2.2. Analysis of Extraction Variables of UAE
2.2.1. Individual Effects of Ethanol Concentration, Extraction Time, Amplitude, and the Solid/Liquid Ratio
2.2.2. Analysis of Interaction Effects
2.3. Phenolic Compounds Identification and Quantification by UPLC-PDA Analysis
2.4. Encapsulation Efficiency of Phenolic Compounds
2.5. Phenol-loaded Chitosan Nanoparticles Characterization
2.5.1. Size Particle, Z Potential, and Polydispersity Index
2.5.2. Fourier Transformed-Infrared (FT-IR) Analysis
2.6. Phenol-loaded Chitosan Nanoparticles Biological Activity
3. Materials and Methods
3.1. Plant Material and Microorganisms
3.2. Chemicals and Reagents
3.3. Optimization of UAE
3.3.1. Response Surface Methodology
3.4. TPC Determination
3.5. Phenolic Compounds Identification and Quantification by UPLC-PDA Analysis
3.6. Encapsulation of Phenolic Compounds by Ionic Gelation
3.7. PL-CNps Characterization
3.7.1. Size Particle, Z Potential, and Polydispersity Index (PDI) of PL-CNps
3.7.2. Fourier Transformed-Infrared (FT-IR) Analysis
3.8. PL-CNps Biological Activity
3.9. Statistical Analysis
4. Conclusions
Author Contributions
Funding
Acknowledgments
Conflicts of Interest
References
- Negro, V.; Mancini, G.; Ruggeri, B.; Fino, D. Citrus waste as feedstock for bio-based products recovery: Review on limonene case study and energy valorization. Bioresour. Technol. 2016, 214, 806–815. [Google Scholar] [CrossRef] [PubMed]
- Tomás-Navarro, M.; Vallejo, F.; Tomás-Barberán, F. Chapter 40. Bioavailability and Metabolism of Citrus Fruit Beverage Flavanones in Humans. In Polyphenols in Human Health and Disease; Academic Press: Cambridge, MA, USA, 2014; pp. 537–551. ISBN 9780123984562. [Google Scholar]
- Tripoli, E.; La Guardia, M.; Giammanco, S.; Di Majo, D.; Giammanco, M. Citrus flavonoids: Molecular structure, biological activity and nutritional properties: A review. Food Chem. 2007, 104, 466–479. [Google Scholar] [CrossRef]
- Limwachiranon, J.; Jiang, L.; Huang, H.; Sun, J.; Luo, Z. Improvent of phenolic compounds extraction from high-starch lotus (Nelumbo nucifera G.) seed kernels using glycerol: New insights to amylose/amylopectin–Phenolic relationships. Food Chem. 2019, 274, 933–941. [Google Scholar] [CrossRef] [PubMed]
- Huang, H.; Xu, Q.; Belwal, T.; Li, L.; Aalim, H.; Wu, Q.; Duan, Z.; Zhang, X.; Luo, Z. Ultrasonic impact on viscosity and extraction efficiency of polyethylene glycol: A greener approach for anthocyanins recovery from purple sweet potato. Food Chem. 2019, 283, 59–67. [Google Scholar] [CrossRef] [PubMed]
- Parniakov, O.; Apicella, E.; Koubaa, M.; Barba, F.J.; Grimi, N.; Lebovka, N.; Pataro, G.; Ferrari, G.; Vorobiev, E. Ultrasound-assisted green solvent extraction of high-added value compounds from microalgae Nannochloropsis spp. Bioresour. Technol. 2015, 198, 262–267. [Google Scholar] [CrossRef] [PubMed]
- Feng, S.; Luo, Z.; Tao, B.; Chen, C. Ultrasonic-assisted extraction and purification of phenolic compounds from sugarcane (Saccharum officinarum L.) rinds. LWT–Food Sci. Technol. 2015, 60, 970–976. [Google Scholar] [CrossRef]
- Medina-Torres, N.; Ayora-Talavera, T.; Espinosa-Andrews, H.; Sánchez-Contreras, A.; Pacheco, N. Ultrasound Assisted Extraction for the Recovery of Phenolic Compounds from Vegetable Sources. Agronomy 2017, 7, 47. [Google Scholar] [CrossRef]
- Li, Z.; Jiang, H.; Xu, C.; Gu, L. A review: Using nanoparticles to enhance absorption and bioavailability of phenolic phytochemicals. Food Hydrocoll. 2015, 43, 153–164. [Google Scholar] [CrossRef]
- Nallamuthu, I.; Devi, A.; Khanum, F. Chlorogenic acid loaded chitosan nanoparticles with sustained release property, retained antioxidant activity and enhanced bioavailability. Asian J. Pharm. Sci. 2014, 10, 203–211. [Google Scholar] [CrossRef]
- Lamarra, J.; Rivero, S.; Pinotti, A. Design of chitosan-based nanoparticles functionalized with gallic acid. Mater. Sci. Eng. C 2016, 67, 717–726. [Google Scholar] [CrossRef]
- Panwar, R.; Pemmaraju, S.C.; Sharma, A.K.; Pruthi, V. Efficacy of ferulic acid encapsulated chitosan nanoparticles against Candida albicans biofilm. Microb. Pathog. J. 2016, 95, 21–31. [Google Scholar] [CrossRef] [PubMed]
- Ubando-Rivera, J.; Navarro-Ocaña, A.; Valdivia-López, M.A. Mexican lime peel: Comparative study on contents of dietary fibre and associated antioxidant activity. Food Chem. 2005, 89, 57–61. [Google Scholar] [CrossRef]
- Ledesma-Escobar, C.A.; Priego-capote, F.; Robles-Olvera, V.J.; Luque De Castro, M.D. Changes in the composition of the polar fraction of Persian lime ( Citrus latifolia ) during fruit growth by LC-QTOF MS/MS analysis. Food Chem. 2017, 234, 262–268. [Google Scholar] [CrossRef] [PubMed]
- Drosou, C.; Kyriakopoulou, K.; Bimpilas, A.; Tsimogiannis, D.; Krokida, M. A comparative study on different extraction techniques to recover red grape pomace polyphenols from vinification byproducts. Ind. Crops Prod. 2015, 75, 141–149. [Google Scholar] [CrossRef]
- Sahin, S.; Samli, R. Optimization of olive leaf extract obtained by ultrasound-assisted extraction with response surface methodology. Ultrason. Sonochem. 2013, 20, 595–602. [Google Scholar] [CrossRef]
- Carrera, C.; Ruiz-Rodríguez, A.; Palma, M.; Barroso, C.G. Ultrasound assisted extraction of phenolic compounds from grapes. Anal. Chim. Acta 2012, 732, 100–104. [Google Scholar] [CrossRef] [PubMed]
- Sousa, A.D.; Vitorino Maia, A.I.; Soares Rodrigues, T.H.; Marques Canuto, K.; Vasconcelos Ribeiro, P.R.; Alves Pereira, R.D.C.; Fontes, R.; Sousa, E. Ultrasound-assisted and pressurized liquid extraction of phenolic compounds from Phyllanthus amarus and its composition evaluation by UPLC-QTOF. Ind. Crops Prod. 2016, 79, 91–103. [Google Scholar] [CrossRef]
- Peterson, J.J.; Beecher, G.R.; Bhagwat, S.A.; Dwyer, J.T.; Gebhardt, E.; Haytowitz, D.B.; Holden, J.M. Flavanones in grapefruit, lemons, and limes: A compilation and review of the data from the analytical literature. J. Food Compos. Anal. 2006, 19, 74–80. [Google Scholar] [CrossRef]
- Garcia-Castello, E.M.; Rodriguez-Lopez, A.D.; Mayor, L.; Ballesteros, R.; Conidi, C.; Cassano, A. Optimization of conventional and ultrasound assisted extraction of fl avonoids from grapefruit ( Citrus paradisi L.) solid wastes. LWT-Food Sci. Technol. 2015, 64, 1114–1122. [Google Scholar] [CrossRef]
- Pulicharla, R.; Marques, C.; Kumar, R.; Rouissi, T.; Kaur, S. Encapsulation and release studies of strawberry polyphenols in biodegradable chitosan nanoformulation. Int. J. Biol. Macromol. 2016, 88, 171–178. [Google Scholar] [CrossRef]
- Gopalakrishnan, L.; Narashimhan, L.; Sethuraman, S.; Maheswari, U. Ellagic acid encapsulated chitosan nanoparticles as anti-hemorrhagic agent. Carbohydr. Polym. 2014, 111, 215–221. [Google Scholar] [CrossRef] [PubMed]
- Helal, A.; Tagliazucchi, D.; Verzelloni, E.; Conte, A. Gastro-pancreatic release of phenolic compounds incorporated in a polyphenols-enriched cheese-curd. LWT-Food Sci. Technol. 2015, 60. [Google Scholar] [CrossRef]
- Zhang, H.; Zhao, Y. Preparation, characterization and evaluation of tea polyphenol-Zn complex loaded B-chitosan nanoparticles. Food Hydrocoll. 2015, 48, 260–273. [Google Scholar] [CrossRef]
- Bof, M.J.; Jiménez, A.; Locaso, D.E.; García, M.A.; Chiralt, A. Grapefruit Seed Extract and Lemon Essential Oil as Active Agents in Corn Starch–Chitosan Blend Films. Food Bioprocess Technol. 2016, 9, 2033–2045. [Google Scholar] [CrossRef]
- Ramin, B.; Li, Y.; Jin, W.; An, Y.; He, L.; Li, Z.; Xu, W.; Li, B. Preparation and optimization of Pickering emulsion stabilized by chitosan-tripolyphosphate nanoparticles for curcumin encapsulation. Food Hydrocoll. 2016, 52, 369–377. [Google Scholar] [CrossRef]
- Floris, A.; Meloni, M.C.; Lai, F.; Marongiu, F.; Maccioni, A.M.; Sinico, C. Cavitation effect on chitosan nanoparticle size: A possible approach to protect drugs from ultrasonic stress. Carbohydr. Polym. 2013, 94, 619–625. [Google Scholar] [CrossRef]
- Woranuch, S.; Yoksan, R. Eugenol-loaded chitosan nanoparticles: I. Thermal stability improvement of eugenol through encapsulation. Carbohydr. Polym. 2013, 96, 578–585. [Google Scholar] [CrossRef]
- Esparza-Martínez, F.J.; Miranda-López, R.; Guzman-Maldonado, S.H. Effect of air-drying temperature on extractable and non-extractable phenolics and antioxidant capacity of lime wastes. Ind. Crops Prod. 2016, 84, 1–6. [Google Scholar] [CrossRef]
- Chen, F.; Shi, Z.; Neoh, K.G.; Kang, E.T. Antioxidant and antibacterial activities of eugenol and carvacrol-grafted chitosan nanoparticles. Biotechnol. Bioeng. 2009, 104, 30–39. [Google Scholar] [CrossRef]
- Plascencia-Jatomea, M.; Viniegra, G.; Olayo, R.; Castillo-Ortega, M.M.; Shirai, K. Effect of Chitosan and Temperature on Spore Germination of Aspergillus niger. Macromol. Biosci. 2003, 3, 582–586. [Google Scholar] [CrossRef]
- Eshghi, S.; Hashemi, M. Effect of Nanochitosan-Based Coating With and Without Copper Loaded on Physicochemical and Bioactive Components of Fresh Strawberry Fruit ( Fragaria x ananassa Duchesne ) During Storage. Food Bioprocess Technol. 2014, 7, 2397–2409. [Google Scholar] [CrossRef]
- Tim Cushnie, T.P.; Lamb, A.J. Recent advances in understanding the antibacterial properties of flavonoids. Int. J. Antimicrob. Agents 2011, 38, 99–107. [Google Scholar] [CrossRef] [PubMed]
- Verlee, A.; Mincke, S.; Stevens, C. V Recent developments in antibacterial and antifungal chitosan and its derivatives. Carbohydr. Polym. 2017, 164, 268–283. [Google Scholar] [CrossRef] [PubMed]
- Lee, D.; Woo, J.-Y.; Ahn, C.-B.; Je, J.-Y. Chitosan–hydroxycinnamic acid conjugates: Preparation, antioxidant and antimicrobial activity. Food Chem. 2014, 148, 97–104. [Google Scholar] [CrossRef] [PubMed]
- Mohammadi, A.; Hashemi, M.; Masoud, S. Effect of chitosan molecular weight as micro and nanoparticles on antibacterial activity against some soft rot pathogenic bacteria. LWT-Food Sci. Technol. 2016, 71, 347–355. [Google Scholar] [CrossRef]
- Covarrubias-Cárdenas, A.; Martínez-Castillo, J.; Medina-Torres, N.; Ayora-Talavera, T.; Espinosa-Andrews, H.; García-Cruz, N.; Pacheco, N. Antioxidant Capacity and UPLC-PDA ESI-MS Phenolic Profile of Stevia rebaudiana Dry Powder Extracts Obtained by Ultrasound Assisted Extraction. Agronomy 2018, 8, 170. [Google Scholar] [CrossRef]
- Medina-Torres, N.; Covarrubias-Cárdenas, A.; Herrera-Pool, E.; Espinosa-Andrews, H.; Trombotto, S.; Ayora-Talavera, T.; Pacheco-López, N. Evaluation of the formation conditions and physicochemical characterization of Chitosan Nanoparticles. J. Bioeng. Biomed. Res. 2018, 2, 9–16. [Google Scholar]
- Espinosa-andrews, H.; Enríquez-Ramírez, K.; García-Márquez, E.; Ramírez-Santiago, C.; Lobato-Calleros, C.; Vernon-Carter, J. Interrelationship between the zeta potential and viscoelastic properties in coacervates complexes. Carbohydr. Polym. 2013, 95, 161–166. [Google Scholar] [CrossRef]
Sample Availability: Does not apply. |


| Experimental Run | Independent Variables | TPC (mg GAE/g dw) | ||||
|---|---|---|---|---|---|---|
| X1 (%) | X2 (min) | X3 (%) | X4 (g/mL) | Experimental | Predicted | |
| 1 | 70 | 12.5 | 80 | 1/40 | 12.40 ± 0.23 | 13.39 |
| 2 | 60 | 15.0 | 60 | 1/45 | 11.62 ± 0.44 | 12.02 |
| 3 | 60 | 15.0 | 100 | 1/45 | 11.07 ± 0.29 | 10.52 |
| 4 | 60 | 12.5 | 60 | 1/40 | 10.53 ± 0.20 | 9.70 |
| 5 | 70 | 12.5 | 60 | 1/45 | 10.32 ± 0.14 | 9.71 |
| 6 | 60 | 12.5 | 100 | 1/40 | 12.04 ± 0.51 | 12.04 |
| 7 | 60 | 12.5 | 100 | 1/50 | 14.18 ± 0.39 | 14.75 |
| 8 | 60 | 10.0 | 80 | 1/40 | 12.22 ± 0.23 | 12.68 |
| 9 | 50 | 12.5 | 100 | 1/45 | 12.35 ± 0.01 | 12.96 |
| 10 | 70 | 12.5 | 80 | 1/50 | 14.77 ± 0.58 | 14.50 |
| 11 | 60 | 10.0 | 60 | 1/45 | 8.10 ± 0.01 | 8.78 |
| 12 | 60 | 15.0 | 80 | 1/40 | 12.86 ± 0.33 | 12.08 |
| 13 | 50 | 10.0 | 80 | 1/45 | 14.55 ± 0.44 | 14.49 |
| 14 | 60 | 12.5 | 60 | 1/50 | 12.74 ± 0.49 | 12.41 |
| 15 | 70 | 12.5 | 100 | 1/45 | 13.87 ± 0.01 | 13.83 |
| 16 | 60 | 12.5 | 80 | 1/45 | 14.49 ± 0.32 | 14.40 |
| 17 | 70 | 10.0 | 80 | 1/45 | 13.54 ± 0.29 | 13.59 |
| 18 | 60 | 12.5 | 80 | 1/45 | 14.86 ± 0.39 | 14.40 |
| 19 | 60 | 10.0 | 100 | 1/45 | 15.71 ± 0.02 | 14.96 |
| 20 | 60 | 10.0 | 80 | 1/50 | 15.35 ± 0.29 | 15.40 |
| 21 | 70 | 15.0 | 80 | 1/45 | 12.47 ± 0.17 | 12.99 |
| 22 | 60 | 12.5 | 80 | 1/45 | 14.35 ± 0.08 | 14.40 |
| 23 | 50 | 15.0 | 80 | 1/45 | 13.50 ± 0.40 | 13.89 |
| 24 | 60 | 15.0 | 80 | 1/50 | 15.37 ± 0.06 | 14.80 |
| 25 | 50 | 12.5 | 60 | 1/45 | 11.81 ± 0.20 | 12.40 |
| 26 | 50 | 12.5 | 80 | 1/50 | 17.84 ± 0.01 | 17.01 |
| 27 | 50 | 12.5 | 80 | 1/40 | 12.50 ± 0.59 | 12.69 |
| Method | Phenolic Compounds Profile and Content (mg/g dw) | TPC (mg/g dw) | |||||||
|---|---|---|---|---|---|---|---|---|---|
| Cat | Eri | Cu. Ac | Sin. ac | Dio | Hes | Neo | Nar | ||
| MCT | 0.20 ± 0.0 b | 5.12 ± 0.1 b | 0.63 ± 0.0 b | 0.71 ± 0.0 b | 2.00 ± 0.0 b | 2.01 ± 0.0 b | 0.27 ± 0.0 b | 0.25 ± 0.0 b | 11.19 ± 0.1 b |
| UAE | 2.92 ± 0.1 a | 20.71 ± 0.1 a | 2.86 ± 0.0 a | 3.67 ± 0.1 a | 18.59 ± 0.1 a | 7.30 ± 0.1 b | 1.63 ± 0.0 a | 0.44 ± 0.0 a | 58.13 ± 0.4 a |
| Treatment | Antioxidant Activity (μmol TE/g dw) | Antibacterial Activity MIC (μg/mL) | ||||||||
|---|---|---|---|---|---|---|---|---|---|---|
| ABTS | DPPH | E. coli | S. typhimurium | S. aureus | ||||||
| Trolox eq. | I% | Trolox eq. | I% | MIC | I% | MIC | I% | MIC | I% | |
| Free PLW | 549.08 ± 14.0 b | 57.4 | 592.55 ± 3.9 b | 58.8 | 21.17 ± 0.0 b | 4.72 | 21.17 ± 0.0 b | 4.72 | 28.22 ± 0.0 a | 3.54 |
| CNps | 36.39 ± 5.7 c | 9.7 | 9.0 ± 0.0 c | 2.2 | 25.00 ± 0.0 a | 4.00 | 25.00 ± 0.0 a | 4.00 | 15.00 ± 0.0 b | 6.66 |
| PL-CNps | 795.37 ± 1.9 a | 80.4 | 687.81 ± 14.3 a | 66.0 | 10.31 ± 0.0 c | 9.69 | 10.31 ± 0.0 c | 9.69 | 10.31 ± 0.0 c | 9.69 |
© 2019 by the authors. Licensee MDPI, Basel, Switzerland. This article is an open access article distributed under the terms and conditions of the Creative Commons Attribution (CC BY) license (http://creativecommons.org/licenses/by/4.0/).
Share and Cite
Medina-Torres, N.; Espinosa-Andrews, H.; Trombotto, S.; Ayora-Talavera, T.; Patrón-Vázquez, J.; González-Flores, T.; Sánchez-Contreras, Á.; Cuevas-Bernardino, J.C.; Pacheco, N. Ultrasound-Assisted Extraction Optimization of Phenolic Compounds from Citrus latifolia Waste for Chitosan Bioactive Nanoparticles Development. Molecules 2019, 24, 3541. https://doi.org/10.3390/molecules24193541
Medina-Torres N, Espinosa-Andrews H, Trombotto S, Ayora-Talavera T, Patrón-Vázquez J, González-Flores T, Sánchez-Contreras Á, Cuevas-Bernardino JC, Pacheco N. Ultrasound-Assisted Extraction Optimization of Phenolic Compounds from Citrus latifolia Waste for Chitosan Bioactive Nanoparticles Development. Molecules. 2019; 24(19):3541. https://doi.org/10.3390/molecules24193541
Chicago/Turabian StyleMedina-Torres, Nelly, Hugo Espinosa-Andrews, Stéphane Trombotto, Teresa Ayora-Talavera, Jesús Patrón-Vázquez, Tania González-Flores, Ángeles Sánchez-Contreras, Juan C. Cuevas-Bernardino, and Neith Pacheco. 2019. "Ultrasound-Assisted Extraction Optimization of Phenolic Compounds from Citrus latifolia Waste for Chitosan Bioactive Nanoparticles Development" Molecules 24, no. 19: 3541. https://doi.org/10.3390/molecules24193541