
Supercritical Carbon Dioxide (scCO2) Extraction of Phenolic Compounds from Lavender (Lavandula angustifolia) Flowers: A Box-Behnken Experimental Optimization


Abstract
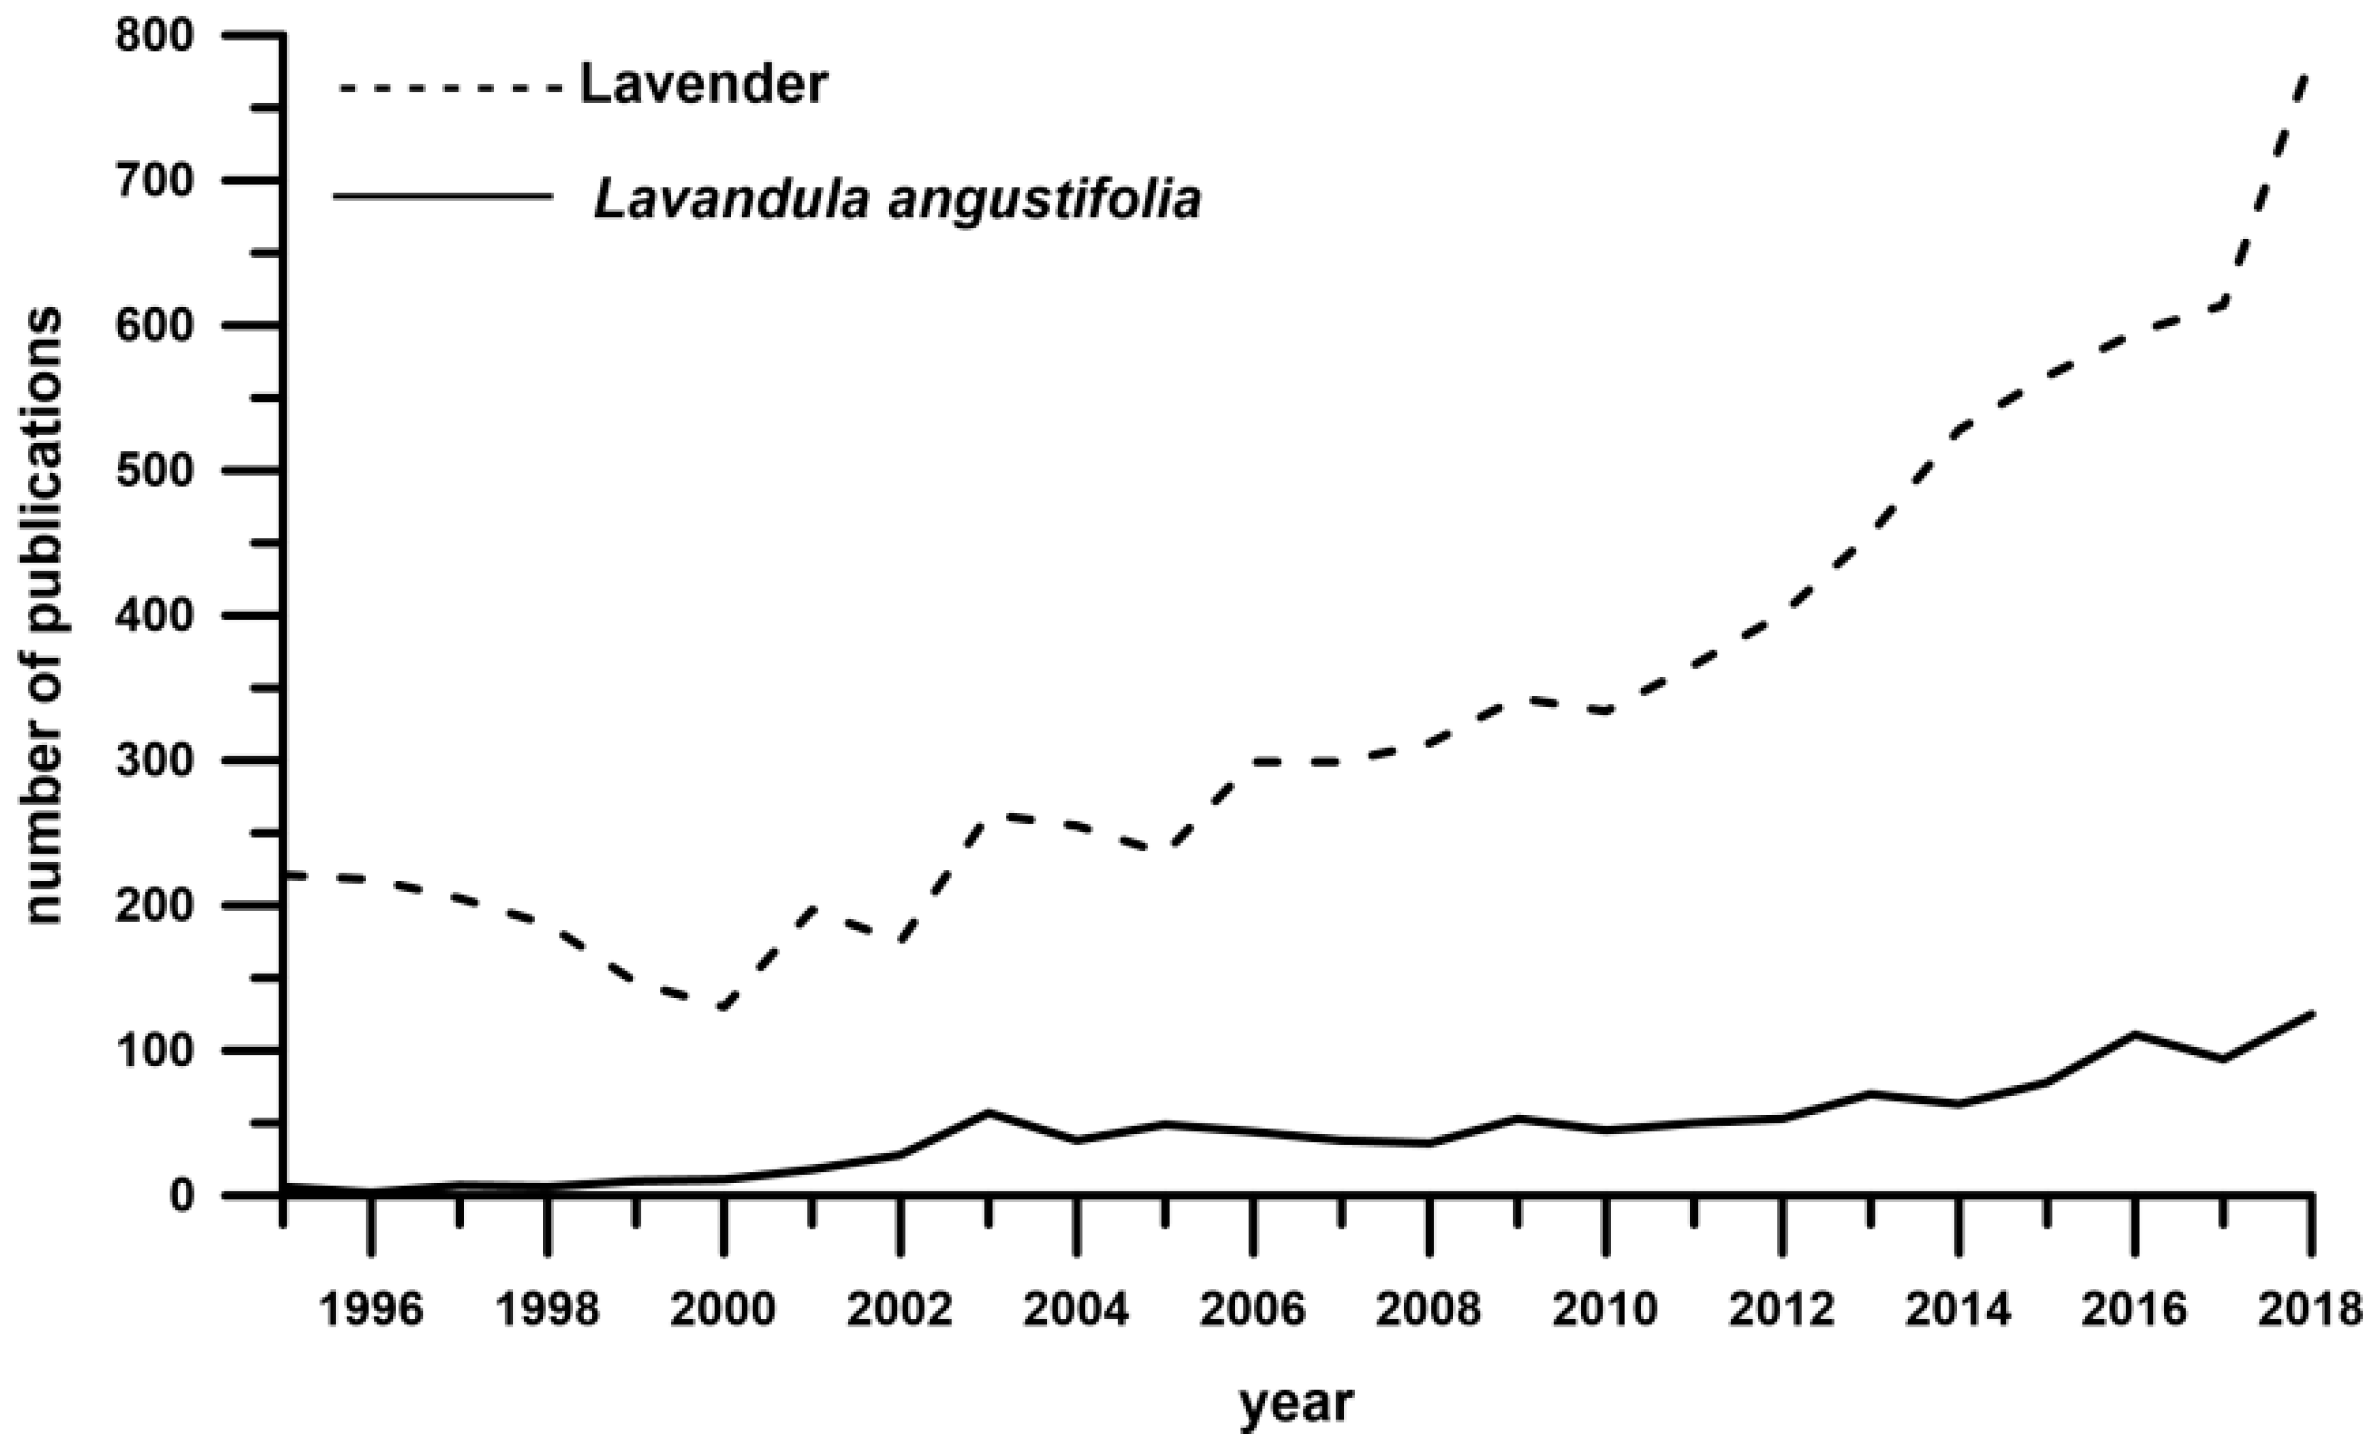
:1. Introduction
2. Results and Discussion
2.1. Supercritical Fluid Extraction of Lavender
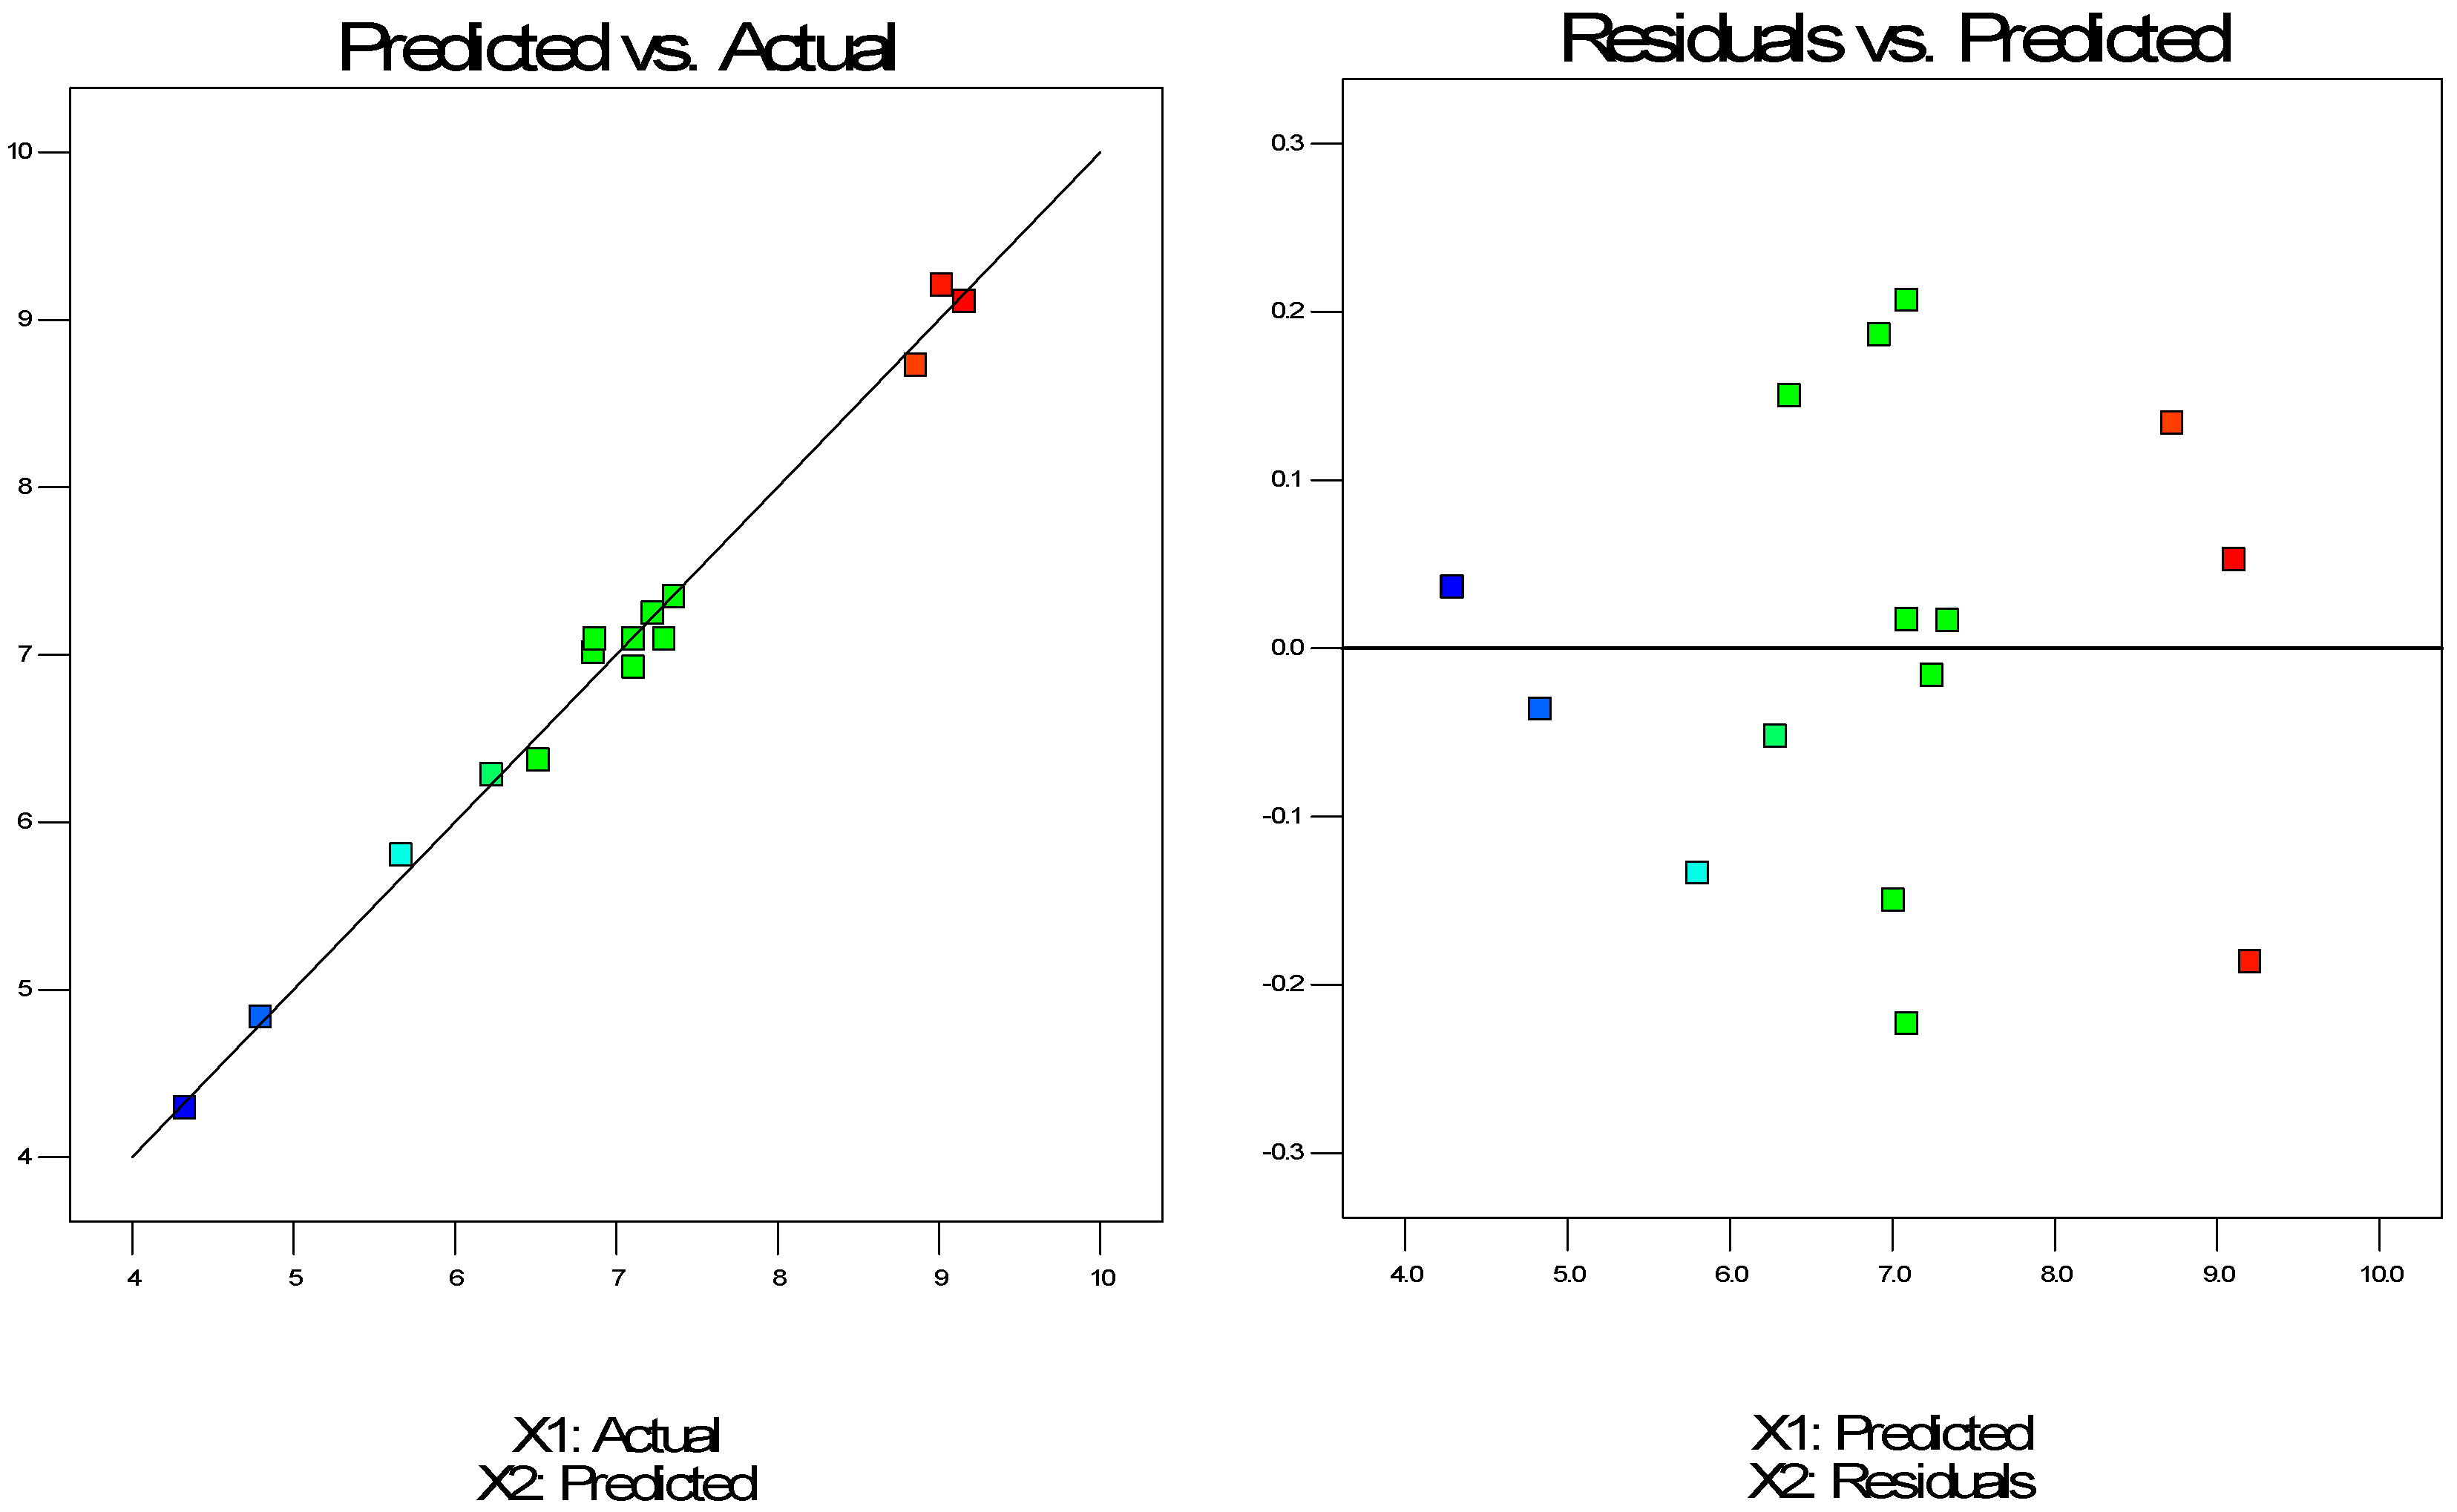
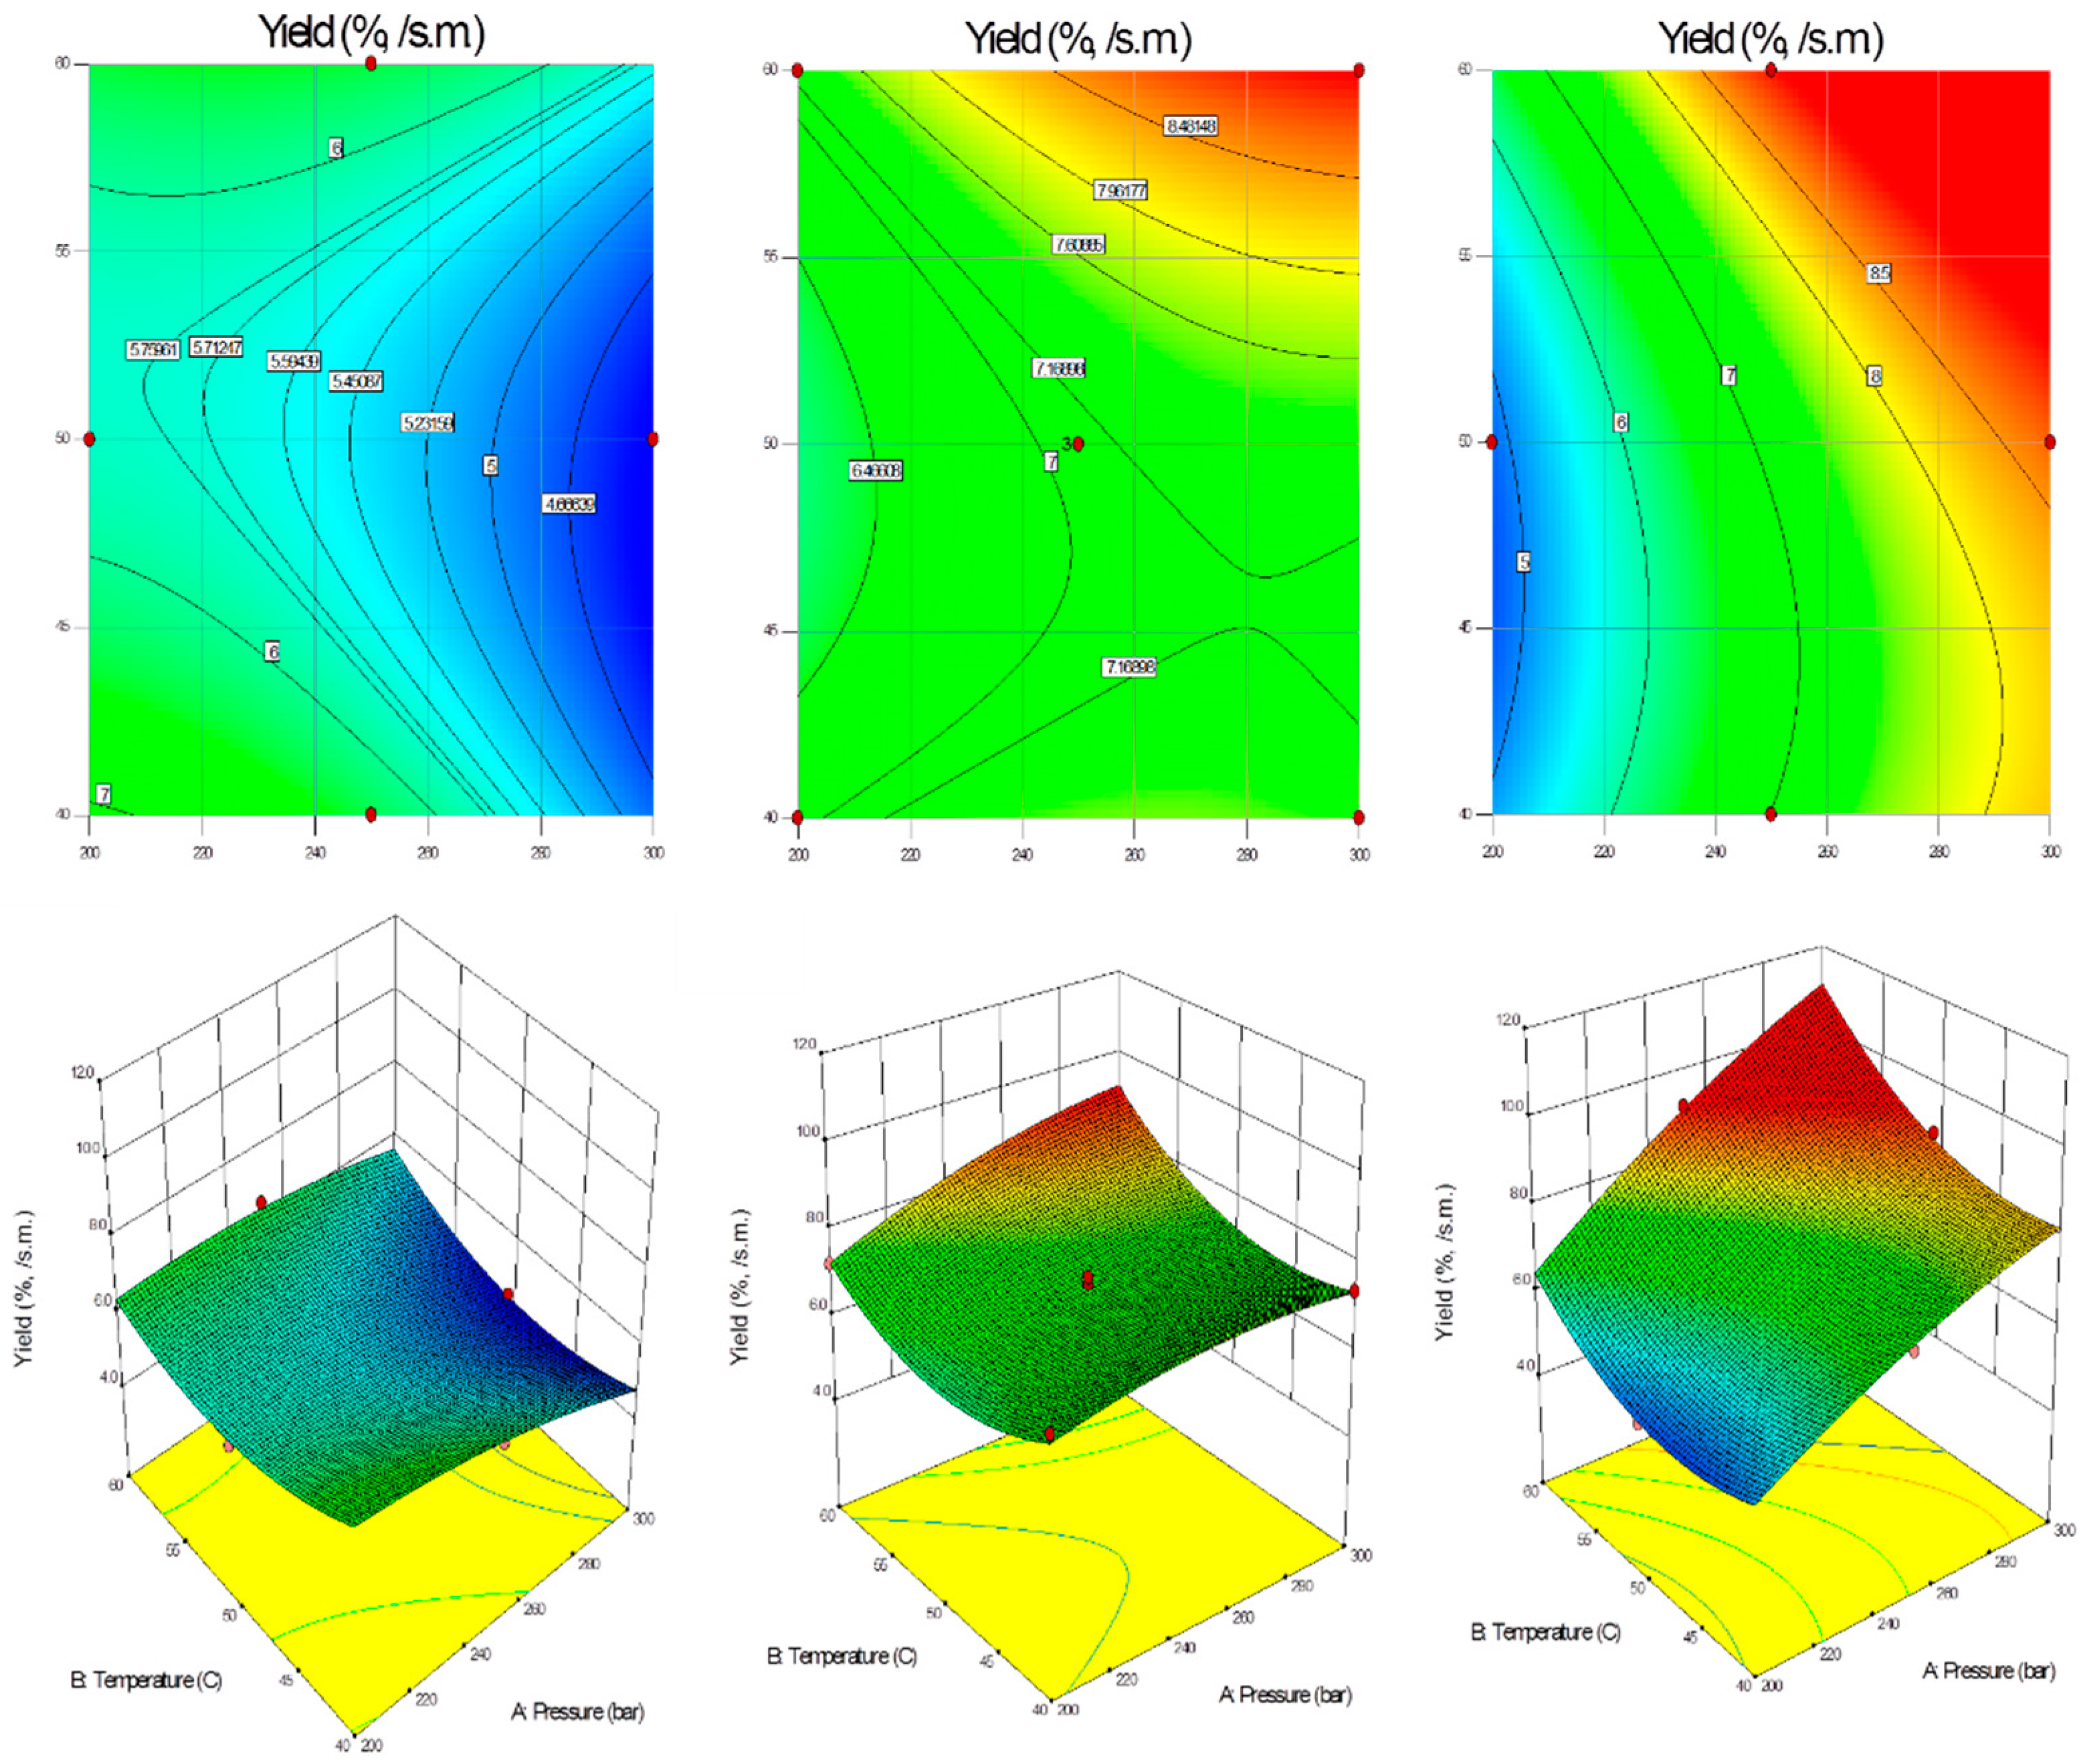
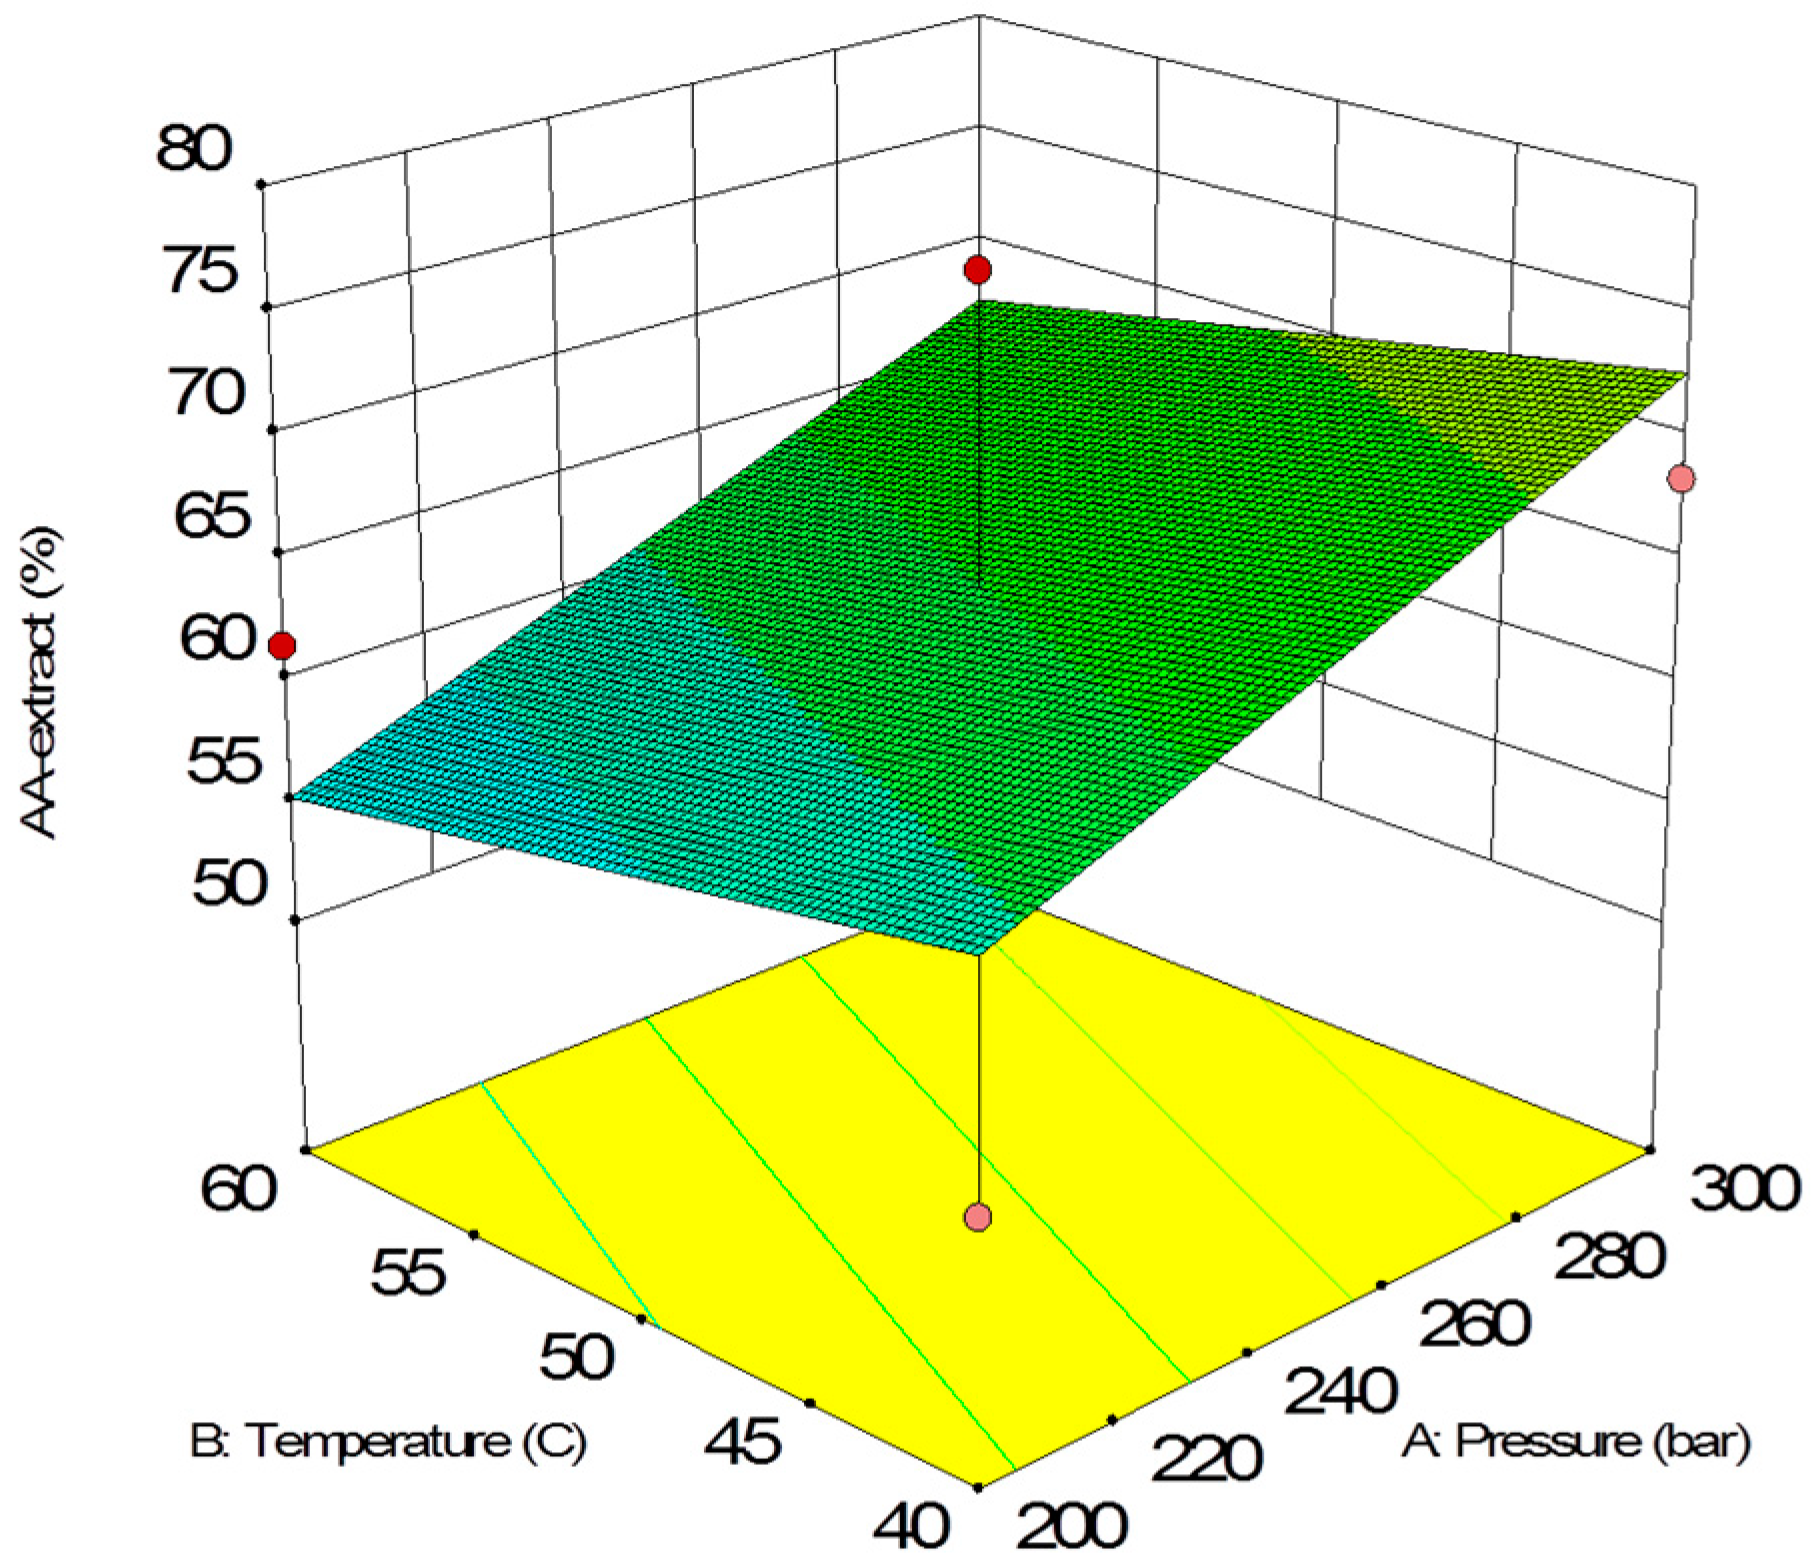
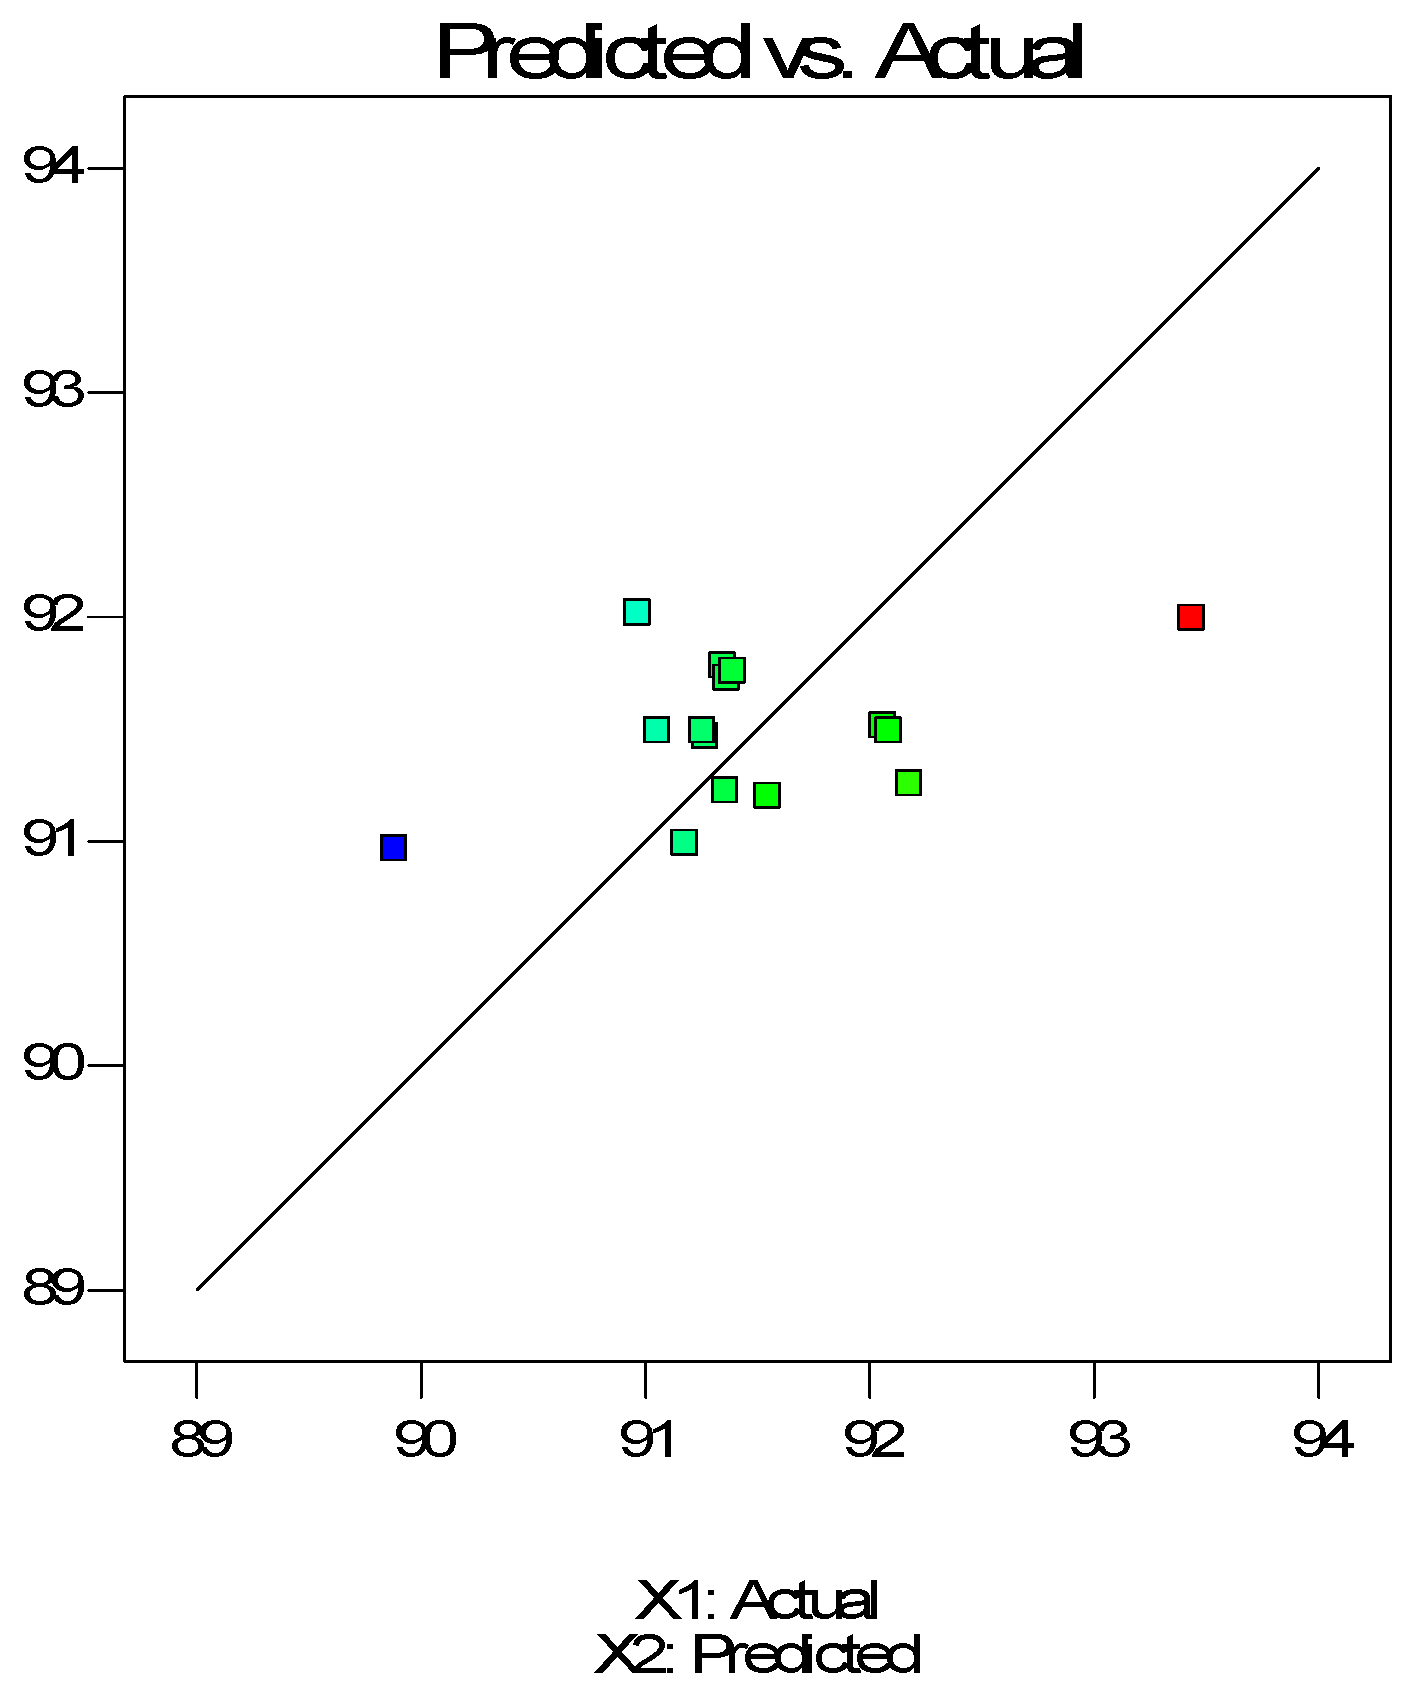
2.2. Optimization of Operating Conditions—Extraction Yield
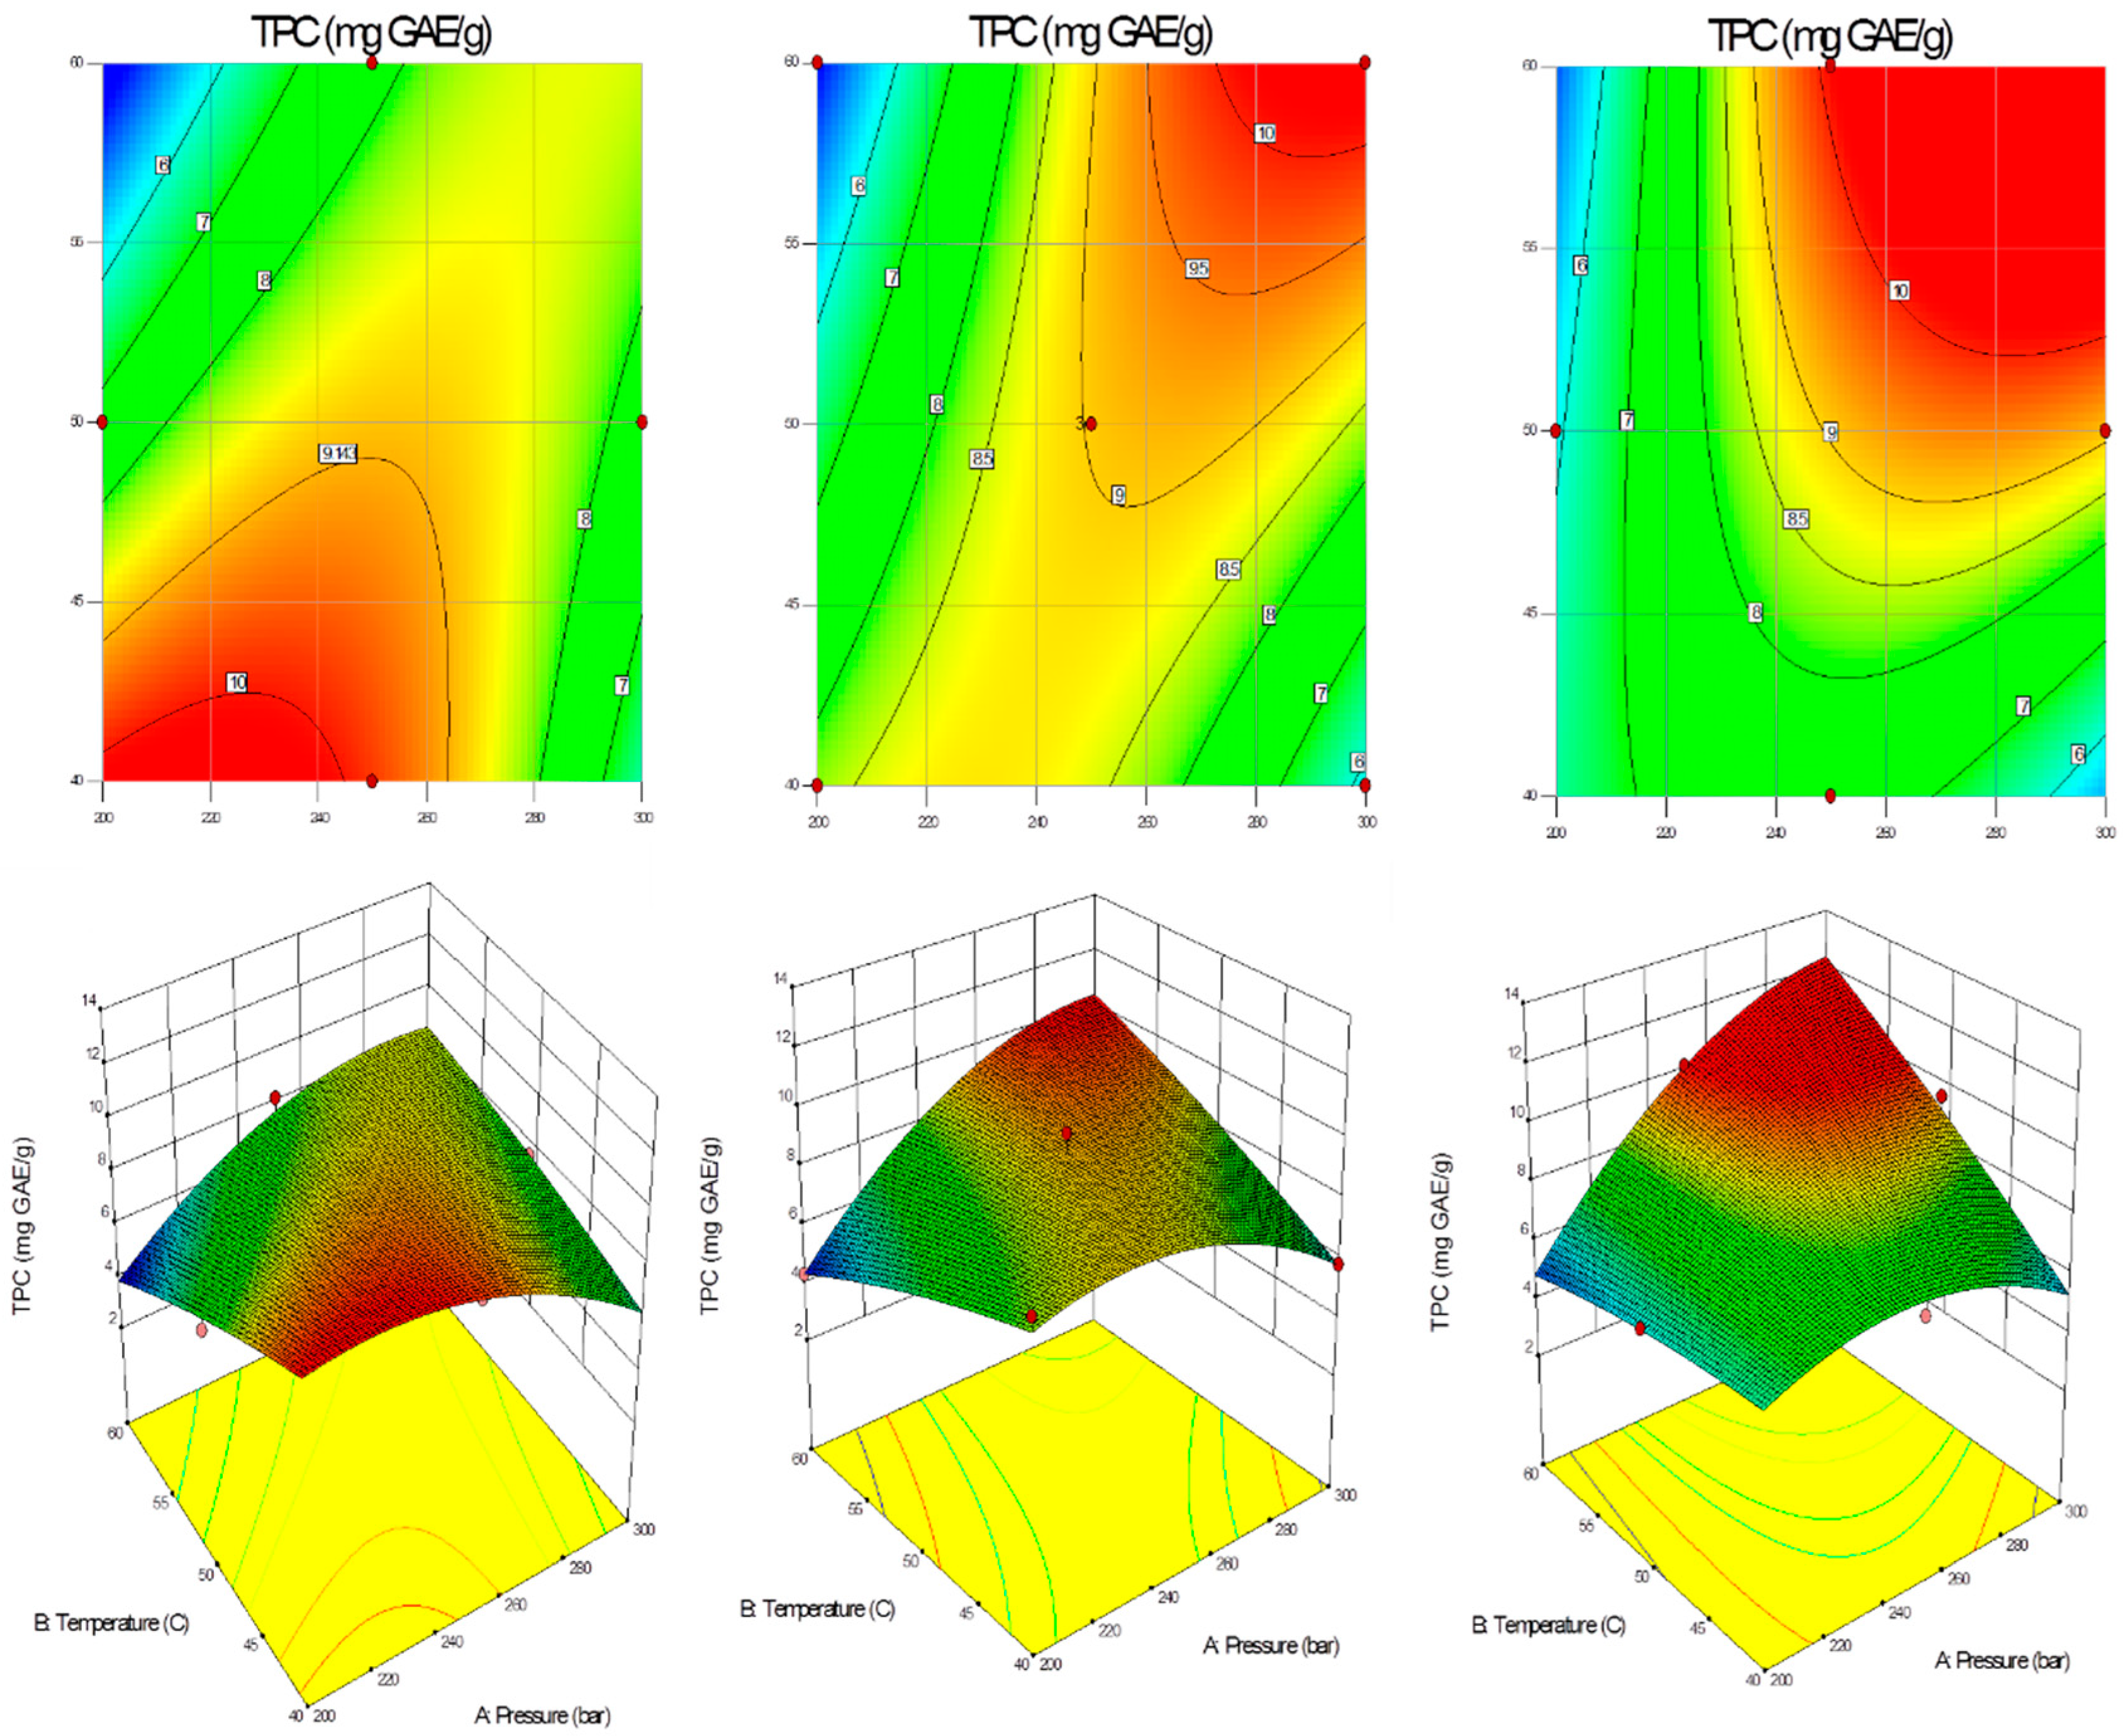
2.3. Total Phenolic Content
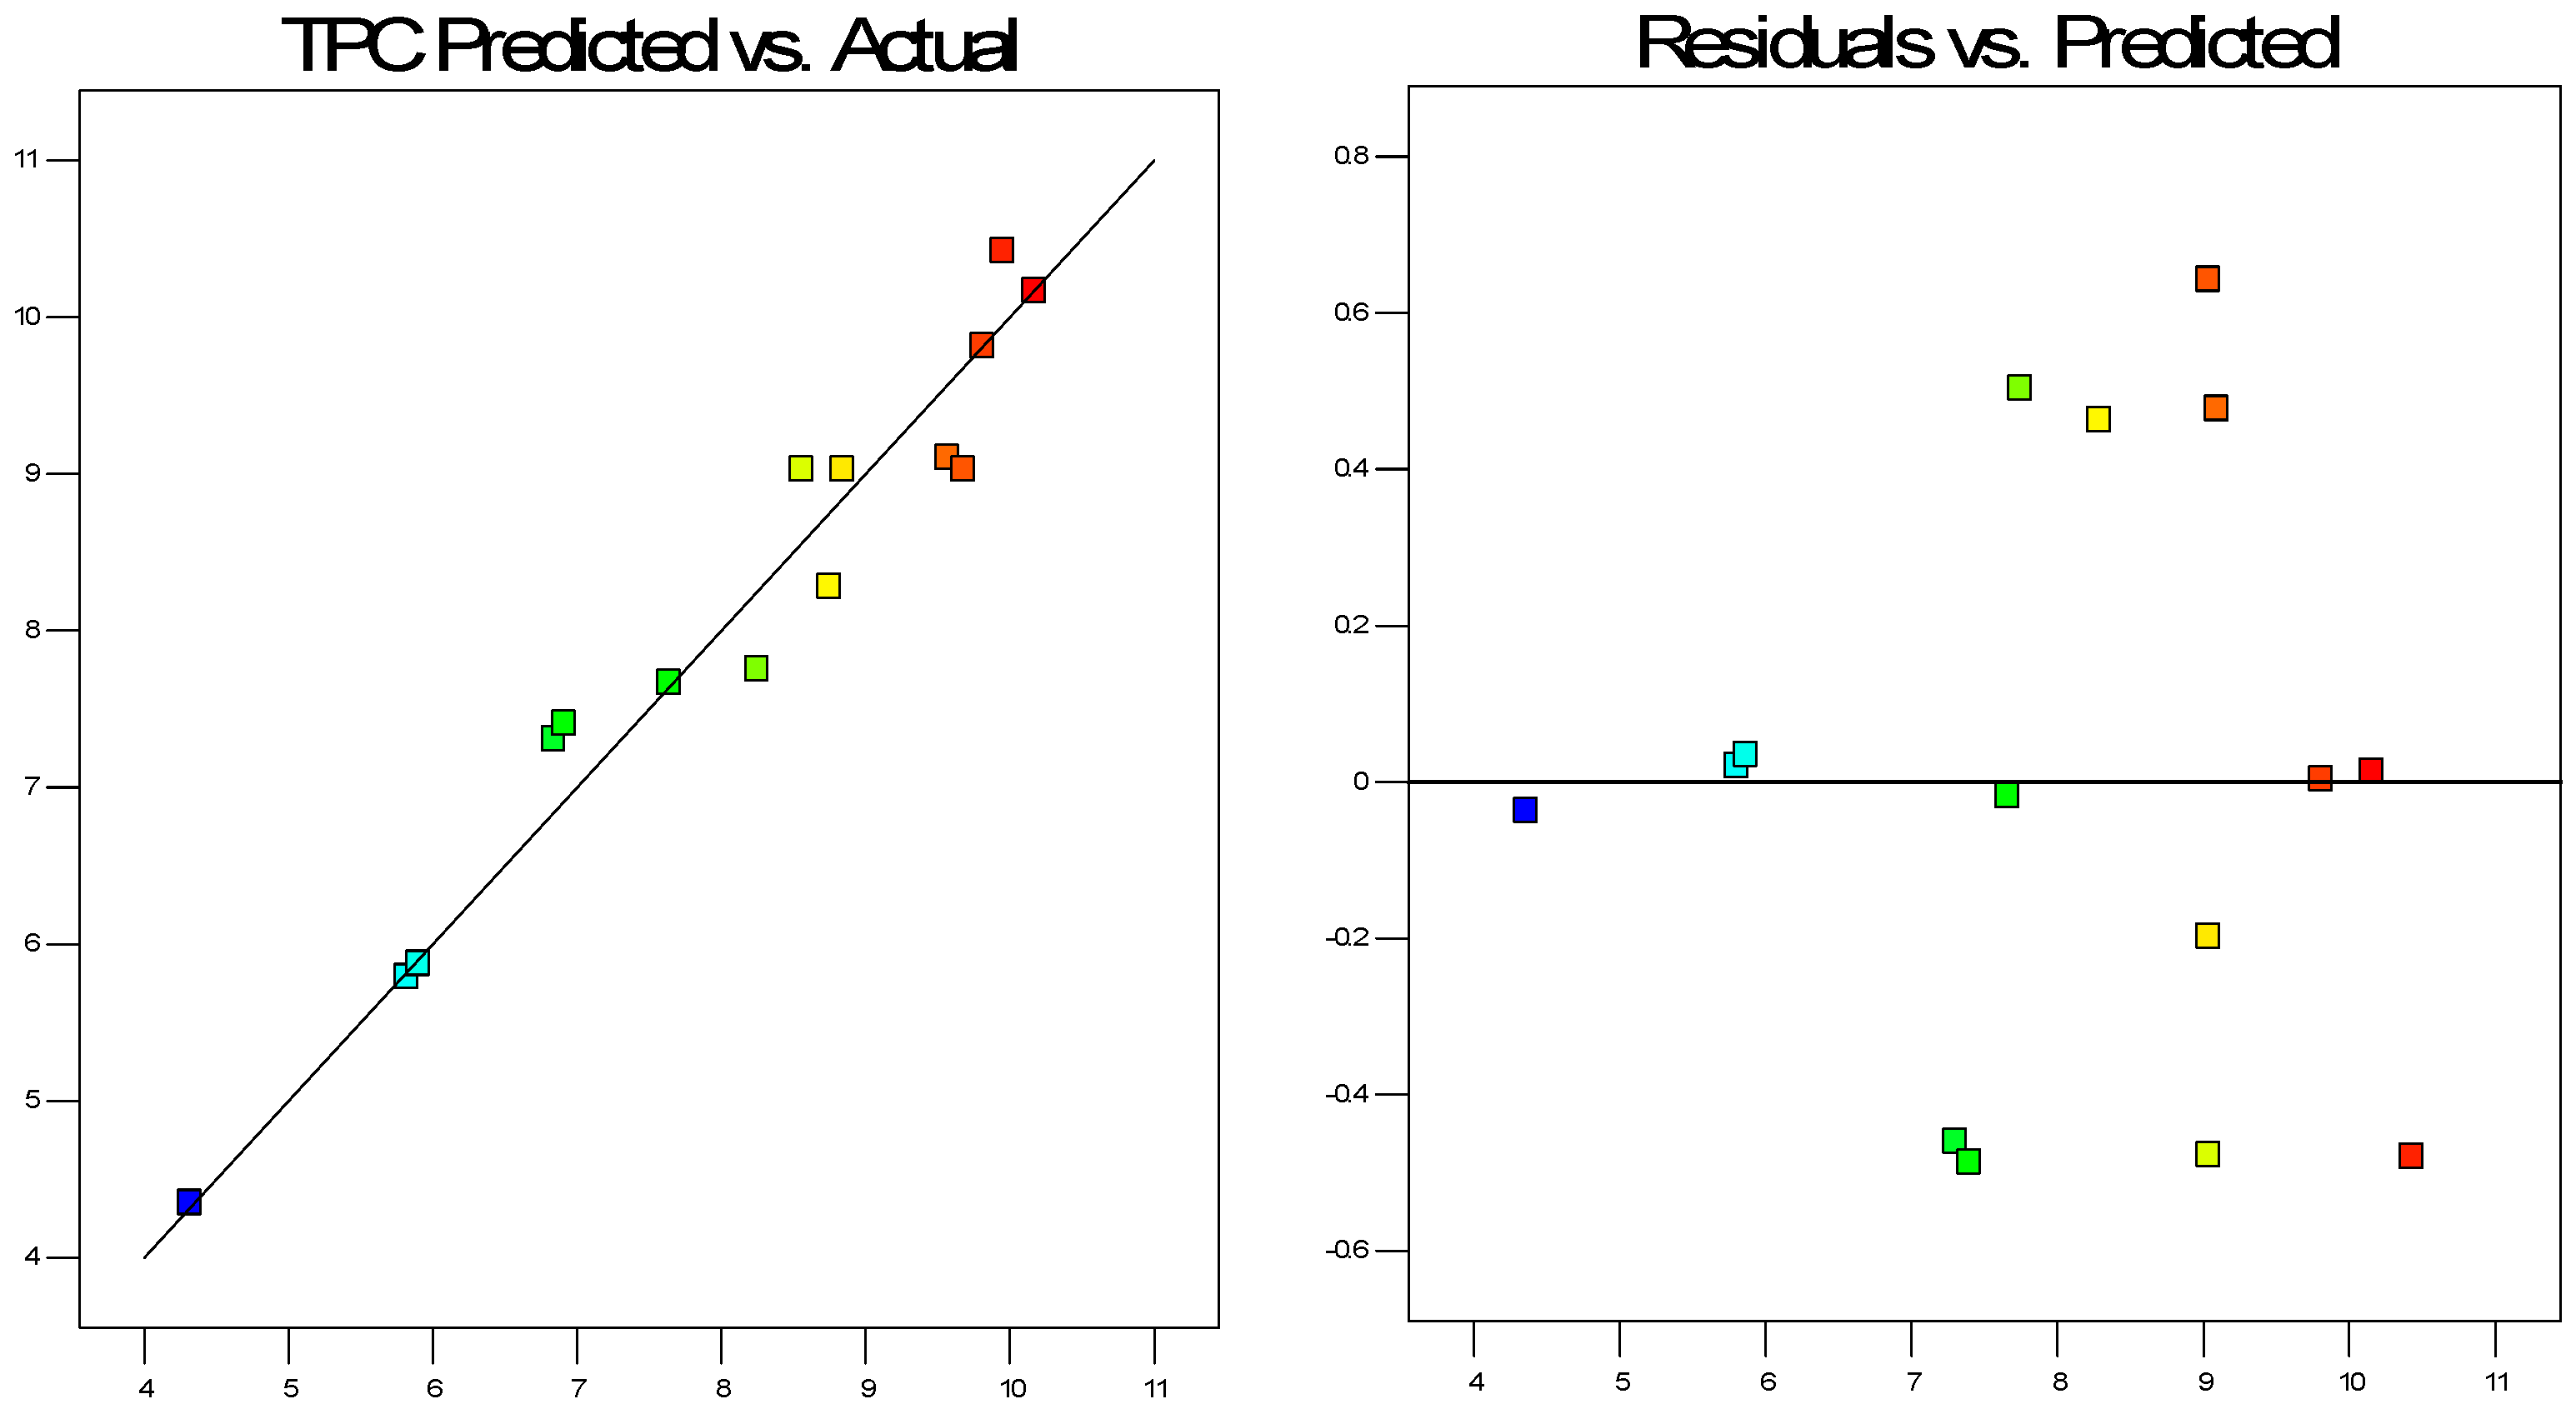
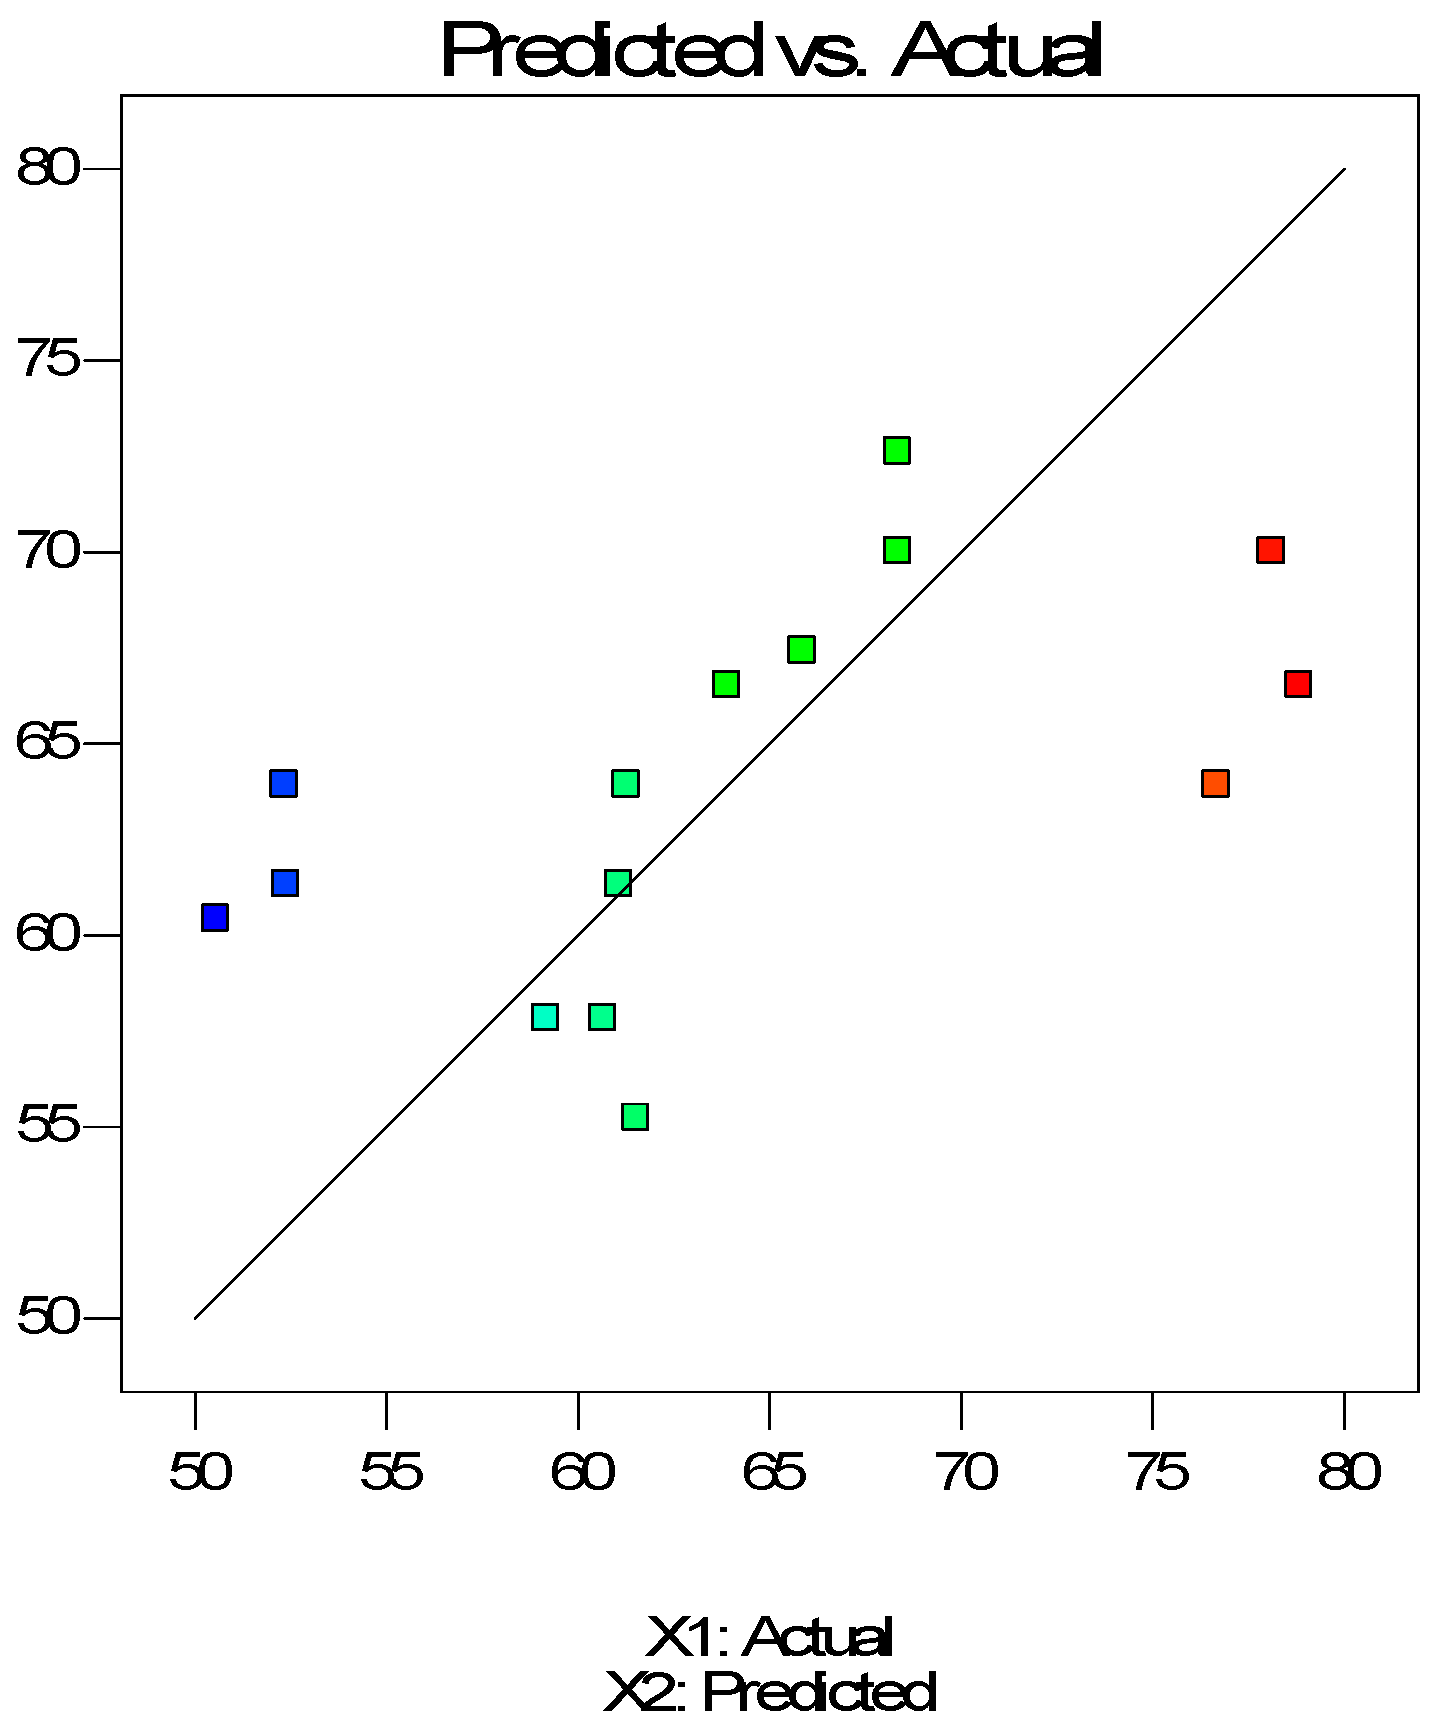
2.4. Optimization of Operating Conditions—Total Phenolic Content
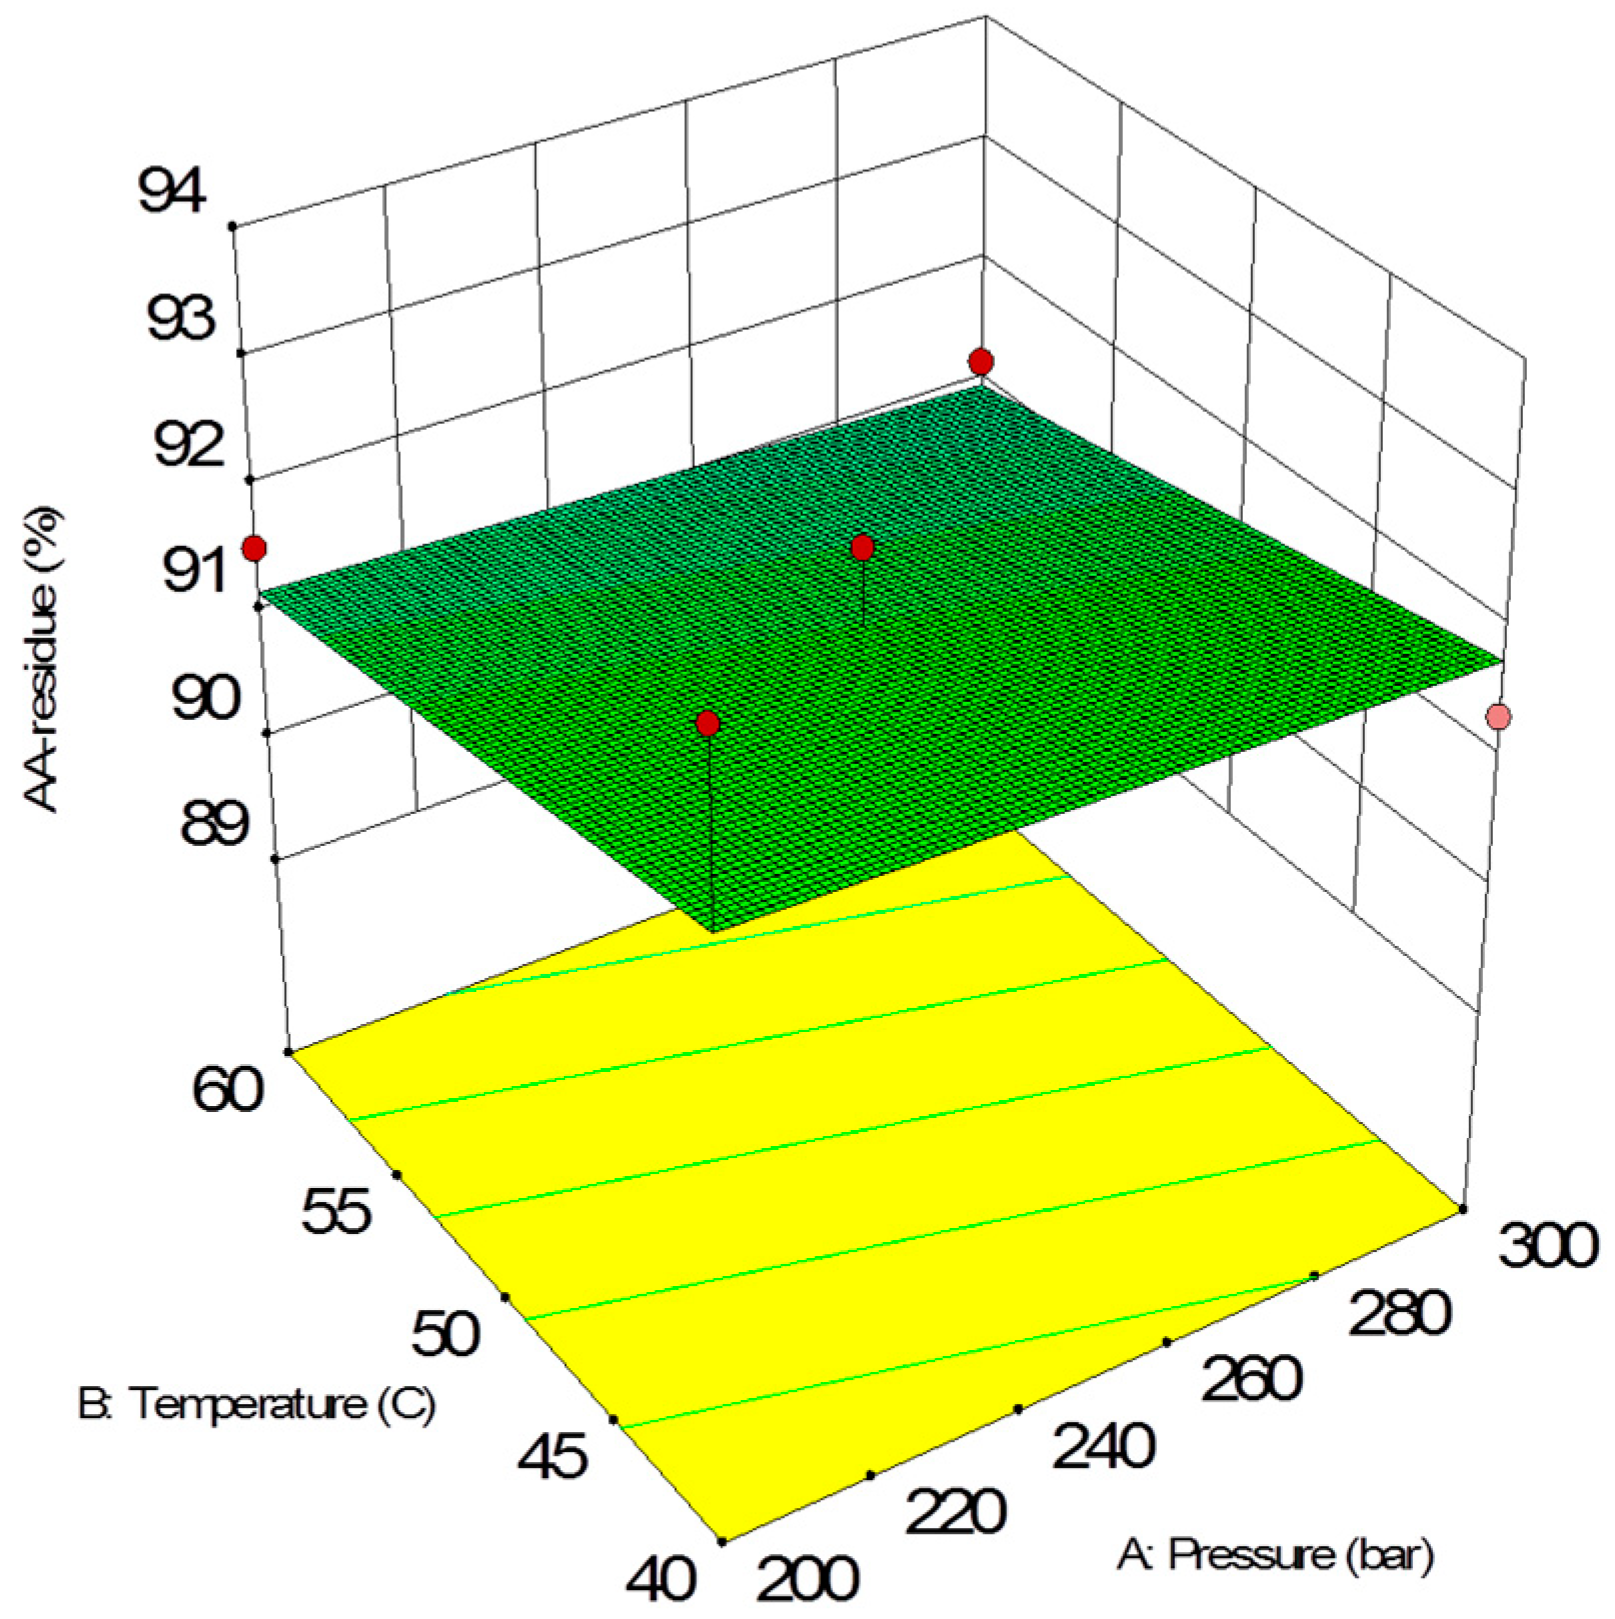
2.5. Variables Affecting Procedure
3. The Cost of Manufacturing (COM)
The Cost of Manufacturing Using Supercritical Fluid Extraction
4. Materials and Methods
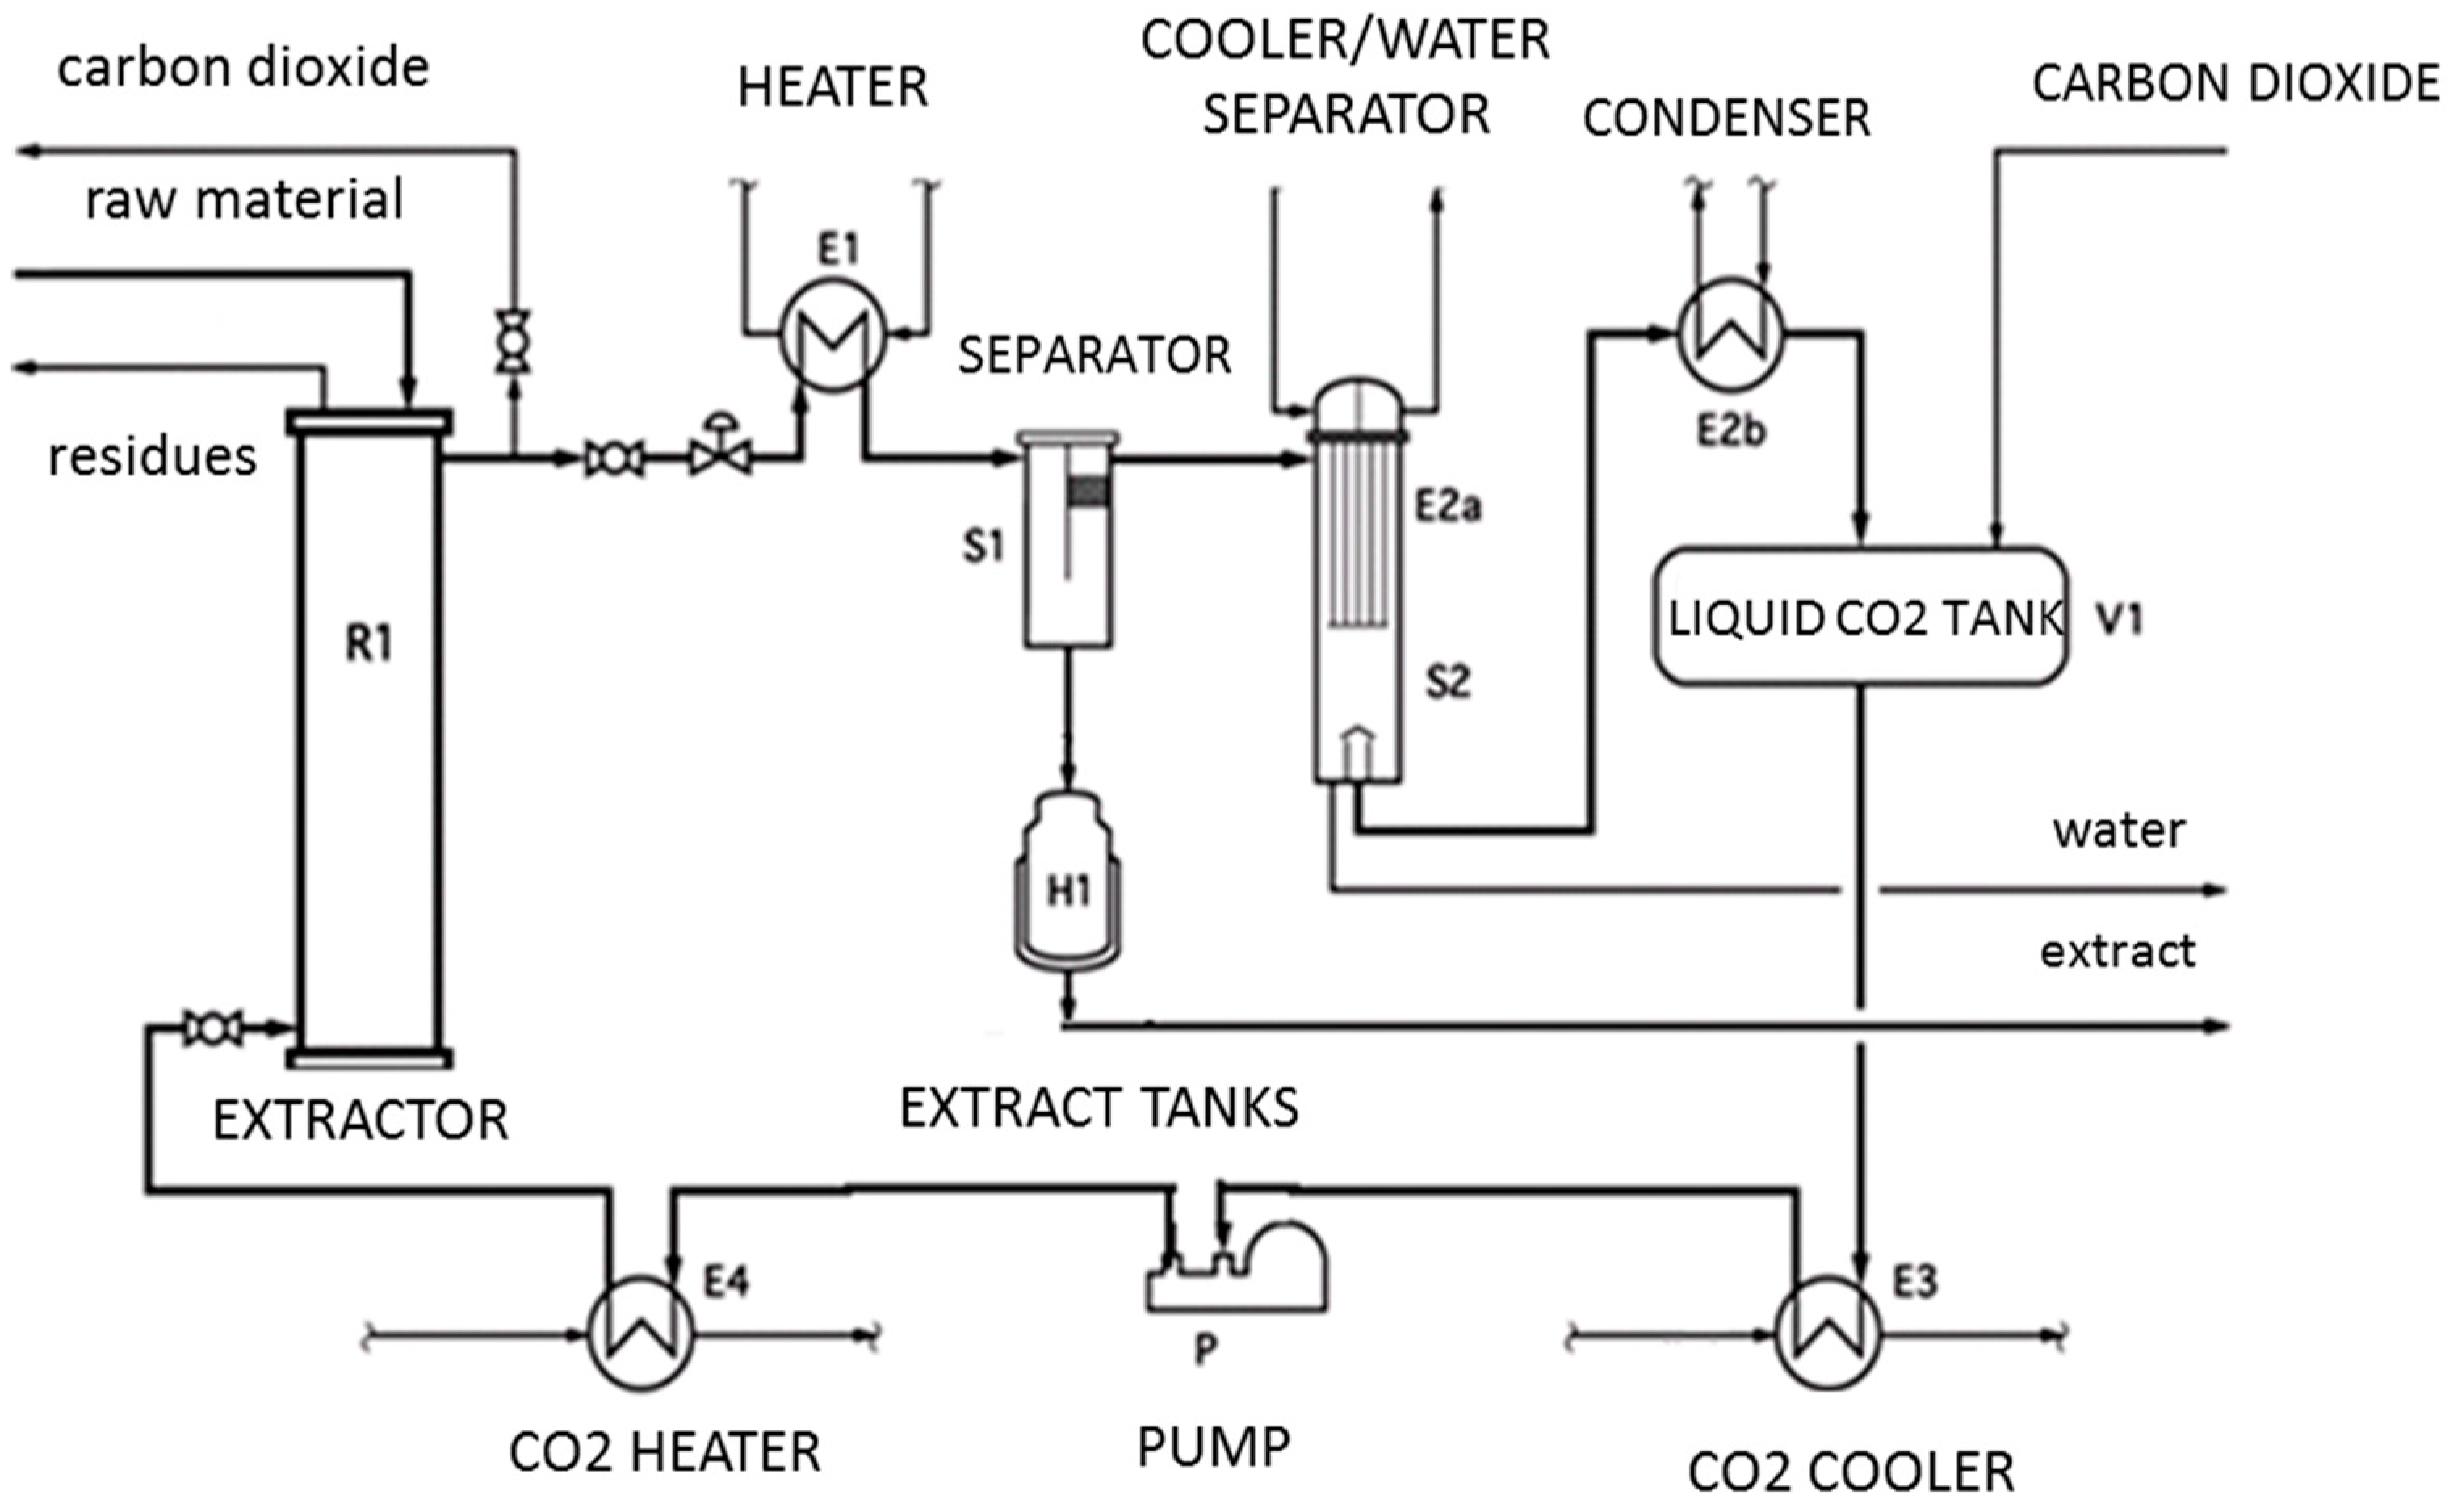
4.1. Supercritical Fluid Extraction
4.2. Total Phenolic Content
4.3. Radical Scavenging Activity Using DPPH Method
5. Conclusions
Author Contributions
Funding
Conflicts of Interest
References
- Zheljazkov, V.D.; Cantrell, C.L.; Astatkie, T.; Jeliazkova, E. Distillation time effect on lavender essential oil yield and composition. J. Oleo Sci. 2013, 62, 195–199. [Google Scholar] [CrossRef] [PubMed]
- Cavanagh, H.M.A.; Wilkinson, J.M. Biological activities of lavender essential oil. Phytother. Res. 2002, 16, 301–308. [Google Scholar] [CrossRef] [PubMed]
- Sytar, O.; Hemmerich, I.; Zivcak, M.; Rauh, C.; Brestic, M. Comparative analysis of bioactive phenolic compounds composition from 26 medicinal plants. Saudi J. Biol. Sci. 2018, 25, 631–641. [Google Scholar] [CrossRef] [PubMed] [Green Version]
- Yadikar, N.; Bobakulov, K.; Li, G.; Aisa, H.A. Seven new phenolic compounds from Lavandula angustifolia. Phytochem. Lett. 2018, 23, 149–154. [Google Scholar] [CrossRef]
- Zhao, J.; Xu, F.; Huang, H.; Ji, T.; Li, C.; Tan, W.; Chen, Y.; Ma, L. Evaluation of bioactivities of total flavonoids from Lavandula angustifolia. Pak. J. Pharm. Sci. 2015, 28, 1245–1251. [Google Scholar] [PubMed]
- Wu, X.; Liu, J.; Yu, Z.; Ye, Y.; Zhou, Y. Chemical constituents of Lavandula augustifolia. Acta Chim. Sinica 2007, 65, 1649–1653. [Google Scholar]
- Adasoglu, N.; Dincer, S.; Bolat, E. Supercritical-fluid extraction of essential oil from Turkish Lavender flowers. J. Supercrit. Fluids. 1994, 7, 93–99. [Google Scholar] [CrossRef]
- Akgün, M.; Akgün, N.A.; Dincer, S. Extraction and modeling of Lavender flower essential oil using supercritical carbon dioxide. Ind. Eng. Chem. Res. 2000, 39, 473–477. [Google Scholar] [CrossRef]
- Capuzzo, A.; Maffei, M.E.; Occhipinti, A. Supercritical fluid extraction of plant flavors and fragrances. Molecules 2013, 18, 7194–7238. [Google Scholar] [CrossRef]
- Nadalin, V.; Lepojvić, Z.; Ristić, M.; Vladić, J.; Nikolovski, B.; Adamović, D. Investigation of cultivated Lavender (Lavandula officinalis L.) extraction and its extract. Chem. Ind. Chem. Eng. 2014, 20, 71–86. [Google Scholar] [CrossRef]
- Jerković, I.; Molnar, M.; Vidović, S.; Vladić, J.; Jokić, S. Supercritical CO2 extraction of Lavandula angustifolia Mill. Flowers: Optimisation of oxygenated monoterpenes, coumarin and nerniarin content. Phytochem. Anal. 2017, 28, 558–566. [Google Scholar] [CrossRef]
- Tyśkiewicz, K.; Konkol, M.; Rój, E. Application of supercritical fluid extraction in phenolic compounds isolation from natural plant materials. Molecules 2018, 23, 2625. [Google Scholar] [CrossRef] [PubMed]
- Piano, C.R.; Aquino, F.W.B.; Follegatti-Romero, L.A.; Cabral, F.A. Supercritical CO2 extraction compounds from Baccharis dracunculifolia. J. Supercrit. Fluids 2008, 47, 209–214. [Google Scholar] [CrossRef]
- Avşar, G.; Yüksel, D.; Emen, F.M.; Demirdöğen, R.E.; Yeşilkaynak, T.; Kahriman, L. Supercritical carbon dioxide extraction of Lavandula officinalis (lavender) and Hypericum perforatum (centaury) plants grown in mersin region: Investigation of antioxidant and antibacterial activities of extracts and usage as cosmetic preservatives in creams. J. Turkish Chem. Soc. 2018, 5, 1215–1220. [Google Scholar]
- Costa, P.; Grosso, C.; Gonçalves, S.; Andrade, P.B.; Valentão, P.; Bernardo-Gil, M.G.; Romano, A. Supercritical fluid extraction and hydrodistillation for the recovery of bioactive compounds from Lavandula virdis L’Her. Food Chem. 2012, 135, 112–121. [Google Scholar] [CrossRef]
- Dahn, N.T.; Triet, N.D.A.; Han, L.T.N.; Zhao, J.; Mammucari, R.; Foster, N. Antioxidant activity, yield and chemical composition of lavender essential oil extracted by supercritical CO2. J. Supercrit. Fluid. 2012, 70, 27–34. [Google Scholar]
- Slavov, A.M.; Karneva, K.B.; Vasileva, I.N.; Denev, P.N.; Denkova, R.S.; Shikov, V.T.; Manolova, M.N.; Lazarova, Y.L.; Ivanona, V.N. Valorization of lavender waste—obtaining and characteristics of polyphenol rich extracts. Food Sci. App. Biotechnol. 2018, 1, 11–18. [Google Scholar]
- Adaszyńska-Skwirzyńska, M.; Dzięcioł, M. Comparison of phenolic acids and flavonoids contents in various cultivars and parts of common lavender (Lavandula angustifolia) derived from Poland. Nat.Prod. Res. 2017, 31, 2575–2580. [Google Scholar] [CrossRef]
- Mousa, O.; Gouda, B.; Salama, M.; El-Eraky, W.; Kassem, H. Total phenolic, total flavonoid content, two isolates and bioactivity of Lavandula pubescens Decne. Int. J.Pharmacogn. Phytochem. Res. 2018, 10, 254–263. [Google Scholar]
- Radulescu, C.; Stihi, C.; Ilie, M.; Lazurcă, D.; Gruia, R.; Olaru, O.T.; Bute, O.; Dulama, I.D.; Stirbescu, R.M.; Teodorescu, S.; et al. Characterization of phenolic in Lavandula angustifolia. Anal. Lett. 2017, 50, 2839–2850. [Google Scholar] [CrossRef]
- Spiridon, I.; Bodirlau, R.; Teaca, C.A. Total phenolic content and antioxidant activity of plants used in traditional Romanian herbal medicine. Cent. Eur. J. Biol. 2011, 6, 388–396. [Google Scholar] [CrossRef]
- Hesham, H.A.; Abdurahman, H.N.; Rosli, M.Y. Techniques for extraction of essential oils from plants: A review. Aust. J. Basic Appl. Sci. 2016, 10, 117–127. [Google Scholar]
- Edris, A.E. Identification and absolute quantification of the major water-soluble aroma components isolated from the hydrosols of some aromatic plants. J. Essent. Oil Bear. Plants 2009, 12, 155–161. [Google Scholar] [CrossRef]
- Prado, J.M.; Assis, A.R.; Maróstica-Júnior, M.R.; Meireles, M.A.A. Manufacturing cost of supercritical-extracted oils and carotenoids from Amazonian plants. J. Food Process. Eng. 2010, 33, 348–369. [Google Scholar] [CrossRef]
- Turton, R.; Bailie, R.C.; Whiting, W.B.; Shaeiwitz, J.A. Analysis, Synthesis and Design of Chemical Process, PTR; Prentice Hall: Upper Saddle River, NJ, USA, 1998. [Google Scholar]
- Rosa, P.T.V.; Meireless, M.A.A. Rapid estimation of the manufacturing cost of extracts obtained by supercritical fluid extraction. J. Food Eng. 2005, 67, 235–240. [Google Scholar] [CrossRef]
- Rocha-Uribe, J.A.; Novelo-Pérez, J.I.; Ruiz-Mercado, C.A. Cost estimation for CO2 supercritical extraction systems and manufacturing cost for habanero chili. J. Supercrit. Fluids 2014, 92, 38–41. [Google Scholar] [CrossRef]
- Adam, K.L. Lavender Production, Markets, and Agritourism. Available online: http://www.attra.ncat.org (accessed on 3 September 2019).
- Gifford, M.; Biancani, E.; Kearsley, W.; Maluchnik, W.; Farrell, S.; Savelski, M.J.; Hesketh, R.P. Economic Feasibility Study on the Supercritical Fluid Extraction of Edible Oils; College of Engineering, Rowan University: Glassboro, NJ, USA; Available online: http://www.supercriticalfluids.com/wp-content/uploads/AP-105-Economic-Feasibility-on-SFE-of-Edible-Oils1.pdf (accessed on 4 September 2019).
- Veggi, P.C.; Prado, J.M.; Bataglion, G.A.; Eberlin, M.N.; Meireles, M.A.A. Obtaining phenolic compounds from jatoba (Hymenaea courbaril L.) bark by supercritical fluids extraction. J. Supercrit. Fluids 2014, 89, 68–77. [Google Scholar] [CrossRef]
- Nurzyńska-Wierdlak, R.; Zawiślak, G. Chemical composition and antioxidant activity of lavender (Lavandula angustifolia) aboveground parts. Acta Sci. Pol. Hortorum Cultus 2015, 15, 225–241. [Google Scholar]
- Soobrattee, M.A.; Bahorun, T.; Aruoma, O.I. Chemopreventive action of polyphenolics compounds in cancer. Biofactors 2006, 27, 19–35. [Google Scholar] [CrossRef]
- Waterhouse, A.L. Determination of total phenolics. Curr. Protocols Food Anal. Chem. 2002, 6, I1.1.1–I1.1.8. [Google Scholar]
- Makanjuola, S.A. Influence of particle size and extraction solvent on antioxidant properties of extracts of tea, ginger, and tea-ginger blend. Food Sci. Nutr. 2017, 5, 1179–1185. [Google Scholar] [CrossRef] [PubMed]
- Brand-Wiliams, W.; Cuvelier, M.E.; Berset, C. Use of a free radical method to evaluate antioxidant activity. Lebenson Wiss Technol. 1995, 28, 25–30. [Google Scholar] [CrossRef]
- Garcia, E.J.; Oldoni, T.L.C.; Reis, A.; Loguercio, A.D.; Grande, R.H.M. Antioxidant activity by DPPH assay of potential solutions to be applied on bleached teeth. Braz. Dent. J. 2012, 23, 22–27. [Google Scholar] [CrossRef] [PubMed]
Sample Availability: Samples of the compounds are not available from the authors. |


| Exp | Pressure (bar) | Temperature (°C) | Time (min) | Observed Yield (w/wt.%) | Total Phenolic Content (mg GAE/g Extract) | Total Phenolic Content (mg GAE/g Dry Mass) | Antioxidant Activity (AA%) | ||||
|---|---|---|---|---|---|---|---|---|---|---|---|
| C | U | C | U | C | U | Extracts | Residues | Extracts | Residues | ||
| 1 | 1 | 300 | 0 | 50 | −1 | 15 | 4.3 | 7.64 | 0.99 | 68.35 ± 0.7 | 92.18 ± 0.3 |
| 2 | 1 | 300 | 0 | 50 | 1 | 45 | 8.9 | 9.57 | 1.31 | 78.10 ± 0.4 | 92.06 ± 0.5 |
| 3 | 0 | 250 | 0 | 50 | 0 | 30 | 7.3 | 8.84 | 1.28 | 61.27 ± 1.1 | 92.09 ± 0.4 |
| 4 | 0 | 250 | 0 | 50 | 0 | 30 | 7.1 | 8.56 | 1.14 | 76.67 ± 0.4 | 91.05 ± 0.6 |
| 5 | 0 | 250 | 1 | 60 | −1 | 15 | 6.5 | 8.25 | 1.20 | 52.39 ± 0.5 | 89.88 ± 0.9 |
| 6 | −1 | 200 | −1 | 40 | 0 | 30 | 7.1 | 8.75 | 1.32 | 50.55 ± 0.7 | 93.44 ± 1.1 |
| 7 | −1 | 200 | 1 | 60 | 0 | 30 | 7.2 | 4.32 | 1.19 | 61.52 ± 0.8 | 91.55 ± 1.0 |
| 8 | −1 | 200 | 0 | 50 | −1 | 15 | 5.7 | 6.84 | 0.98 | 59.17 ± 0.6 | 91.27 ± 0.4 |
| 9 | 0 | 250 | −1 | 40 | −1 | 15 | 6.2 | 9.81 | 1.19 | 78.83 ± 1.3 | 91.39 ± 0.6 |
| 10 | 0 | 250 | 0 | 50 | 0 | 30 | 6.9 | 9.68 | 1.19 | 52.35 ± 0.1 | 91.25 ± 0.4 |
| 11 | 0 | 250 | −1 | 40 | 1 | 45 | 6.9 | 6.91 | 1.08 | 63.89 ± 0.5 | 90.97 ± 1.2 |
| 12 | −1 | 200 | 0 | 50 | 1 | 45 | 4.8 | 5.9 | 1.08 | 60.65 ± 0.3 | 91.36 ± 0.4 |
| 13 | 1 | 300 | 1 | 60 | 0 | 30 | 9.0 | 9.95 | 1.23 | 65.86 ± 0.7 | 91.18 ± 0.8 |
| 14 | 0 | 250 | 1 | 60 | 1 | 45 | 9.2 | 10.17 | 1.16 | 61.08 ± 0.4 | 91.36 ± 0.3 |
| 15 | 1 | 300 | −1 | 40 | 0 | 30 | 7.4 | 5.82 | 1.30 | 57.00 ± 0.5 | 91.35 ± 0.4 |
| Source | Sum of Squares | Degree of Freedom | Mean of Squares | F-Value | p-Value * |
|---|---|---|---|---|---|
| Model | 26.83 | 9 | 2.98 | 59.21 | 0.0002 |
| X1 (pressure) | 2.83 | 1 | 2.83 | 56.26 | 0.0007 |
| X2 (temperature) | 2.39 | 1 | 2.39 | 47.42 | 0.0010 |
| X3 (time) | 6.00 | 1 | 6.00 | 119.26 | 0.0001 |
| X1 × X2 | 0.59 | 1 | 0.59 | 11.78 | 0.0186 |
| X1 × X3 | 7.29 | 1 | 7.29 | 144.82 | <0.0001 |
| X2 × X3 | 1.01 | 1 | 1.01 | 20.06 | 0.0065 |
| X1 × X1 | 0.44 | 1 | 0.44 | 8.75 | 0.0316 |
| X2 × X2 | 3.21 | 1 | 3.21 | 63.72 | 0.0005 |
| X3 × X3 | 2.56 | 1 | 2.56 | 50.89 | 0.0008 |
| Residual | 0.25 | 5 | 0.050 | - | - |
| Lack-of-fit | 0.16 | 3 | 0.053 | 1.14 | 0.4987 |
| Pure error | 0.093 | 2 | 0.046 | - | - |
| Source | Sum of Squares | Degree of Freedom | Mean of Squares | F-Value | p-Value * |
|---|---|---|---|---|---|
| Model | 41.96 | 7 | 5.99 | 20.40 | 0.0004 |
| X1 (pressure) | 6.43 | 1 | 6.43 | 21.86 | 0.0023 |
| X2 (temperature) | 0.24 | 1 | 0.24 | 0.83 | 0.3916 |
| X1 × X2 | 18.32 | 1 | 18.32 | 62.33 | <0.0001 |
| X1 × X3 | 2.06 | 1 | 2.06 | 7.01 | 0.0331 |
| X2 × X3 | 5.81 | 1 | 5.81 | 19.76 | 0.0030 |
| X1 × X1 | 9.02 | 1 | 9.02 | 30.69 | 0.0009 |
| X2 × X2 | 0.25 | 1 | 0.25 | 8.6 | 0.0384 |
| Residual | 2.06 | 7 | 0.29 | - | - |
| Lack-of-fit | 1.38 | 5 | 0.28 | 0.81 | 0.6329 |
| Pure error | 0.68 | 2 | 0.34 | - | - |
| Extract | COM (US$/kg Extract) |
|---|---|
| Clove (Dianthus) | 9.15 |
| Cloves | 4.70 |
| Lavender Retail value of lavender oil | 66.50 2400 $/dm3 |
| Ginger | 99.80 |
| Buriti palm | 22.81 |
| Pupunha palm | 17.15 |
| Pomegranate leaves | 114.36 |
| Habanero pepper | 540.19 |
| Factor | Carbon Dioxide Extraction | Hexane Extraction |
|---|---|---|
| Solvent | 0.07 $/lb | 0.07 $/lb |
| Max solubility | 38 mg/g | 80 mg/g |
| CO2 flow | 87 million lb/yr | 38 million lb/yr |
| Energy input | 1.8 GWh/y | 4.6 GWh/yr |
| COM | 6.2 million $/yr | 14 million $/yr |
| Fraction Size (mm) | Fraction Mass (g) | Fraction Percentage (%) |
|---|---|---|
| 2.50 | 0.01 | 0.01 |
| 2.00 | 0.08 | 0.10 |
| 1.60 | 0.11 | 0.14 |
| 1.00 | 6.22 | 7.93 |
| 0.80 | 7.32 | 9.33 |
| 0.60 | 17.26 | 21.99 |
| 0.40 | 16.68 | 21.25 |
| 0.30 | 11.05 | 14.08 |
| 0.10 | 17.82 | 22.71 |
| <0.1 | 1.93 | 2.46 |
| SUM | 78.48 | 100 |
| Variables | Unit | −1 | 0 | 1 |
|---|---|---|---|---|
| Temperature | °C | 40 | 50 | 60 |
| Pressure | bar | 200 | 250 | 300 |
| Time | min | 15 | 30 | 45 |
© 2019 by the authors. Licensee MDPI, Basel, Switzerland. This article is an open access article distributed under the terms and conditions of the Creative Commons Attribution (CC BY) license (http://creativecommons.org/licenses/by/4.0/).
Share and Cite
Tyśkiewicz, K.; Konkol, M.; Rój, E. Supercritical Carbon Dioxide (scCO2) Extraction of Phenolic Compounds from Lavender (Lavandula angustifolia) Flowers: A Box-Behnken Experimental Optimization. Molecules 2019, 24, 3354. https://doi.org/10.3390/molecules24183354
Tyśkiewicz K, Konkol M, Rój E. Supercritical Carbon Dioxide (scCO2) Extraction of Phenolic Compounds from Lavender (Lavandula angustifolia) Flowers: A Box-Behnken Experimental Optimization. Molecules. 2019; 24(18):3354. https://doi.org/10.3390/molecules24183354
Chicago/Turabian StyleTyśkiewicz, Katarzyna, Marcin Konkol, and Edward Rój. 2019. "Supercritical Carbon Dioxide (scCO2) Extraction of Phenolic Compounds from Lavender (Lavandula angustifolia) Flowers: A Box-Behnken Experimental Optimization" Molecules 24, no. 18: 3354. https://doi.org/10.3390/molecules24183354