
Constituents and Anti-Hyperuricemia Mechanism of Traditional Chinese Herbal Formulae Erding Granule

Abstract
:
1. Introduction
2. Results
2.1. Effects of EDG Extracts on Serum Uric Acid, Creatinine, and Blood Urea Nitrogen in the Hyperuricemia Mouse Model
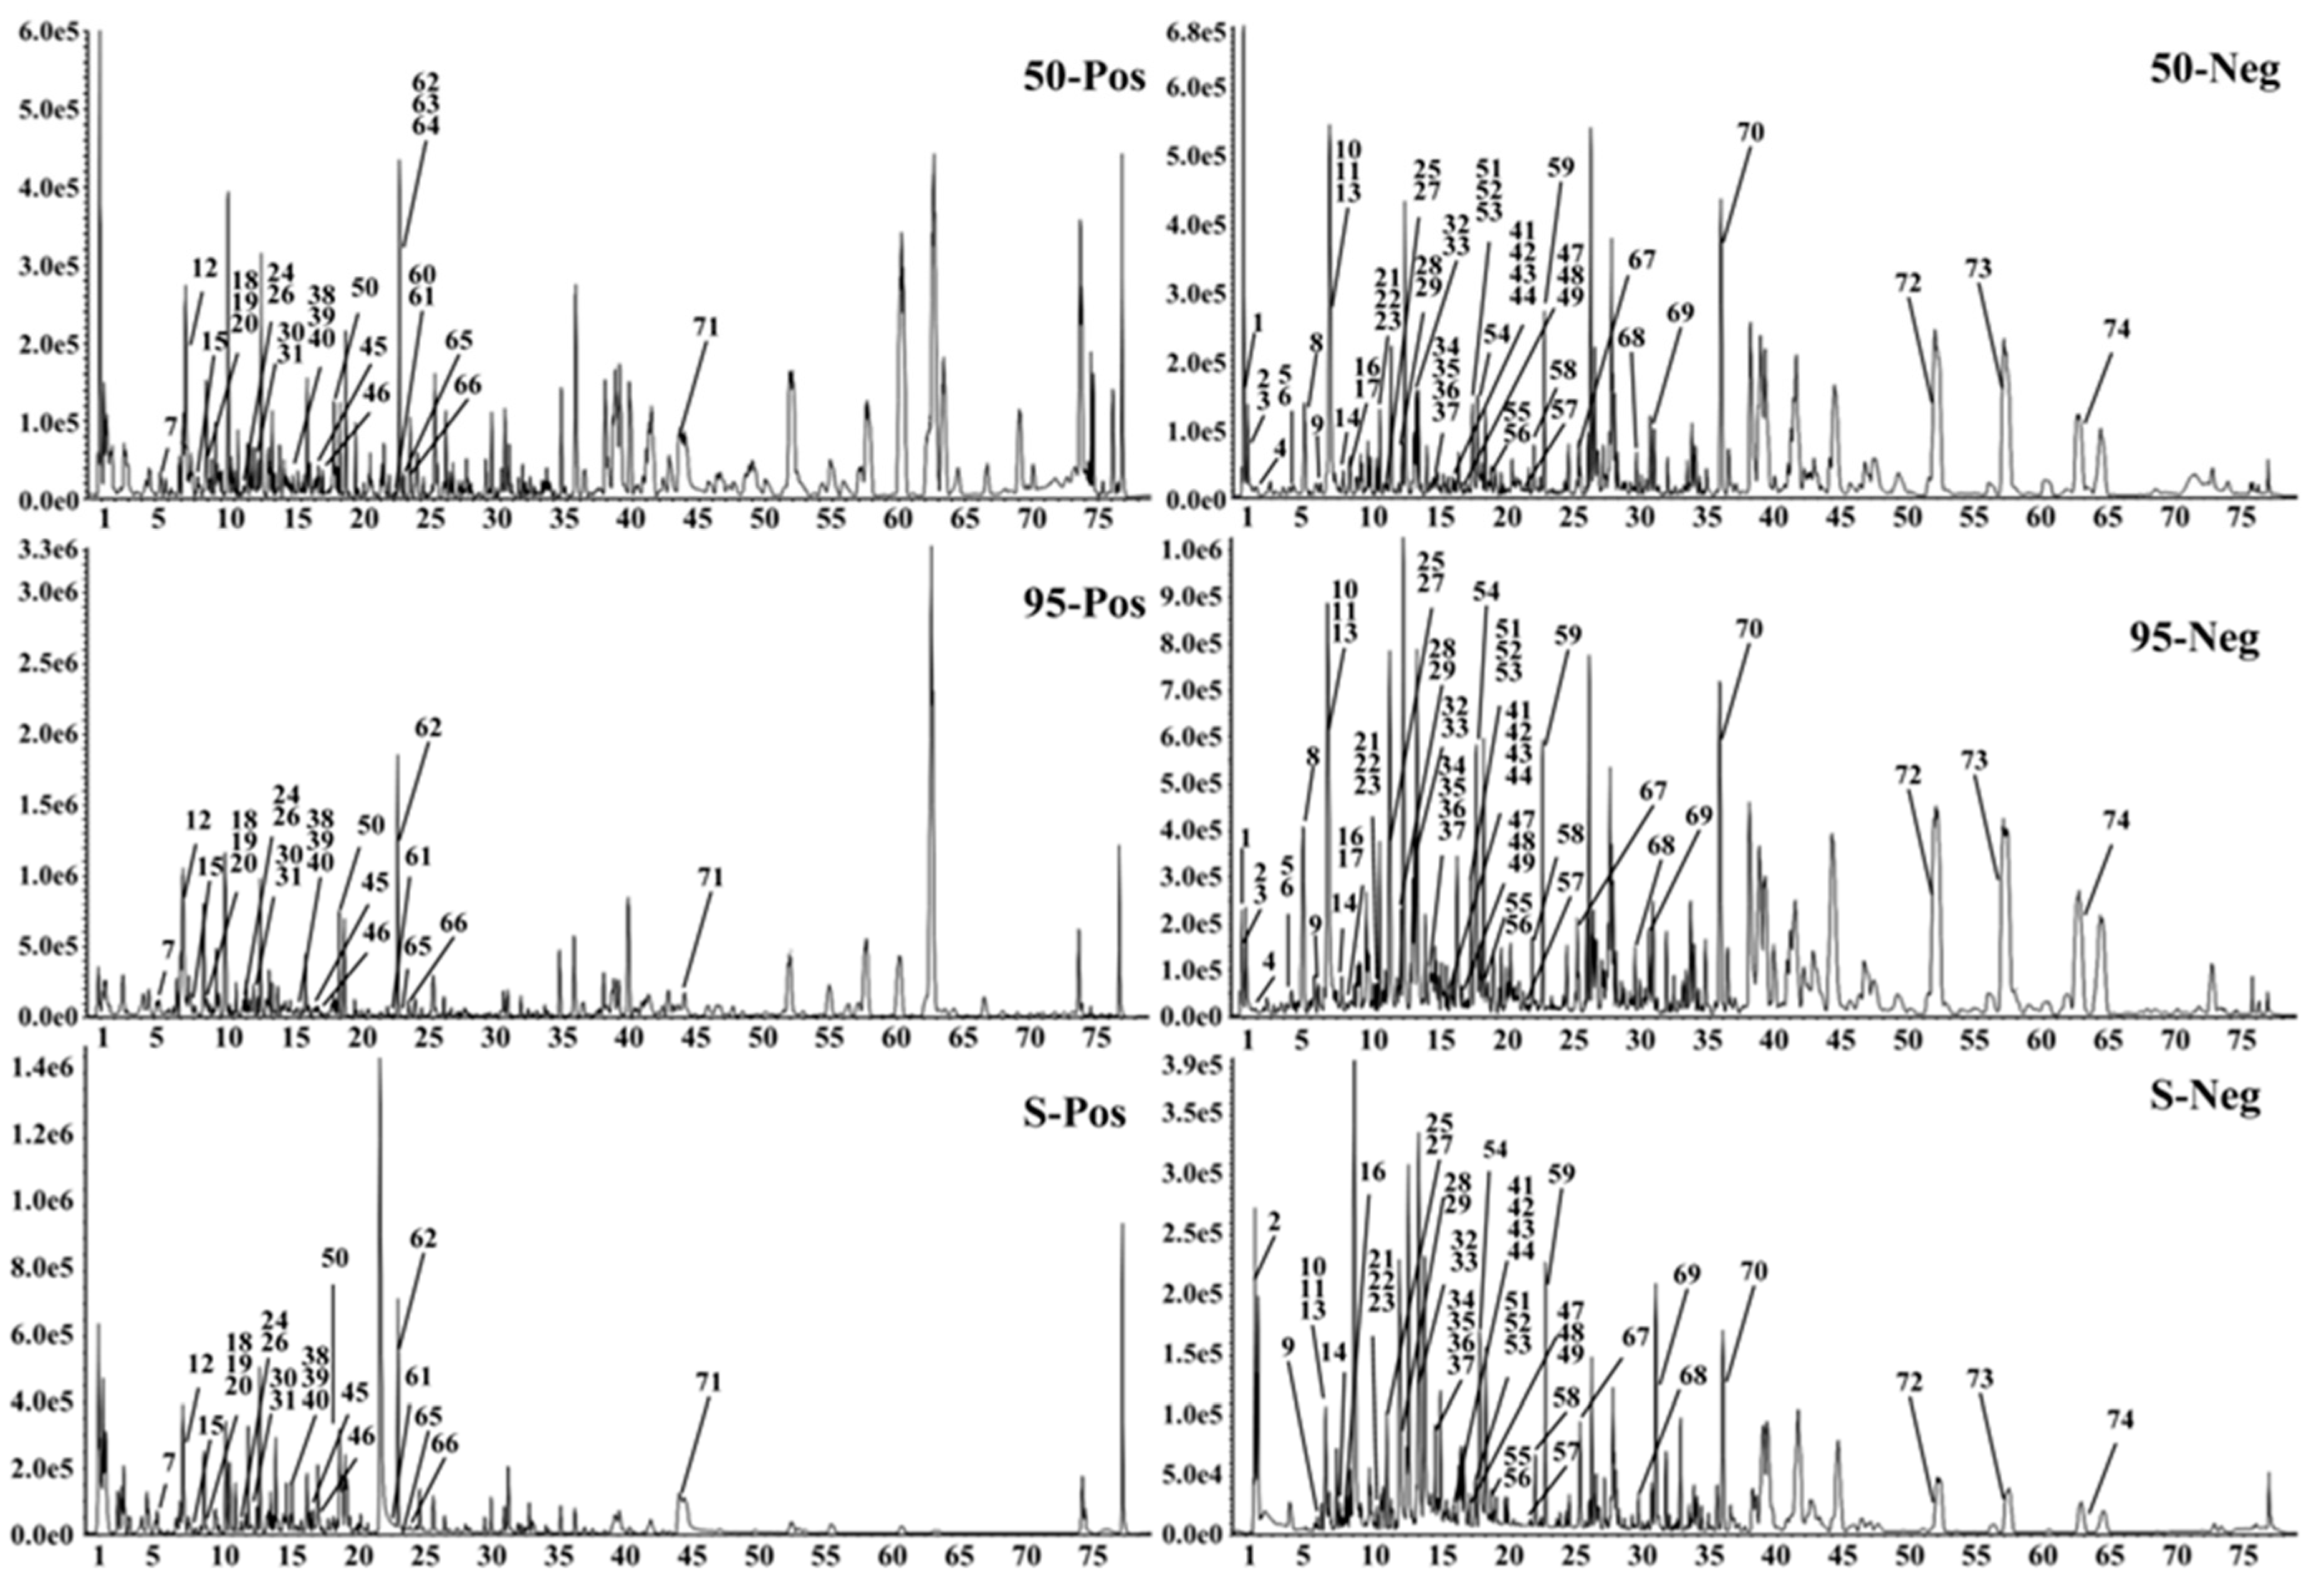
2.2. UHPLC-Q-TOF-MS/MS Analysis of EDG Extracts
2.3. Effects of EDG-50 on Serum Uric Acid, Creatinine, and Blood Urea Nitrogen in the Hyperuricemia Rat Model
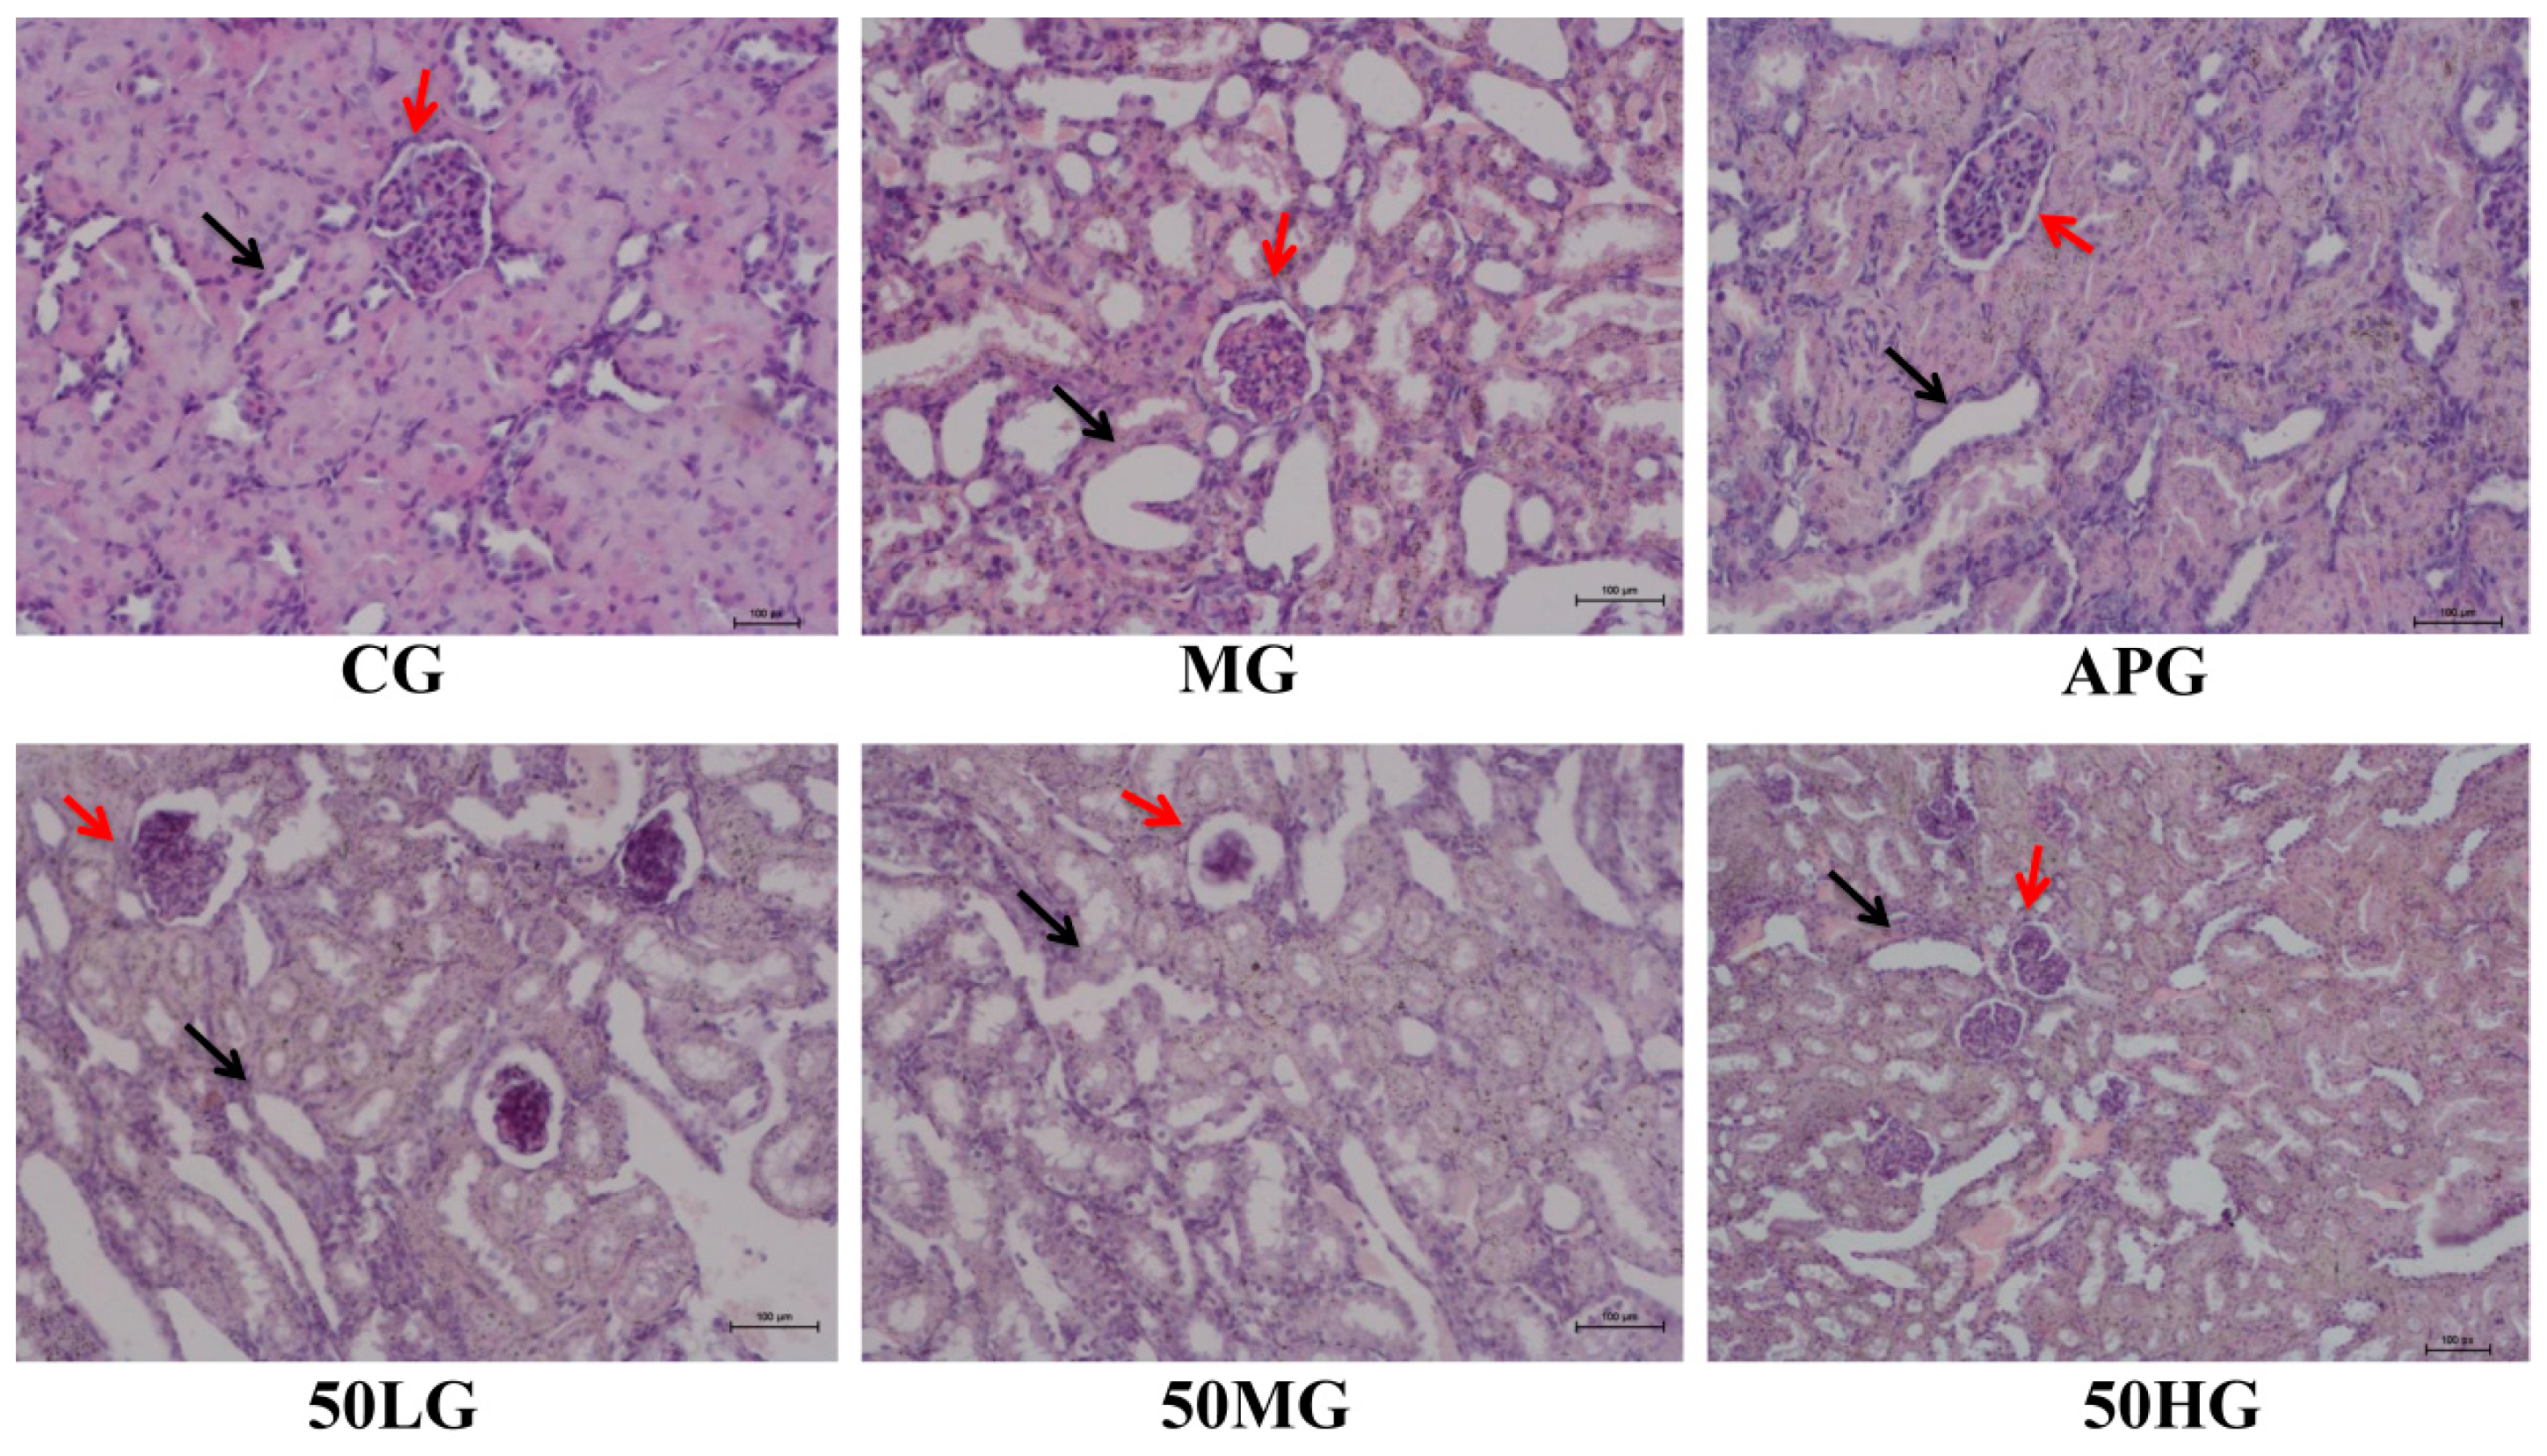
2.4. Pathological Slices of EDG-50 on the Kidney of Hyperuricemic Rats
2.5. Effect of EDG-50 on TNF-a, IL-1β and IL-6 in Kidney Tissue from Hyperuricemic Rats
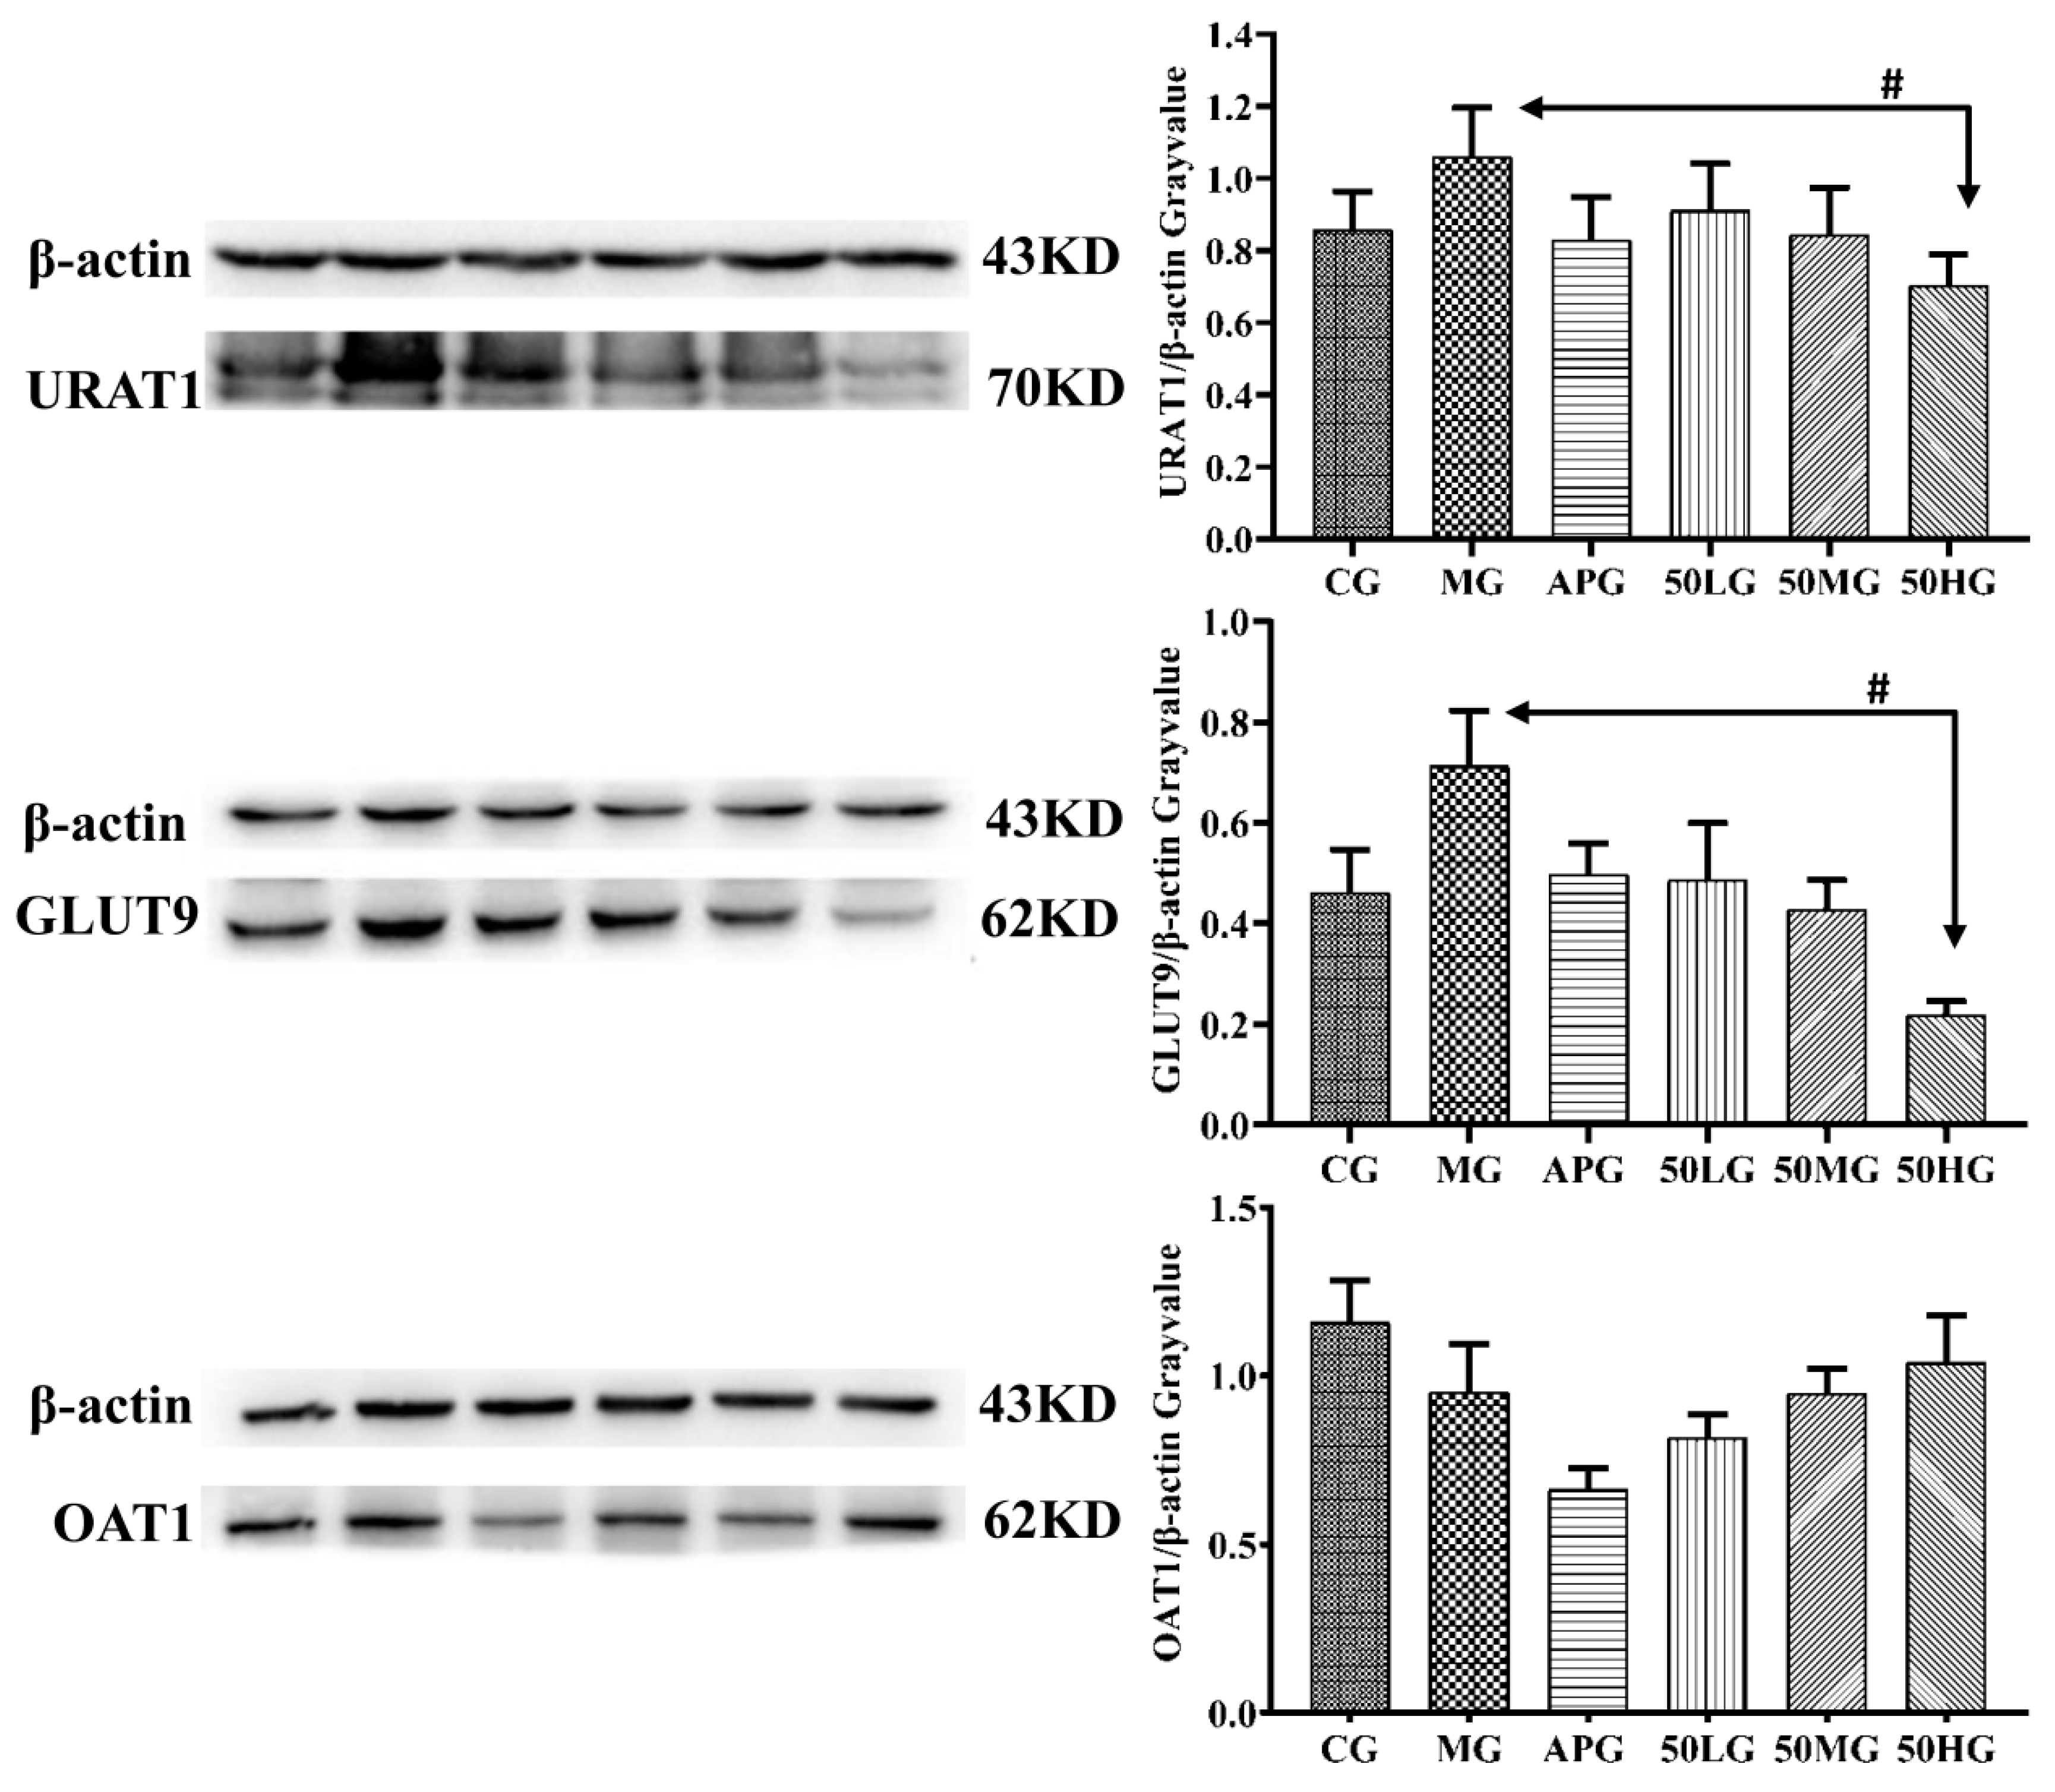
2.6. Effect of EDG-50 on the Expression of OAT1, GLUT9, and URAT1 in Kidney Tissue from Hyperuricemic Rats
3. Discussion
4. Materials and Methods
4.1. Reagents
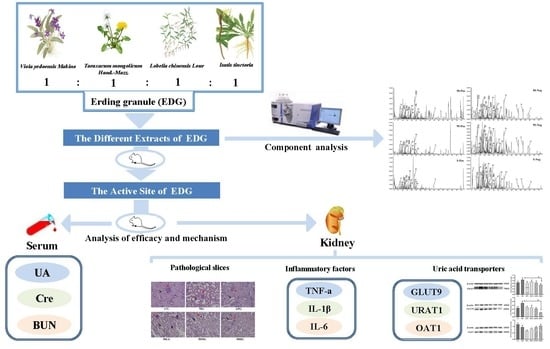
4.2. Plant Material and Preparation of the EDG Extracts
4.3. Experimental Animals
4.4. Establishment of the Hyperuricemic Mouse Model and Experimental Protocol
4.5. Establishment of the Hyperuricemic Rat Model and Experimental Protocol
4.6. UHPLC-Q-TOF-MS/MS Analysis
4.7. Pathological Section Analysis
4.8. Kidney Cytokine Analysis
4.9. Western Blot Analysis of Kidney Tissues
4.10. Statistical Analysis
5. Conclusions
Author Contributions
Funding
Conflicts of Interest
References
- Sarah, S.; Hannah, M.; Nicola, D. Prevalence and discrimination of OMERACT-defined elementary ultrasound lesions of gout in people with asymptomatic hyperuricaemia: A systematic review and meta-analysis. Semin. Arthritis. Rheu. 2019, 49, 62–73. [Google Scholar]
- Chen, H.F.; Zhang, C.; Yao, Y.; Li, J.M.; Du, W.D.; Li, M.L.; Wu, B.; Yang, S.L.; Feng, Y.L.; Zhang, W.G. Study on anti-hyperuricemia effects and active ingredients of traditional Tibetan medicine Tong Feng Tang San (TFTS) by ultra-high-performance liquid chromatography coupled with quadrupole time-of-flight mass spectrometry. J. Pharmaceut. Biomed. 2019, 165, 213–223. [Google Scholar] [CrossRef]
- Adriana, L.P.; Alberto, C.; Concepción, C.M.; Domingo, O.B.; Jose, A.Q.; Vicente, B.G.; Vicente, F.G.G.; Vicente, B.M. Hyperuricemia as a prognostic factor after acute coronary syndrome. Atherosclerosis 2018, 268, 229–235. [Google Scholar]
- Masanari, K.; Koichiro, N.; Shuzo, N.; Yutaro, N.; Osamu, T.; Kazuomi, K.; Kazuhiro, Y.; Takeshi, Y.; Ichiro, H. Hyperuricemia is an independent competing risk factor for atrial fibrillation. Int. J. Cardiol. 2017, 231, 137–142. [Google Scholar]
- Helen, I.K.; Wendy, A.D.; Erin, L.; Jocelyn, J.D.; Johannes, N.; Timothy, M.E.D. Ultrasonographic assessment of joint pathology in type 2 diabetes and hyperuricemia: The Fremantle Diabetes Study Phase II. J. Diabetes Complicat. 2018, 32, 400–405. [Google Scholar]
- Xu, K.Y.; Zhao, X.; Fu, X.Q.; Xu, K.C.; Li, Z.Y.; Miao, L.B.; Li, Y.; Cai, Z.B.; Qiao, L.; Bao, J.F. Gender effect of hyperuricemia on the development of nonalcoholic fatty liver disease (NAFLD): A clinical analysis and mechanistic study. Biomed. Pharmacother. 2019, 117, 109158. [Google Scholar] [CrossRef]
- Jeon, H.J.; Oh, J.; Shin, D.H. Urate-lowering agents for asymptomatic hyperuricemia in stage 3-4 chronic kidney disease: Controversial role of kidney function. PLoS ONE 2019, 14, e0218510. [Google Scholar] [CrossRef]
- Chen, Y.; Li, C.; Duan, S.; Yuan, X.; Liang, J.; Hou, S. Curcumin attenuates potassium oxonate-induced hyperuricemia and kidney inflammation in mice. Biomed. Pharmacother. 2019, 118, 109195. [Google Scholar] [CrossRef]
- Khanna, P.P.; FitzGerald, J. Evolution of management of gout: A comparison of recent guidelines. Curr. Opin. Rheumatol. 2015, 27, 139–146. [Google Scholar] [CrossRef]
- Diaz, T.C.; Perez, H.N.; Perez, R.F. New medications in development for the treatment of hyperuricemia of gout. Curr. Opin. Rheumatol. 2015, 27, 164–169. [Google Scholar] [CrossRef]
- Bardin, T.; Richette, P. The role of febuxostat in gout. Curr. Opin. Rheumatol. 2019, 31, 152–158. [Google Scholar] [CrossRef]
- Michael, A.B.; Ralph, S.J.; Robert, L.W.; Patricia, A.M.; Denise, E.; William, A.P.; Janet, S.; Nancy, J.R. Febuxostat Compared with Allopurinol in Patients with Hyperuricemia and Gout. N. Engl. J. Med. 2005, 353, 2450–2461. [Google Scholar]
- Chinese Pharmacopoeia Commission. Pharmacopoeia of the People’s Republic of China, 2015th ed.; China Chemical Industry Press: Beijing, China, 2015; Part 1; p. 435. [Google Scholar]
- Chen, H.F.; Yao, Y.; Zhan, Y.; Jian, H.; Li, Y.; Yang, S.L.; Feng, Y.L.; Zhang, W.G. Application of UHPLC/ESI-Q-TOF-MS/MS to Identify Constituents of Erding Granule and Anti-hyperuricemia Effect. Curr. Pharm. Anal. 2019, 15, 465–486. [Google Scholar] [CrossRef]
- Wang, M.L.; Xu, X.; Wu, C.; Gong, Q.; Zhang, W.G.; Jian, H.; Li, J. Pharmacodynamics Study of Erding Granule for Gout. Pharmcol. Clin. Chin. Mater. Med. 2016, 32, 125–128. [Google Scholar]
- Choi, H.K.; Zhu, Y.Y.; Mount, D.B. Genetics of gout. Curr. Opin. Rheumatol. 2010, 22, 144–151. [Google Scholar] [CrossRef]
- Bach, M.H.; Simkin, P.A. Uricosuric drugs: The once and future therapy for hyperuricemia? Curr. Opin. Rheumatol. 2014, 26, 169–175. [Google Scholar] [CrossRef]
- Micaela, G.; Natalia, M.; Saverio, M.; Vincenzo, M. The treatment of hyperuricemia. Int. J. Cardiol. 2016, 213, 23–27. [Google Scholar]
- Zhou, Y.L.; Zhang, X.G.; Li, C.; Yuan, X.; Han, L.H.; Li, Z.; Tan, X.B.; Song, J.; Wang, G.; Jia, X.B.; et al. Research on the pharmacodynamics and mechanism of Fraxini Cortex on hyperuricemia based on the regulation of URAT1 and GLUT9. Biomed. Pharmacother. 2018, 106, 434–442. [Google Scholar] [CrossRef]
- Yang, Y.; Zhang, D.M.; Liu, J.H.; Hu, L.S.; Xue, Q.C.; Ding, X.Q.; Kong, L.D. Wuling San protects kidney dysfunction by inhibiting renal TLR4/MyD88 signaling and NLRP3 inflammasome activation in high fructose-induced hyperuricemic mice. J. Ethnopharmacol. 2015, 169, 49–59. [Google Scholar] [CrossRef]
- Yan, H.F.; Dai, X.D.; Fan, K.T.; Wang, Y. Research on Medication Regularity of Traditional Chinese Medicine Based on Hyperuricemia Patents. Chin. Herb. Med. 2016, 8, 376–381. [Google Scholar] [CrossRef]
- Zhao, F.L.; Li, G.C.; Yang, Y.H.; Shi, L.; Xu, L.; Yin, L. A network pharmacology approach to determine active ingredients and rationality of herb combinations of Modified-Simiaowan for treatment of gout. J. Ethnopharmacol. 2015, 168, 1–16. [Google Scholar] [CrossRef]
- Li, H.W.; Zhang, Y.Z.; Liu, Z.H.; Jia, S.K. TCM Dietotherapy for Gout. J. Tradit. Chin. Med. 2010, 30, 64–65. [Google Scholar] [CrossRef] [Green Version]
- Nandani, D.K.; Pan, M.; Zhu, Y.L.; Zhang, Y.Y.; Feng, Y.D.; Fang, W.R.; Li, Y.M. Anti-inflammatory and antinociceptive effects of Chinese medicine SQ gout capsules and its modulation of pro-inflammatory cytokines focusing on gout arthritis. J. Ethnopharmacol. 2013, 150, 1071–1079. [Google Scholar]
- Wan, Y.; Wang, F.; Zou, B.; Shen, Y.F.; Li, Y.Z.; Zhang, A.X.; Fu, G.M. Molecular mechanism underlying the ability of caffeic acid to decrease uric acid levels in hyperuricemia rats. J. Funct. Foods 2019, 57, 150–156. [Google Scholar] [CrossRef]
- Camila, M.D.S.M.; Grazielle, B.C.; Marcela, C.D.P.M.A.; Dênia, A.S.G. Lychnophora pinaster ethanolic extract and its chemical constituents ameliorate hyperuricemia and related inflammation. J. Ethnopharmacol. 2019, 242, 112040. [Google Scholar]
- Huang, L.P.; Deng, J.; Yuan, C.J.; Zhou, M.; Liang, J.; Yan, B.; Shu, J.C.; Liang, Y.H.; Huang, H.L. The anti-hyperuricemic effect of four astilbin stereoisomers in Smilax glabra on hyperuricemic mice. J. Ethnopharmacol. 2019, 238, 111777. [Google Scholar] [CrossRef]
- Sang, M.M.; Du, G.Y.; Hao, J.; Wang, L.L.; Liu, E.W.; Zhang, Y.; Wang, T.; Gao, X.M.; Han, L.F. Modeling and optimizing inhibitory activities of Nelumbinis folium extract on xanthine oxidase using response surface methodology. J. Pharmaceut. Biomed. 2017, 139, 37–43. [Google Scholar] [CrossRef]
- Huang, B.X.; Hu, X.W.; Wang, J.C.; Li, P.; Chen, J. Study on chemical constituents of herbal formula Er Miao Wan and GC–MS based metabolomics approach to evaluate its therapeutic effects on hyperuricemic rats. J. Chromatogr. B 2019, 1118, 101–108. [Google Scholar] [CrossRef]
Sample Availability: Samples of the compounds are not available from the authors. |


| Group | Dose (g/kg) | Weight | SUA (µmol/L) | Cre (µmol/L) | BUN (mg/dL) |
|---|---|---|---|---|---|
| CG | − | 31.75 ± 1.24 | 104.72 ± 32.61 | 5.98 ± 1.41 | 15.96 ± 1.74 |
| MG | 0.45 | 30.32 ± 1.64 | 176.34 ± 53.63 ** | 6.89 ± 0.65 * | 17.30 ± 3.37 * |
| APG | 0.015 | 27.31 ± 4.56 | 47.60 ± 24.07 ## | 10.79 ± 4.51 ## | 25.15 ± 7.66 ## |
| SG | 7.73 | 30.09 ± 2.50 | 142.30 ± 48.90 | 6.53 ± 1.09 | 16.74 ± 2.23 |
| 50G | 5.81 | 31.09 ± 2.16 | 121.98 ± 40.87 # | 5.42 ± 1.25 # | 15.12 ± 4.38 |
| 95G | 2.40 | 31.09 ± 1.89 | 138.04 ± 18.98 | 6.62 ± 3.47 | 15.03 ± 3.93 |
| No. | Formula | Mass /Da | Adduct | Found At Mass/Da | Main MS/MS Productions | EDG-50 | EDG-95 | EDG-S | Proposed Compound | |||||||
|---|---|---|---|---|---|---|---|---|---|---|---|---|---|---|---|---|
| Error /ppm | RT /min | Intensity | Error /ppm | RT /min | Intensity | Error /ppm | RT /min | Intensity | ||||||||
| 1 | C43H32N2O9 | 720.2108 | −H | 719.2035 | 719.2004, 377.0833, 341.1069, 215.0317, 179.0558, 161.0465 | −4.5 | 0.9 | 224,431 | −0.8 | 0.9 | 11,042 | / | / | / | Chelidimerine | Y |
| 2 | C6H8O7 | 192.0270 | −H | 191.0197 | 129.0213, 111.0108, 87.0127 | 4 | 1.2 | 250,963 | 2.9 | 1.2 | 87,211 | −9.2 | 1.22 | 822,532 | Citric acid | |
| 3 | C10H13N5O5 | 283.0917 | −H | 282.0844 | 150.0426, 133.0172, 108.0221 | 0 | 1.3 | 39,988 | 1.5 | 1.31 | 10,689 | / | / | / | Isoguanosine | Y |
| 4 | C7H6O5 | 170.0215 | −H | 169.0143 | 125.0278, 79.0227 | 6.5 | 1.61 | 12,942 | 2.3 | 1.63 | 18,513 | / | / | / | Gallic* | |
| 5 | C13H12O9 | 312.0481 | −H | 311.0409 | 179.0352, 161.0228, 149.0098, 135.0465, 117.0372, 107.0526 | 0 | 4.35 | 63,159 | −1 | 4.35 | 63,500 | / | / | / | Caftaric acid | |
| 6 | C16H18O9 | 354.0951 | −H | 353.0878 | 191.0561, 179.0359, 135.0466 | −0.9 | 4.37 | 18,618 | −2.1 | 4.38 | 24,046 | / | / | / | Neochlorogenic acid | |
| 7 | C9H6O4 | 178.0266 | +H | 179.0339 | 179.0341, 133.0285, 123.0449, 105.0350 | −0.9 | 5.41 | 109,346 | −0.6 | 5.46 | 322,194 | −2.4 | 5.25 | 99,156 | Esculetin* | |
| 8 | C15H16O9 | 340.0794 | −H | 339.0722 | 177.0201, 149.0249, 133.0309 | −1 | 5.48 | 563,845 | −0.4 | 5.49 | 1,624,129 | / | / | / | Escosyl | |
| 9 | C13H12O8 | 296.0532 | −H | 295.0459 | 179.0318, 133.0157, 115.0064 | 0.8 | 6.53 | 6076 | 4 | 6.52 | 5721 | 6.4 | 6.61 | 410 | Caffeoylmalic acid | Y |
| 10 | C7H12O6 | 192.0634 | −H | 193.0707 | 191.0779, 173.0513, 127.0392, 109.0298 | 4.4 | 7.11 | 52,340 | 4.4 | 7.09 | 99,317 | 2.3 | 7.12 | 39,686 | Quinic acid* | |
| 11 | C16H18O9 | 354.0951 | −H | 353.0878 | 191.0574, 173.0471, 161.0256, 135.0466 | −0.3 | 7.12 | 145,276 | −0.7 | 7.09 | 269,510 | −2.6 | 7.12 | 97,406 | Chlorogenic Acid | |
| 12 | C9H6O4 | 178.0266 | +H | 179.0339 | 179.0336,133.0285,123.0444, 105.0341 | −0.1 | 7.34 | 1,045,590 | −0.1 | 7.33 | 2047,773 | 0 | 7.3 | 1,021,466 | Isoesculetin | |
| 13 | C9H8O4 | 180.0423 | −H | 179.0350 | 179.0366, 163.0400, 135.0469, 117.0357, 107.0528 | 4.2 | 7.76 | 145,065 | 5.6 | 7.75 | 128,114 | 0.4 | 7.77 | 1852 | Caffeicacid* | Y |
| 14 | C16H18O9 | 354.0951 | −H | 353.0878 | 191.0566, 179.0366,173.0461, 135.0466 | −1 | 8.08 | 46,077 | −0.8 | 8.1 | 62,346 | −0.6 | 8.06 | 492 | Cryptochlorogenic acid | |
| 15 | C24H39NO8 | 469.2676 | +H | 470.2748 | 470.2723, 308.2226, 220.1328, 174.1291 | −0.9 | 8.16 | 4880 | −11.1 | 8.08 | 1256 | −3.1 | 8.09 | 1824 | N-lauryl glucoside | Y |
| 16 | C10H12O5 | 212.0685 | −H | 211.0612 | 196.0376, 177.0206, 152.0490, 137.0258, 109.0310 | 2.1 | 8.28 | 53,287 | 3.3 | 8.29 | 97,264 | −8.6 | 8.22 | 288 | Gallic acid propyl ester | |
| 17 | C10H8O4 | 192.0423 | −H | 191.0350 | 191.0377, 176.0120, 161.0247, 148.0172, 135.0465 | 4.3 | 8.82 | 21,352 | 4.5 | 8.84 | 49,495 | / | / | / | Methylesculetin | |
| 18 | C24H39NO8 | 469.2676 | +H | 470.2748 | 470.2761, 308.2204, 290.2122, 220.1346, 174.1286 | −4.1 | 8.88 | 5605 | −0.7 | 8.9 | 5048 | 0.5 | 8.81 | 1833 | N-lauryl glucoside | Y |
| 19 | C24H39NO8 | 469.2676 | +H | 470.2748 | 470.2709, 308.2218, 220.1361, 174.1282 | −4.1 | 9.02 | 4992 | −2.5 | 9.02 | 3306 | 0.2 | 8.96 | 2417 | N-lauryl glucoside | Y |
| 20 | C11H12N2O3 | 220.0848 | +H | 221.0921 | 176.0708, 158.0601, 147.0330, 133.0521, 104.0522 | −2.9 | 9.42 | 8886 | −0.9 | 9.41 | 5539 | −0.8 | 9.37 | 12,999 | 5-Hydroxytryptophan* | |
| 21 | C32H44O16 | 684.2629 | −H | 683.2557 | 683.2691, 521.2005, 359.1449, 329.1396, 192.0793 | −0.8 | 10.87 | 45,283 | −0.1 | 10.97 | 69,562 | −4.5 | 11.29 | 15,162 | Clemastanin B | |
| 22 | C33H40O20 | 756.2113 | −H | 755.2040 | 755.2034, 609.1450, 430.0890, 284.0320 | 0 | 10.91 | 35,697 | 0.5 | 11.03 | 97,735 | −2.7 | 11.3 | 20,076 | Manghaslin | |
| 23 | C27H30O15 | 594.1585 | −H | 593.1512 | 593.1487, 503.1170, 473.1066, 383.0757, 353.0656, 325.0712, 297.0765 | −0.9 | 11.13 | 591,640 | −0.8 | 11.22 | 1,735,954 | −3.9 | 11.05 | 5282 | Vicenin-2 | |
| 24 | C24H39NO8 | 469.2676 | +H | 470.2748 | 470.2721, 308.2228, 290.2101, 220.1354, 174.1265 | −3.6 | 11.15 | 8351 | −3.8 | 11.15 | 5398 | −3.3 | 11.1 | 2297 | N-lauryl glucoside | Y |
| 25 | C9H10O5 | 198.0528 | −H | 197.0456 | 197.0447, 169.0157, 124.0182 | 1.9 | 11.46 | 12,433 | 4.4 | 11.49 | 12,136 | 0 | 11.49 | 31 | Gallic acid ethyl | Y |
| 26 | C24H39NO8 | 469.2676 | +H | 470.2748 | 470.2734, 308.2224, 220.1331, 174.1299 | −4.2 | 11.58 | 8704 | −3 | 11.59 | 5541 | −1.8 | 11.54 | 2927 | N-lauryl glucoside | Y |
| 27 | C9H6O3 | 162.0317 | −H | 161.0244 | 161.0257, 133.0311, 117.0385, 105.0366 | 5.7 | 11.68 | 9975 | 6.8 | 11.7 | 27,807 | 20.5 | 11.58 | 5314 | Hydroxycoumarin | |
| 28 | C27H26O18 | 638.1119 | −H | 637.1046 | 637.1003, 351.0553, 285.0397, 193.0350 | −2.2 | 12.18 | 45,258 | −0.1 | 12.19 | 30,835 | −6.7 | 12.18 | 815 | Luteolin-O-glucuronosyl-glucuronide | Y |
| 29 | C10H8O4 | 192.0423 | −H | 191.0350 | 176.0124, 148.0183, 120.0248, 104.0305 | 4.9 | 12.53 | 81,183 | 5.1 | 12.53 | 327,187 | 0.2 | 12.42 | 1873 | Methylesculetin | |
| 30 | C21H20O11 | 448.1006 | +H | 449.1078 | 431.0973, 413.0860, 395.0753, 329.0654, 299.0551, 165.0181, 137.0237 | −1.6 | 12.84 | 231,975 | −2.7 | 12.9 | 682,055 | −0.9 | 12.85 | 389,268 | Orientine | |
| 31 | C21H20O11 | 448.1006 | +H | 449.1078 | 449.1103, 431.0971, 413.0853, 329.0664, 299.0552, 137.0242 | −0.9 | 13.23 | 41,259 | −4.4 | 13.28 | 171,088 | −1.1 | 13.25 | 72,452 | Isoorientin | |
| 32 | C13H12O9 | 312.0481 | −H | 311.0409 | 193.0464, 179.0363, 149.0113, 135.0469, 117.0364, 107.0364 | −0.7 | 13.68 | 59,343 | 0.2 | 13.75 | 409 | −1.5 | 13.92 | 518 | Caftaric acid | Y |
| 33 | C22H18O12 | 474.0798 | −H | 473.0726 | 311.0396, 293.0281, 219.0292, 191.0343, 179.0354, 161.0252, 149.0101 | −2.5 | 13.69 | 408,502 | −1.7 | 13.75 | 105,979 | −3.6 | 13.93 | 1,385,318 | Chicoric acid | |
| 34 | C20H18O11 | 434.0849 | −H | 433.0776 | 433.0750, 301.0352, 300.0276, 151.0043 | −1 | 14.93 | 76,758 | −1.4 | 14.93 | 198,601 | −3 | 15.08 | 92,618 | Quercetin-O-pentose | |
| 35 | C21H20O10 | 432.1057 | −H | 431.0984 | 431.0960, 353.0656, 323.0548, 311.0550, 293.0460, 283.0607, 269.0455 | −1.6 | 15.02 | 68,567 | −1.7 | 15.02 | 144,516 | −3.8 | 15.13 | 15,145 | Vitexin | |
| 36 | C27H30O14 | 578.1636 | −H | 577.1563 | 577.1537, 457.1095, 413.0858, 355.0767, 341.0666, 323.0555, 311.0522, 293.0451, 281.0456, 269.0450 | −0.6 | 15.12 | 8253 | −0.1 | 15.12 | 23,760 | −3.4 | 15.21 | 4334 | Vitexin-O-rhamnoside | |
| 37 | C27H30O14 | 578.1636 | −H | 577.1563 | 577.1533, 487.1188, 473.1075, 457.1112, 413.0866, 395.0777, 383.0768, 365.0655, 353.0658, 323.0545, 297.0796, 163.0373 | −1.1 | 15.38 | 10,624 | −0.7 | 15.38 | 47,674 | −3.5 | 15.44 | 5620 | Violanthin | |
| 38 | C21H20O11 | 448.1006 | +H | 449.1078 | 449.2466, 287.0562, 269.0484 | −0.6 | 15.6 | 13,347 | −0.2 | 15.56 | 19,278 | −0.1 | 15.56 | 12,257 | Kaempferol-O-glucoside | |
| 39 | C27H30O15 | 594.1585 | +H | 595.1658 | 595.2385, 449.1088, 287.0562, 153.0216 | −1.2 | 15.65 | 55,584 | −4.3 | 15.61 | 199,283 | 0.2 | 15.62 | 73,538 | Nicotiflorine | |
| 40 | C21H20O11 | 448.1006 | +H | 449.1078 | 287.0555, 153.0187 | −2 | 15.87 | 102,110 | −3.2 | 15.86 | 319,417 | −0.3 | 15.87 | 127,967 | Trifolin | |
| 41 | C22H22O11 | 462.1162 | −H | 461.1089 | 461.1077, 371.0757, 353.0665, 341.0656, 313.0707, 298.0476, 269.0462 | −1.7 | 16.04 | 72,756 | −1.4 | 16.03 | 199,519 | −5.5 | 16.11 | 48,781 | Scoparin | |
| 42 | C27H30O14 | 578.1636 | −H | 577.1563 | 577.1551, 431.0975, 285.0398, 255.0300 | −0.2 | 16.55 | 76,563 | −1.1 | 16.54 | 148,515 | −4.4 | 16.46 | 32,802 | Kaempferitrin | |
| 43 | C20H18O11 | 434.0849 | −H | 433.0776 | 433.0757, 301.0342, 300.0267, 151.0042 | −1.9 | 16.79 | 42,967 | −1.1 | 16.79 | 108,180 | −5 | 16.71 | 49,014 | Quercetin-O-pentose | |
| 44 | C10H8O4 | 192.0423 | −H | 191.0350 | 191.0444, 176.0110, 148.0173, 120.0256 | 3.9 | 16.83 | 14,520 | 2.3 | 16.84 | 19,384 | 16.8 | 16.82 | 129 | Methylesculetin | |
| 45 | C11H10O5 | 222.0528 | +H | 223.0601 | 223.0617, 207.0304, 190.0266, 162.0319, 134.0366 | −0.3 | 17.07 | 96,677 | −1.1 | 17.12 | 204,839 | 1.1 | 17.1 | 78953 | Hydroxy-dimethoxy-cumarin | |
| 46 | C21H20O11 | 448.1006 | +H | 449.1078 | 449.2300, 287.0548, | −1.4 | 17.51 | 10,684 | −3.7 | 17.61 | 34,955 | 0.3 | 17.6 | 17,749 | Astragalin | |
| 47 | C34H42O20 | 770.2269 | −H | 769.2197 | 769.2176, 299.0559, 284.0315 | 0.5 | 17.81 | 18,121 | 0.7 | 17.81 | 40,329 | −3 | 17.72 | 9244 | Kaempferide-O-Diglucoside-O-pentose | |
| 48 | C27H30O14 | 578.1636 | −H | 577.1563 | 577.1547, 269.0452 | −1.4 | 17.83 | 13,543 | 0 | 17.82 | 58,263 | −3.8 | 17.77 | 11,331 | Rhoifolin | |
| 49 | C16H10O8 | 330.0376 | −H | 329.0303 | 329.0316, 311.0205, 285.0401, 267.0291, 243.0302 | 0 | 17.86 | 30,787 | −1 | 18.04 | 51,352 | −1.7 | 17.84 | 27,116 | Dimethoxy ellagic acid | |
| 50 | C11H10O5 | 222.0528 | +H | 223.0601 | 223.0619, 208.0376, 193.0140, 165.0188, 147.0086 | −0.5 | 18.29 | 70,026 | −1.7 | 18.35 | 183,868 | 0.1 | 18.34 | 56,086 | Hydroxy−dimethoxy-cumarin | |
| 51 | C28H36O13 | 580.2156 | −H | 579.2083 | 417.1532, 402.1299, 387.1060, 181.0510, 166.0275, 151.0051, 137.0251 | −1.6 | 18.3 | 75,525 | −0.6 | 18.29 | 146,736 | −2.8 | 18.26 | 34,715 | Syringaresinol-O-glucopyranoside | |
| 52 | C21H20O10 | 432.1057 | −H | 431.0984 | 431.0972, 268.0366 | −2.6 | 18.36 | 14,511 | −1.7 | 18.36 | 36,311 | −2.5 | 18.35 | 8892 | Apigenin-7-O-glucoside | |
| 53 | C27H32O14 | 580.1792 | −H | 579.1719 | 579.1689, 459.1130, 313.0709, 271.0608, 193.0146, 177.0182, 151.0042 | −0.8 | 18.47 | 51,833 | −1.2 | 18.44 | 28,001 | −4.2 | 18.44 | 11,215 | Naringin | Y |
| 54 | C34H42O20 | 770.2269 | −H | 769.2197 | 769.2171, 623.1965, 299.0547, 284.0312 | −1 | 18.76 | 6943 | −0.5 | 18.76 | 21,178 | −1.8 | 18.7 | 5930 | Kaempferide-O-Diglucoside-O-pentose | |
| 55 | C28H32O15 | 608.1741 | −H | 607.1668 | 607.1651, 299.0557, 284.0324 | −0.3 | 19.03 | 584,894 | 0.2 | 19.02 | 2,556,400 | −3.7 | 18.98 | 692,927 | Diosmine | |
| 56 | C25H24O12 | 516.1268 | −H | 515.1195 | 515.1211, 353.0869,191.0562, 179.0355, 173.0464, 135.0461 | −0.9 | 19.48 | 217,297 | −1.7 | 19.48 | 189,989 | −3.4 | 19.43 | 168,824 | Isochlorogenicacid B | Y |
| 57 | C16H10O8 | 330.0376 | −H | 329.0303 | 285.0424, 257.0451, 242.0204 | −0.4 | 22.04 | 10,197 | −0.6 | 22.04 | 35,556 | −1.3 | 22.03 | 3323 | Dimethoxy ellagic acid | |
| 58 | C15H10O6 | 286.0477 | −H | 285.0405 | 285.0400, 217.0509, 199.0410, 151.0051, 133.0311 | 0.7 | 22.69 | 332,783 | 1.4 | 22.69 | 689,966 | 0.8 | 22.69 | 264,998 | Luteolin* | |
| 59 | C11H12O4 | 208.0736 | −H | 207.0663 | 207.0663, 179.0361, 161.0249, 133.0306 | 3.1 | 23.17 | 129,947 | 4.3 | 23.16 | 73,165 | 4.9 | 23.22 | 228 | Ethyl caffeate | Y |
| 60 | C27H43NO2 | 413.3294 | +H | 414.3367 | 414.3378, 396.3251, 271.2068, 253.1958, 197.1327, 157.1011 | −1.7 | 23.3 | 17,266 | / | / | / | / | / | / | Solasodine | Y |
| 61 | C28H32O14 | 592.1792 | +H | 593.1865 | 593.1877, 447.1279, 285.0752, 242.0561, 153.0173 | −0.6 | 23.43 | 1,878,046 | −4.8 | 23.45 | 7,898,989 | 0.1 | 23.43 | 3,084,436 | Acaciin | |
| 62 | C21H20O10 | 432.1057 | −H | 431.0984 | 431.0963, 285.0393, 284.0318, 257.0447, 151.0046 | 0 | 23.5 | 16,828 | 0 | 23.5 | 58,554 | −4.8 | 23.48 | 6075 | Kaempferol-3-Rhamnoside | |
| 63 | C27H43NO2 | 413.3294 | +H | 414.3367 | 414.3383, 396.3242, 271.2069, 253.1966, 171.1188, 157.1023 | −1 | 23.57 | 34,218 | / | / | / | / | / | / | Solasodine | Y |
| 64 | C27H43NO2 | 413.3294 | +H | 414.3367 | 414.3366, 396.3234, 271.2052, 253.1944, 197.1313, 157.1025 | −2.1 | 23.77 | 10,032 | / | / | / | / | / | / | Solasodine | Y |
| 65 | C28H34O14 | 594.1949 | +H | 595.2021 | 595.3527, 329.1011, 287.0923, 153.1084 | −2.7 | 23.83 | 42,120 | −5.1 | 23.86 | 68,113 | −1.1 | 23.84 | 40,009 | Isosakuranetin−O-rutinoside | |
| 66 | C27H45NO2 | 415.3450 | +H | 416.3523 | 416.3537, 398.3403, 273.2196, 255.2115, 161.1323 | −3 | 24.12 | 10,349 | 4.4 | 24.13 | 611 | 0.4 | 24.18 | 434 | Tomatidine | Y |
| 67 | C15H10O6 | 286.0477 | −H | 285.0405 | 285.0388, 229.0524, 211.0391, 183.0470, 143.0472 | 0.1 | 25.73 | 10,541 | 0.4 | 25.74 | 33,472 | −0.5 | 25.74 | 10,143 | Kempferol* | |
| 68 | C11H14O3 | 194.0943 | −H | 193.0870 | 193.0870, 177.0553, 163.0360 | 1.3 | 30.08 | 10,787 | 4.4 | 30.08 | 8480 | 3.3 | 30.09 | 9162 | Butylparaben | Y |
| 69 | C16H12O5 | 284.0685 | −H | 283.0612 | 283.0612, 268.0376, 239.0347, 211.0399, 151.0042, 1170364 | 2.4 | 31.73 | 411,240 | 1.9 | 31.73 | 966,434 | 2.1 | 31.76 | 821,365 | Acacetin | |
| 70 | C30H48O5 | 488.3502 | −H | 487.3429 | 487.3407, 443.3155, 425.3410, 391.2990, 319.2477, 207.1753 | −1.1 | 36.75 | 1,790,552 | −1 | 36.74 | 2,880,239 | −2.9 | 36.79 | 709,844 | Asiatic Acid | |
| 71 | C12H14O4 | 222.0892 | +H | 223.0965 | 207.0336, 191.0012, 162.9689, 149.0244, 133.0138, 121.0304 | −1.2 | 44.56 | 19,655 | −1.6 | 44.52 | 20,718 | −2.1 | 44.52 | 20,676 | Ferulic acid ethyl ester | |
| 72 | C30H48O3 | 456.3604 | −H | 455.3531 | 455.3511, 407.3290 | −0.5 | 52.64 | 175,825 | −1.2 | 52.77 | 451,419 | −3.7 | 52.61 | 21,661 | N | |
| 73 | C30H46O3 | 454.3447 | −H | 453.3374 | 453.3367, 407.3354 | −0.6 | 57.83 | 18,035 | −2.4 | 57.82 | 56,886 | −3.7 | 57.83 | 2653 | N | |
| 74 | C16H32O2 | 256.2402 | −H | 255.2330 | 255.2328, 237.2328, 214.9932 | 1.4 | 63.62 | 486,504 | 5.8 | 63.63 | 1,034,687 | 3.4 | 63.57 | 88,067 | Palmitic acid | |
| Group | Doseg/(kg) | Weight (g) | SUA (µmol/L) | Cre (µmol/L) | BUN (mg/dL) |
|---|---|---|---|---|---|
| CG | − | 272.70 ± 16.81 | 74.38 ± 14.64 | 20.22 ± 2.16 | 13.40 ± 2.81 |
| MG | − | 261.80 ± 19.77 | 499.21 ± 101.11 ** | 32.07 ± 9.44 ** | 21.21 ± 5.77 ** |
| APG | 0.01 | 250.60 ± 23.62 | 139.23 ± 26.19 ## | 32.13 ± 5.49 | 22.98 ± 5.10 |
| 50HG | 3.84 | 269.70 ± 10.76 | 393.89 ± 167.72 # | 24.76 ± 2.91 ## | 17.34 ± 3.46 |
| 50MG | 1.92 | 266.40 ± 13.41 | 414.12 ± 178.26 | 31.64 ± 6.79 | 24.89 ± 5.27 |
| 50LG | 0.96 | 258.90 ± 17.38 | 437.92 ± 127.00 | 28.69 ± 5.58 | 26.11 ± 10.21 |
| Group | TNF-α | IL-1β | IL-6 |
|---|---|---|---|
| CG | 9.72 ± 0.67 | 2.47 ± 0.56 | 2.81 ± 0.05 |
| MG | 14.38 ± 2.24 ** | 4.20 ± 0.82 ** | 4.45 ± 0.56 ** |
| APG | 10.74 ± 2.62 ## | 3.22 ± 0.80 # | 3.26 ± 0.51 ## |
| 50HG | 9.50 ± 1.04 ## | 3.25 ± 0.72 # | 2.57 ± 0.47 ## |
| 50MG | 11.59 ± 3.34 | 3.83 ± 0.57 | 3.57 ± 0.44 ## |
| 50LG | 13.98 ± 1.90 | 4.08 ± 0.79 | 3.91 ± 0.17 # |
© 2019 by the authors. Licensee MDPI, Basel, Switzerland. This article is an open access article distributed under the terms and conditions of the Creative Commons Attribution (CC BY) license (http://creativecommons.org/licenses/by/4.0/).
Share and Cite
Zhang, W.; Du, W.; Li, G.; Zhang, C.; Yang, W.; Yang, S.; Feng, Y.; Chen, H. Constituents and Anti-Hyperuricemia Mechanism of Traditional Chinese Herbal Formulae Erding Granule. Molecules 2019, 24, 3248. https://doi.org/10.3390/molecules24183248
Zhang W, Du W, Li G, Zhang C, Yang W, Yang S, Feng Y, Chen H. Constituents and Anti-Hyperuricemia Mechanism of Traditional Chinese Herbal Formulae Erding Granule. Molecules. 2019; 24(18):3248. https://doi.org/10.3390/molecules24183248
Chicago/Turabian StyleZhang, Wugang, Wendi Du, Guofeng Li, Chen Zhang, Wuliang Yang, Shilin Yang, Yulin Feng, and Haifang Chen. 2019. "Constituents and Anti-Hyperuricemia Mechanism of Traditional Chinese Herbal Formulae Erding Granule" Molecules 24, no. 18: 3248. https://doi.org/10.3390/molecules24183248
APA StyleZhang, W., Du, W., Li, G., Zhang, C., Yang, W., Yang, S., Feng, Y., & Chen, H. (2019). Constituents and Anti-Hyperuricemia Mechanism of Traditional Chinese Herbal Formulae Erding Granule. Molecules, 24(18), 3248. https://doi.org/10.3390/molecules24183248