Computational Analysis of Exotic Molecular and Atomic Vibrations in Ice XV


Abstract
1. Introduction
2. Computational Methods
3. Results and Discussion
4. Conclusions
Supplementary Materials
Author Contributions
Funding
Acknowledgments
Conflicts of Interest
References
- Gu, Y.; Zhu, X.L.; Jiang, L. Comparative analysis of hydrogen bond vibrations in ice VIII and VII. J. Phys. Chem. C 2019, 123, 14880–14883. [Google Scholar] [CrossRef]
- Moberg, D.R.; Sharp, P.J.; Paesani, F. Molecular-level interpretation of vibrational spectra of ordered ice phases. J. Phys. Chem. B 2018, 122, 10572–10581. [Google Scholar] [CrossRef] [PubMed]
- Bridgman, P.W. Water, in the Liquid and Five Solid Forms, under Pressure. Proc. Am. Acad. Arts Sci. 1912, 47, 441. [Google Scholar] [CrossRef]
- Kamb, B. Structure of ice VI. Science 1965, 150, 205. [Google Scholar] [CrossRef] [PubMed]
- Kuhs, W.F.; Finney, J.L.; Vettier, C.; Bliss, D.V. Structure and hydrogen ordering in ices VI, VII, and VIII by neutron powder diffraction. J. Chem. Phys. 1984, 81, 3612. [Google Scholar] [CrossRef]
- Kuhs, W.F.; Ahsbahs, H.; Londono, D.; Finney, J.L. In-situ crystal growth and neutron four-circle diffractometry under high pressure. Phys. B 1989, 684, 156–157. [Google Scholar] [CrossRef]
- Salzmann, C.G.; Radaelli, P.G.; Mayer, E.; Finney, J.L. Ice XV: A new thermodynamically stable phase of ice. Phys. Rev. Lett. 2009, 103, 105701. [Google Scholar] [CrossRef] [PubMed]
- Whale, T.F.; Clark, S.J.; Finney, J.L. DFT-assisted interpretation of the Raman spectra of hydrogen-ordered ice XV. J. Raman Spectrosc. 2013, 44, 290–298. [Google Scholar] [CrossRef]
- Komatsu, K.; Noritake, F.; Machida, S. Partially ordered state of ice XV. Sci. Rep. 2016, 6, 28920. [Google Scholar] [CrossRef] [PubMed]
- Nanda, K.D.; Beran, G.J.O. What governs the proton ordering in ice XV? J. Phys. Chem. Lett. 2013, 4, 3165–3169. [Google Scholar] [CrossRef]
- Gasser, T.M.; Thoeny, A.; Plaga, L. Experimental evidence for a second hydrogen ordered phase of ice VI. Chem. Sci. 2018, 9, 4224–4234. [Google Scholar] [CrossRef] [PubMed]
- Zhang, K.; Zhang, P.; Wang, Z.R.; Zhu, X.L.; Lu, Y.B.; Guan, C.B.; Li, Y. DFT simulations of the vibrational spectrum and hydrogen bonds of ice XIV. Molecules 2018, 23, 1781. [Google Scholar] [CrossRef] [PubMed]
- Yuan, Z.Y.; Zhang, P.; Yao, S.K.; Lu, Y.B.; Yang, H.Z.; Luo, H.W.; Zhao, Z.J. Computational assignments of lattice vibrations of ice Ic. RSC Adv. 2017, 7, 36801. [Google Scholar] [CrossRef]
- Wang, Z.R.; Zhu, X.L.; Jiang, L.; Zhang, K.; Luo, H.W.; Gu, Y.; Zhang, P. Investigations of the hydrogen bonds and vibrational spectra of clathrate ice XVI. Materials 2019, 12, 246. [Google Scholar] [CrossRef]
- Zhu, X.L.; Yuan, Z.Y.; Jiang, L.; Zhang, K.; Wang, Z.R.; Luo, H.W.; Gu, Y.; Cao, J.W.; Qin, X.L.; Zhang, P. Computational analysis of vibrational spectrum and hydrogen bonds of ice XVII. New J. Phys. 2019, 21, 043054. [Google Scholar] [CrossRef]
- Clark, S.J.; Segall, M.D.; Pickard, C.J.; Hasnip, P.J.; Probert, M.I.J.; Refson, K.; Payne, M.C. First principles methods using CASTEP. Z. Kristallogr. 2005, 220, 567–570. [Google Scholar] [CrossRef]
- Hammer, B.; Hansen, L.B.; Norskov, J.K. Improved adsorption energetics within density-functional theory using revised Perdew-Burke-Ernzerhof functionals. Phys. Rev. B. 1999, 59, 7413–7421. [Google Scholar] [CrossRef]


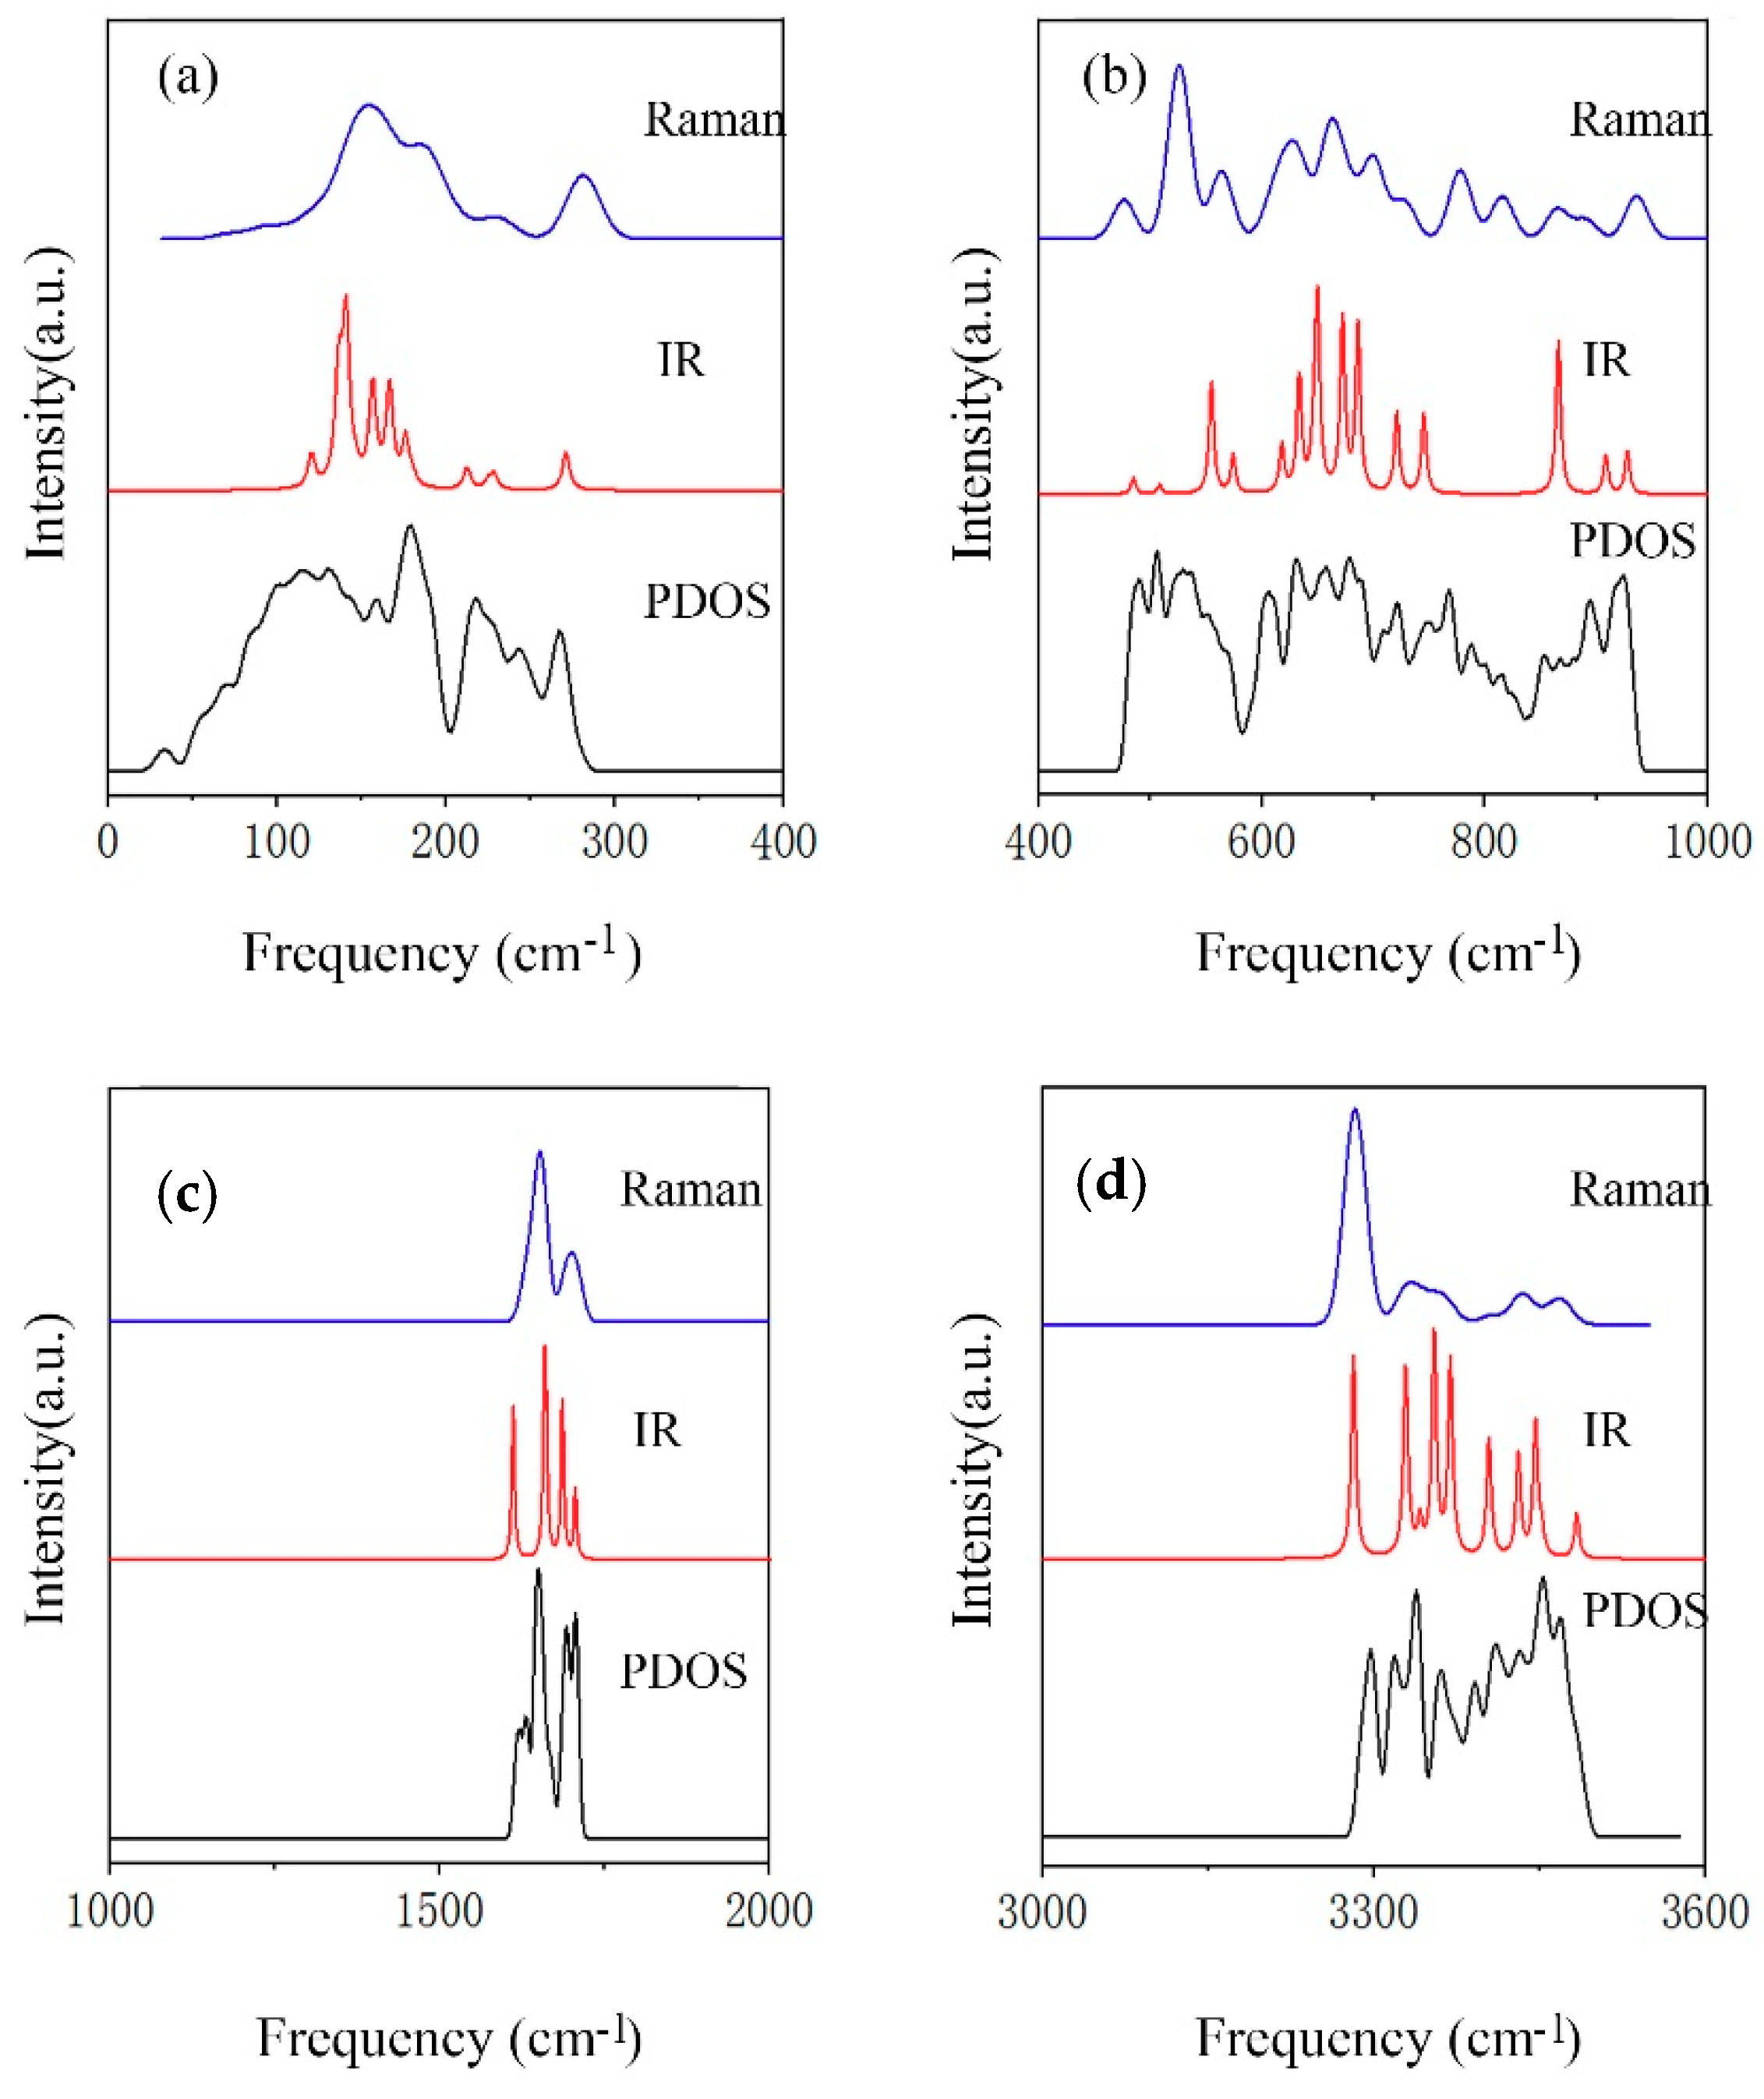
| PDOS | Normal Modes | IR Intensity | Raman Intensity | Raman Exp. [8/11] |
|---|---|---|---|---|
| 73 | N | 0.12 | ||
| 106 | N | 0.24 | ||
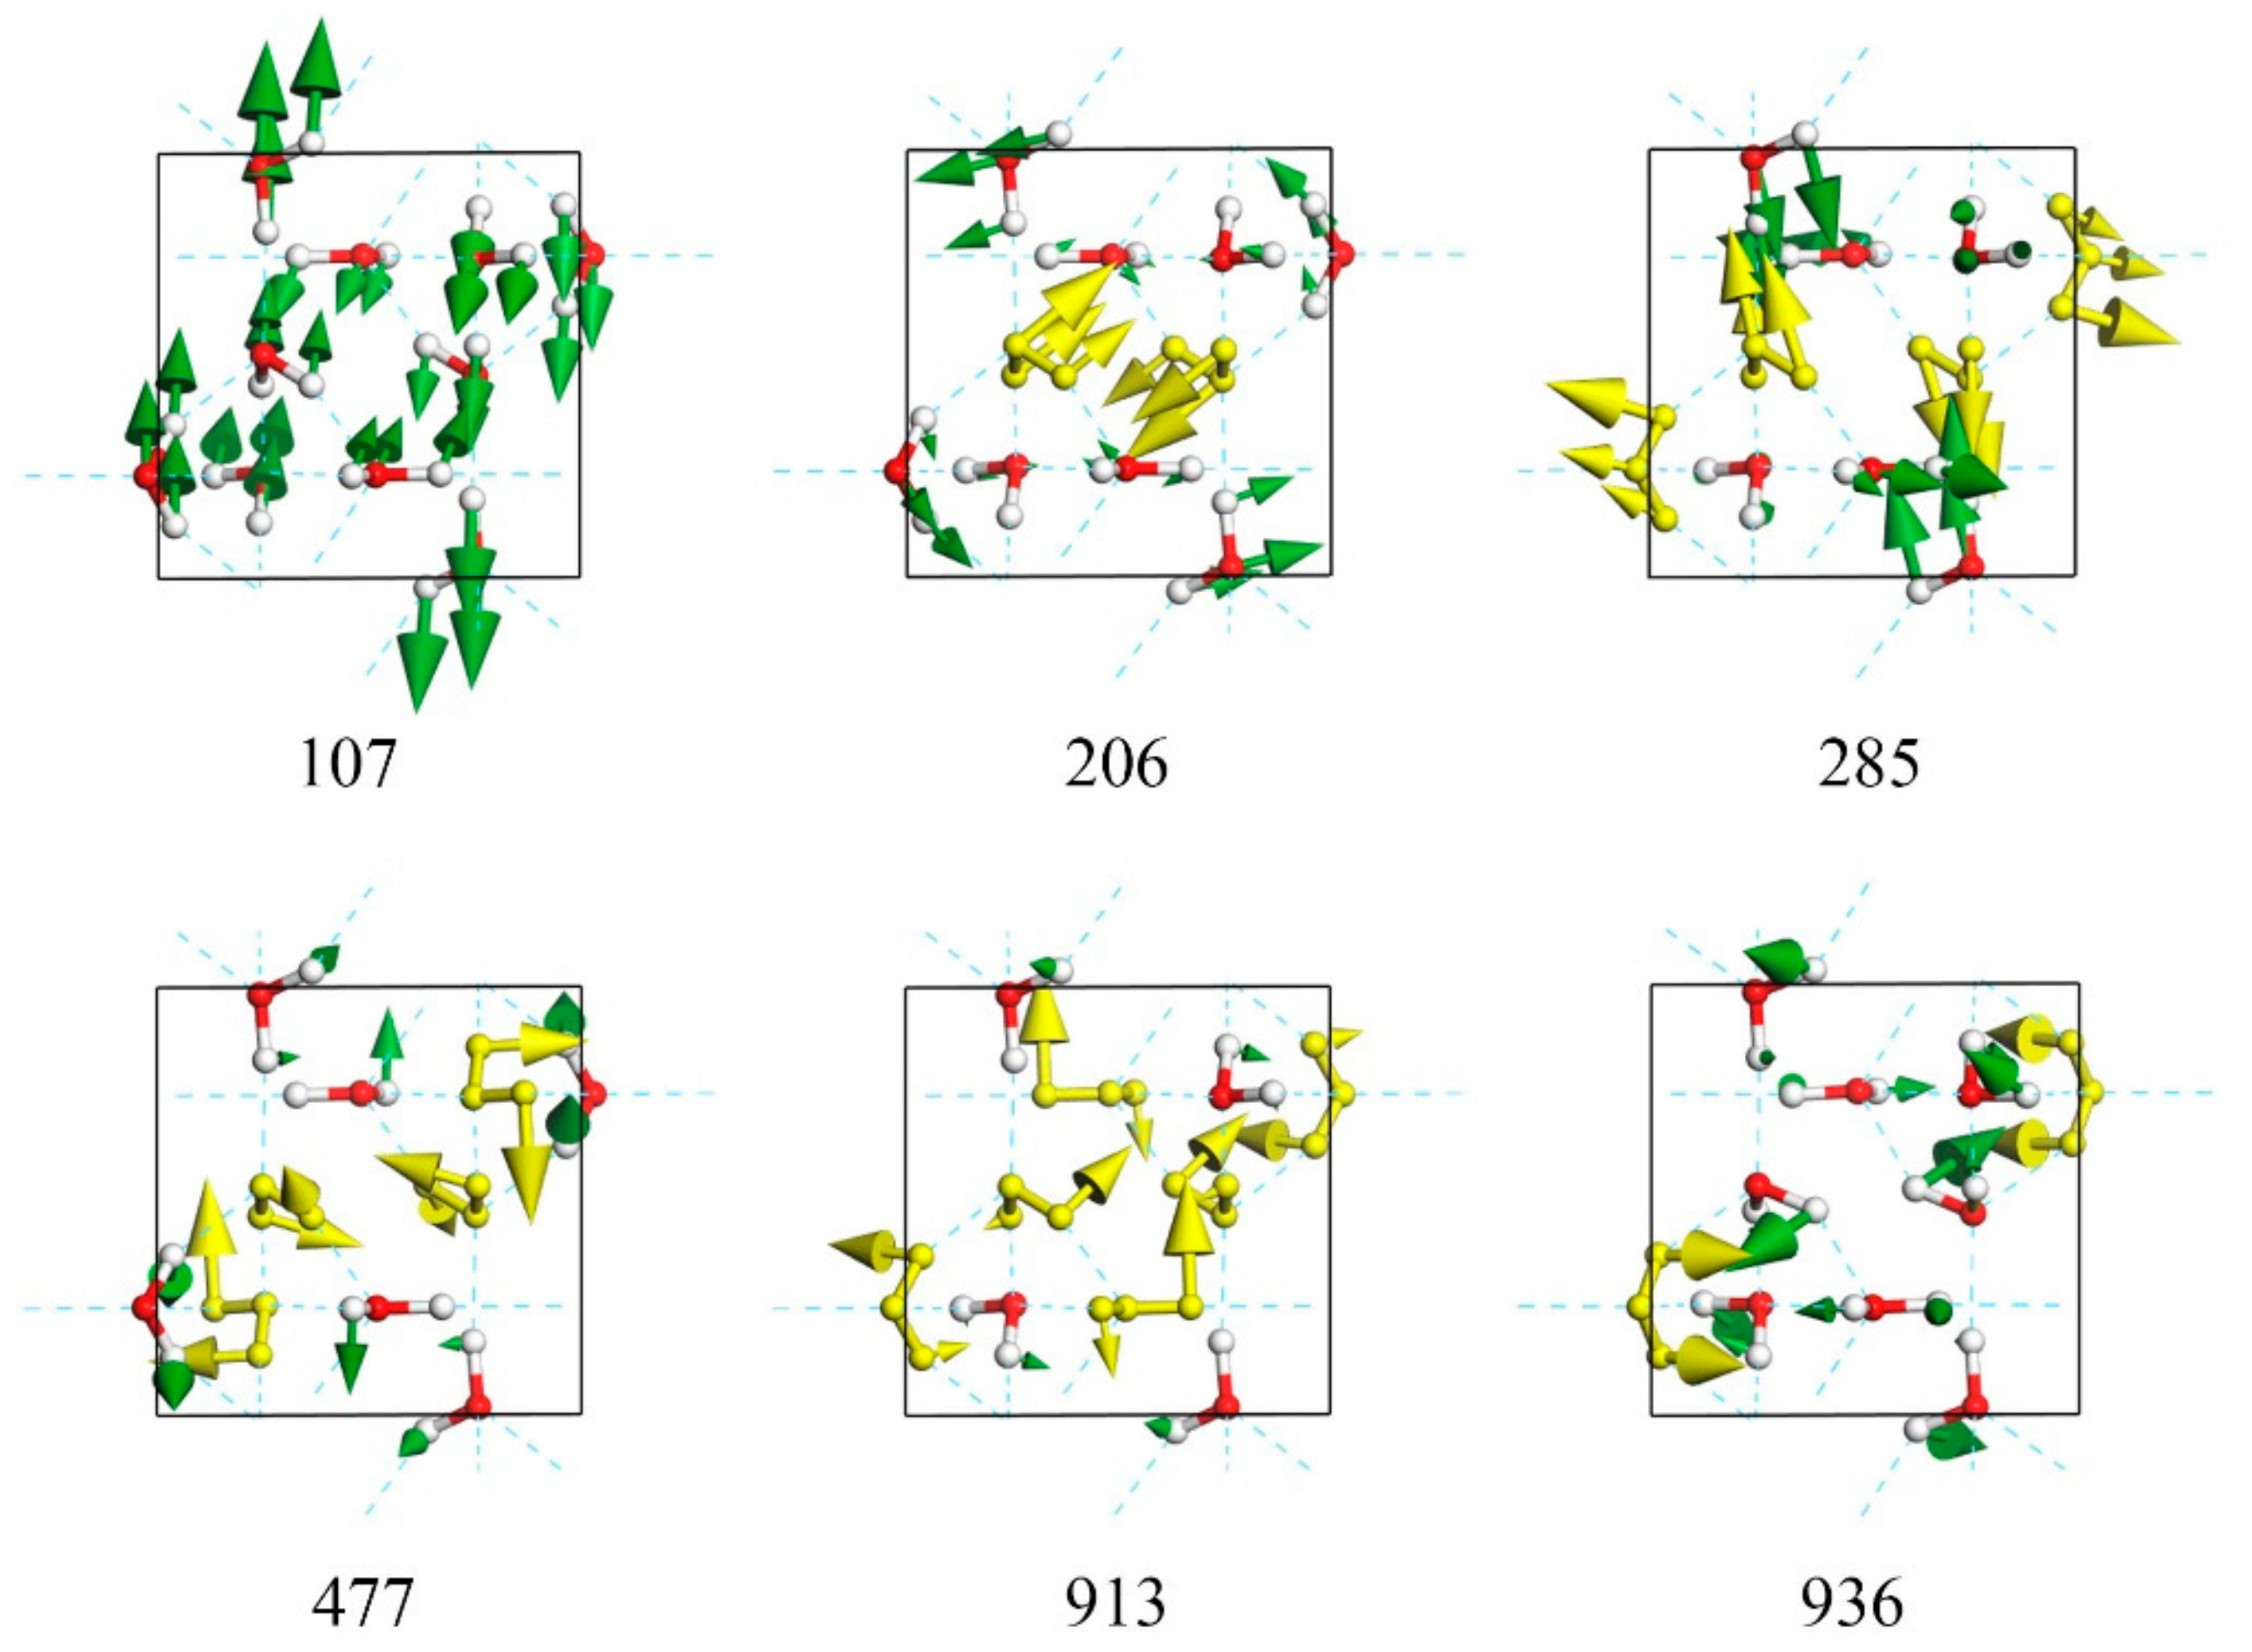
| 107 | N | 0.15 | ||
| 113 | 136 | N | 0.22 | 114/113 |
| 138 | 1.65 | N | ||
| 130 | 148 | N | 0.72 | |
| 150 | 1.14 | N | ||
| 158 | 1.60 | N | ||
| 162 | N | 0.27 | ||
| 165 | N | 1.20 | ||
| 167 | 1.39 | N | ||
| 175 | 0.92 | N | 158/159 | |
| 159 | 181 | 0.24 | N | |
| 182 | N | 0.57 | ||
| 184 | N | 0.40 | ||
| 178 | 185 | 1.22 | N | |
| 192 | N | 1.55 | ||
| 201 | 0.22 | N | 186/185 | |
| 206 | N | 0.33 | ||
| 221 | N | 0.32 | 220/215 | |
| 217 | 225 | 0.37 | N | |
| 231 | 0.33 | N | ||
| 232 | N | 0.04 | 230/ | |
| 234 | 0.13 | N | ||
| 243 | 236 | N | 0.30 | 300/ |
| 268 | 275 | 0.64 | N | |
| 285 | N | 1.01 | 312/303 | |
| 477 | N | 1.81 | 451/450 | |
| 489 | 484 | 1.09 | N | |
| 506 | 508 | 0.80 | N | |
| 529 | 531 | N | 7.56 | 499/495 |
| 550 | 9.21 | N | ||
| 566 | N | 3.06 | 548/544 | |
| 579 | 2.93 | N | ||
| 606 | 611 | N | 1.43 | |
| 618 | 4.52 | N | ||
| 621 | N | 2.42 | ||
| 631 | 631 | 10.29 | N | |
| 635 | N | 3.31 | ||
| 649 | 1.36 | N | ||
| 652 | 16.64 | N | ||
| 657 | 662 | N | 4.75 | |
| 671 | 15.25 | N | ||
| 679 | 677 | N | 1.89 | |
| 685 | 8.19 | N | ||
| 702 | N | 3.94 | ||
| 722 | 718 | 5.70 | N | |
| 731 | N | 1.79 | ||
| 747 | 748 | 5.20 | N | |
| 768 | 775 | N | 3.73 | |
| 815 | 817 | N | 2.33 | |
| 864 | 11.87 | N | ||
| 867 | N | 1.51 | ||
| 894 | 892 | N | 1.08 | |
| 913 | 2.73 | N | ||
| 926 | 928 | 3.25 | N | |
| 936 | N | 1.97 | ||
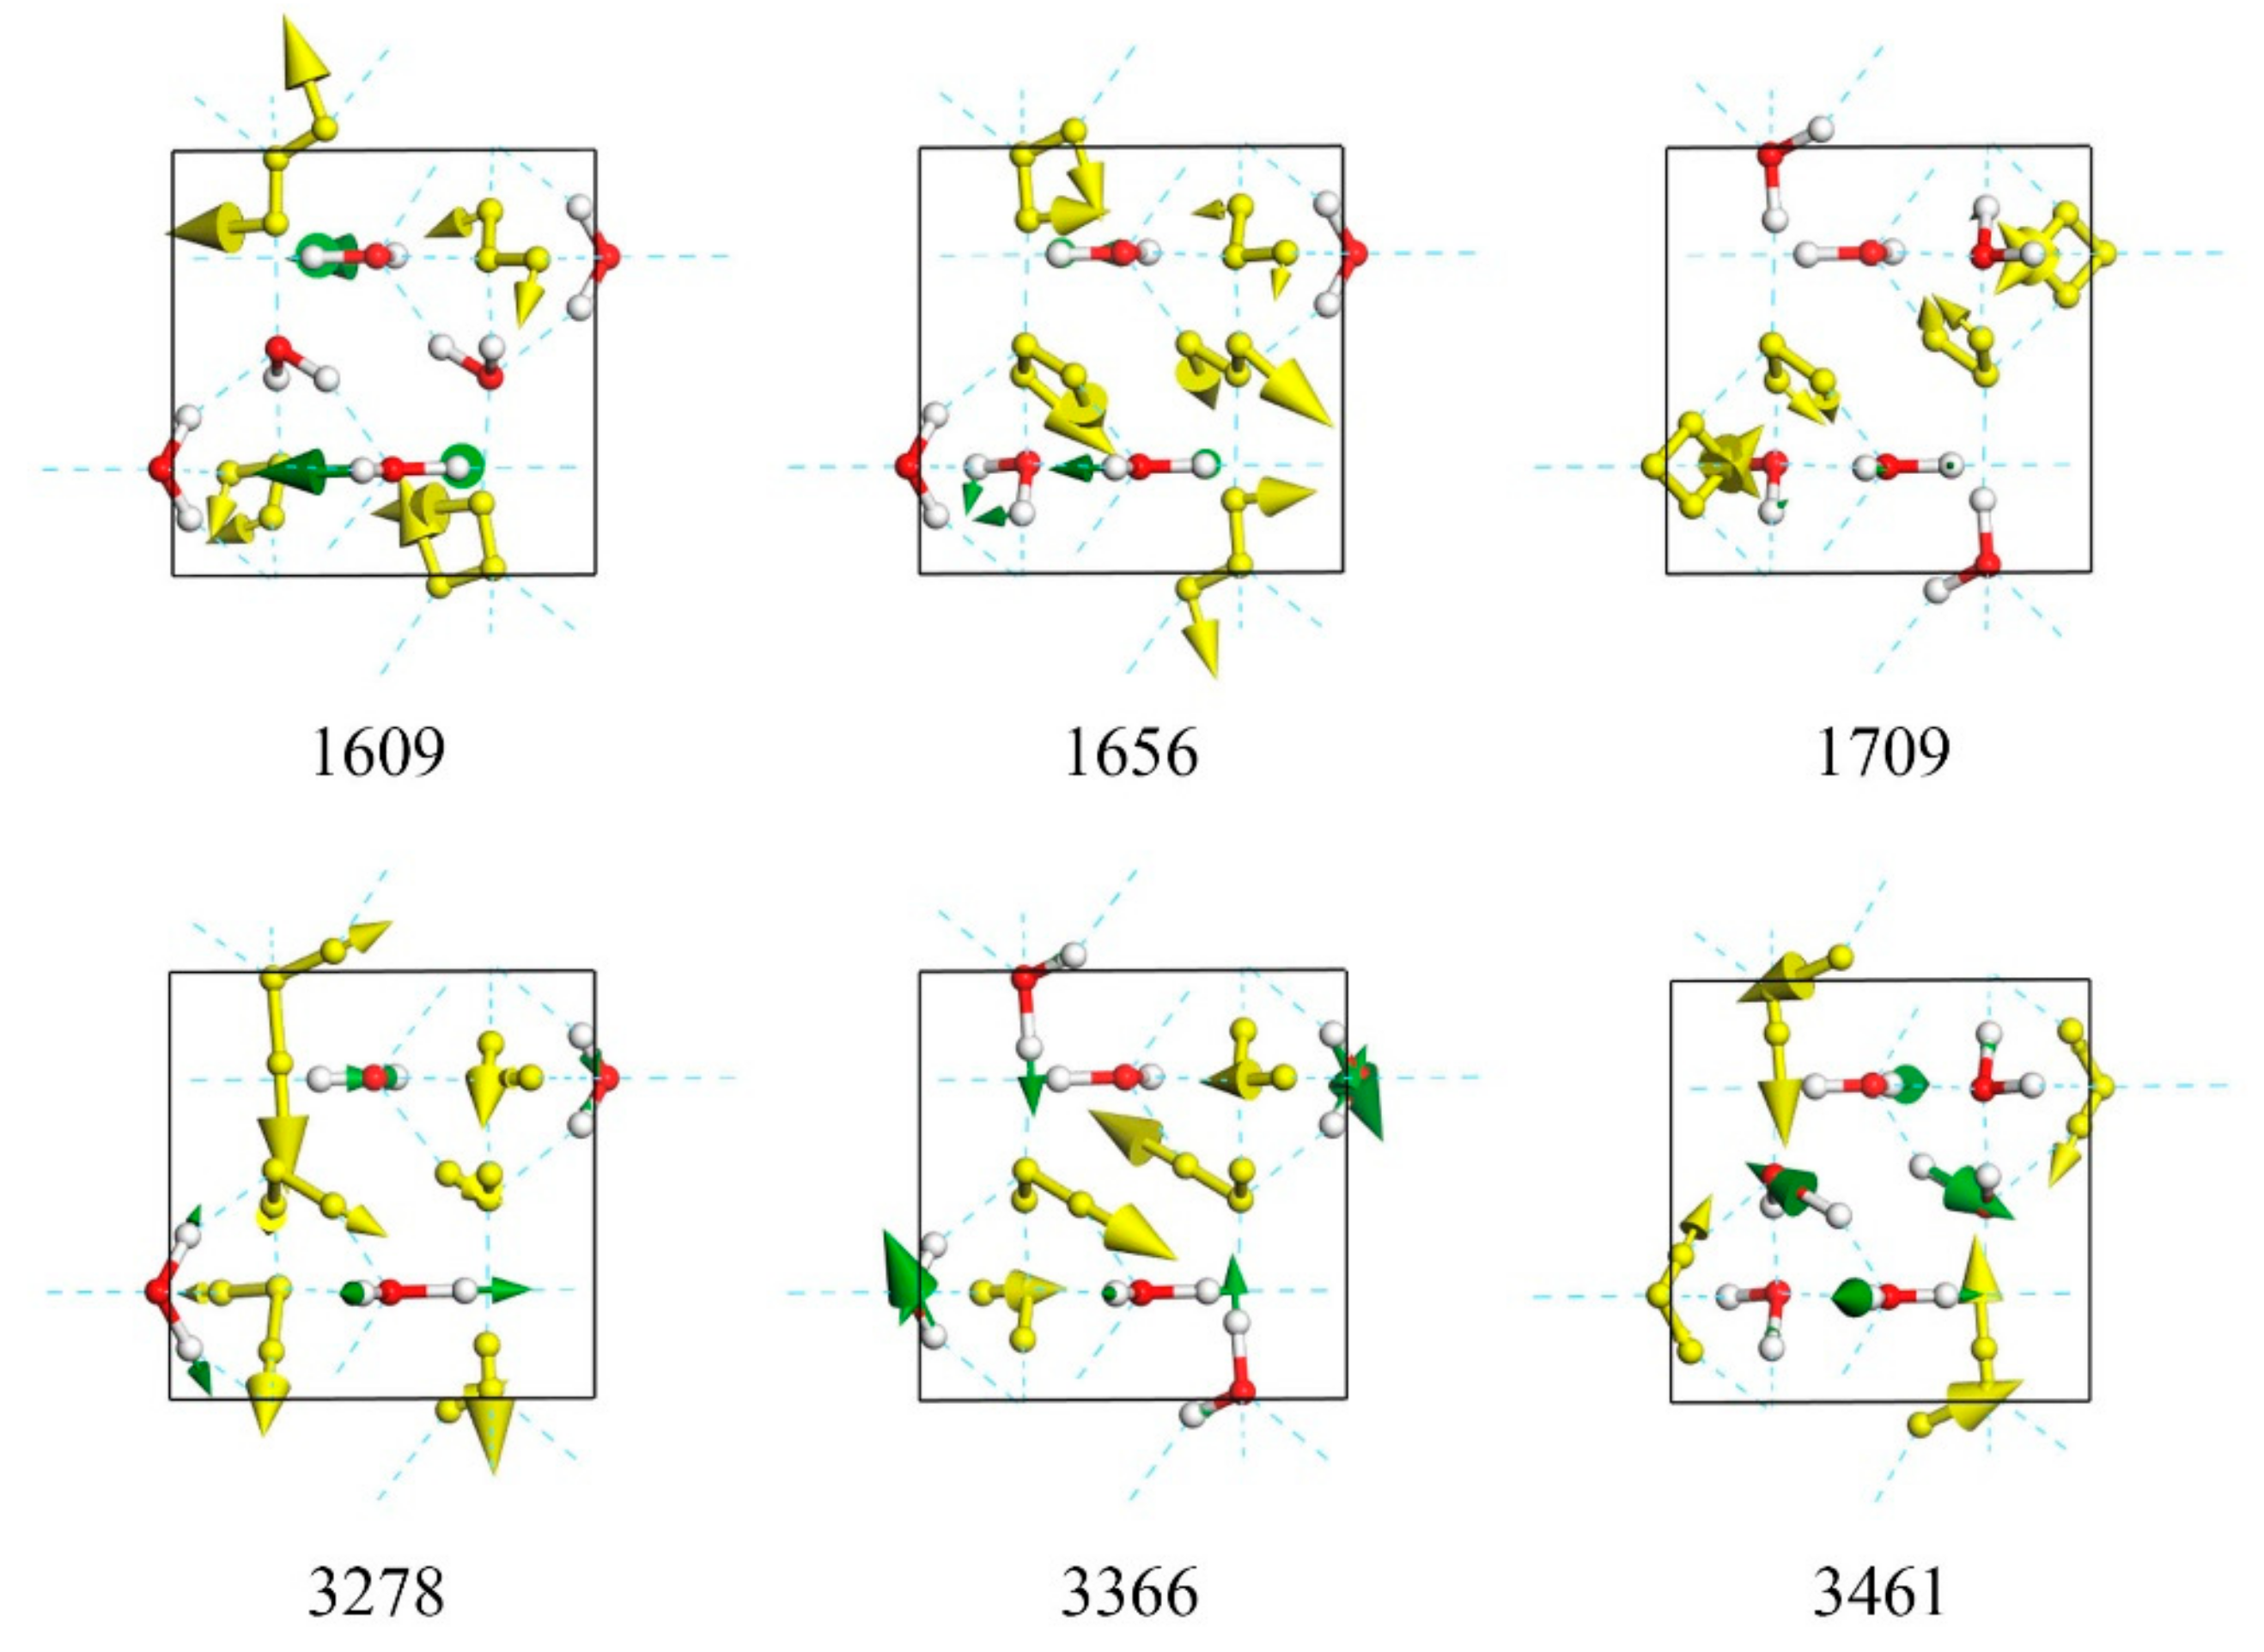
| 1621 | 1609 | 5.37 | N | |
| 1630 | 1629 | N | 1.94 | |
| 1649 | 1648 | N | 3.68 | |
| 1655 | N | 5.27 | ||
| 1656 | 5.46 | N | ||
| 1660 | 3.70 | N | ||
| 1684 | 5.57 | N | ||
| 1692 | 1692 | N | 2.71 | |
| 1705 | 2.37 | N | ||
| 1706 | 1709 | N | 2.91 | |
| 3278 | 63.85 | N | ||
| 3296 | 3280 | N | 3777.67 | 3224/3222 |
| 3325 | 57.33 | N | ||
| 3318 | 3326 | N | 552.40 | 3335/ |
| 3338 | 3339 | 7.64 | N | |
| 3341 | N | 346.17 | 3345/3349 | |
| 3354 | 57.53 | N | ||
| 3360 | 3357 | N | 288.67 | |
| 3366 | N | 278.88 | ||
| 3367 | 50.96 | N | ||
| 3391 | 3402 | 27.87 | N | |
| 3411 | 3403 | N | 164.02 | 3396/ |
| 3429 | 27.91 | N | ||
| 3432 | 3432 | N | 394.53 | 3425/3420 |
| 3442 | N | 154.45 | ||
| 3448 | 39.83 | N | ||
| 3453 | 3452 | 9.24 | N | |
| 3461 | N | 100.59 | ||
| 3469 | 3472 | N | 383.12 | |
| 3485 | 12.40 | N |
© 2019 by the authors. Licensee MDPI, Basel, Switzerland. This article is an open access article distributed under the terms and conditions of the Creative Commons Attribution (CC BY) license (http://creativecommons.org/licenses/by/4.0/).
Share and Cite
Qin, X.-L.; Zhu, X.-L.; Cao, J.-W.; Jiang, L.; Gu, Y.; Wang, X.-C.; Zhang, P. Computational Analysis of Exotic Molecular and Atomic Vibrations in Ice XV. Molecules 2019, 24, 3115. https://doi.org/10.3390/molecules24173115
Qin X-L, Zhu X-L, Cao J-W, Jiang L, Gu Y, Wang X-C, Zhang P. Computational Analysis of Exotic Molecular and Atomic Vibrations in Ice XV. Molecules. 2019; 24(17):3115. https://doi.org/10.3390/molecules24173115
Chicago/Turabian StyleQin, Xiao-Ling, Xu-Liang Zhu, Jing-Wen Cao, Lu Jiang, Yue Gu, Xue-Chun Wang, and Peng Zhang. 2019. "Computational Analysis of Exotic Molecular and Atomic Vibrations in Ice XV" Molecules 24, no. 17: 3115. https://doi.org/10.3390/molecules24173115
APA StyleQin, X.-L., Zhu, X.-L., Cao, J.-W., Jiang, L., Gu, Y., Wang, X.-C., & Zhang, P. (2019). Computational Analysis of Exotic Molecular and Atomic Vibrations in Ice XV. Molecules, 24(17), 3115. https://doi.org/10.3390/molecules24173115