Article

Obtaining an Extract Rich in Phenolic Compounds from Olive Pomace by Pressurized Liquid Extraction

by
Inés Cea Pavez
1,2,
Jesús Lozano-Sánchez
3,4,*,
Isabel Borrás-Linares
3,
Hugo Nuñez
5,
Paz Robert
1 and
Antonio Segura-Carretero
4,6
1
Departamento de Ciencia de los Alimentos y Tecnología Química, Facultad de Ciencias Químicas y Farmacéuticas, Universidad de Chile, Santos Dumont 964, Independencia, Santiago 8380494, Chile
2
Center for Systems Biotechnology, Fraunhofer Chile Research, Av. Del Cóndor 844 floor 3, Santiago 8580704, Chile
3
Department of Food Science and Nutrition, University of Granada, Campus Universitario s/n, 18071-Granada, Spain
4
Research and Development of Functional Food Centre, Health Science Technological Park, Avda. del Conocimiento, n° 37, Ed. BioRegión, Armilla, Granada 18016, Spain
5
Departamento de Agroindustria y Enología, Facultad de Ciencias Agronómicas, Universidad de Chile Casilla 1004 Santiago, Chile
6
Department de Analytical Chemistry, Faculty of Sciences, University of Granada, Fuentenueva s/n, Granada 18071, Spain
*
Author to whom correspondence should be addressed.
Molecules 2019, 24(17), 3108; https://doi.org/10.3390/molecules24173108
Submission received: 29 July 2019 / Revised: 22 August 2019 / Accepted: 25 August 2019 / Published: 27 August 2019
(This article belongs to the Special Issue Bioactives from Bioprocessing: Sources and Production)

Abstract

:
The olive oil industry produces large volumes of wastes, which are also potential sources of bioactive compounds by developing healthy and/or functional foods. Extraction of phenolic compounds from the residues of the olive oil is mainly carried out with solvents. However, there is currently a growing public awareness about the use of organic solvents in food processing, which has pointed out the need for the application of clean technologies such as pressurized liquid extraction (PLE). Therefore, the aim of this research was to optimize the phenolic compound extraction from olive pomace by PLE, establishing the qualitative and quantitative phenolic profile by HPLC-ESI-TOF/MS. The extraction design to recover phenolics from olive pomace demonstrates a great compositional variability of PLE extracts obtained under different experimental conditions. Indeed, quantitative results have pointed out the selectivity of PLE extraction when this technique is applied to the treatment of olive pomace. PLE-optimized conditions showed higher total phenolic compound content than conventional extraction (1659 mg/kg d.w. and 281.7 mg/kg d.w., respectively). Among these phenolics, the quantity of secoiridoids and flavonoids in the optimized PLE extract was three and four times higher than in conventional extracts. Furthermore, optimal PLE conditions allowed to obtain an enriched hydroxytyrosol extract which was not detected in the conventional one.

1. Introduction

The food industry produces large volumes of both solid and liquid wastes, which represent a disposal and potentially environmental pollution problem. However, they are also potential sources of bioactive compounds that can be recovered and used as valuable substances by developing healthy and/or functional foods [1,2]. In this sense, the production of extra virgin olive oil (EVOO) is associated with both the generation of large quantities of wastes and the loss of phenolic compounds during the process by the partitioning between oil and by-products (olive mill waste water, olive pomace, storage by-products, and filter cake) [3,4].
The olive pomace, or “Orujo”, is the solid by-product produced from the three-phase decanter process used in the olive oil industry. Olive pomace is composed of olive pulp, skin, stone and water. Concerning its chemical composition, high phenolic content has been reported by several authors, which reaches the level of 100 times higher than in EVOO [3,4].
Various studies have reported that olive oil consumption is associated with several health benefits, including the reduction of risk factors of coronary heart disease, the prevention of several chronic diseases (such as atherosclerosis), cancer, chronic inflammation, strokes, and other degenerative diseases. These beneficial health effects have been attributed, in part, to phenolic compounds [4,5,6].
Olive pomace phenolic compounds are a complex mixture of components that include hydroxytyrosol and tyrosol derivatives, iridoid precursors, secoiridoids and derivatives (oleuropein, oleuropein aglycone, ligstroside and its derivatives), phenylpropanoids (verbascoside and its derivatives), flavonoids (luteolin, apigenin, rutin, taxifolin and its derivatives), lignans (pinoresinol and derivatives), and phenolic acids (gallic acid, caffeic acid, cinnamic acid, p-coumaric acid, ferulic acid, vanillic acid, and shikimic acid) [7,8,9,10]. However, the concentration of these phenolic compounds has been reported to be affected by both agronomic and technological process conditions such as type of cultivar, ripening degree, different milling process, and edaphoclimatic factors [8,9].
For the extraction of olive phenolic compounds at laboratory-scale, different solvents have been used, such as methanol/water, ethyl acetate, propanol, acetone, or acetonitrile, but the effects of these compounds in humans and the environment are drawing attention. Thus, the industry has addressed its research to obtain bioactive compound-enriched extracts using different processes. Some reported methods for the extraction of phenolic compounds from olive oil wastes are: Solvent extraction [10,11,12,13,14], hydrothermal extraction [15,16], high pressure–high temperature reactor [17] extraction with subcritical water [18,19,20,21], microwave and ultrasound-assisted extraction [22,23], and absorbent resins or membrane separation [24,25,26]. Nevertheless, the industrial interest has been addressed to develop new processes based on more selective, environmentally-friendly, and cost-effective extraction techniques. Among these technologies, microwave-assisted extraction (MAE), supercritical fluid extraction (SFE) using CO2, and pressurized liquid extraction (PLE) have been applied to olive by-products [7,9].
PLE is considered as an advanced technology which uses liquid solvents at elevated temperature and pressure, improving the extraction performance as compared to those techniques carried out at room temperature and atmospheric pressure. The use of solvents at temperatures above their atmospheric boiling point improves the solubility and mass transfer properties [27]; moreover, it provides several advantages compared to the conventional technologies, showing better selectivity, extraction time reduction, and lower toxic organic solvent use [18,19,20,21]. Moreover, it is a technique effective not only as a laboratory tool, but also for agri-food industries [9].
Due to the above, the aim of this research was to: (a) Optimize the phenolic compound extraction from olive pomace by pressurized liquid extraction, (b) characterize the complete profile of phenolic compounds by HPLC-DAD-ESI-TOF/MS, and (c) quantify individual phenolics to determine an alternative methodology to recover bioactives from olive pomace.

2. Results and Discussion

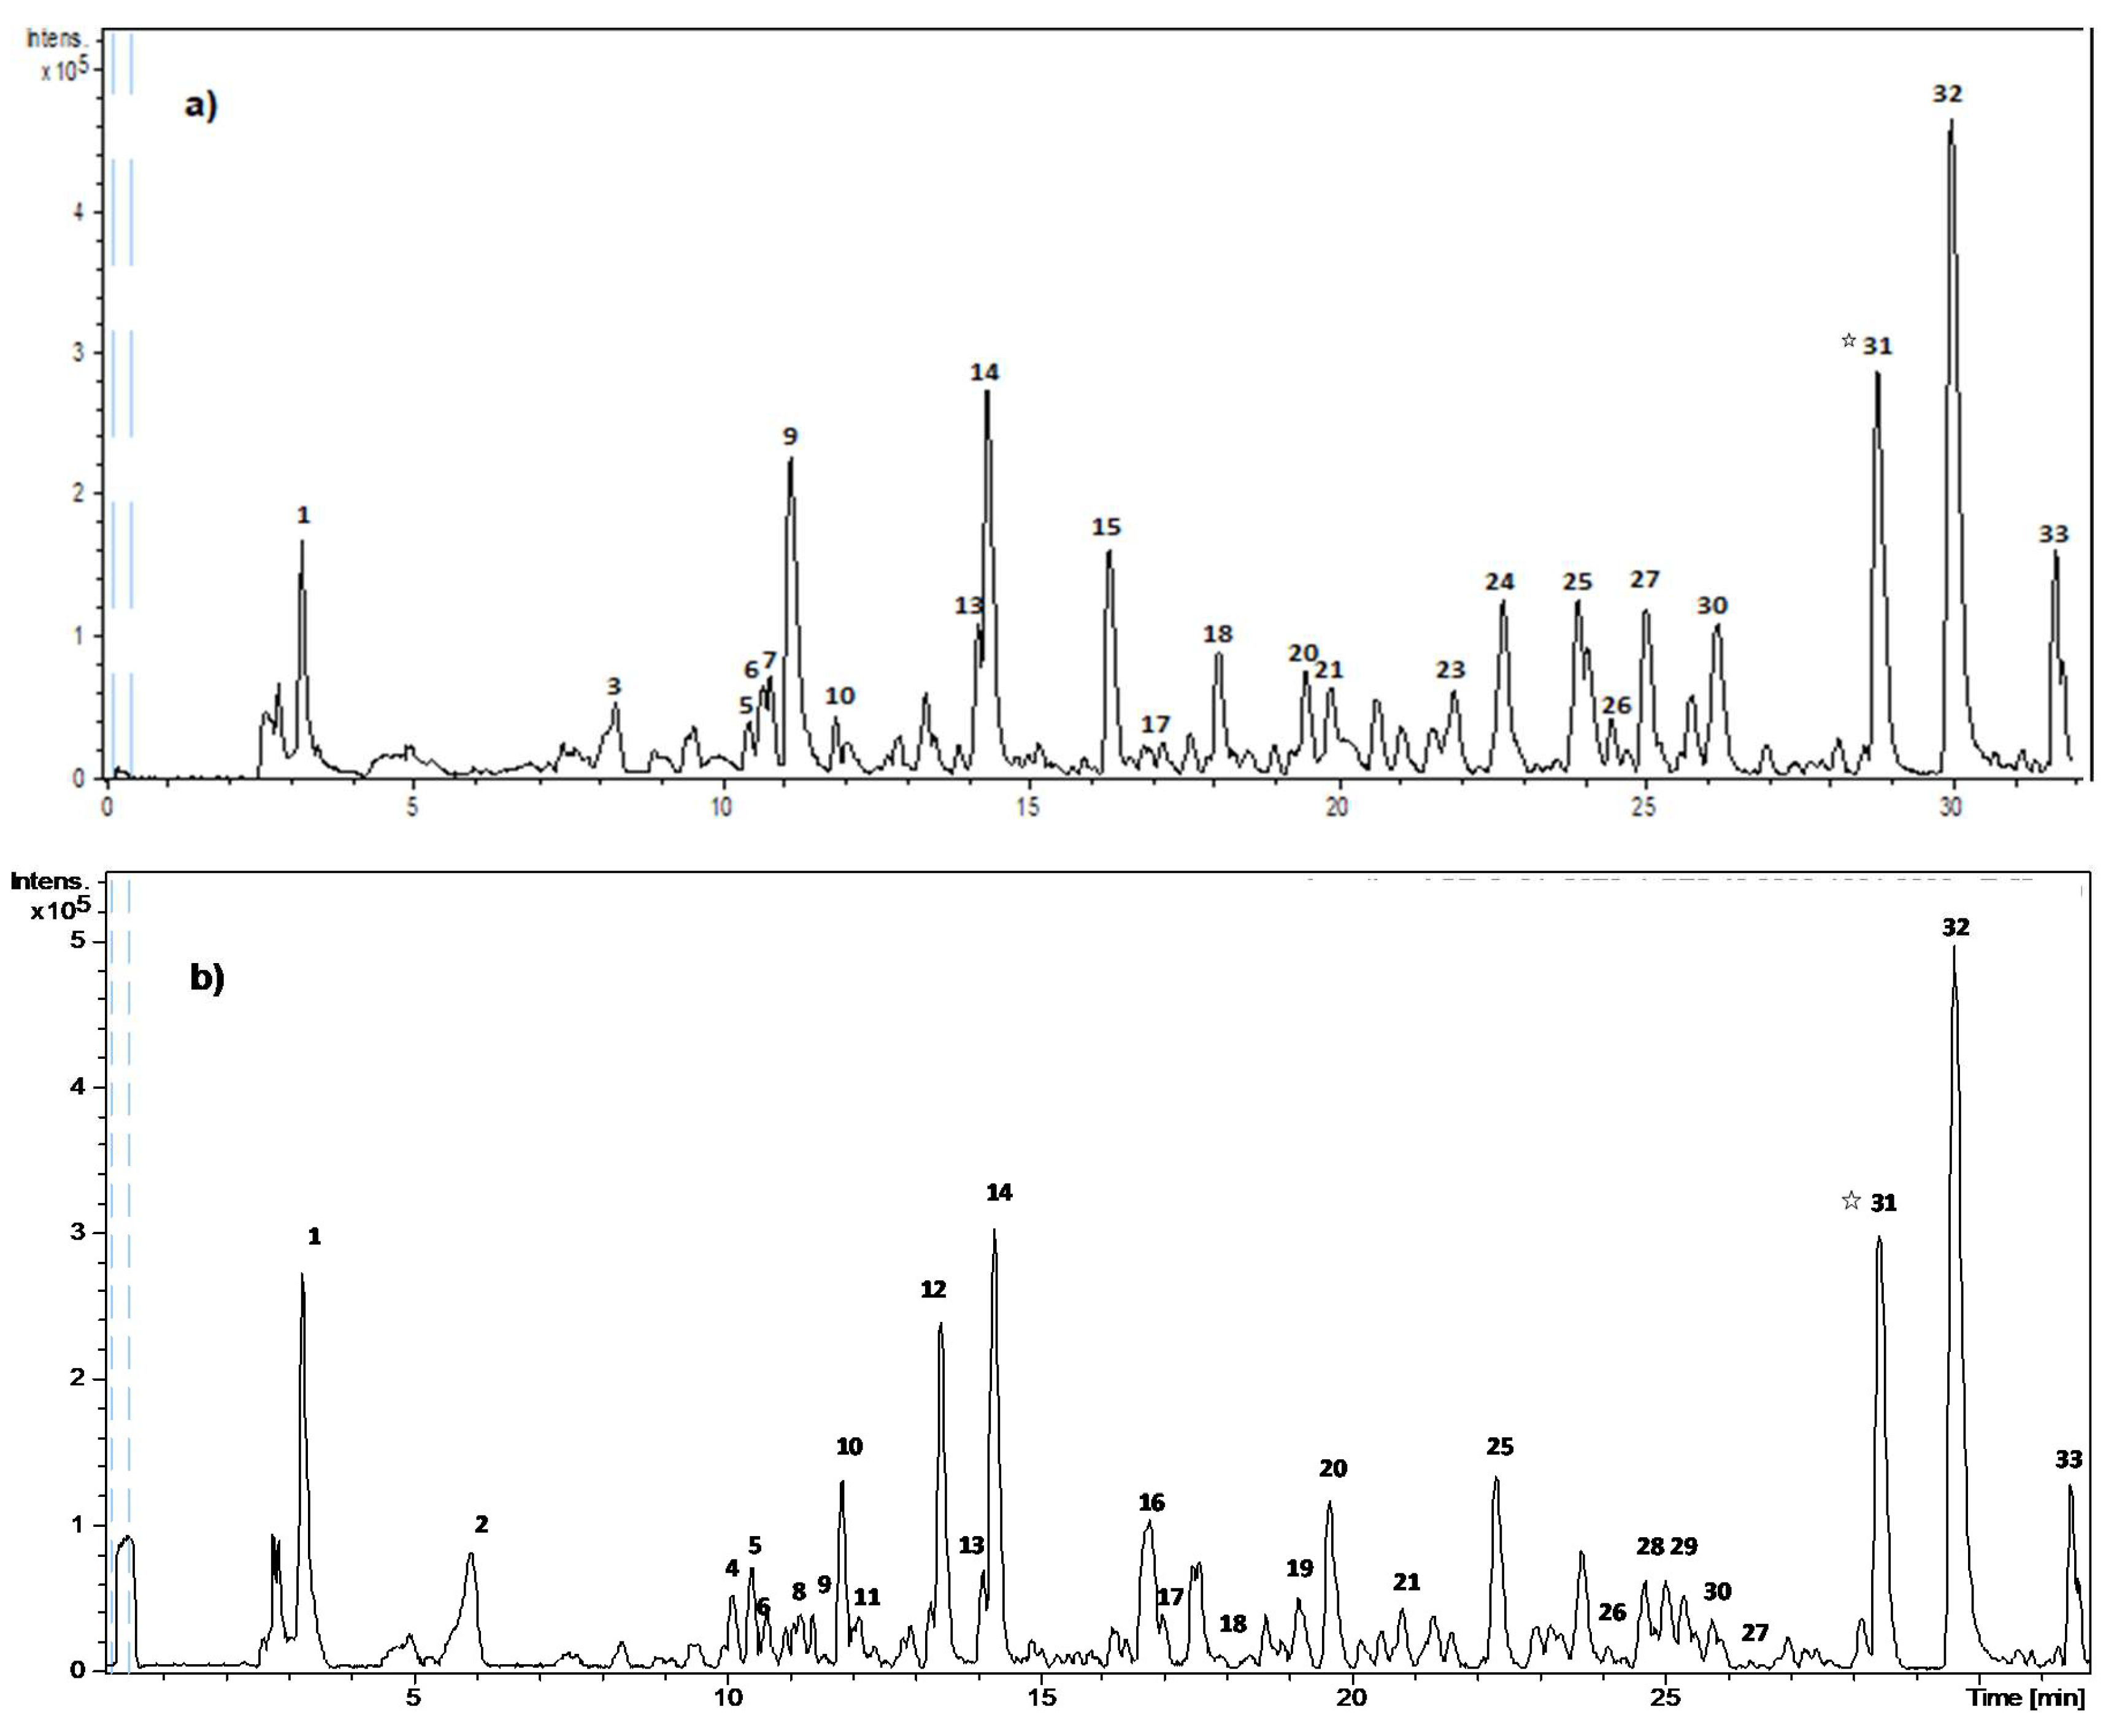
2.1. Qualitative Characterization of Olive Pomace Phenolic Compounds Obtained by PLE

A central composite design for the extraction of olive pomace (OP) by PLE (OP-PLE) was carried out. Table 1 includes the tentative identification of phenolic compounds from olive pomace performed by HPLC-DAD-ESI-TOF/MS. Figure 1 shows the HPLC chromatogram. The phenolic compounds of OP were identified considering their retention times (Rt), UV-Vis spectrum, and MS spectrum. According to the chemical structure, phenolic compounds were classified in phenolic alcohols, secoiridoids, flavonoids, and lignans. Concerning phenolic alcohols, hydroxytyrosol and oxidized hydroxytyrosol were characterized in the analyzed samples. With regard to secoiridoids and derivatives, a total of seven compounds were identified: Oleoside, loganic acid, secoiridoid derived, D-OH-EA, hydroxy D-oleuropein aglycone, demethyl oleuropein, and an aldehydic form of decarboxymethyl elenolic acid. In addition, two flavonoids (luteolin and luteolin-7-glucoside) and two lignans (pinoresinol and acetoxypinoresinol) were also detected. A non-phenolic polar compound was also identified as quinic acid. Most of these compounds have been previously described in olive oil and olive by-products [4,8,19,23,27,28].

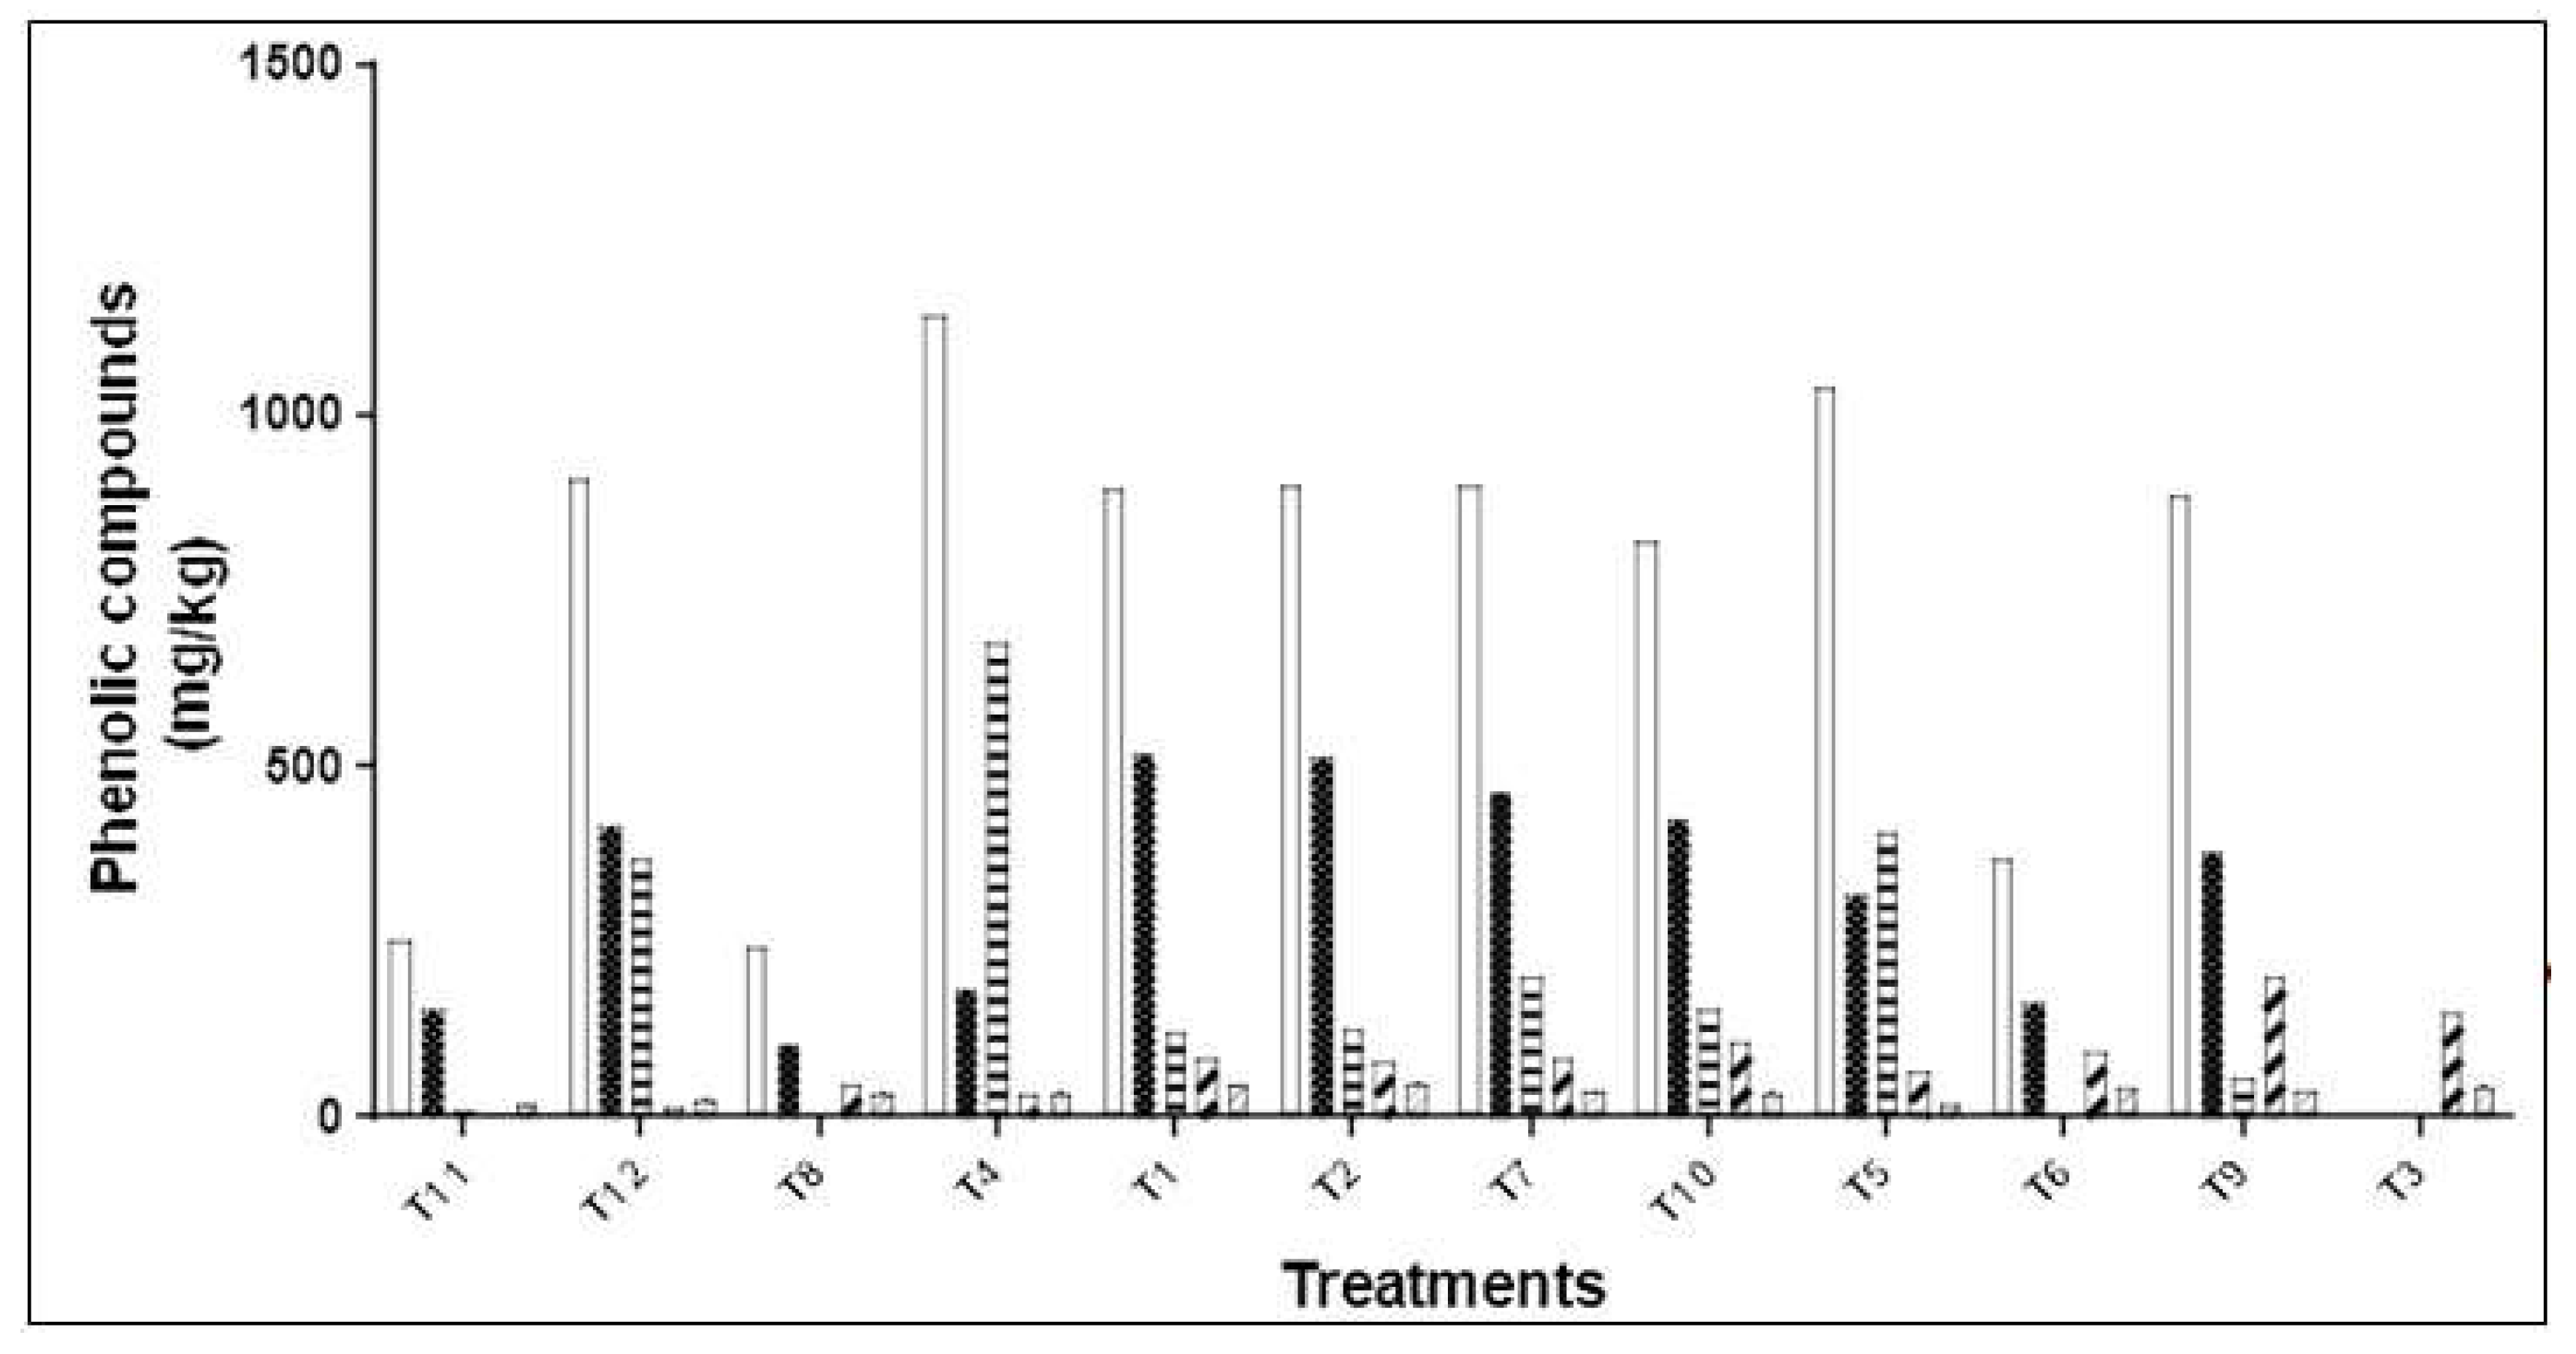
2.2. Quantitative Characterization of Olive Pomace Phenolic Compounds Obtained by PLE

Table 2 shows the quantitation of individual phenolic compounds for each treatment of PLE system. The total phenolic content (PC) of OP-PLE extracts ranged from 241.1 to 1141.3 mg/kg d.w OP. Figure 2 includes the total phenolic compounds and the total content in secoiridoids, phenolic alcohols, flavonoids, and lignans. Secoiridoids reached the major concentration, ranging from 103.4 to 517 mg/kg d.w OP (42.9–57.6%, respectively). The highest amounts of secoiridoids were obtained for secoiridoid derivative (m/z 407), hydroxy oleuropein (m/z 555), and oleuropein (m/z 539). With regard to phenolic alcohols, hydroxytyrosol (m/z 153) and oxidized hydroxytyrosol (m/z 151) were identified and quantified. Their concentrations ranged from 0 to 675.6 mg/kg d.w OP. The highest phenolic alcohol contents were obtained in conditions T4, T5, and T12, where the higher temperature and water content, the higher the phenolic alcohol content. This result could be explained because the high extraction temperature and water content in solvent extraction could generate the hydrolysis of secoiridoids into phenolic alcohols and acidic moieties. These results agree with those reported by [29].
Flavonoids ranged from 3.1 to 199.9 mg/kg d.w OP (1.2–22.6%), luteolin being the flavonoid recovered in major amount in all the treatments. Concerning lignans, different amounts of pinoresinol and acetoxypinoresinol were quantitated in the extracts. Acetoxypinoresinol was the main phenolic, whose concentration ranged from 17.6 to 48.7 mg/kg d.w OP (1.7–6%).
The results showed that although the phenolic compound profile was similar for all treatments of the OP-PLE design, the phenolic compound content was different among runs. This behavior is characteristic of the PLE method, which presents differences in the selectivity of extraction [15]. The extraction factors such as temperature and water-ethanol ratio have been associated with the dielectric constant. Thus, the lower the dielectric constant, the higher the flavonoids content (r2 = 0.7336). However, no correlation was found between the dielectric constant and each phenolic group. It is important to consider that oxidized hydroxytyrosol (m/z 151), hydroxytyrosol (m/z 153), hydroxylated product of decarboxymethyl elenolic acid (m/z 199), hydroxy oleuropein (m/z 555), and luteolin-7-O-rutinoside (m/z 593) were identified in OP-PLE. These phenolic compounds have been reported to form by the oxidation reactions and/or hydrolysis of complex polyphenols [29].

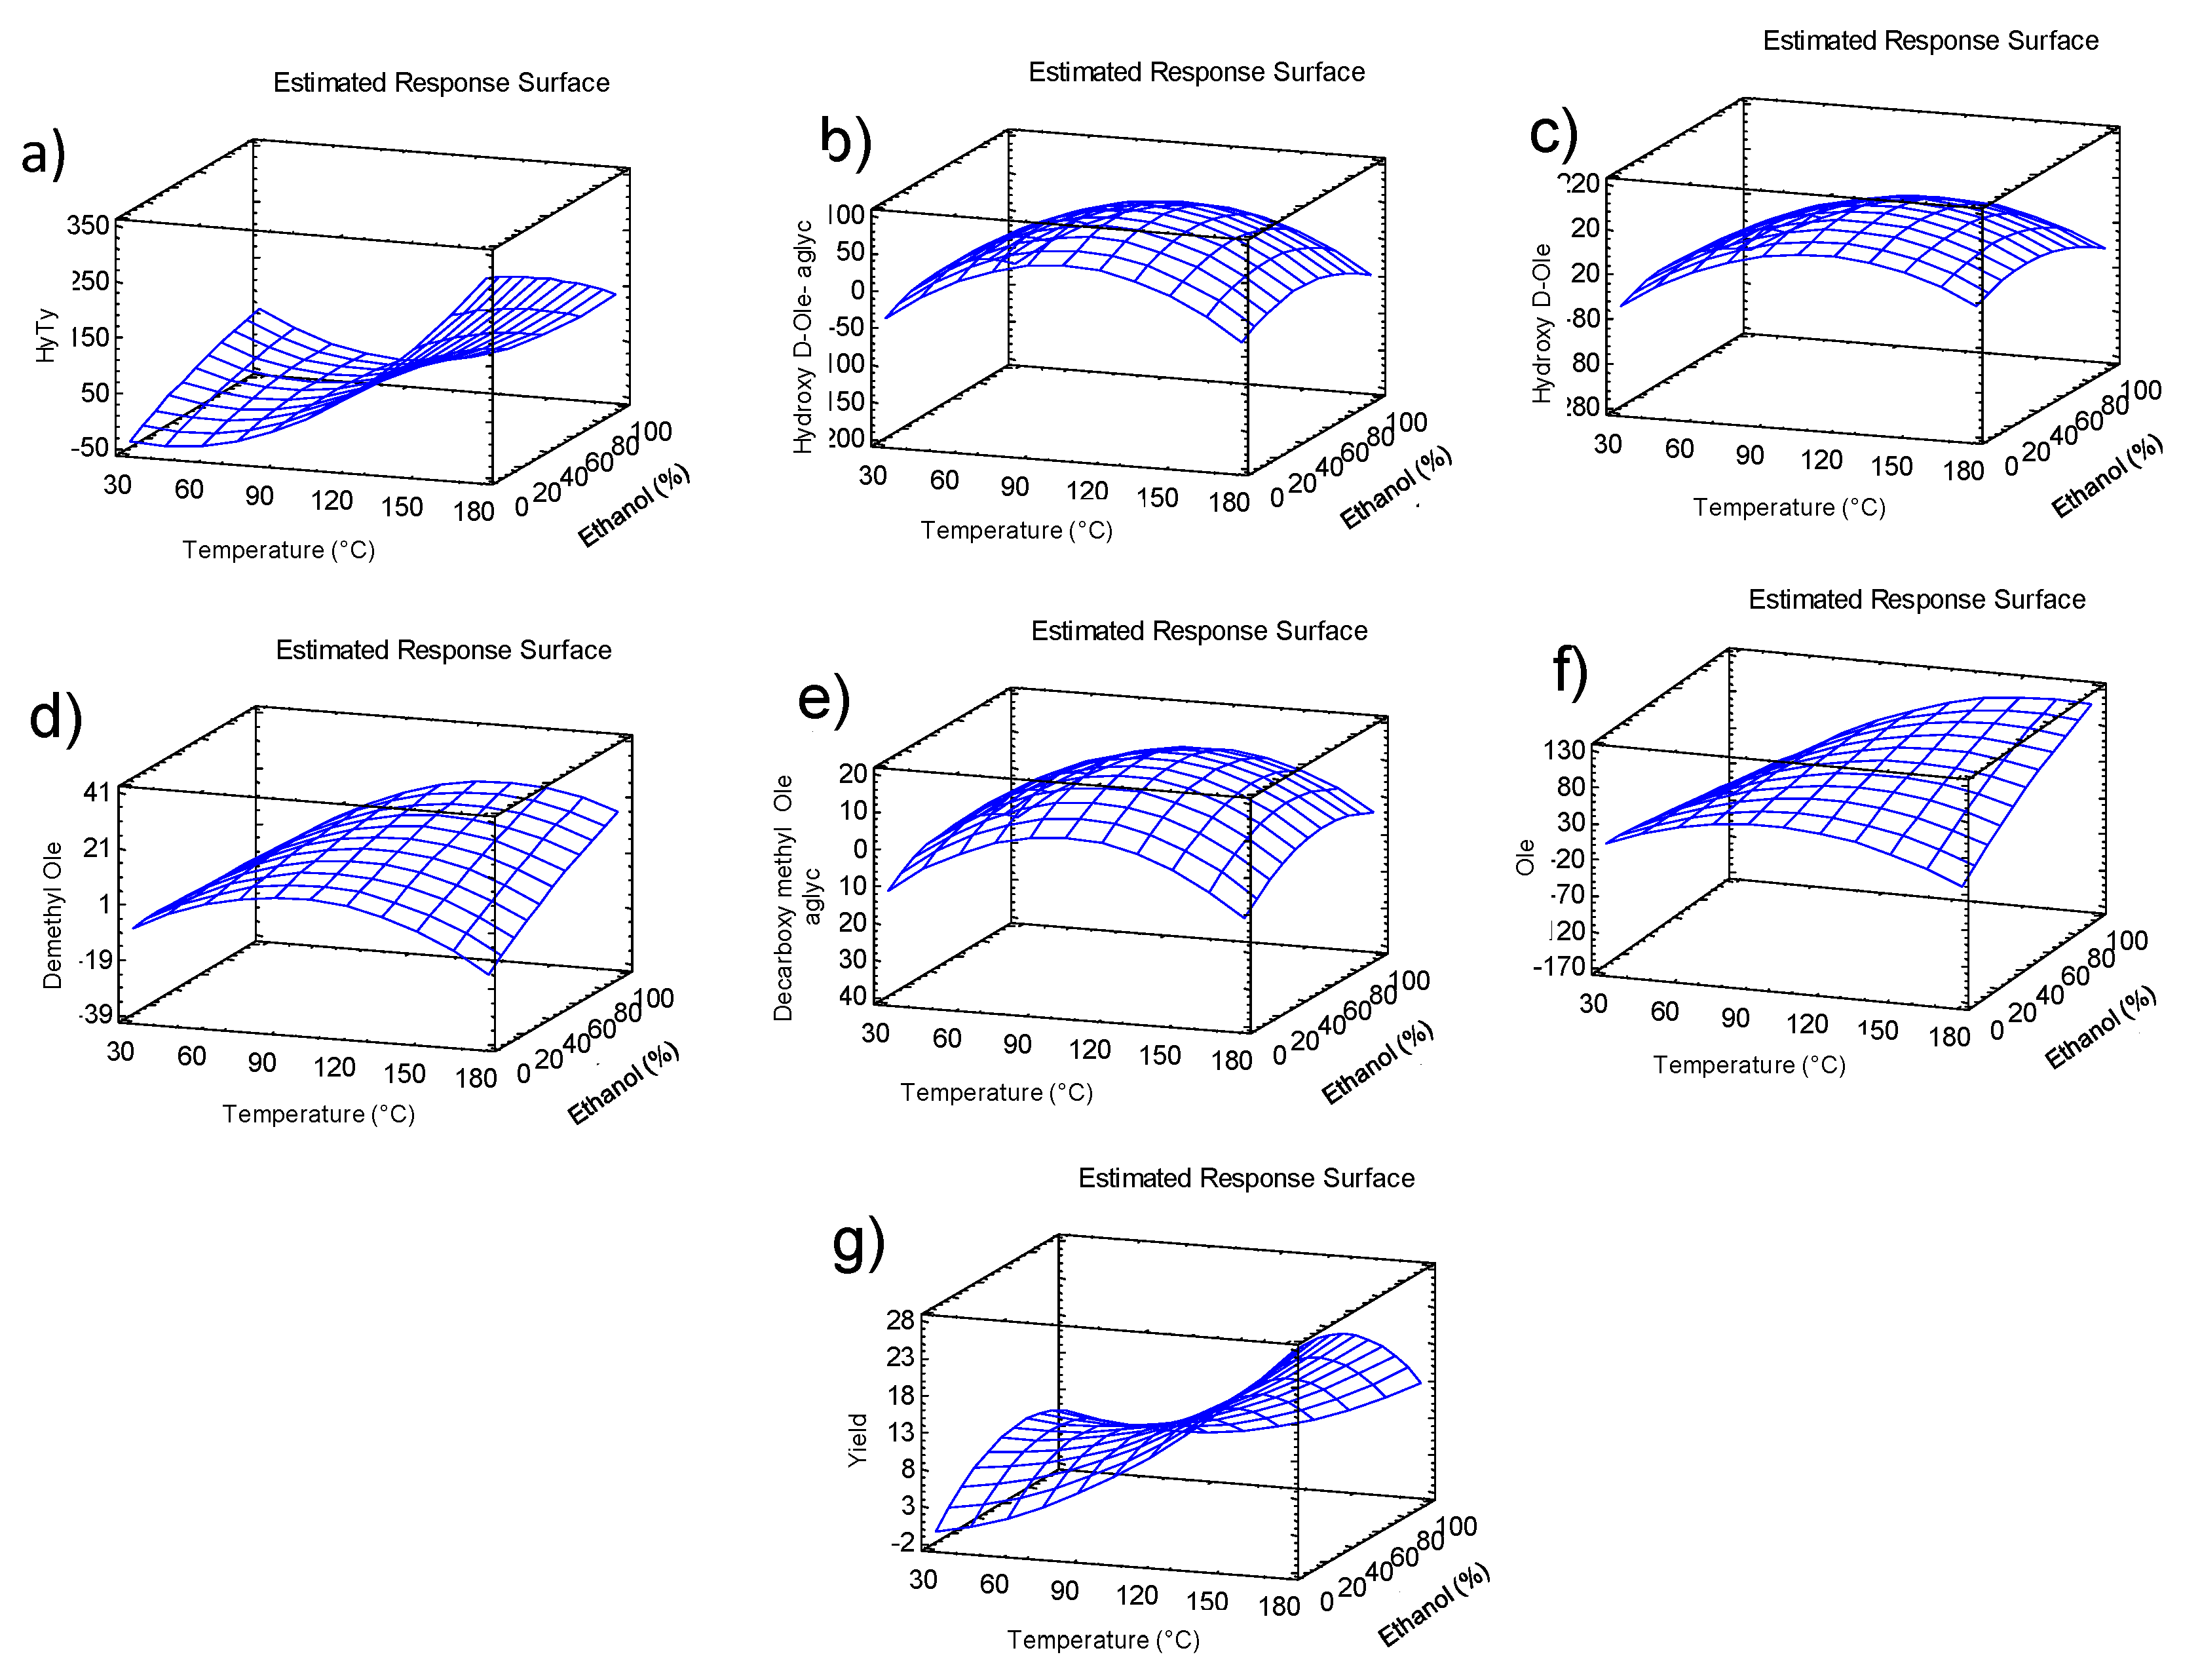
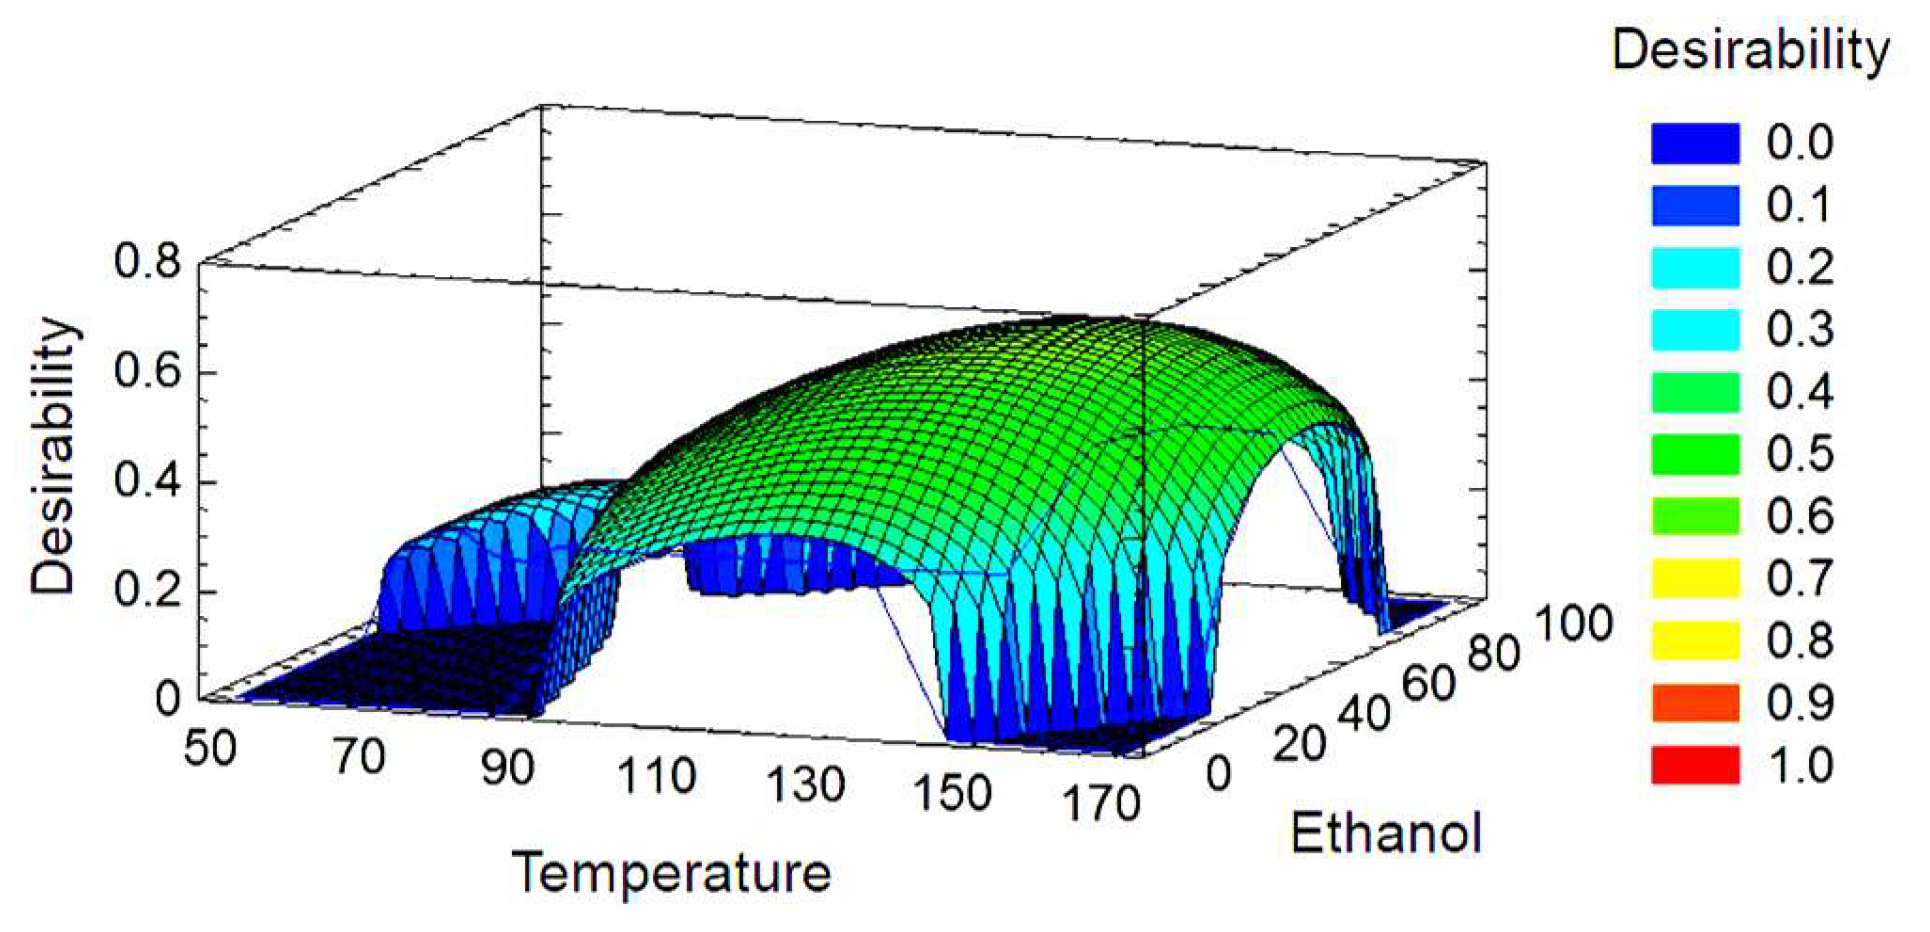
2.3. Optimization of Recovering Phenolic Compounds from Olive Pomace by PLE Using Response Surface Methodology (RSM)

When characterizing the profile of phenolic compounds of the different treatments by PLE, the occurrence of hydroxytyrosol was observed in some extracts of olive pomace. Hydroxytyrosol presents comparative advantages over other polyphenols in olive residues, due to its higher antioxidant capacity and biological effects such as prevention of heart disease, tumor, and antithrombotic effect, among others [18,30]. In addition, the European Food Safety Agency (EFSA) approved health claims associated with consumption of hydroxytyrosol. In this context, the hydroxytyrosol content and its derivatives were used as response variables for the experimental design of olive pomace extracts by PLE.
Table 3 summarizes the experimental conditions (independent variables values: Ethanol content and extraction temperature) and response variables (hydroxytyrosol, hydroxy D-oleuropein aglycone, hydroxy-oleuropein, demethyloleuropein, decarboxymethyl oleuropein aglycone, and oleuropein content and yield). RSM was used to optimize each response variable considering linear, quadratic, and cross-product interactions of the independent variables at the 95% confidence level. The analysis of the variance (ANOVA) for the extraction of phenolic compounds from OP by PLE is shown in Table 4. Non-significant terms were removed from the equation, but when quadratic or cross-product interactions of the independent variables were significant, the linear forms of independent variables were considered in the quadratic equation, because they are fundamental elements of the mathematical model.
The hydroxytyrosol content ranged from 0 to 258.3 mg/kg (Table 3). The linear, quadratic, and cross-product forms of ethanol content (E) and extraction temperature (T) were significant on the hydroxytyrosol content. The model explained 78.8% of the variability in hydroxytyrosol content (R2 adj. d.f., Table 4).
The quadratic regression equation describing the effect of the independent variables on the hydroxytyrosol content was the following (Equation (1)):
H y d r o x y t y r o s o l   =   6.13428 1.65454 × T + 2.0509 × E + 0.0187878 × T 2 + 0.0178529 × T × E 0.00503415 × E 2
As it can be seen in surface graph (Figure 3), the hydroxytyrosol content was higher when high extraction temperature and low ethanol content where applied. The hydroxy D-oleuropein aglycone and hydroxy D-oleuropein ranged from 0 to 95 mg/kg and from 0.4 to 134.6 mg/kg, respectively (Table 3). The effect of temperature and ethanol content quadratic forms were significant on hydroxy D-oleuropein aglycone content, while the quadratic form of temperature was only significant on hydroxy D-oleuropein content. In both response variables, the linear forms of temperature and ethanol content were considered in the quadratic equations. The model explained 75.1% and 64.7% of the variability in hydroxy D-oleuropein aglycone and hydroxy D-oleuropein content, respectively (R2 adj. d.f., Table 4). The quadratic regression equations describing the effect of the independent variables on hydroxy D-oleuropein aglycone (Equation (2)) and hydroxy D-oleuropein (Equation (3)) content are as follows:
Hydroxy   D oleuropein   aglycone = 124.524   +   3.3054 × T   +   1.02943 × E     0.0155844 × T 2   +   0.00110948 ×   T   × E     0.0135149 × T 2
Hydroxy   D oleuropein   =   176.213   +   4.69159 ×   T   +   1.4106 × E     0.0203739 × T   2 +   0.000338833 ×   T   × E     0.0188999 × E 2
The response surface graphs showed that the highest hydroxy D-oleuropein aglycone and hydroxy D-oleuropein content was achieved with intermediate values of temperature and ethanol content (Figure 4).
The demethyl oleuropein concentration ranged from 0 to 21.6 mg/kg (Table 3). The quadratic form of temperature was significant; however, the linear form was considered in the quadratic equations. The linear form of ethanol content and cross-product forms of ethanol as extracting solvent and temperature were significant for demethyl oleuropein content. The model explained 80.6% of the variability (R2 adj. for d.f., Table 4).
The quadratic regression equation of demethyl oleuropein content (Equation (4)) is the following:
Demethyl   oleuropein =   24.3166   +   0.642713 ×   T     0.028972 × E     0.00327204 ×   T 2   +   0.0023143 ×   T   × E     0.000741822 × E 2
As can be seen in the response surface graph (Figure 3), the highest demethyl oleuropein content was achieved with high temperature and high ethanol content.
The decarboxymethyl oleuropein aglycone concentration ranged from 0 to 19.1 mg/kg (Table 3). Only the quadratic form of temperature and ethanol content were significant; however, the linear form and cross-product forms of ethanol as extracting solvent and temperature were considered in the quadratic equations for decarboxymethyl oleuropein aglycone. The model explained 83.6% of the variability (R2 adj. for d.f., Table 4).
The quadratic regression equation of decarboxymethyl oleuropein aglycone content (Equation (5)) is:
Decarboxymethyl   oleuropein   aglycone   =   28.6763   +   0.667961 × T   +   0.272767 × E     0.00318761 ×   T   2 +   0.00059887 × T   × E     0.00299909 × E 2
As can be seen in the response surface graph (Figure 3), the highest decarboxymethyl oleuropein aglycone content was achieved with intermediate values of temperature and ethanol content.
The oleuropein concentration ranged from 3.7 to 113.4 mg/kg (Table 3). The linear, quadratic form of temperature, linear form of ethanol content and cross-product forms of ethanol as extracting solvent and temperature were significant, so were considered in the quadratic equations for oleuropein content. The model explained 88.6% of the variability (R2 adj. for d.f., Table 4).
The quadratic regression equation of oleuropein content is the following (Equation (6)):
Oleuropein   =   47 , 8575   +   1 , 86207 ×   T     0 , 487302 × E     0 , 00932032 ×   T 2   +   0 , 0120913 ×   T   × E     0 , 00409461 × E 2
As can be seen in the response surface graph (Figure 3), the highest oleuropein content was achieved with intermediate temperature and high ethanol content.
According to the information described above, it is observed that the highest hydroxytyrosol content was obtained in the treatments with high extraction temperatures (T4 and T5), while hydroxy-D-oleuropein aglycone, dimethyl oleuropein, and decarboxymethyl-oleuropein aglycone were not detected in these experiments. In contrast, hydroxytyrosol was not detected in the treatments carried out at the lowest temperatures (T6, T8, and T11). These results show that high extraction temperatures would cause rupture of secoiridoides to phenolic alcohols [14].
Regarding oleuropein, the highest value was obtained in the treatment performed at high temperature with high ethanol content (T9).
In relation to yield, this ranged from 3.7 to 25.7% (Table 4). The linear, quadratic, and cross-product forms of ethanol as extracting solvent and temperature were significant for yield (Equation (7)). The model explained 93.6% of the variability (R2 adj. for d.f.) in yield (Table 4).
YIELD [   %   ] =   1 , 57556   +   0 , 00941454   ×   T +   0 , 278964 × E +   0 , 000838349 × T 2     0 , 0013601 × T   × E     0 , 00176315 × E 2
As can be seen in the surface graph (Figure 3), the yield showed the highest values when using high temperature extraction and a minor proportion of ethanol in the extraction solvent (T4 and T5).
Finally, multiple optimization taking into account all response variables was evaluated (Desirability Function). Figure 4 shows the surface response graphic. The optimal conditions for the extraction of phenolic compounds and yield were 136.5 °C and 52.3% of ethanol in the ethanol:water mixture. In the graph of the response surface, the optimum values are located at the yellow zone with 0.7 of desirability.

2.4. Characterization of Olive Pomace Extracts Obtained Under Optimal PLE Conditions (OP-PLE)

Figure 1 shows the HPLC-DAD-ESI-TOF/MS chromatograms and the tentative identification of phenolic compounds in the olive pomace extract obtained by conventional extraction system (OP) and olive pomace extract by optimal PLE (OP-PLE). In both olive pomace extracts, it is possible to identify different phenolic compounds which have previously been reported in olive fruits and olive derivatives [31].
Table 5 shows phenolic compound content of both OP and OP-PLE extracts. The total phenolic compound content in OP-PLE extract was higher than in OP (1659 mg/kg d.w. and 281.7 mg/kg d.w., respectively), showing a total phenolic compound value equivalent to 588.9% with respect to the extract obtained by conventional extraction. This value is much higher than those previously reported (201–256%) [8]. These results can be attributed to the high temperature and pressure of the PLE extraction method, process conditions that improve the interaction capacity between the phenolic compounds and the extraction solvent (ethanol and water mixture). On the other hand, the surface tension and the viscosity of the extraction solvent are reduced by the increase of temperature, which leads to better wetting and penetration in the matrix (olive pomace), thus increasing the mass transfer and therefore the extraction of phenolic compounds [17,19,22,23,27,28].
Higher hydroxytyrosol contents than that of this study were reported in extracts of olive pomace (var. Picual) (2800 mg hydroxytyrosol/kg d.w.) using ethanol–water as solvent and static-dynamic process [7,18]. However, the initial phenolic compounds concentration in a matrix depends on several agronomic (including cultivar, ripening stage, geographic origins, and tree irrigations, among others) and technological factors (like the process temperature and water content) [3,8,32]. Future studies are warranted to compare both techniques using the same matrix.
In OP extract, the main phenolic compound class was secoiridoids, with more than half of the total phenolic content (54.8%): Secoiridoid derivated 1 (16.9%), derived from oleuropein aglycone (8.6%), oleuropein (7.7%), and ligstroside (7.0%). These results are in agreement with other studies, in which the main phenolic compounds are secoiridoids (between 50 and 70%) [8]. Flavonoids are the second chemical group in importance (23%), with luteolin being the main compound of this subclass (17.7%). In contrast, in OP-PLE extract obtained under optimum conditions, the main phenolic compound class is phenolic alcohols with 42.5% (phenolic compound class that were not found in the OP), followed by secoiridoids (26.4%) and flavonoids (16.4%), with luteolin being the main phenolic compound (13.2%). The appearance of phenolic alcohols and the increase of the elenolic acid derivatives in OP-PLE could be related to degradation reactions of secoiridoids, followed by several reactions, such as oxidation, hydration, and loss of the carboxylic and carboxymethyl groups due to the high temperatures used in the extraction method [33,34,35].
On the other hand, the OP-PLE extract obtained under optimal conditions had a processing yield of 17.2%, which is higher to that found in olive extracts obtained with the PLE method.

3. Materials and Methods

3.1. Samples

Olive pomace (Orujo, var. arbequina) waste from a three-phase decanter was provided by Olivos Ruta del Sol Company (33°31’48.0´´S 71°40´ 52.6´´W, Santa Cruz, Bernardo O´Higgins Region, Chile) (May, 2018). Olive pomace (OP) was dried in a freeze-dryer (IlShinBioBase Co. Ltd. Modelo FD5508, Dongduchun City Kyunggi-do, Korea) and stored in bags hermetically sealed at –20 °C in dark conditions until the extract preparation.

3.2. Chemicals

Hexane, ethanol, methanol, and sodium hydroxide were purchased from Panreac (Barcelona, Spain). Acetic acid was acquired from Fluka (Steinheim, Germany). Double-deionized water with conductivity lower than 18.2 MV was obtained with a Milli-Q system (Millipore, Bedford, MA, USA). Standards of hydroxytyrosol, caffeic acid, luteolin, apigenin, quinic acid, and naringenin were purchased from Sigma-Aldrich (St. Louis, MO, USA), and (+)-pinoresinol was acquired from Arbo Nova (Turku, Finland). Oleuropein and luteolin-7-O-glucoside were purchased from Extrasynthese (Lyon, France).

3.3. Conventional Extraction Procedure of Phenolic and Other Polar Compounds from Olive Pomace (OP)

Conventional extraction of phenolic compounds from olive pomace was performed by solid–liquid extraction. Lyophilized olive pomace (5.0 g d.w.) was soaked for 120 min with 20 mL of a mixture of methanol:water (80:20). After this, the samples were centrifuged at 10,000 rpm for 15 min, and the supernatants were collected and filtered through a 0.45 μm filter. Each procedure was carried out in triplicate. The OP extracts were frozen at –20 °C until analysis.

3.4. Extraction of Phenolic Compounds from Olive Pomace by PLE (OP-PLE)

PLE was performed using a Dionex ASE 350 Accelerated Solvent Extractor (Thermo Fisher Scientific, Leicestershire, UK). All extractions were done using 34-mL extraction cells, containing 5 g of lyophilized olive pomace mixed homogeneously with 10 g of sand. Prior to extraction of phenolic compounds, a preliminary clean-step based on the use of n-hexane as the solvent and 1500 psi at room temperature as the experimental conditions was carried out to remove the lipophilic fraction from the olive pomace. After this step, the extraction of phenolic compounds from the olive pomace was performed according to a central composite design, with a total of 12 runs (4 experimental points, 4 axial points, and 4 central points). The ethanol percentage (0 to 100%) and temperature (40 to 176 °C) were evaluated as independent variables to cover a wide range of dielectric constants (from 19 to 65.5 F/m, Table 6). The pressure and extraction time were 1500 psi and 20 min, respectively. All of the experiments were conducted randomly to avoid systematic errors.
The obtained extracts were protected from light, filtered through a 0.45 µm regenerated cellulose filter and evaporated under vacuum in Speed Vac (Thermo Scientific, Leicestershire, UK). Yield (Y), hydroxytyrosol, and hydroxytyrosol-containing compounds were used as response variables for the experimental design of olive pomace extracts by PLE (hydroxityrosol (HYTY), hydroxyoleouropein aglycone, hydroxyoleuropein, demethyl oleuropein, decarboxymethyl oleuropein, and oleouropein).
Response surface methodology (RSM) was applied to determine the optimal conditions for the OP-PLE system by multiple response optimization using the desirability function (DF) where the response variables were maximized. The data were fitted to a second-order regression model according to Equation (8).
Y = b 0 + i = 1 2 b i X i + i = 1 2 b i i X i 2 + i = 1 1 j = i + 1 2 b i j X i X j
where Y is the response; subscripts i and j range from 1 to the number of variables (n = 2); b 0 is the intercept term; b i values are the linear coefficients; b i j values are the quadratic coefficients; and X i and X j are the levels of independent variables.

3.5. High-Performance Liquid Chromatography Coupled to Diode Array Detection and Electrospray Time-of-Flight Mass Spectrometry (HPLC-DAD-ESI-TOF/MS)

The HPLC analyses were performed in a high-performance resolution liquid chromatography (HPLC) system (Agilent Technologies, Waldbronn, Germany) equipped with a vacuum degasser, autosampler, a binary pump, and diode-array-detector (DAD). This equipment was coupled to a time-of-flight mass spectrometry (TOF-MS) microTOF (Bruker Daltonik, Bremen, Germany). The TOF mass spectrometer was equipped with a model G1607A ESI interface (Agilent Technologies, Palo Alto, CA, USA) operating in negative ion mode. The analytical column used was a 150 mm × 4.6 mm internal diameter, 1.8-µm Zorbax Eclipse Plus C18 (Agilent Technologies, Palo Alto, CA, USA).
The flow rate was 0.5 mL/min, and the temperature of the column was maintained at 25 °C. The mobile phase was water with 0.25% acetic acid (Solvent A) and methanol (Solvent B) eluted according to the following multistep gradient: 0 min, 5% Solvent B; 7 min, 35% Solvent B; 13 min, 45% Solvent B; 18.5 min, 50% Solvent B; 22 min, 60% Solvent B; 29 min, 95% Solvent B; 36 min, 5% Solvent B; and the injection volume was 10 µL.
The compounds separated were monitored with DAD (240 and 280 nm) and MS. At this stage, the use of a splitter was required for the coupling with the MS detector, as the flow arriving to the TOF detector had to be 0.25 mL/min in order to ensure reproducible results and a stable spray. External mass spectrometer calibration was performed with sodium acetate clusters (5 mM sodium hydroxide in water/2-propanol 1/1 (v/v), with 0.2% of acetic acid) in high-precision calibration (HPC) regression mode.
The phenolic compound quantification was performed with calibration curves elaborated with commercial standards: Hydroxytyrosol was used to quantify hydroxytyrosol and oxidized hydroxytyrosol; tyrosol was used to quantify tyrosol and ligstroside; caffeic acid was used to quantify verbascoside; oleuropein was used to quantify oleuropein, its isomers and derivatives, oleosides and elenolic acid derivatives, and secoiridoids; pinoresinol was used to quantify pinoresinol and acetoxypinoresinol; luteolin was used to quantify luteolin; and luteolin 7-glucoside was used to quantify luteolin 7-glucoside and luteolin 7-rutinoside. All phenolic compound standard solutions were prepared at a concentration of 1000 mg/L by dissolving the appropriate amount of the compound in methanol and then serially diluting to working concentrations (0.5 to 50 mg/L). Naringenin was added at 25 µg/mL and used as internal standard.

3.6. Statistical Analysis

Linear regression (95% confidence limit) was used to determine the correlation between dielectric constant and each phenolic compound class for the design from olive pomace extracts by PLE. A one-way analysis of variance (ANOVA) and Duncan’s multiple range test were performed to test for differences in phenolic compound content between olive pomace extracts by pressurized liquid extraction in optimal conditions (OP-PLE) and olive pomace extract by conventional extraction (OP). The statistical analyses were performed using Statgraphics Centurion XV (StatPoint Inc., Warrenton, VA, USA, 2011).

4. Conclusions

The extraction design of phenolic compounds from olive pomace by PLE demonstrates the great variability of extracts that can be obtained by changing the extraction conditions, presenting differences in the selectivity of extraction. The olive pomace extract obtained under optimized conditions showed a higher concentration in phenolics than that obtained by conventional extraction, besides presenting hydroxytyrosol, a compound which was not found in the extraction by maceration. The olive pomace extract obtained under optimized PLE conditions can be used in the design of bioactive food ingredients, as well as nutraceuticals.

Author Contributions

Conceptualization, J.L.-S. and I.B.-L.; funding acquisition, A.S.-C. and J.L-S; investigation, I.C.P.; methodology, I.C.P., J.L.-S., and I.B.L..; project administration, A.S.-C. and P.R.; supervision, J.L.-S., P.R., and H.N.; writing—original draft, I.C.P.; writing—review and editing, J.L.-S. and I.B.L.

Funding

This work was funded by projects AGL2015-67995-C3-2-R, RTI2018-096724-B-C22, and IJCI-2015-26789 (Spanish Ministry of Science and Innovation), and P11-CTS-7625 and B-AGR-466-UGR18 (Andalusian Regional Government Council of Innovation and Science).

Conflicts of Interest

The authors declare no conflicts of interest.

References

  1. Fernández-Bolaños, J.; Rodríguez, G.; Rodríguez, R.; Guillén, R.; Jiménez, A. Potential use off olive by—products. Grasas y aceites 2006, 57, 95–106. [Google Scholar]
  2. Kapellakis, I.E.; Tsagarakis, K.P.; Crowther, J.C. Olive oil history, production and by-product management. Rev. Environ. Sci. Biotechnol. 2008, 7, 1–26. [Google Scholar] [CrossRef]
  3. Frankel, E.; Bakhouche, A.; Lozano-Sánchez, J.; Segura-Carretero, A.; Fernández-Gutierrez, A. Literature review on production process to obtain extra virgin olive oil enriched in bioactive compounds. Potential use of bioproducts as alternative sources of polyphenols. J. Agric. Food Chem. 2013, 61, 5179–5188. [Google Scholar] [CrossRef] [PubMed]
  4. Skaltsounis, A.L.; Argyropoulou, A.; Aligiannis, N.; Xynos, N. Chapter 11: Recovery of High Added Value Compounds from Olive Tree Products and Olive Processing Byproducts. In Olive and Olive Oil Bioactive Constituents, 1st ed.; Boskou, D., Ed.; Academic Press: Urbana, Illinois, USA, 2015; pp. 333–356. [Google Scholar]
  5. Cicerale, S.; Lucas, L.; Keast, R. Biological Activities of Phenolic Compounds Present in Virgin Olive Oil. Int. J. Mol. Sci. 2010, 11, 458–479. [Google Scholar] [CrossRef] [PubMed] [Green Version]
  6. Servili, M.; Sordini, B.; Esposto, S.; Urbani, S.; Veneziani, G.; Di Maio, I.; Selvaggini, R.; Taticchi, A. Biological Activities of Phenolic Compounds of Extra Virgin Olive Oil. Antioxidants 2017, 3, 1–23. [Google Scholar] [CrossRef] [PubMed]
  7. Mulinacci, N.; Innocenti, M.; La Marca, G.; Mercalli, E.; Giaccherini, C.; Romani, A.; Saracini, E.; Vincieri, F. Solid Olive Residues: Insight into Their Phenolic Composition. J. Agric. Food Chem. 2005, 53, 8963–8969. [Google Scholar] [CrossRef] [PubMed]
  8. Cioffi, G.; Pesca, M.S.; De Caprariis, P.; Braca, A. Phenolic compounds in olive oil and olive pomace from Cilento (Campania, Italy) and their antioxidant activity. Food Chem. 2010, 121, 105–111. [Google Scholar] [CrossRef]
  9. Cádiz-Gurrea, M.L.; Lozano-Sánchez, J.; Fernández-Ochoa, A.; Segura-Carretero, A. Enhancing the Yield of Bioactive Compounds from Sclerocarya birrea Bark by Green Extraction Approaches. Molecules 2019, 24, 966. [Google Scholar] [CrossRef]
  10. Ryan, D.; Lawrence, H.; Prenzler, P.; Antolovich, M.; Robards, K. Recovery of phenolic compounds from Olea europaea. Analy. Chimica Acta 2001, 445, 67–77. [Google Scholar] [CrossRef]
  11. McDonald, S.; Prenzler, P.; Antolovich, M.; Robards, K. Phenolic content and actioxidant activity of olive extracts. Food Chem. 2001, 73, 73–84. [Google Scholar] [CrossRef]
  12. Kalogerakis, N.; Politi, M.; Foteinis, S.; Chatzisymeon, E.; Mantzavinos, D. Recovery of antioxidants from olive mill wastewaters: A viable solution that promotes their overall sustainable management. J. environ. manage. 2013, 128, 749–758. [Google Scholar] [CrossRef] [Green Version]
  13. Uribe, E.; Lemus-Mondaca, R.; Vega-Gálvez, A.; Zamorano, M.; Quispe-Fuentes, I.; Pasten, A.; Di Scala, K. Influence of process temperature on drying kinetics, physicochemical properties and antioxidant capacity of the olive-waste cake. Food Chem. 2014, 147, 170–176. [Google Scholar] [CrossRef]
  14. Rubio-Senent, F.; Rodríguez-Gutierrez, G.; Lama-Muñoz, A.; Fernández-Bolaños, J. New phenolic compounds hydrothermally extracted from the olive oil byproduct alperujo and their antioxidative activities. J. Agric. Food Chem. 2012, 60, 1175–1186. [Google Scholar] [CrossRef]
  15. Rubio-Senent, F.; Lama-Muñoz, A.; Rodríguez-Gutierrez, G.; Fernández-Bolañoz, J. Isolation and Identification of Phenolic Glucosides from Thermally Treated Olive Oil Byproducts. J. Agric. Food Chem. 2013, 61, 1235–1248. [Google Scholar] [CrossRef]
  16. Papaioannou, E.H.; Patsios, S.I.; Karabelas, A.J.; Philippopoulos, N.A. Characterization of condensates from an indirect olive oil pomace drying process: The effect of drying temperatura. J. Environ. Chem. Eng. 2013, 1, 831–837. [Google Scholar] [CrossRef]
  17. Aliakbarian, B.; Casazza, A.; Perego, P. Valorization of olive oil solid waste using high pressure–high temperature reactor. Food Chem. 2011, 128, 704–710. [Google Scholar] [CrossRef]
  18. Japón-Luján, R.; de Castro, M.L. Static-Dynamic superheated liquid extraction of hydrotyrosol and other biophenols from alperujo (a semisolid residue of the olive oil industry). Agric. Food Chem. 2007, 55, 3629–3634. [Google Scholar] [CrossRef]
  19. Pérez-Serradilla, J.A.; Japón Luján, R.; de Castro, M.D.L. Static-dynamic sequential superheated liquid extraction of phenols and fatty acids from alperujo. Analy. Bioanaly. Chem. 2008, 392, 1241–1248. [Google Scholar] [CrossRef]
  20. Lozano-Sánchez, J.; Castro-Puyana, M.; Mendiola, J.; Segura-Carretero, A.; Cifuentes, A.; Ibáñez, E. Recovering Bioactive Compounds from Olive Oil Filter Cake by Advanced Extraction Techniques. Int. J. Mol. Sci. 2014, 15, 6270–16283. [Google Scholar] [CrossRef]
  21. Mustafa, A.; Turner, C. Pressurized liquid extraction as a green approach in food and herbal plants extraction: A review. Analyt. Chim. Acta. 2011, 703, 8–18. [Google Scholar] [CrossRef]
  22. Chanioti, S.; Tzia, C. Extraction of phenolic compounds from olive pomace by using natural deep eutectic solvents and innovative extraction techniques. Innovative Food Sci. Emerg. Techn. 2018, 48, 228–239. [Google Scholar] [CrossRef]
  23. Morsi, M.; Malal, S.; Alabdulla, O. Antioxidative Activity of Olive Pomace Polyphenols Obtained by Ultrasound Assisted Extraction. J. Environ. Sci. Toxicol. Food Technol. 2016, 10, 95–100. [Google Scholar]
  24. Agalias, A.; Magiatis, P.; Skaltsounis, A.L.; Mikros, E.; Tsarbopoulos, A.; Gikas, E.; Spanos, I.; Manios, T. A New Process for the Management of Olive Oil Mill Waste Water and Recovery of Natural Antioxidants. J. Agric. Food Chem. 2007, 55, 2671–2676. [Google Scholar] [CrossRef]
  25. He, J.; Alister-Briggs, M.; de Lister, T.; Jones, G. Stability and antioxidant potential of purified olive mil wastewater extracts. Food Chem. 2012, 131, 1312–1321. [Google Scholar] [CrossRef]
  26. Cardinali, A.; Pati, S.; Mirenvini, F.; D’Antuono, I.; Linsalata, V.; Lattanzio, V. Verbascoside, Isoverbascoside, and Their Derivatives Recovered from Olive Mill Wastewater as Possible Food Antioxidants. J. Agric. Food Chem. 2012, 60, 1822–1829. [Google Scholar] [CrossRef]
  27. Peralbo-Molina, A.; Priego-Capote, F.; Luque de Castro, M.D. Tentative Identification of Phenolic Compounds in live Pomace Extracts Using Liquid Chromatography−Tandem Mass Spectrometry with a Quadrupole−Quadrupole-Time-of-Flight Mass Detector. J. Agric. Food Chem. 2012, 60, 11542–11550. [Google Scholar] [CrossRef]
  28. Lozano-Sánchez, J.; Cea, I.; González-Cáceres, E.; Núñez, H.; Robert, P.; Segura-Carretero, A. Chapter 9: Extraction, Isolation and Utilisation of Bioactive Compounds from Waste Generated by the Olive Oil Industry. In Utilisation of Bioactive Compounds from Agricultural and Food Waste, 1st ed.; Vuong, Q.V., Ed.; CRC Press LLC.: Boca Ratón, Florida, USA, 2017; pp. 230–251. [Google Scholar]
  29. Obied, H.; Prenzler, P.; Ryan, D.; Servili, M.; Taticchi, A.; Esposto, S.; Robards, K. Biosynthesis and biotransformations of phenol-conjugated oleosidic secoiridoids from Olea europaea L. Nat. Prod. Rep. 2008, 25, 1167–1179. [Google Scholar] [CrossRef]
  30. Bouallagui, Z.; Bouaziz, M.; Lassoued, S.; Engasser, J.M.; Ghoul, M.; Sayadi, S. Hydroxytyrosol Acyl Esters: Biosynthesis and Activities. Appl. Biochem. Biotechnol. 2011, 163, 592–599. [Google Scholar] [CrossRef]
  31. Tripoli, E.; Giammanco, M.; Tabacchi, G.; Di Majo, D.; Giammanco, S.; La Guardia, M. The phenolic compounds of olive oil: structure, biological activity and beneficial effects on human health. Nutri. Res. Review 2005, 18, 98–112. [Google Scholar] [CrossRef]
  32. Servili, M.; Esposto, S.; Taticchi, A.; Urbani, S.; Di Maio, I.; Veneziani, G.; Selvaggini, R. New approaches to virgin olive oil quality, technology, and by-products valorization. Eur. J. Lipid Sci. Technol. 2015, 117, 1882–1892. [Google Scholar] [CrossRef]
  33. Lozano-S_anchez, J.; Giambanelli, E.; Quirantes-Piné, R.; Cerretani, L.; Bendini, A.; Antonio Segura-Carretero, A.; Fernández-Gutiérrez, A. Wastes Generated during the Storage of Extra Virgin Olive Oil as a Natural Source of Phenolic Compounds. J. Agric. Food Chem. 2011, 59, 11491–11500. [Google Scholar] [CrossRef] [PubMed]
  34. Cermola, F.; DellaGreca, N.; Iesce, M.R.; Montella, S.; Pollio, A.; Temussi, F. A mild photochemical approach to the degradation of phenols from olive oil mill wastewater. Chemosphere 2004, 55, 1035–1041. [Google Scholar] [CrossRef] [PubMed]
  35. Antolovich, M.; Bedgood, D.R.; Bishop, A.G.; Jardine, D.; Prenzler, P.D.; Robards, K. LC-MS investigation of oxidation products of phenolic antioxidants. J. Agric. Food Chem. 2004, 52, 962–971. [Google Scholar] [CrossRef] [PubMed]
Sample Availability: Not available.
Figure 1. HPLC-DAD-ESI-TOF/MS chromatograms of olive pomace extracts. (a) Olive pomace extracts obtained by conventional extraction (OP), and (b) olive pomace extracts obtained by pressurized liquid extraction in optimal conditions (OP-PLE). Internal standard (Naringenin).
Molecules 24 03108 g001
Figure 2. Phenolic compound content by groups, experimental design by olive pomace extracts obtained under different PLE extraction conditions. Molecules 24 03108 i001 Total phenolic compounds; Molecules 24 03108 i002 Phenolic alcohols; Molecules 24 03108 i003 Secoiridoids; Molecules 24 03108 i004 Flavonoids; and Molecules 24 03108 i005 Lignans.
Molecules 24 03108 g002
Figure 3. Response Surface graphs for (a) hydroxytyrosol, (b) hydroxy D-oleuropein aglycone, (c) hydroxy-oleuropein, (d) demethyl oleuropein, (e) decarboxymethyl oleuropein aglycone, (f) oleuropein content, and (g) yield.
Molecules 24 03108 g003
Figure 4. Desirability function overlay surfaces plots of olive pomace extracts by pressurized liquid extraction.
Molecules 24 03108 g004
Table 1. Tentative identification of phenolic compounds and their derivatives in olive pomace by HPLC-DAD-ESI-TOF/MS.
PeakTentative IdentificationMolecular FormulaRt (min)m/z
1Quinic acidC7H12O63.3191.0561
2Oxidized hydroxytyrosolC8H8O36.0151.0401
3Unknown 1C16H26O118.3393.1428
4Vanillic acidC8H8O410.2167.0350
5Oleoside/secologanoside or isomer 1C16H22O1110.5389.1114
6Loganic acidC16H24O1010.7375.1318
7Unknown 2C15H26O910.8349.1526
8HydroxytyrosolC8H10O311.0153.0557
9Secoiridoid derivedC17H28O1111.2407.1604
10Decarboxylated form of hydroxyl elenolic acidC10H14O511.9213.0768
11Hydroxylated product of decarboxymethyl elenolic acidC9H12O512.1199.0618
12Unknown 3C8H8O313.5151.0401
13Oleoside/secologanoside or isomer 2C16H22O1114.1389.1089
14Unknown 4C9H12O414.3183.0663
15Unknown 5C16H26O1016.3377.1493
16Hydroxy oleuropeinC25H32O1417.0555.1719
17Demethyl oleuropeinC24H30O1317.5525.1614
18Aldehydic form of decarboxymethyl elenolic acidC10H16O518.2215.0925
19Luteolin-7-O-rutinosideC27H30O1519.5593.1510
20Unknown 6C36H42O1419.6685.2469
21Luteolin-7-glucosideC21H20O1120.1447.0933
22Unknown 7C38H26O821.1609.1555
23Unknown 8C38H26O621.9577.1657
24OleuropeinC25H32O1322.9539.1770
25Luteolin-7-glucoside or isomerC21H20O1120.1447.0933
26PinoresinolC20H22O624.0357.1344
27AcetoxypinoresinolC22H24O824.5415.1390
28Unknown 9C31H36O1125.3583.2123
29Unknown 10C31H36O1225.6583.2123
30LigstrosideC25H32O1226.3523.1821
31Naringenin (Internal standard)C15H12O528.9271.0893
32LuteolinC15H10O630.1285.0405
33ApigeninC15H10O531.7269.0451
Table 2. Phenolic compound content in experimental design by olive pomace extracts obtained under different PLE extraction conditions.
Tentative IdentificationT1T2T3T4T5T6T7T8T9T10T11T12
108 °C 50% EtOH108 °C 50% EtOH108 °C 100% EtOH164 °C 10% EtOH176 °C 50% EtOH51 °C 90% EtOH108 °C 50% EtOH40 °C 50% EtOH164 °C 90% EtOH108 °C 50% EtOH51 °C 10% EtOH108 °C 0% EtOH
(mg/kg d.w.)
Quinic acid127.5 ± 6.9137.2 ± 3.4145.8 ± 0.9217.8 ± 11.5231.6 ± 1.371.4 ± 1.1118.7 ± 0.956.3 ± 1.4215.5 ± 10.9107.3 ± 0.068.4 ± 0.889.2 ± 2.8
Oxidized hydroxytyrosol94 ± 9100 ± 7-458 ± 27148.4 ± 0.5-176 ± 4--131.3 ± 0.010.3 ± 0.7363 ± 12
Oleoside/secologanoside or isomer 161 ± 160 ± 244.5 ± 0.612.6 ± 0.432.1 ± 0.528.6 ± 0.961.7 ± 0.810.2 ± 0.177.9 ± 0.649.1 ± 0.032 ± 144 ± 2
Loganic acid--8.3 ± 0.39.0 ± 0.46.9 ± 0.211.1 ± 0.2-8.4 ± 0.26 ± 1-12.8 ± 0.48.6 ± 0.6
Hydroxytyrosol28 ± 224 ± 151 ± 2218 ± 1258 ± 5-23 ± 1-55 ± 322.4 ± 0.0-6.9 ± 0.0
Secoiridoid derived98.9 ± 0.595 ± 167 ± 1119 ± 3143 ± 474.2 ± 0.3100 ± 262.0 ± 0.284 ± 397 ± 483.3 ± 0.273 ± 2
D-OH-EA2.9 ± 0.22.6 ± 0.11.7 ± 0.0--6.8 ± 0.52.7 ± 0.2--0.6 ± 0.01.7 ± 0.2-
Hydroxy D-oleuropein aglycone70 ± 170 ± 212.1 ± 0.2--3.8 ± 0.173 ± 21.1 ± 0.09.9 ± 0.561 ± 23.3 ± 0.466 ± 3
Hydroxy oleuropein123 ± 2125 ± 422.3 ± 0.725.5 ± 0.962 ± 32.3 ± 0.3105 ± 20.4 ± 0.033.6 ± 0.3101.6 ± 0.16.6 ± 0.5133 ± 1
Demethyl oleuropein19.7 ± 0.619.5 ± 0.821.6 ± 0.9---15.3 ± 0.5-20.9 ± 0.510.9 ± 0.1-5.0 ± 0.5
Aldehydic form of decarboxymethyl elenolic acid9.4 ± 0.79.5 ± 0.83.2 ± 0.2----5.1 ± 0.1-7.6 ± 0.08.8 ± 0.13.0 ± 0.1
Luteolin-7-glucoside19.2 ± 0.610.0 ± 0.921.0 ± 0.3--2.6 ± 0.38.3 ± 0.3-35 ± 137.5 ± 0.0--
Decarboxymethyl oleuropein aglycon19.1 ± 0.818.1 ± 0.710 ± 1--0.5 ± 0.013.9 ± 0.6-4.9 ± 0.112 ± 3-4.8 ± 0.3
Oleuropein80.0 ± 0.381 ± 579 ± 115 ± 163.2 ± 0.915.2 ± 0.367.5 ± 0.76.0 ± 0.3113 ± 360.0 ± 0.33.7 ± 0.256 ± 2
Pinoresinol11.4 ± 0.510.9 ± 0.310.7 ± 0.83.7 ± 0.3-7.8 ± 0.28.3 ± 0.44.6 ± 0.010.9 ± 0.06.9 ± 0.0-1.4 ± 0.0
Acetoxypinoresinol33.6 ± 0.537.8 ± 0.830.1 ± 0.528.9 ± 0.217.6 ± 0.233.7 ± 0.828.0 ± 0.429.3 ± 0.427.5 ± 0.325 ± 117.8 ± 0.423 ± 1
Ligstroside32 ± 131 ± 129.4 ± 0.5-8.5 ± 0.419.8 ± 0.424.4 ± 0.110.2 ± 0.324.0 ± 0.422.1 ± 0.3-19.4 ± 0.5
Luteolin66 ± 168 ± 2127.5 ± 0.834 ± 167.4 ± 0.771 ± 174.0 ± 0.541.0 ± 0.6158 ± 167.9 ± 0.03.1 ± 0.012.7 ± 0.1
Apigenin-----17.4 ± 0.2-6.5 ± 0.26.9 ± 0.30.5 ± 0.0--
Secoiridoids (mg/kg)517 ± 1511 ± 10299 ± 2182 ± 5315.7 ± 0.5162 ± 3463.1 ± 0.4103 ± 1375 ± 3422.5 ± 0.1153 ± 1413 ± 6
(%) 57.6 ± 0.256.8 ± 0.943.7 ± 0.415.9 ± 0.430.4 ± 0.044.3 ± 0.751.5 ± 0.042.9 ± 0.542.4 ± 0.451.4 ± 0.060.5 ± 0.545.4 ± 0.7
Phenolic alcohols (mg/kg)122 ± 4124 ± 151.1 ± 0.5676 ± 11407 ± 7-199 ± 2-55 ± 3153.7 ± 0.010.3 ± 0.8370 ± 3
(%) 13.6 ± 0.513.8 ± 0.67.5 ± 0.159 ± 139.1 ± 0.6-22.2 ± 0.2-6.3 ± 0.418.7 ± 0.04.1 ± 0.340.7 ± 0.3
Flavonoids (mg/kg)85.7 ± 0.578 ± 2148 ± 234 ± 167.4 ± 0.791.3 ± 0.182.3 ± 0.947.5 ± 0.3199.9 ± 0.0105.9 ± 0.03.1 ± 0.012.7 ± 0.1
(%) 9.6 ± 0.18.7 ± 0.121.7 ± 0.33.0 ± 0.16.5 ± 0.124.9 ± 0.09.1 ± 0.119.7 ± 0.122.6 ± 0.012.9 ± 0.01.2 ± 0.01.4 ± 0.0
Lignans (mg/kg)45 ± 249 ± 141 ± 133 ± 217.6 ± 0.241.5 ± 0.936.3 ± 0.833.9 ± 0.438.4 ± 0.132 ± 117.8 ± 0.325 ± 1
(%) 5.0 ± 0.25.4 ± 0.16.0 ± 0.22.9 ± 0.21.7 ± 0.011.3 ± 0.24.0 ± 0.114.1 ± 0.24.3 ± 0.03.9 ± 0.27.1 ± 0.12.7 ± 0.1
Total phenolic compounds (mg/kg)897 ± 3890 ± 12685 ± 91141 ± 101039 ± 11366 ± 2900 ± 18241 ± 7885 ± 9821.0 ± 0.1252 ± 3910 ± 2
(%) 100100100100100100100100100100100100
EtOH: Ethanol; d.w.: Dry weight.
Table 3. Phenolic compound content and yield of experimental design.
TreatmentsHyTyHydroxy D-Ole aglyc Hydroxy-
Ole
Demethyl OleDecarboxy methyl Ole aglycOleuropein Yield
Temperature (°C)Ethanol (%)(mg/kg d.w.)(%)
T1108(0)50(0)28 ± 270 ± 1123 ± 219.7 ± 0.6 19.1 ± 0.880.0 ± 0.310.2
T2108(0)50(0)24 ± 170 ± 2124 ± 419.5 ± 0.818.1 ± 0.781 ± 513.3
T3108(0)100(α)51 ± 212.1 ± 0.222.3 ± 0.721.6 ± 0.910 ± 179 ± 15.5
T4164(1)10(-1)218 ± 11-25.5 ± 0.9--15 ± 121.7
T5176(α)50(0)258 ± 5-62 ± 3--63.2 ± 0.925.7
T651(-1)90(1)-3.8 ± 0.12.3 ± 0.3-0.5 ± 0.015.2 ± 0.33.7
T7108(0)50(0)23 ± 173 ± 2105 ± 215.3 ± 0.513.9 ± 0.667.5 ± 0.710.7
T839(-α)50(0)-1.1 ± 0.00.4 ± 0.0--6.0 ± 0.35.9
T9164(1)90(1)55 ± 39.9 ± 0.533.6 ± 0.320.9 ± 0.54.9 ± 0.1113 ± 311.8
T10108(0)50(0)22.4 ± 0.061 ± 2101.6 ± 0.110.9 ± 0.112 ± 360.0 ± 0.311.0
T1151(-1)10(-1)-3.3 ± 0.46.6 ± 0.5--3.7 ± 0.26.1
T12108(0)0(-α)6.9 ± 0.066 ± 3 133 ± 15.0 ± 0.54.8 ± 0.356 ± 29.5
T: Treatments; d.w.: Dry weight; HyTy: Hydroxytyrosol; Hydroxy D-Oleuropein aglycone: Hydroxy D-oleuropein aglycone; Hydroxy-Ole: Hydroxy-oleuropein; Demethylole: Demethyloleuropein; decaboxymethyl Ole aglyc: Decarboxymethyl oleuropein aglycone.
Table 4. Analysis of variance (ANOVA) for the olive pomace extracts obtained by PLE.
SourceSum of Squaresd.f.Mean SquareF-Ratiop-ValueR2R2 adj. d.f.
Hydroxytyrosol
A: Temperature42324.8142324.842324.850.0000∗88.47378.8671
B: Ethanol1623.5611623.561623.560.0000∗
AA14278.4114278.414278.420.0000∗
AB6511.9116511.916511.910.0000∗
BB409.4111409.411409.410.0000∗
Lack-of-fit9738.6333246.213246.210.0000*
Pure error94.9681331.656
Total (corr.)82912.111
Hydroxy D-oleuropein aglycone
A: Temperature118.6181118.6180.360.570486.443175.1457
B: Ethanol523.8191523.8191.590.2541
AA10127.7110127.730.750.0015∗
AB25.1495125.14950.080.7916
BB1619.8611619.864.920.0479*
Lack-of-fit1016.743338.9131.640.3481
Pure error1976.456329.408
Total (corr.)14578.911
Hydroxy-oleuropein
A: Temperature3656.1813656.183,.60.106580.771664.748
B: Ethanol2401.1412401.142.370.175
AA17567.8117567.817.310.0059∗
AB2.3456512.3456500.9632
BB3117.6913117.693.070.1302
Lack-of-fit4635.8331545.286.460.0798
Pure error6090.8561015.14
Total (corr.)31676.311
Demethyl oleuropein
A: Temperature69.2627169.26273.980.092989.438380.6369
B: Ethanol239.0891239.08913.760.0100∗
AA461.5851461.58526.560.0021∗
AB109.4281109.4286.30.0460∗
BB6.5510116.551010.380.5618
Lack-of-fit52.3368317.44561.010.4976
Pure error104.287617.3811
Total (corr.)987.40911
Decarboxymethyl oleuropein aglycone
A: Temperature14.449114.4491.610.25191.072383.6326
B: Ethanol13.6533113.65331.520.263
AA425.5391425.53947.530.0005∗
AB7.3275217.327520.820.4005
BB81.121181.1219.060.0237∗
Lack-of-fit7.9657532.655250.250.8548
Pure error53.718768.95311
Total (corr.)601.70911
Oleuropein
A: Temperature5650.0615650.0638.150.0008∗93.798788.631
B: Ethanol1826.8311826.8312.340.0126∗
AA3976.5713976.5726.850.0021∗
AB2987.0112987.0120.170.0041∗
BB76.7892176.78920.520.4985
Lack-of-fit329.6143109.8710.590.6639
Pure error888.526148.087
Total (corr.)1432811
Yield
A: Temperature295.5631295.563108.090.0000∗96.525893.6305
B: Ethanol23.3825123.38258.550.0265∗
AA27.7676127.767610.150.0189∗
AB37.7949137.794913.820.0099∗
BB36.3875136.387513.310.0107∗
Lack-of-fit10.337633.445881.830.3165
Pure error16.407162.73452
Total (corr.)472.24911
d.f.: degrees of freedom. ∗ Statistically significant.
Table 5. Phenolic compound content of olive pomace extracts by pressurized liquid extraction in optimal conditions (OP-PLE) and olive pomace extract by conventional extraction (OP).
Compound NamesOP (d.w.)OP-PLE (d.w.)
(mg/kg)(%)(mg/kg)(%)
Quinic acid40.2 ± 0.2 a14.1 ± 0.9 a223 ± 20 b13.6 ± 0.4 a
Oxidized hydroxytyrosol- a- a638 ± 16 b38.5 ± 0.2 b
Oleoside/secologanoside or isomer 14.8 ± 0.3 a1.7 ± 0.1 a33.9 ± 0.2 b2.1 ± 0.0 b
Hydroxytyrosol- a- a67 ± 2 b4.0 ± 0.1 b
Secoiridoid derived47.6 ± 2.0 b16.9 ± 0.9 b9.7 ± 0.4 a0.6 ± 0.0 a
Decarboxylated form of hydroxyl elenolic acid 2.9 ± 0.4 a1.1 ± 0.1 a60 ± 1 b3.6 ± 0.1 b
Hydroxylated product of decarboxymethyl elenolic acid- a- a17.2 ± 0.3 b1.1 ± 0.1 b
Demethyl oleuropein2.9 ± 0.4 b0.8 ± 0.1 bUDL aUDL a
Elenolic acid glucoside or isomer 10.7 ± 0.2 a0.3 ± 0.1 a33.4 ± 0.5 b2.0 ± 0.1 b
Oleoside/secologanoside or isomer 215 ± 2 a5.7 ± 0.5 b45.5 ± 0.4 b2.8 ± 0.1 a
Hydroxy oleuropein- a- a100 ± 1 b5.9 ± 0.2 b
Aldehydic form of decarboxymethyl elenolic acid13 ± 1 b4.7 ± 0.3 bUDL aUDL a
Luteolin-7-O-rutinoside- a- a2.3 ± 0.1 b0.1 ± 0.0 b
Luteolin-7-O-glucoside2.5 ± 0.2 a0.9 ± 0.0 a21 ± 2 b1.3 ± 0.1 b
Oleuropein22 ± 3 a7.7 ± 0.9 b94 ± 1 b5.6 ± 0.0 a
Ligstroside20 ± 2 a7.0 ± 0.6 b16.5 ± 0.8 a1.0 ± 0.1 a
Pinoresinol4.7 ± 0.3 b1.7 ± 0.1 b2.9 ± 0.3 a0.2 ± 0.0 a
Acetoxypinoresinol18 ± 1 b6.5 ± 0.3 a14.8 ± 0.4 a0.9 ± 0.0 a
Luteolin50 ± 1 a17.7 ± 0.4221 ± 4 b13.2 ± 0.2
Apigenin12.4 ± 0.5 a4.4 ± 0.229.8 ± 0.1 b1.9 ± 0.1
Total phenolic compounds282 ± 12 a100 a1659 ± 31 b100 a
Secoiridoids154 ± 9 a55 ± 1 b435 ± 10 b26.4 ± 0.3 a
Phenolic alcohols- a- a702 ± 14 b42.5 ± 0.2 b
Flavonoids65 ± 2 a23.0 ± 0.5 b271 ± 7 b16.4 ± 0.1 a
Lignans23 ± 2 b8.1 ± 0.3 b17.6 ± 0.6 a1.1 ± 0.0 a
OP: Olive pomace; PLE: Pressurized liquid extraction; d.w.: Dry weight; UDL: Under detection level. All the variables were tested in three independent cultures for each experiment. Values are means ± SD. Different letters represent level of significance: p < 0.05.
Table 6. Central composite Design 22 with star points from PLE.
TreatmentsTemperature (°C)Ethanol (%)Dielectric Constant (F/m)
T11085036.1
T21085036.1
T310810019.0
T41641039.2
T51765028.9
T6519028.6
T71085036.1
T8405046.0
T91649020.8
T101085036.1
T11511065.6
T12108053.5

