Oxidation of Citalopram with Sodium Hypochlorite and Chlorine Dioxide: Influencing Factors and NDMA Formation Kinetics

Abstract
:
1. Introduction
2. Results and Discussion
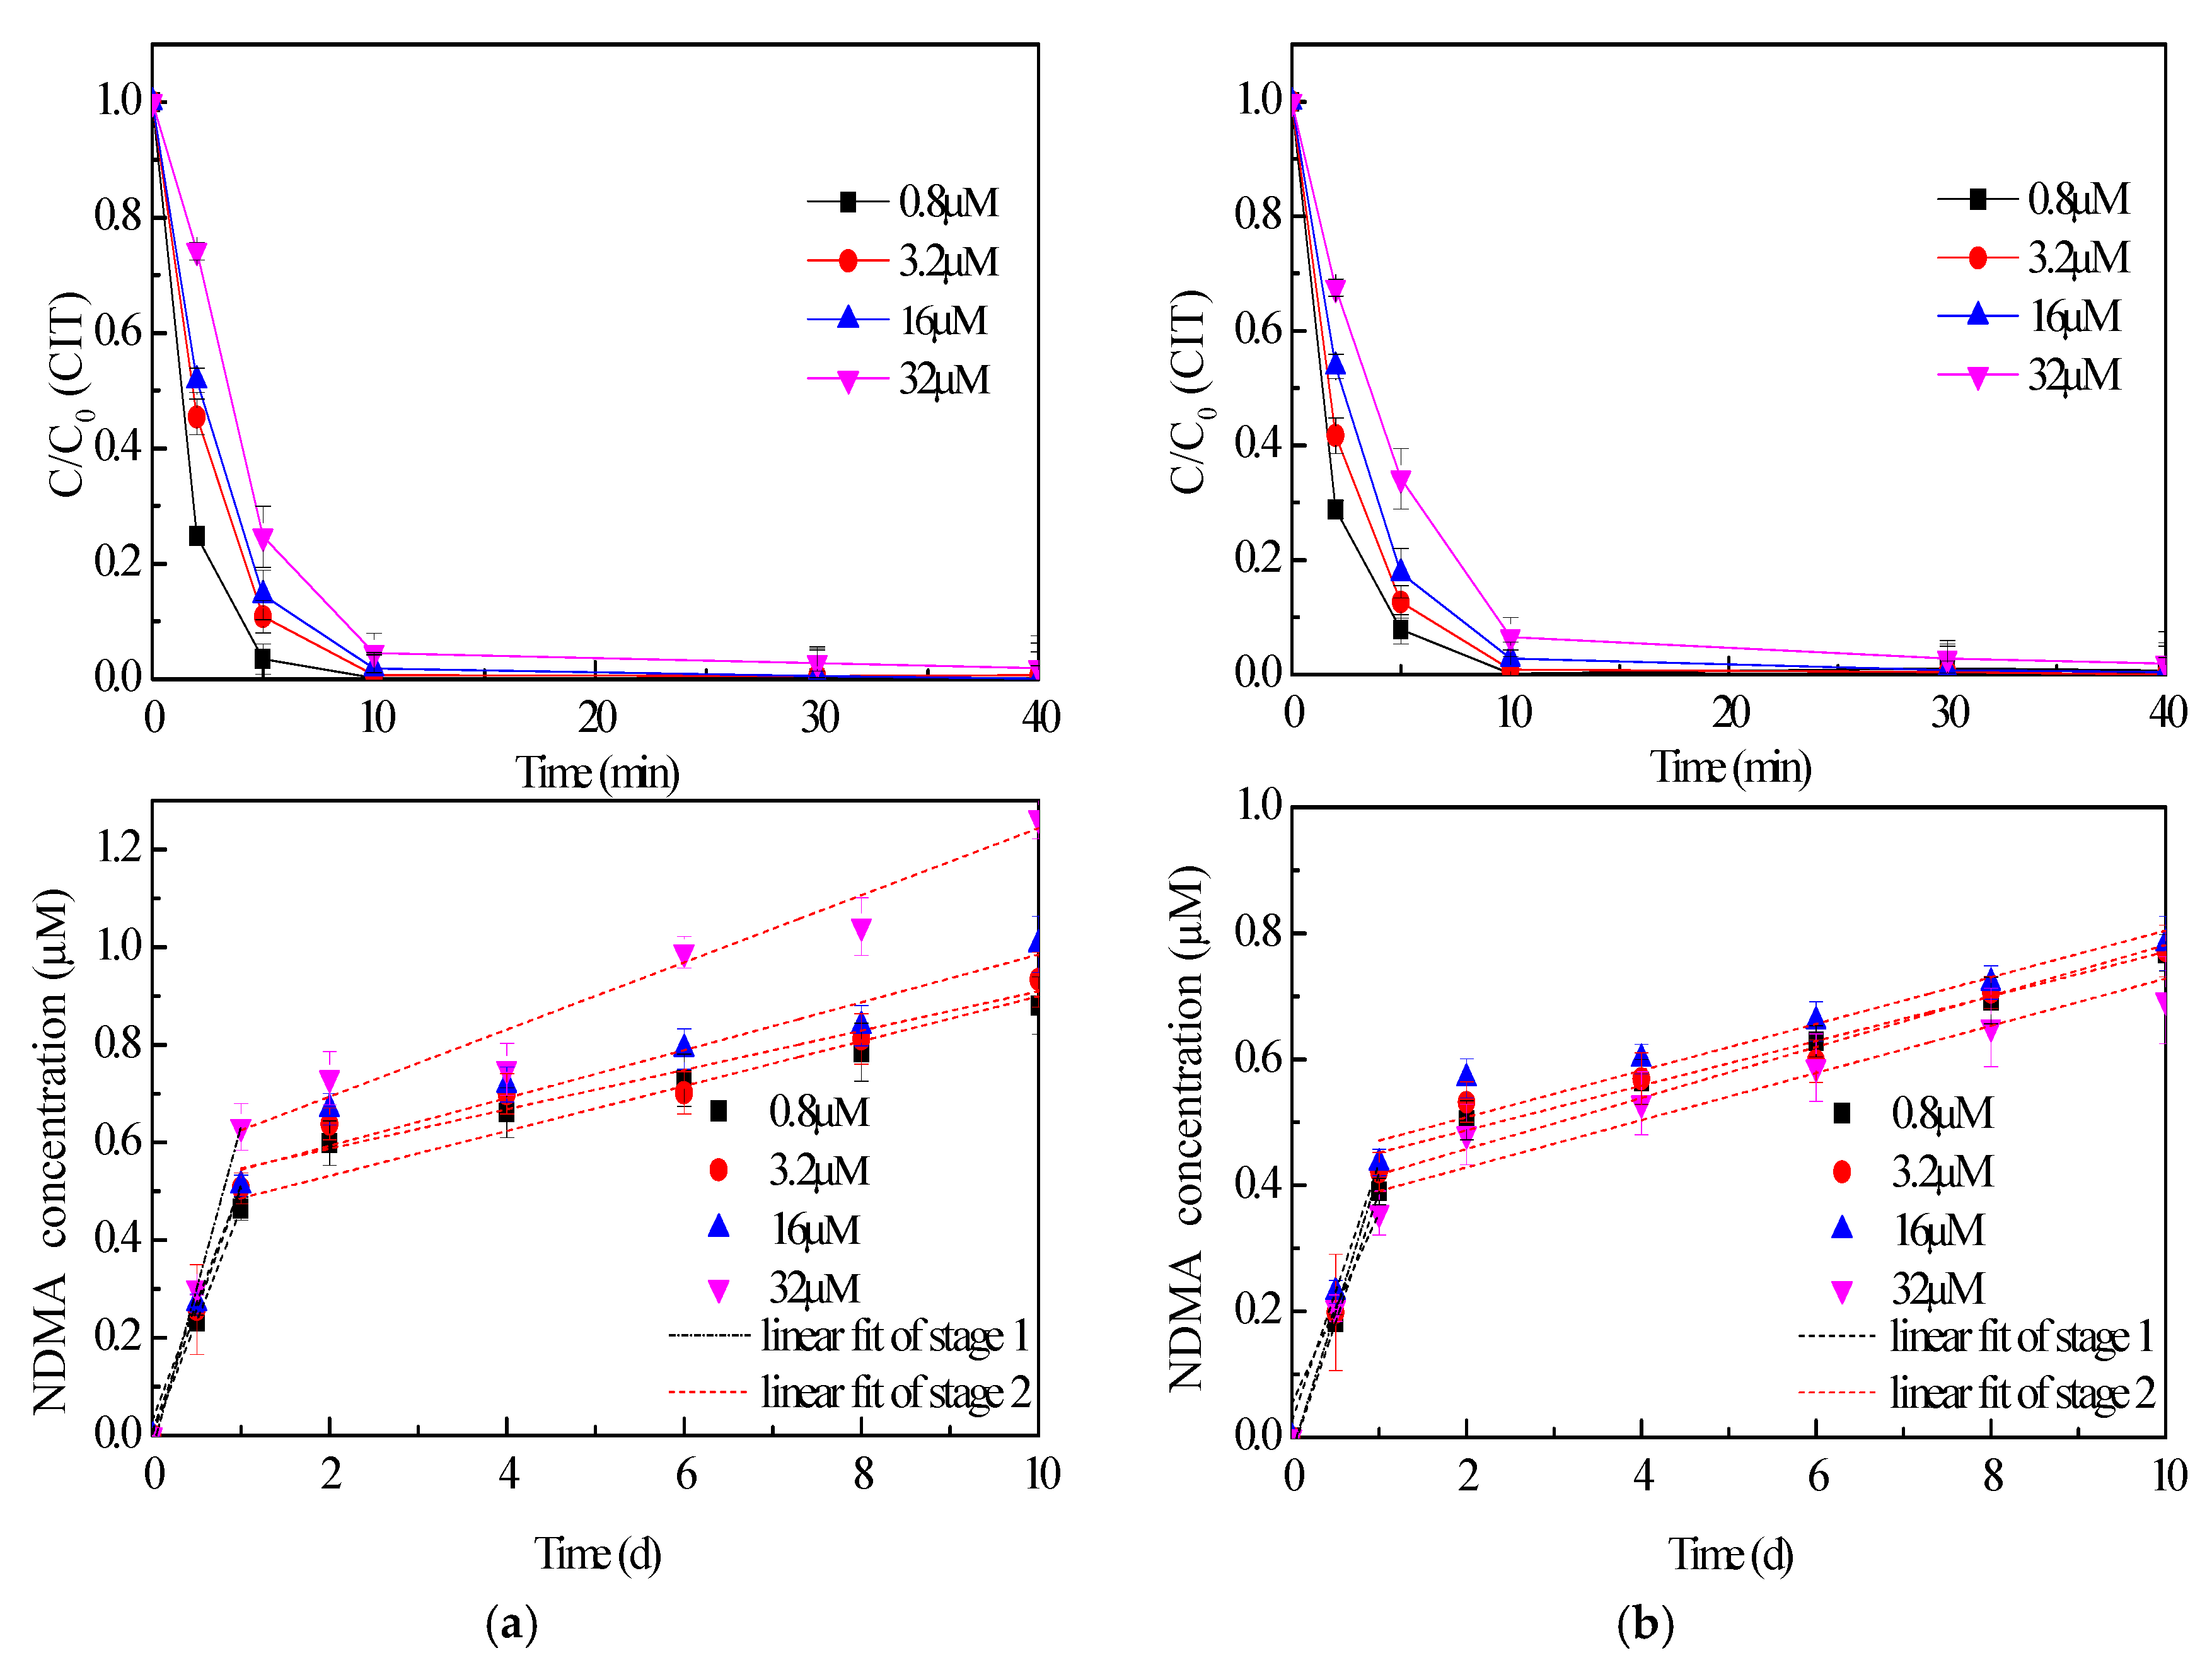
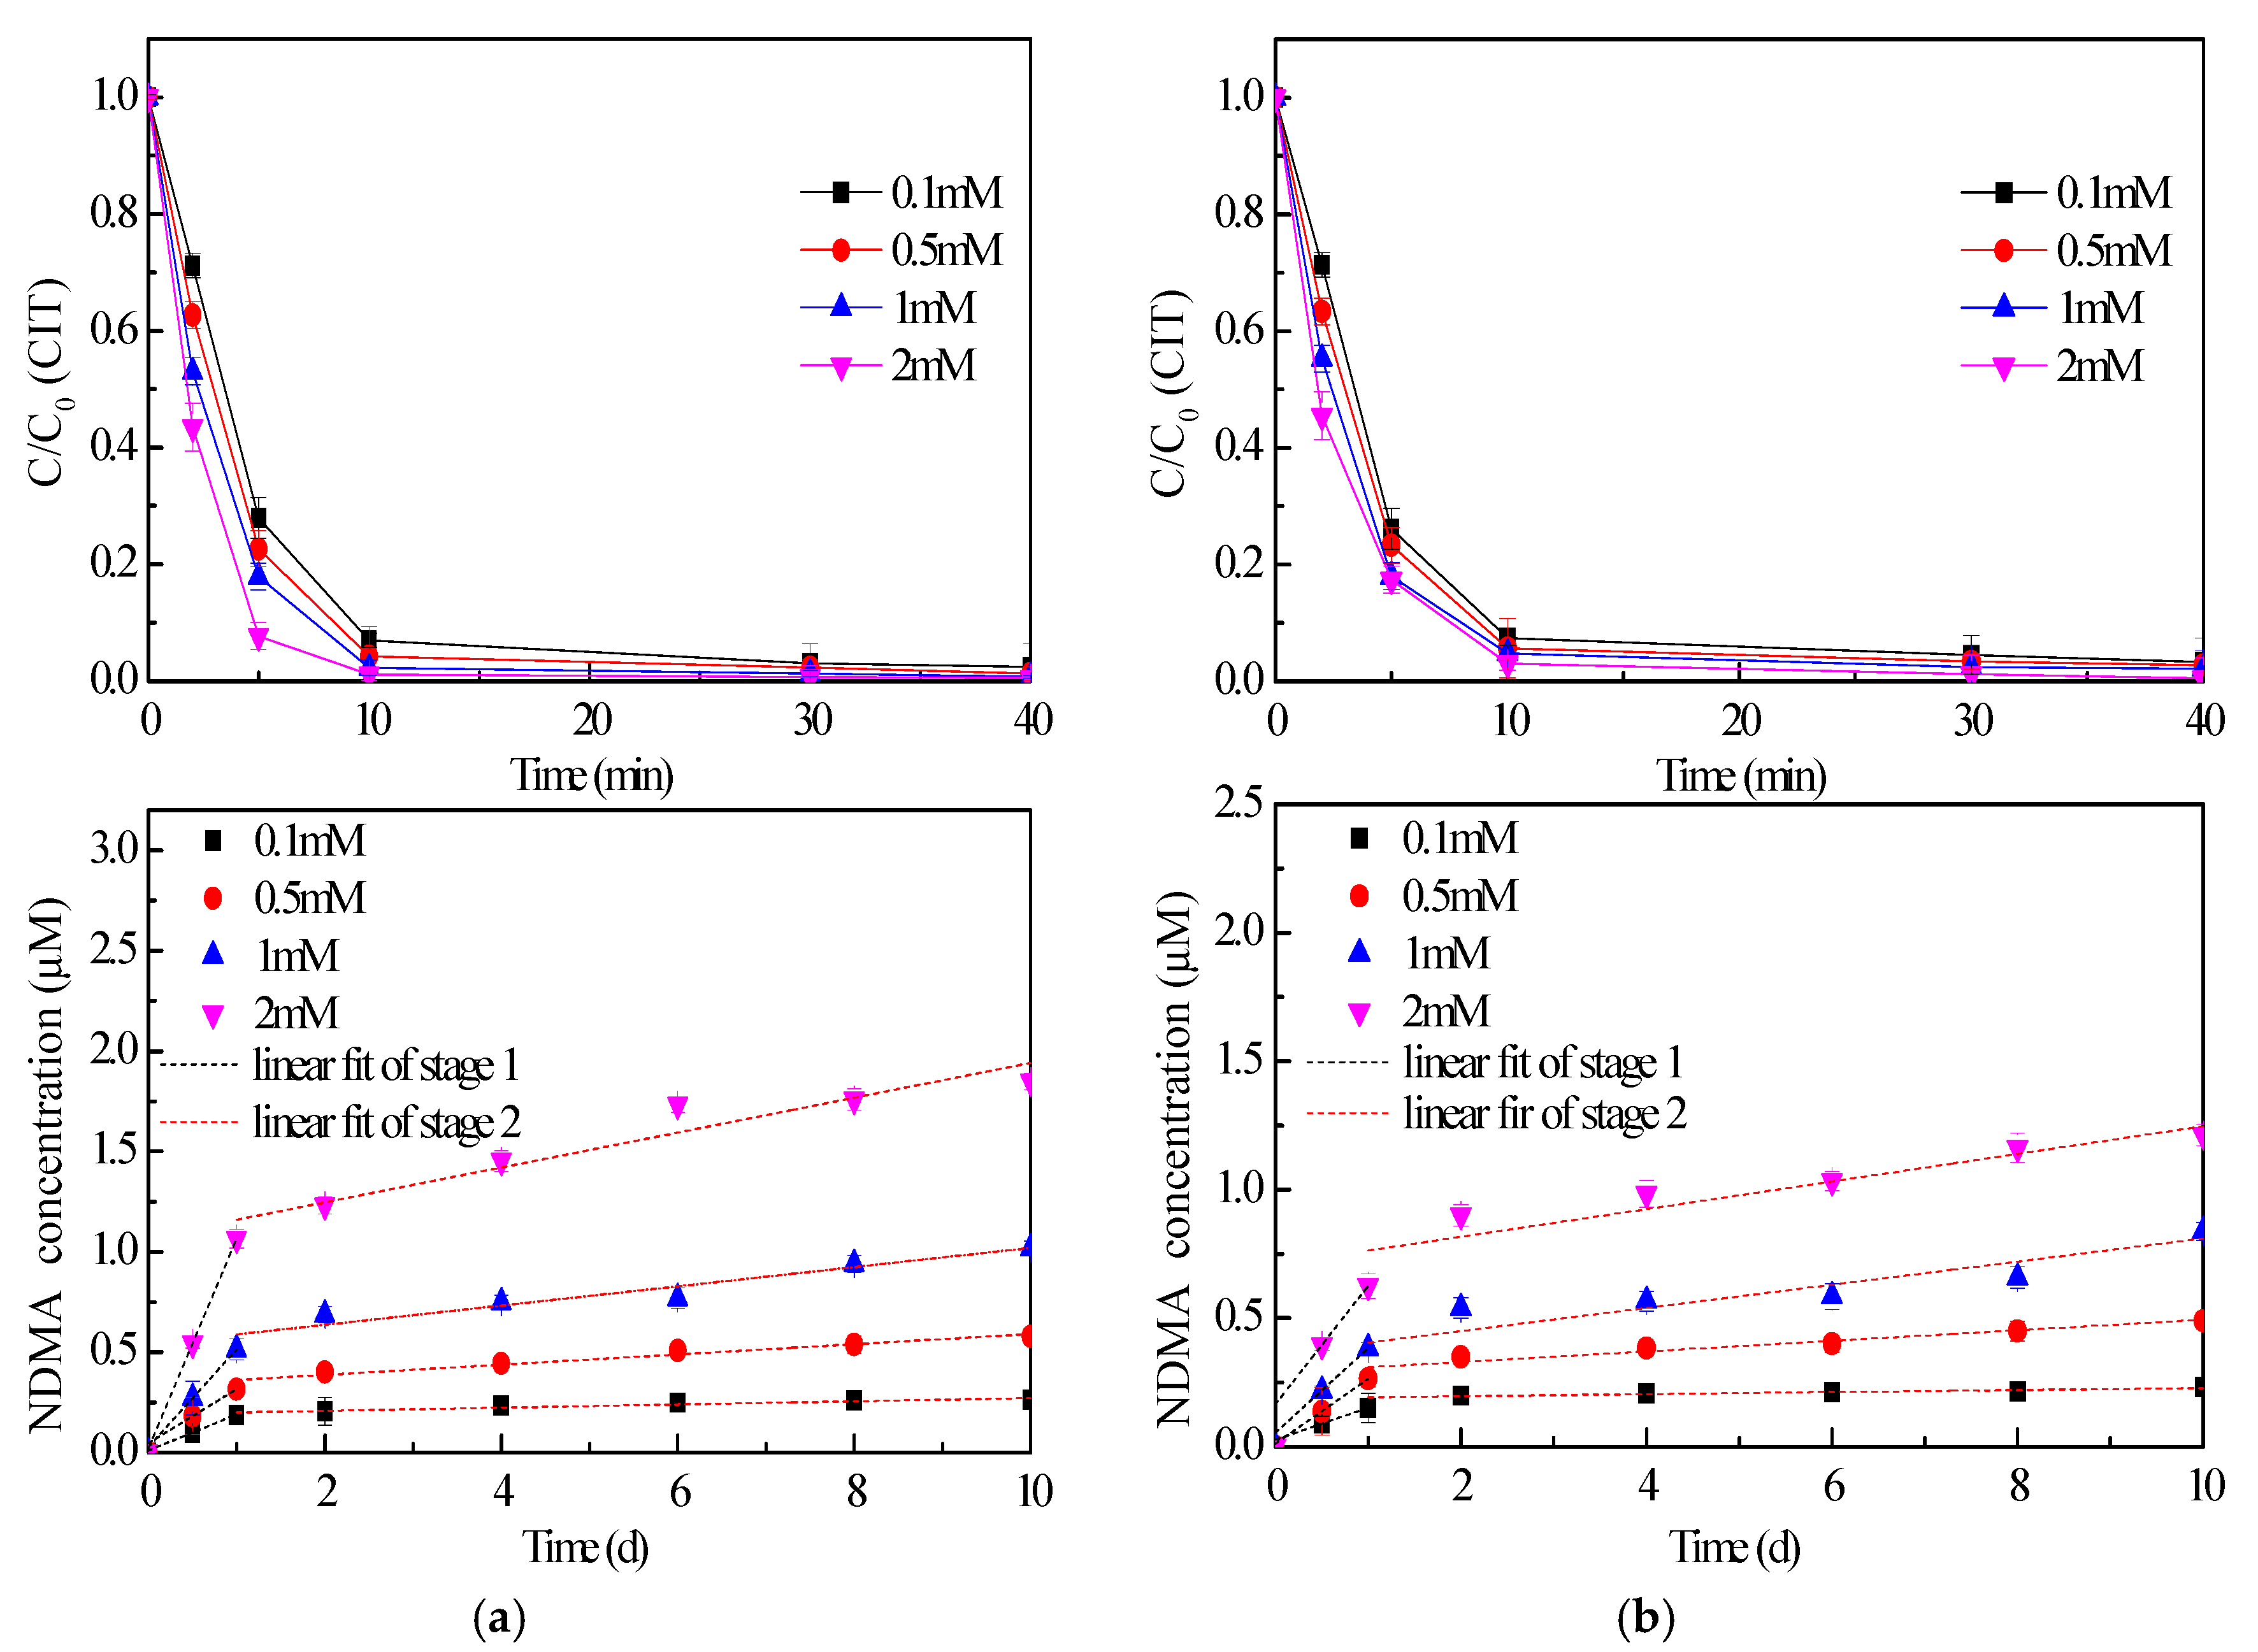
2.1. Effect of CIT Concentration
2.2. Effect of Disinfectant Dose
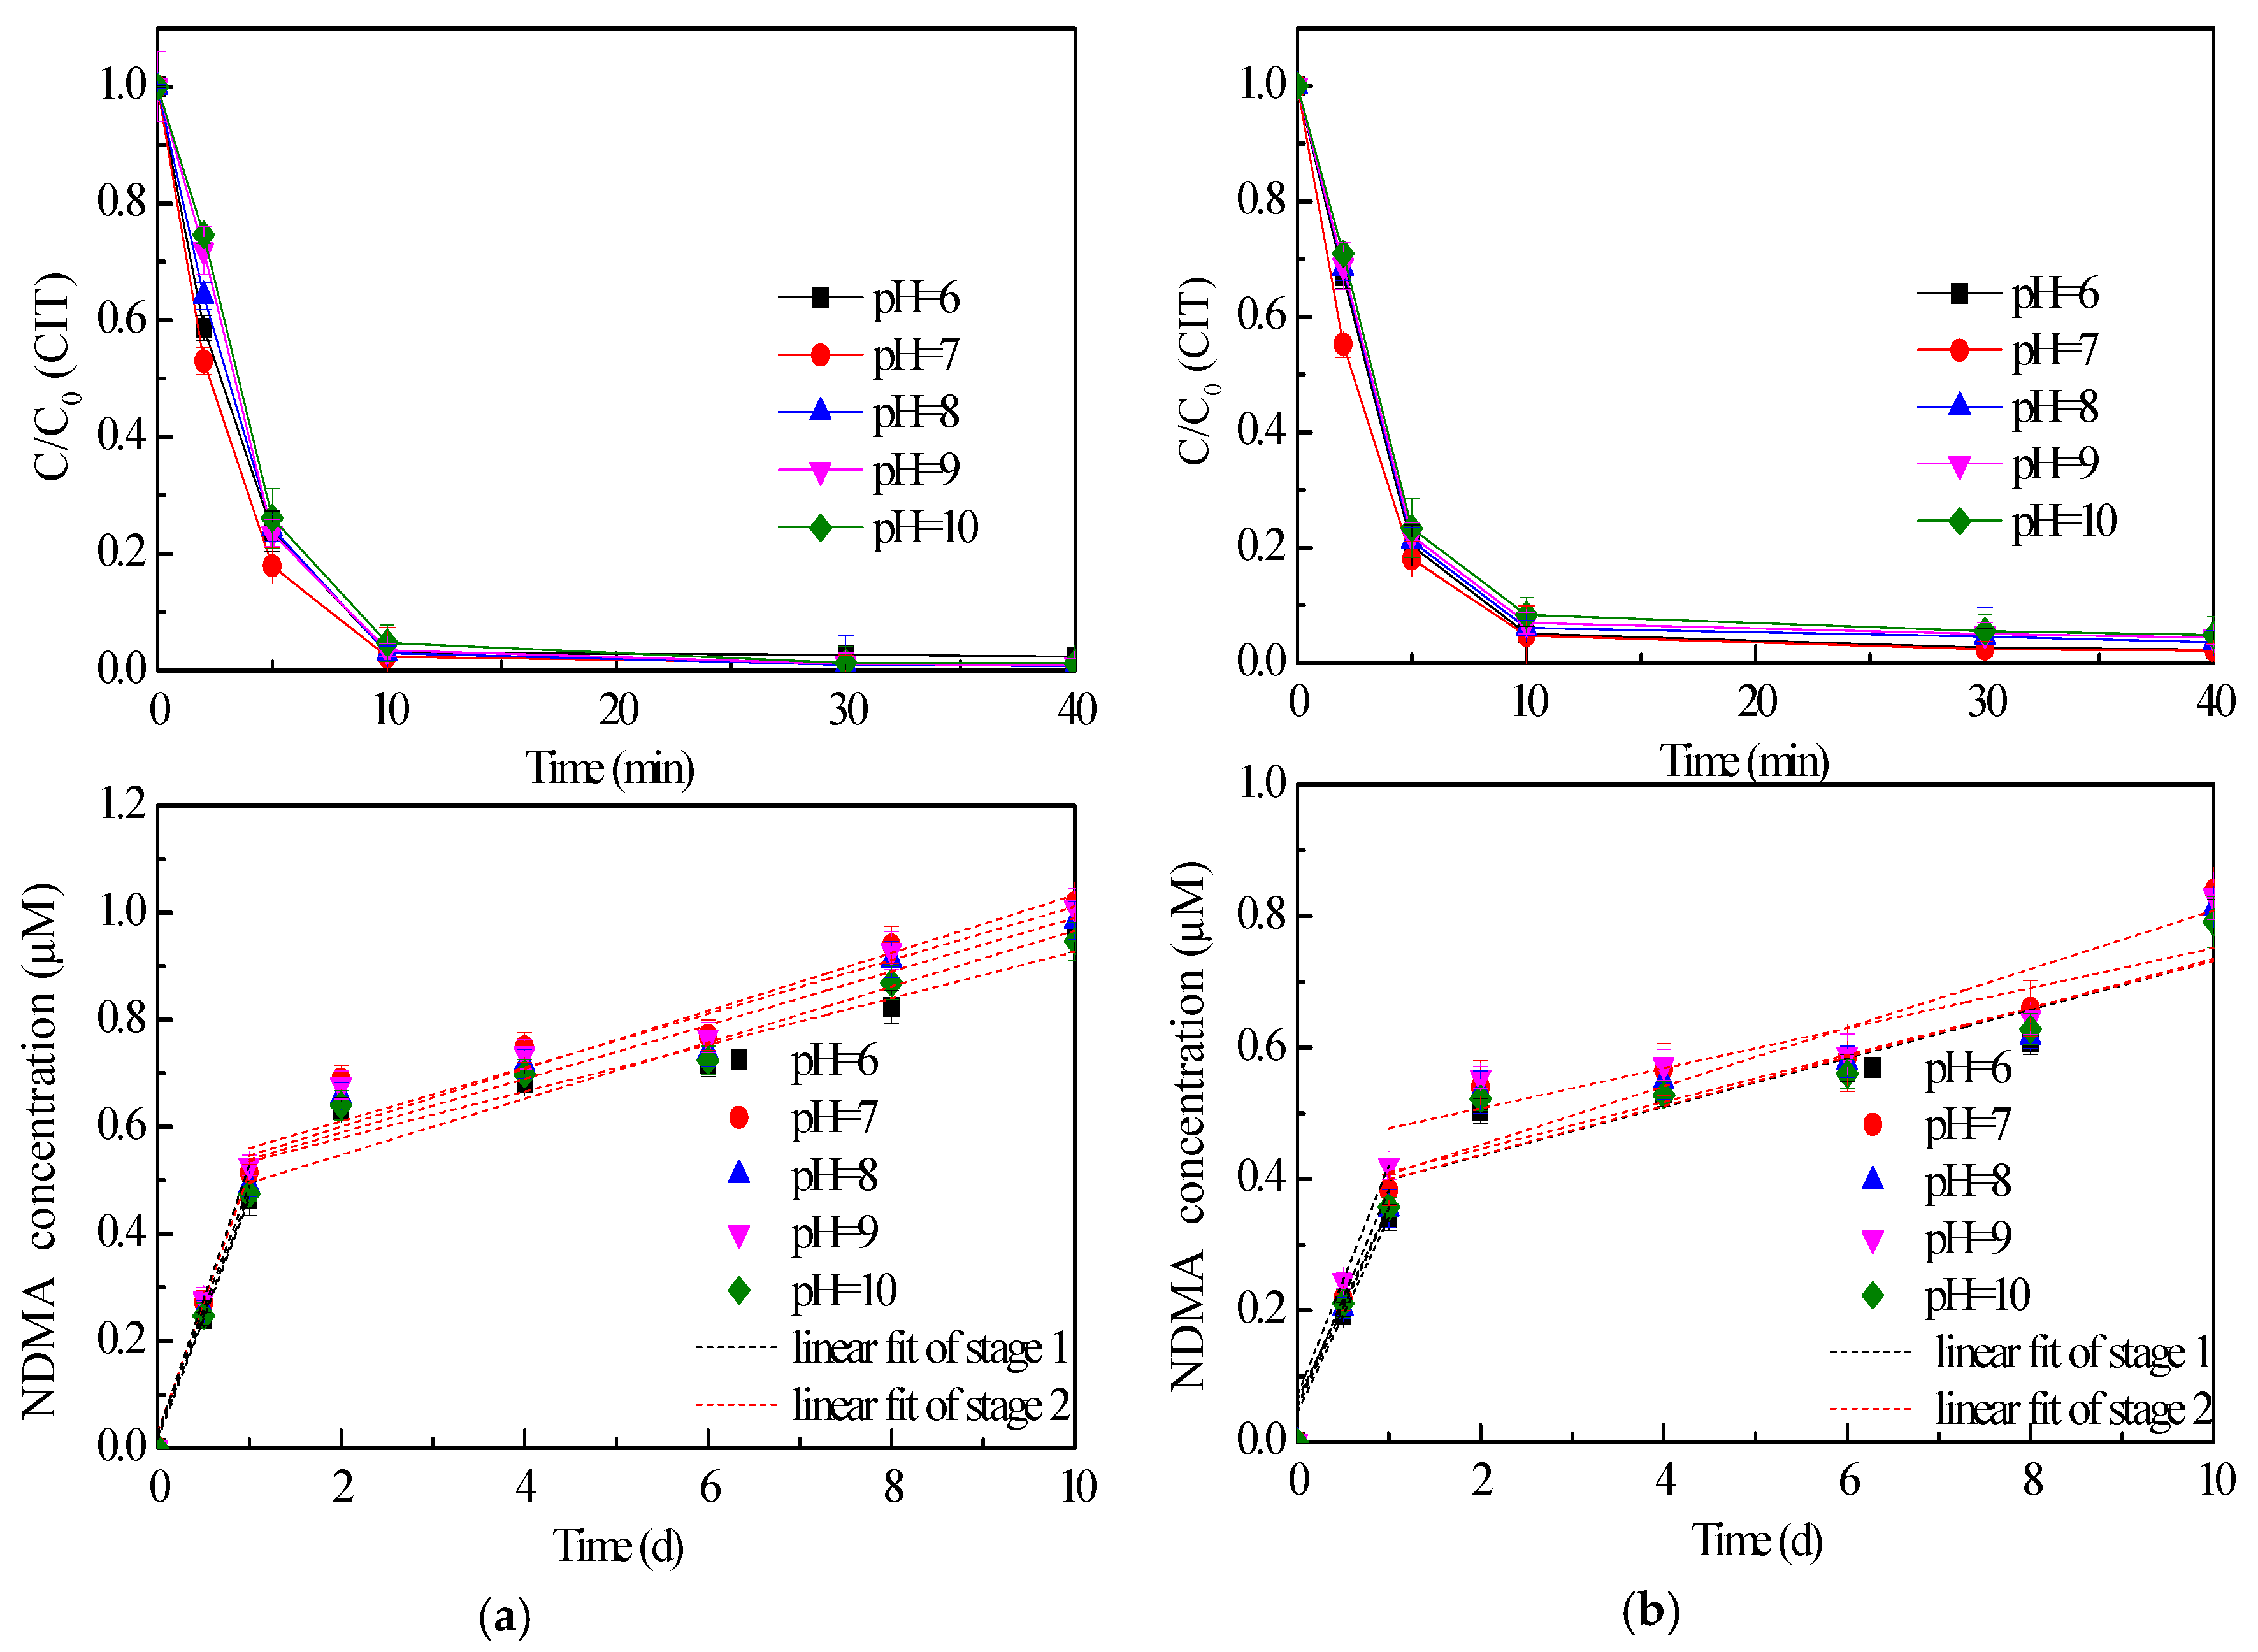
2.3. Effect of pH Value on CIT Chlorination
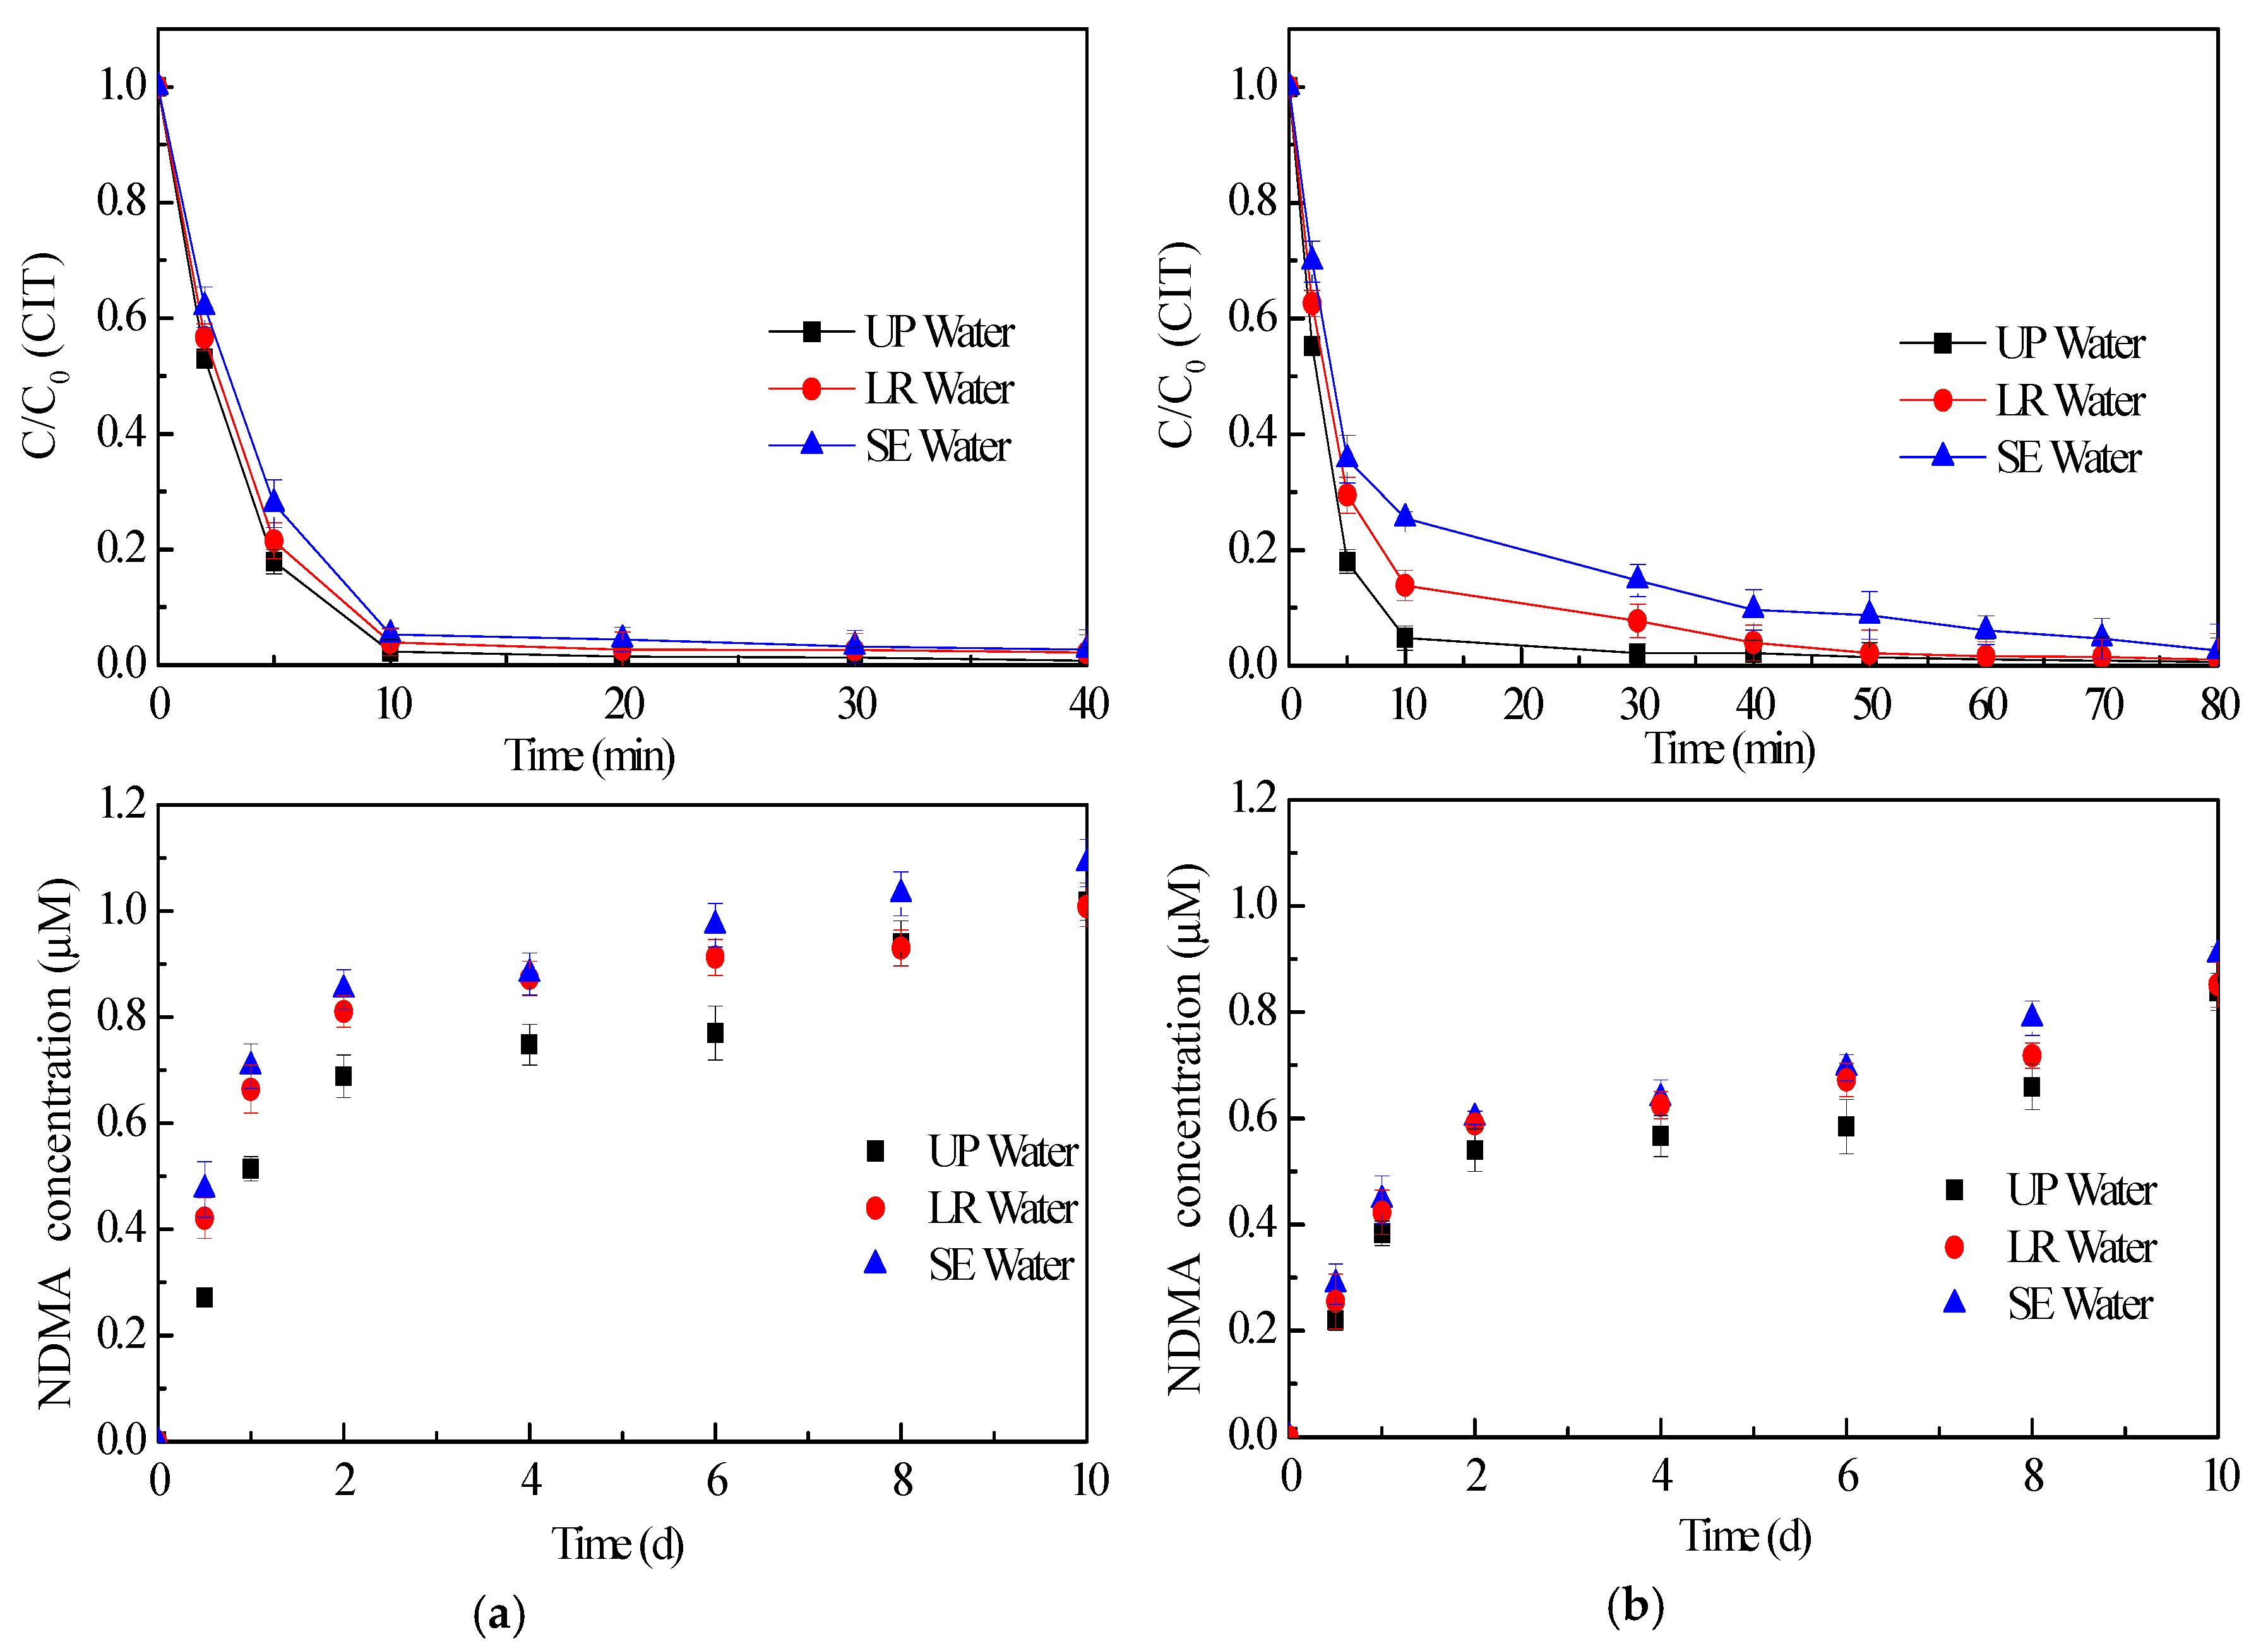
2.4. Effect of Water Matrices on CIT Chlorination
2.5. Possible NDMA Formation Mechanisms
3. Materials and Methods
3.1. Chemicals
3.2. Chlorination Experiments Procedure
3.3. Analytical Methods
4. Conclusions
Supplementary Materials
Author Contributions
Funding
Conflicts of Interest
References
- Silva, L.J.G.; Lino, C.M.; Meisel, L.M.; Pena, A. Selective serotonin re-uptake inhibitors (SSRIs) in the aquatic environment: An ecopharmacovigilance approach. Sci. Total Environ. 2012, 437, 185–195. [Google Scholar] [CrossRef] [PubMed]
- Lajeunesse, A.; Gagnon, C.; Sauve, S. Determination of basic antidepressants and their N-desmethyl metabolites in raw sewage and wastewater using solid-phase extraction and liquid chromatography-tandem mass spectrometry. Anal. Chem. 2008, 80, 5325–5333. [Google Scholar] [CrossRef] [PubMed]
- Schultz, M.M.; Furlong, E.T. Trace analysis of antidepressant pharmaceuticals and their select degradates in aquatic matrixes by LC/ESI/MS/MS. Anal. Chem. 2008, 80, 1756–1762. [Google Scholar] [CrossRef] [PubMed]
- Minguez, L.; Farcy, E.; Ballandonne, C.; Lepailleur, A.; Serpentini, A.; Lebel, J.M.; Bureau, R.; Halm-Lemeille, M.P. Acute toxicity of 8 antidepressants: What are their modes of action? Chemosphere 2014, 108, 314–319. [Google Scholar] [CrossRef] [PubMed]
- Rxlist. The Internet Drug Index. Available online: http://www.rxlist.com/script/main/hp.asp (accessed on 6 February 2010).
- Christensen, A.; Faaborg-Andersen, S.; Ingerslev, F.; Baun, A. Mixture and single-substance toxicity of selective serotonin reuptake inhibitors toward algae and crustaceans. Environ. Toxicol. Chem. 2007, 26, 85–91. [Google Scholar] [CrossRef]
- Nuijs, A.L.N.; Tarcomnicu, I.; Simons, W.; Bervoets, L.; Blust, R.; Jorens, P.G.; Neels, H.; Covaci, A. Optimization and validation of a hydrophilic interaction liquid chromatography-tandem mass spectrometry method for the determination of 13 top-prescribed pharmaceuticals in influent wastewater. Anal. Bioanal. Chem. 2010, 398, 2211–2222. [Google Scholar] [CrossRef] [PubMed]
- Kosjek, T.; Heath, E. Tools for evaluating selective serotonin re-uptake inhibitor residues as environmental contaminants. Trends Anal. Chem. 2010, 29, 832–847. [Google Scholar] [CrossRef]
- Arrow–Citalopram. Available online: http://www.medsafe.govt.nz/profs/datasheet/a/ArrowCitalopramtab.pdf (accessed on 8 December 2011).
- Schultz, M.M.; Furlong, E.T.; Kolpin, D.W.; Werner, S.L.; Schoenfuss, H.L.; Barber, L.B.; Blazer, V.S.; Norris, D.O.; Vajda, A.M. Antidepressant pharmaceuticals in two U.S. effluent-impacted streams: Occurrence and fate in water and sediment, and selective uptake in fish neural tissue. Environ. Sci. Technol. 2010, 44, 1918–1925. [Google Scholar] [CrossRef]
- Styrishave, B.; Halling-SØrensen, B.; Ingerslev, F. Environmental risk assessment of three selective serotonin reuptake inhibitors in the aquatic environment: A case study including a cocktail scenario. Environ. Toxicol. Chem. 2011, 30, 254–261. [Google Scholar] [CrossRef]
- Lajeunesse, A.; Smyth, S.A.; Barclay, K.; Sauvé, S.; Gagnon, C. Distribution of antidepressant residues in wastewater and biosolids following different treatment processes by municipal wastewater treatment plants in Canada. Water Res. 2012, 46, 5600–5612. [Google Scholar] [CrossRef]
- Calisto, V.; Esteves, V.I. Psychiatric pharmaceuticals in the environment. Chemosphere 2009, 77, 1257–1274. [Google Scholar] [CrossRef] [PubMed]
- Subedi, B.; Kannan, K. Occurrence and fate of select psychoactive pharmaceuticals and antihypertensives in two wastewater treatment plants in New York State, USA. Sci. Total Environ. 2015, 514, 273–280. [Google Scholar] [CrossRef] [PubMed]
- Writer, J.H.; Ferrer, I.; Barber, L.B.; Thurman, E.M. Widespread occurrence of neuro-active pharmaceuticals and metavolites in 24 Minnesota rivers and wastewaters. Sci. Total Environ. 2013, 461, 519–527. [Google Scholar] [CrossRef] [PubMed]
- Fick, J.; Söderström, H.; Lindberg, R.H.; Phan, C.; Tysklind, M.; Larsson, D.G. Contamination of surface, ground, and drinking water from pharmaceutical production. Environ. Toxicol. Chem. 2009, 28, 2522–2527. [Google Scholar] [CrossRef] [PubMed]
- Barnes, K.K.; Kolpin, D.W.; Furlong, E.T.; Zaugg, S.D.; Meyer, M.T.; Barber, L.B. A national reconnaissance of pharmaceuticals and other organic wastewater contaminants in the United States-I) groundwater. Sci. Total Environ. 2008, 402, 192–200. [Google Scholar] [CrossRef] [PubMed]
- Valcárcel, Y.; González Alonso, S.; Rodríguez-Gil, J.L.; Gil, A.; Catalá, M. Detection of pharmaceutically active compounds in the rivers and tap water of the Madrid Region (Spain) and potential ecotoxicological risk. Chemosphere 2011, 84, 1336–1348. [Google Scholar] [CrossRef]
- Hörsing, M.; Kosjek, T.; Andersen, H.R.; Heath, E.; Ledin, A. Fate of citalopram during water treatment with O3, ClO2, UV and fenton oxidation. Chemosphere 2012, 89, 129–135. [Google Scholar] [CrossRef]
- Mackul’ak, T.; Mosný, M.; Grabic, R.; Golovko, O.; Koba, O.; Birošová, L. Fenton-like reaction: A possible way to efficiently remove illicit drugs and pharmaceuticals from wastewater. Environ. Toxicol. Phar. 2015, 39, 483–488. [Google Scholar] [CrossRef]
- Shen, R.; Andrews, S.A. Demonstration of 20 pharmaceuticals and personal care products (PPCPs) as nitrosamine precursors during chloramine disinfection. Water Res. 2010, 45, 944–952. [Google Scholar] [CrossRef]
- Zhang, A.; Li, Y.M.; Song, Y.; Lv, J.; Yang, J. Characterization of pharmaceuticals and personal care products as N-nitrosodimethylamine precursors during disinfection processes using free chlorine and chlorine dioxide. J. Hazard. Mater. 2014, 276, 499–509. [Google Scholar] [CrossRef]
- Mitch, W.A.; Sedlak, D.L. Characterization and fate of N-nitrosodimethylamine precursors in municipal wastewater treatment plants. Environ. Sci. Technol. 2004, 38, 1445–1454. [Google Scholar] [CrossRef]
- California Department of Public Health. Available online: www.cdph.ca.gov/certlic/drinkingwater/Documents/Notificationlevels/NotificationLevels.pdf (accessed on 29 June 2010).
- Ministry of Environment, Ontario, Canada. Available online: www.ene.gov.on.ca/envision/gp/4449e.pdf (accessed on 29 June 2010).
- European Council Directive 98/83/EC of 3 November 1998 on the Quality of Water Intended for Human Consumption. Available online: http://www.iss.it/binary/publ/publi/0016.1109850012.pdf (accessed on 25 February 2013).
- Lv, J.; Li, N. Characterization of seven psychoactive pharmaceuticals as N-nitrosodimethylamine precursors during free chlorine and chlorine dioxide chlorination processes. J. Chem. Technol. Biot. 2019, 94, 53–62. [Google Scholar] [CrossRef]
- Michalowicz, J.; Duda, W.; Stufka-Olczyk, J. Transformation of phenol, catechol, guaiacol and syringol exposed to sodium hypochlorite. Chemosphere 2007, 66, 657–663. [Google Scholar] [CrossRef]
- Chamberlain, E.; Adams, C. Oxidation of sulfonamides, macrolides, and carbadox with free chlorine and monochloramine. Water Res. 2006, 40, 2517–2526. [Google Scholar] [CrossRef]
- Horváth, A.K.; Nagypál, I.; Epstein, I.R. Kinetics and mechanism of the chlorine dioxide-tetrathionate reaction. J. Phys. Chem. A 2003, 107, 10063–10068. [Google Scholar] [CrossRef]
- Csekö, G.; Horváth, A.K. Kinetics and mechanism of the chlorine dioxide-trithionate reaction. J. Phys. Chem. A 2012, 116, 2911–2919. [Google Scholar] [CrossRef]
- Hoigne, J.; Bader, H. Kinetics of reactions of chlorine dioxide (ClO2) in water—I. Rate constants for inorganic and organic compounds. Water Res. 1994, 28, 45–55. [Google Scholar] [CrossRef]
- Deborde, M.; von Gunten, U. Reactions of chlorine with inorganic and organic compounds during water treatment-Kinetics and mechanisms: A critical review. Water Res. 2008, 42, 13–51. [Google Scholar] [CrossRef]
- Mitch, W.A.; Sharp, J.O.; Trussell, R.R.; Valentine, R.L.; Alvarez-Cohen, L.; Sedlak, D.L. N-nitrosodimethylamine (NDMA) as a drinking water contaminant: A review. Environ. Eng. Sci. 2003, 20, 389–404. [Google Scholar] [CrossRef]
- Choi, J.H.; Valentine, R.L. A kinetic model of N-nitrosodimethylamine (NDMA) formation during water chlorination/chloramination. Water Sci. Technol. 2002, 46, 65–71. [Google Scholar] [CrossRef]
- Chen, Z.; Yang, L.; Zhai, X.; Zhao, S.; Li, A.; Shen, J. N-Nitrosamine formation during chlorination/chloramination of bromide-containing water. Water Sci. Technol. Water Supply 2010, 10, 462–471. [Google Scholar] [CrossRef]
- Mitch, W.A.; Sedlak, D.L. Formation of N-nitrosodimethylamine (NDMA) from dimethylamine during chlorination. Environ. Sci. Technol. 2002, 36, 588–595. [Google Scholar] [CrossRef]
- Chang, H.H.; Chen, C.Y.; Wang, G.S. Identification of potential nitrogenous organicprecursors for C-, N-DBPs and characterization of their DBPs formation. Water Res. 2011, 45, 3753–3764. [Google Scholar] [CrossRef]
- De Ridder, D.J.; Verliefde, A.R.; Heijman, S.G.J.; Verberk, J.Q.; Rietveld, L.C.; van der Aa, L.T.; Amy, G.L.; van Dijk, J.C. Influence of natural organic matter on equilibrium adsorption of neutral and charged pharmaceuticals onto activated carbon. Water Sci. Technol. 2011, 63, 416–423. [Google Scholar] [CrossRef]
- Kristiana, I.; Tan, J.; Joll, C.A.; Heitz, A.; von Gunten, U.; Charrois, J.W.A. Formation of N-nitrosamines from chlorination and chloramination of molecular weight fractions of natural organic matter. Water Res. 2013, 47, 535–546. [Google Scholar] [CrossRef]
- Shah, A.D.; Kim, J.H.; Huang, C.H. Tertiary amines enhance reactions of organic contaminants with aqueous chlorine. Water Res. 2011, 45, 6087–6096. [Google Scholar] [CrossRef]
- Mitch, W.A.; Schreiber, I.M. Degradation of tertiary alkylamines during chlorination/chloramination: Implications for formation of aldehydes, nitriles, halonitroalkanes, and nitrosamines. Environ. Sci. Technol. 2008, 42, 4811–4817. [Google Scholar] [CrossRef]
- Lee, C.; Schmidt, C.; Yoon, J.; von Gunten, U. Oxidation of N-nitrosodimethylamine (NDMA) precursors with ozone and chlorine dioxide: Kinetics and effect on NDMA formation potential. Environ. Sci. Technol. 2007, 41, 2056–2063. [Google Scholar] [CrossRef]
- Andrzejewski, P.; Kasprzyk-Hordern, B.; Nawrocki, J. The hazard of N-nitrosodimethylamine (NDMA) formation during water disinfection with strong oxidants. Desalination 2005, 176, 37–45. [Google Scholar] [CrossRef]
- Andrzejewski, P.; Nawroki, J. N-niyrosodimethylamine formation during treatment with strong oxidants of dimethylamine containing water. Water Sci. Technol. 2007, 56, 125–131. [Google Scholar] [CrossRef]
- Munch, J.W.; Bassett, M.V. Determination of Nitrosames in Drinking Water by Solid Phase Extraction and Capillary Column Gas Chromatography with Large Volume Injection and Chemical Ionization Tandem Mass Spectrometry (MS/MS). Available online: http://www.epa.gov/nerlcwww/m_521.pdf#search¼%22epa%20METHOD%205 21%22 (accessed on 17 May 2005).
- Lv, J.; Li, Y.M.; Song, Y. Reinvestigation on the ozonation of N nitrosodimethylamine: Influencing factors and degradation mechanism. Water Res. 2013, 47, 4993–5002. [Google Scholar] [CrossRef]
Sample Availability: Samples of the compounds are not available from the authors. |


| Compound Investigated | Molecular Structure | pKa | CAS |
|---|---|---|---|
| Citalopram | 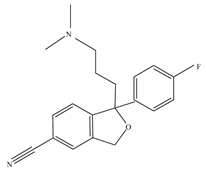 | 9.59 | 59729-33-8 |
| Water Samples | pH | HCO3− (mg/L) | TOC (mg/L) | TN (mg/L) | NH4+-N (mg/L) |
|---|---|---|---|---|---|
| LR Water | 7.18 | 85.3 | 5.3 | 2.38 | 0.07 |
| SE Water | 6.88 | 284.3 | 16.2 | 13.25 | 0.18 |
© 2019 by the authors. Licensee MDPI, Basel, Switzerland. This article is an open access article distributed under the terms and conditions of the Creative Commons Attribution (CC BY) license (http://creativecommons.org/licenses/by/4.0/).
Share and Cite
Lv, J.; Wang, Y.; Li, N. Oxidation of Citalopram with Sodium Hypochlorite and Chlorine Dioxide: Influencing Factors and NDMA Formation Kinetics. Molecules 2019, 24, 3065. https://doi.org/10.3390/molecules24173065
Lv J, Wang Y, Li N. Oxidation of Citalopram with Sodium Hypochlorite and Chlorine Dioxide: Influencing Factors and NDMA Formation Kinetics. Molecules. 2019; 24(17):3065. https://doi.org/10.3390/molecules24173065
Chicago/Turabian StyleLv, Juan, Yan Wang, and Na Li. 2019. "Oxidation of Citalopram with Sodium Hypochlorite and Chlorine Dioxide: Influencing Factors and NDMA Formation Kinetics" Molecules 24, no. 17: 3065. https://doi.org/10.3390/molecules24173065
APA StyleLv, J., Wang, Y., & Li, N. (2019). Oxidation of Citalopram with Sodium Hypochlorite and Chlorine Dioxide: Influencing Factors and NDMA Formation Kinetics. Molecules, 24(17), 3065. https://doi.org/10.3390/molecules24173065