Cytotoxic Polyketides from a Deep-Sea Sediment Derived Fungus Diaporthe phaseolorum FS431
by

Zheng Niu
, 
Yuchan Chen
,
Heng Guo
,
Sai-Ni Li
,
Hao-Hua Li
,
Hong-Xin Liu
,
Zhaoming Liu
* and
Weimin Zhang
* State Key Laboratory of Applied Microbiology Southern China, Guangdong Provincial Key Laboratory of Microbial Culture Collection and Application, Guangdong Open Laboratory of Applied Microbiology, Guangdong Institute of Microbiology, Guangdong Academy of Sciences, Yuexiu District, Guangzhou 510070, China
*
Authors to whom correspondence should be addressed.
Molecules 2019, 24(17), 3062; https://doi.org/10.3390/molecules24173062
Submission received: 22 July 2019
/
Revised: 20 August 2019
/
Accepted: 21 August 2019
/
Published: 22 August 2019
Abstract
:Two new chromone-derived polyketides phaseolorins, G and H (1 and 2), and one new anthraquinone derivative, phaseolorin I (3), together with three known compounds (4–6), were isolated from the deep-sea sediment-derived fungus Diaporthe phaseolorum FS431. The structures of the new compounds were determined by comprehensive analysis of their spectroscopic data, and the absolute configuration of 1 was established by quantum chemical calculations of electron capture detection (ECD). All the isolated compounds (1–6) were tested for their in vitro cytotoxic activities against four human tumor cell lines, of which compound 4 exhibited significant effect against MCF-7, HepG-2, and A549 tumor cell lines with IC50 values of 2.60, 2.55, and 4.64 µM, respectively.
1. Introduction
Secondary metabolites from marine fungi have attracted the attention of chemists and biologists because of their unique chemical structures and significant biological activities [1]. In past decades, large numbers of novel chemical structures have been found from deep-sea fungi, such as polyketides, terpenoids, steroids, peptides, alkaloids, and so on [2,3]. Furthermore, polyketides have not only dominant numbers in structures but also diverse potent bioactivities, including cytotoxic, antibacterial, antifungal, radical scavenging, and antiviral [4,5,6].
The genus Diaporthe is one of the most common and widely distributed fungal taxa, which predominantly produces a large number of polyketides. Because of its importance as plant pathogen, the genus has been thoroughly investigated. Its secondary metabolites were collected from a wide range of species derived from different habitats, which were mostly obtained from endophytic fungi. Their metabolites are full of diverse natural products, such as diketopiperazines [7], triterpenoid [8], bisanthraquinones [9], highly substituted benzophenones [10], lactons [11], xanthones [12], and mycotoxins [12], which exhibit anti-IAV [6], anti-angiogenic [7], antimalarial [12], antihyperlipidemic [13] activities, and so on.
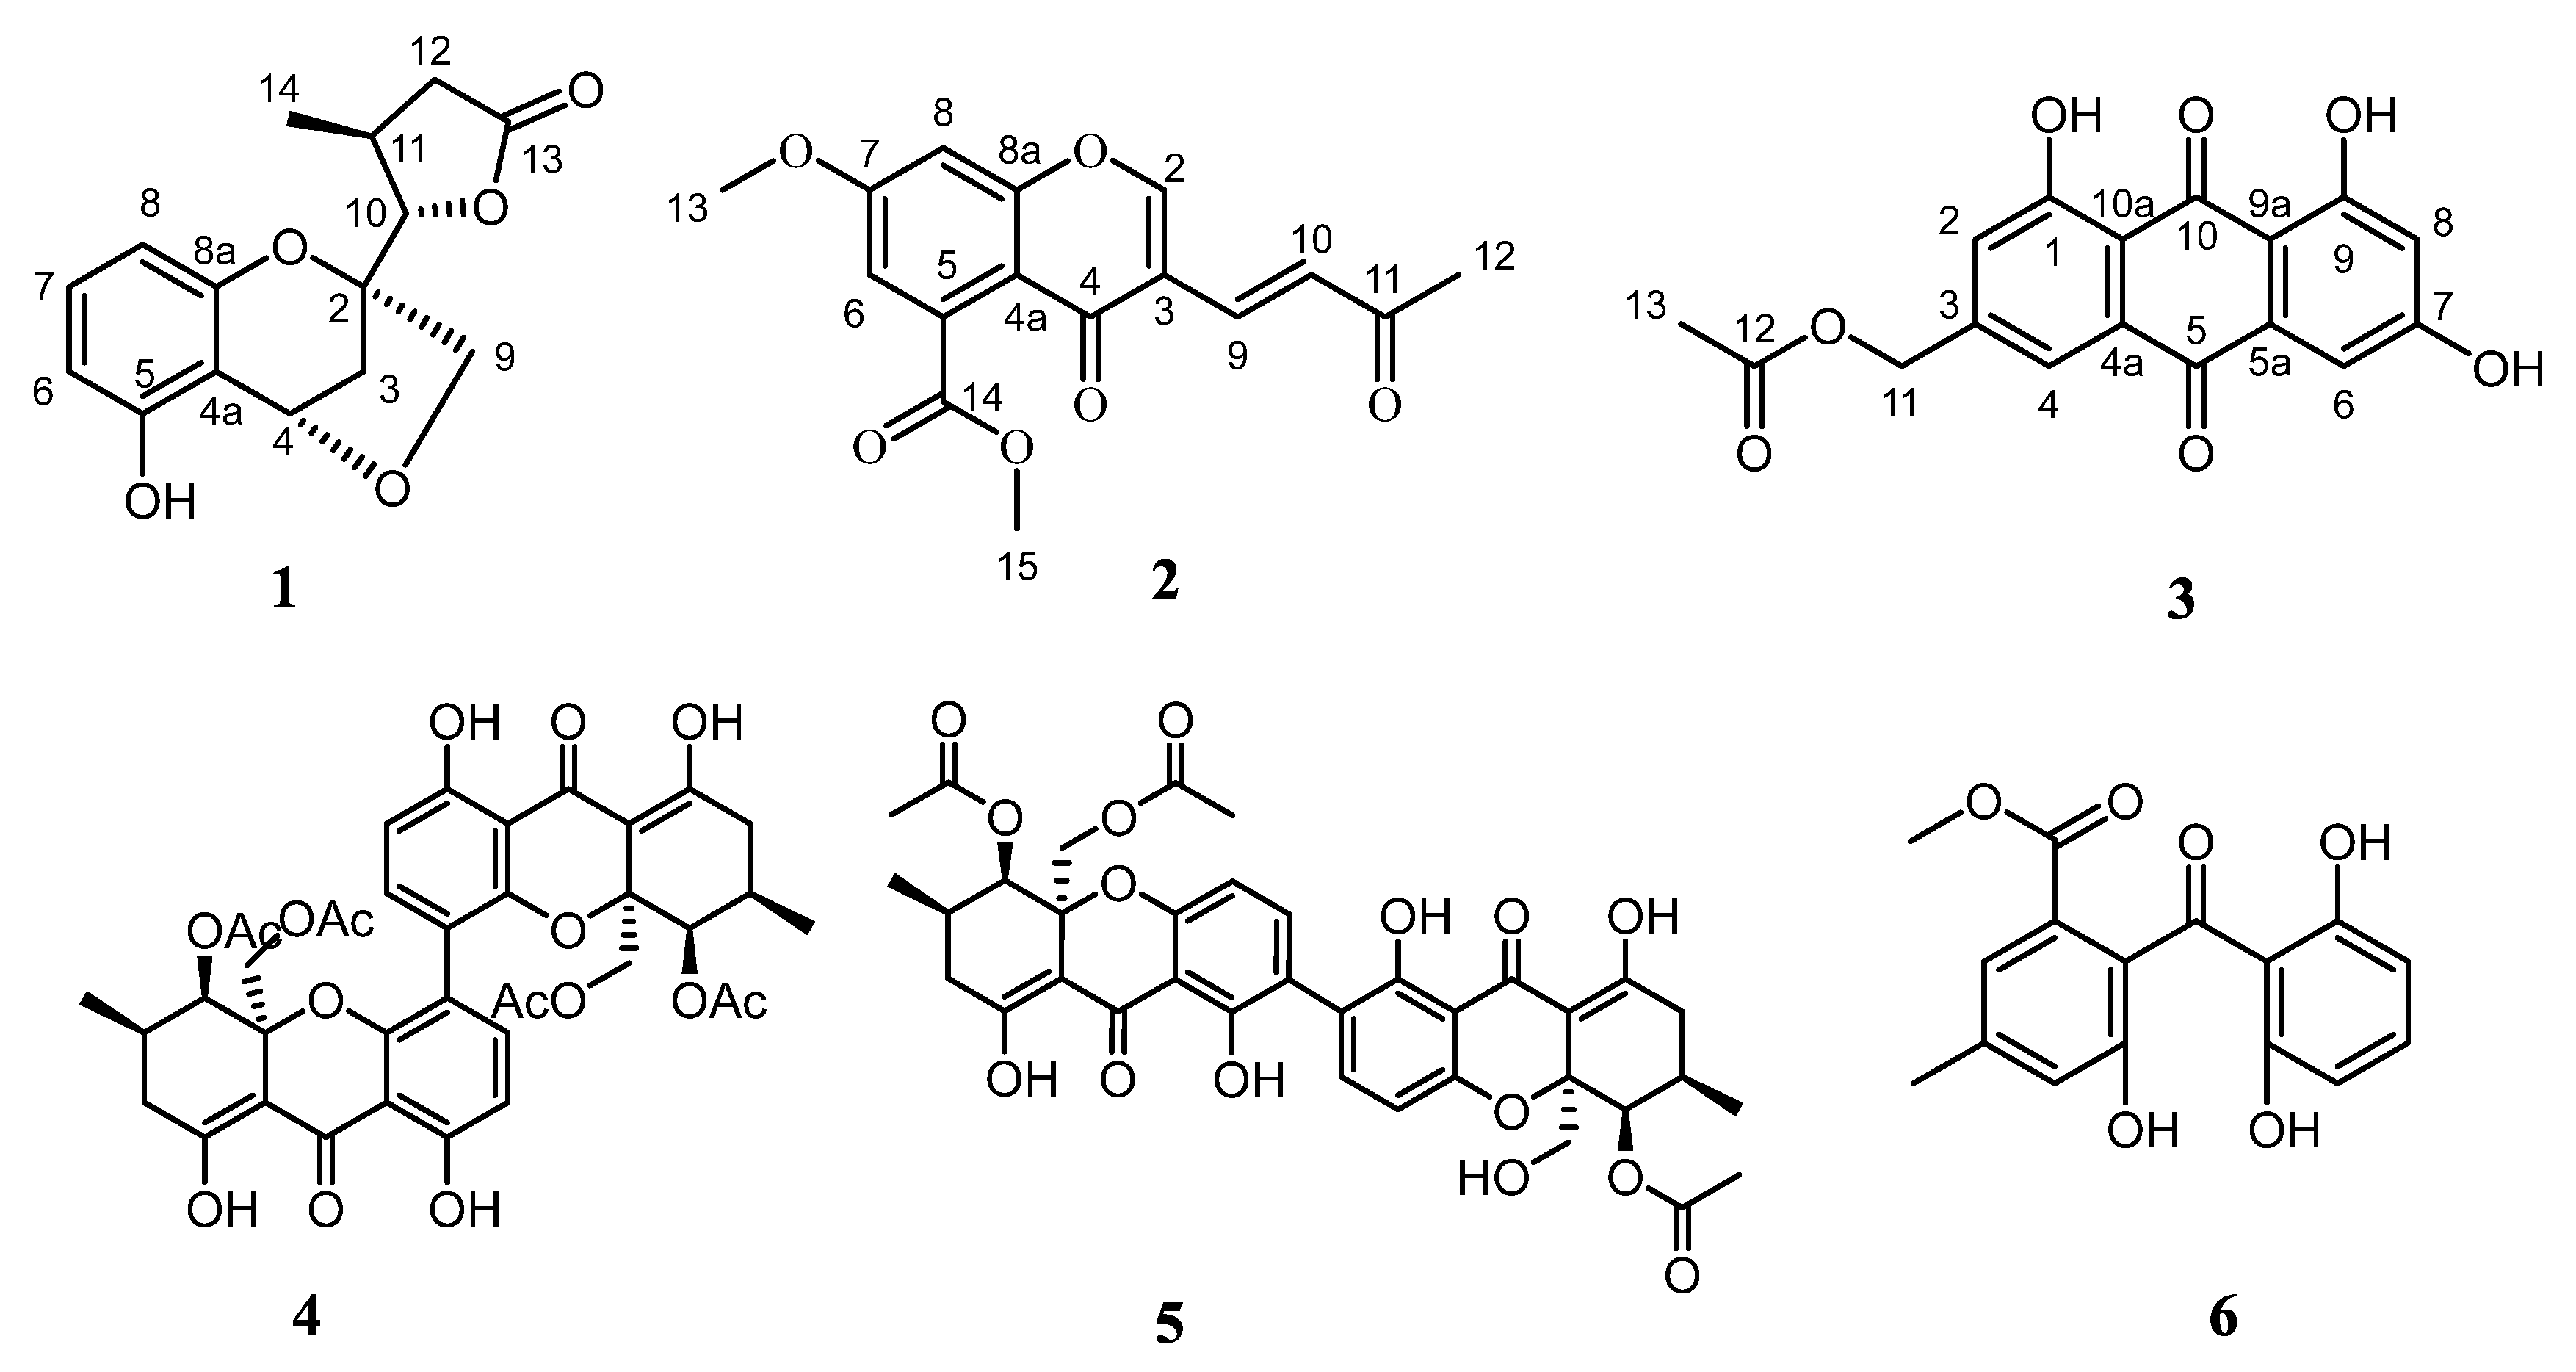
However, the investigation of the genus Diaporthe from deep-sea was rarely reported. In our ongoing effort to search for bioactive metabolites from the deep-sea derived fungi, a strain of D. phaseolorum FS431 was collected from a sediment sample of the Indian Ocean, and its chemical investigation led to the isolation and the identification of three new polyketides, named phaseolorin G-I (1–3), along with three known compounds, phomoxanthone A (4) [14], dicerandrol B (5) [15], and 2,2′,6′-trihydroxy-4-methyl-6-methoxy-acyl-diphenylmethanone (6) (Figure 1) [16]. All the isolated compounds were tested for their in vitro cytotoxic activities against four human tumor cell lines. Herein, the details of isolation, structure identification, as well as cytotoxicity assay are reported.
2. Results and Discussion
2.1. Structure Elucidation
Compound 1 was isolated as yellow oil. Its molecular formula was established to be C15H16O5 on the basis of high-resolution electrospray ionization mass spectroscopy (HRESIMS) at m/z 275.0926 [M − H]− (calcd for 275.0919), indicating eight degrees of unsaturation. The IR absorption at 3225 and 1740 cm−1 suggested the presence of hydroxy and carbonyl groups, respectively. The 1H-NMR spectrum of 1 revealed the presence of a phenolic hydroxyl signal at δH 8.59 (1H, br s, 1-OH), three ABX coupling aromatic protons at [δH 6.42 (1H, br d, J = 8.1 Hz, H-6), 6.97 (1H, t, J = 8.1 Hz, H-7), 6.31 (1H, br d, J = 8.1 Hz, H-8)], three methylenes at [δH 4.05 (2H, s, H-9), 2.22 (1H, m, H-3a), 2.12 (1H, m, H-3b), 2.85 (1H, overlapped, H-12a), 2.24 (1H, m, H-12b)], three methines at [δH 5.44 (1H, d, J = 5.0 Hz, H-4), 4.51 (1H, d, J = 4.0 Hz, H-10), 2.08 (1H, m, H-11)], and a methyl group at δH 1.28 (3H, d, J = 6.1 Hz, H3-14). The 13C-NMR combined with HSQC spectra (Table 1) of 1 resolved 15 carbon signals composed of a carbonyl carbon (δC 176.4), one methyl, three methylenes, six aromatic carbonyls, three sp3 methines, and three aliphatic quaternary carbons. Comprehensive analysis of the 1D-NMR data indicated the existence of thio-trisubstituted benzene ring in 1, which was similar to those constructed the same backbone [17].
The 1H–1H COSY spectrum (Figure 2) indicated the presence of four coupling fragments H-6/H-7/H-8, H-3/H-4, H-10/H-11/H-12 and H-11/H-14. The HMBC correlations (Figure 2) from H-8 to C-4a/C-8a and from H-6 to C-5/C-4a further evidenced the thio-trisubstituted benzene ring. Meanwhile, the correlations from H-4 to C-4a/C-5/C-8a, H-2 to C-8a, and 5-OH to C-5 suggested a benzopyran skeleton with a phenol group substituted at C-5. Moreover, the HMBC cross peaks from H3-14 to C-10/C-12, H-11/H-12 to C-13, and H-10 to C-13 combined with the downfield shifted of H-10 and C-10 (δH 4.51; δC 88.7) further confirmed a γ-lactone ring, which was connected to C-2 on the basis of the correlation from H-10/H-11 to C-2. Finally, the correlation between H2-9 and H-4 suggested the etherification from the hydroxymethyl to C-4, which was also supported by the degrees of unsaturation. Hence, the planar structure of 1 was established as shown in Figure 1.
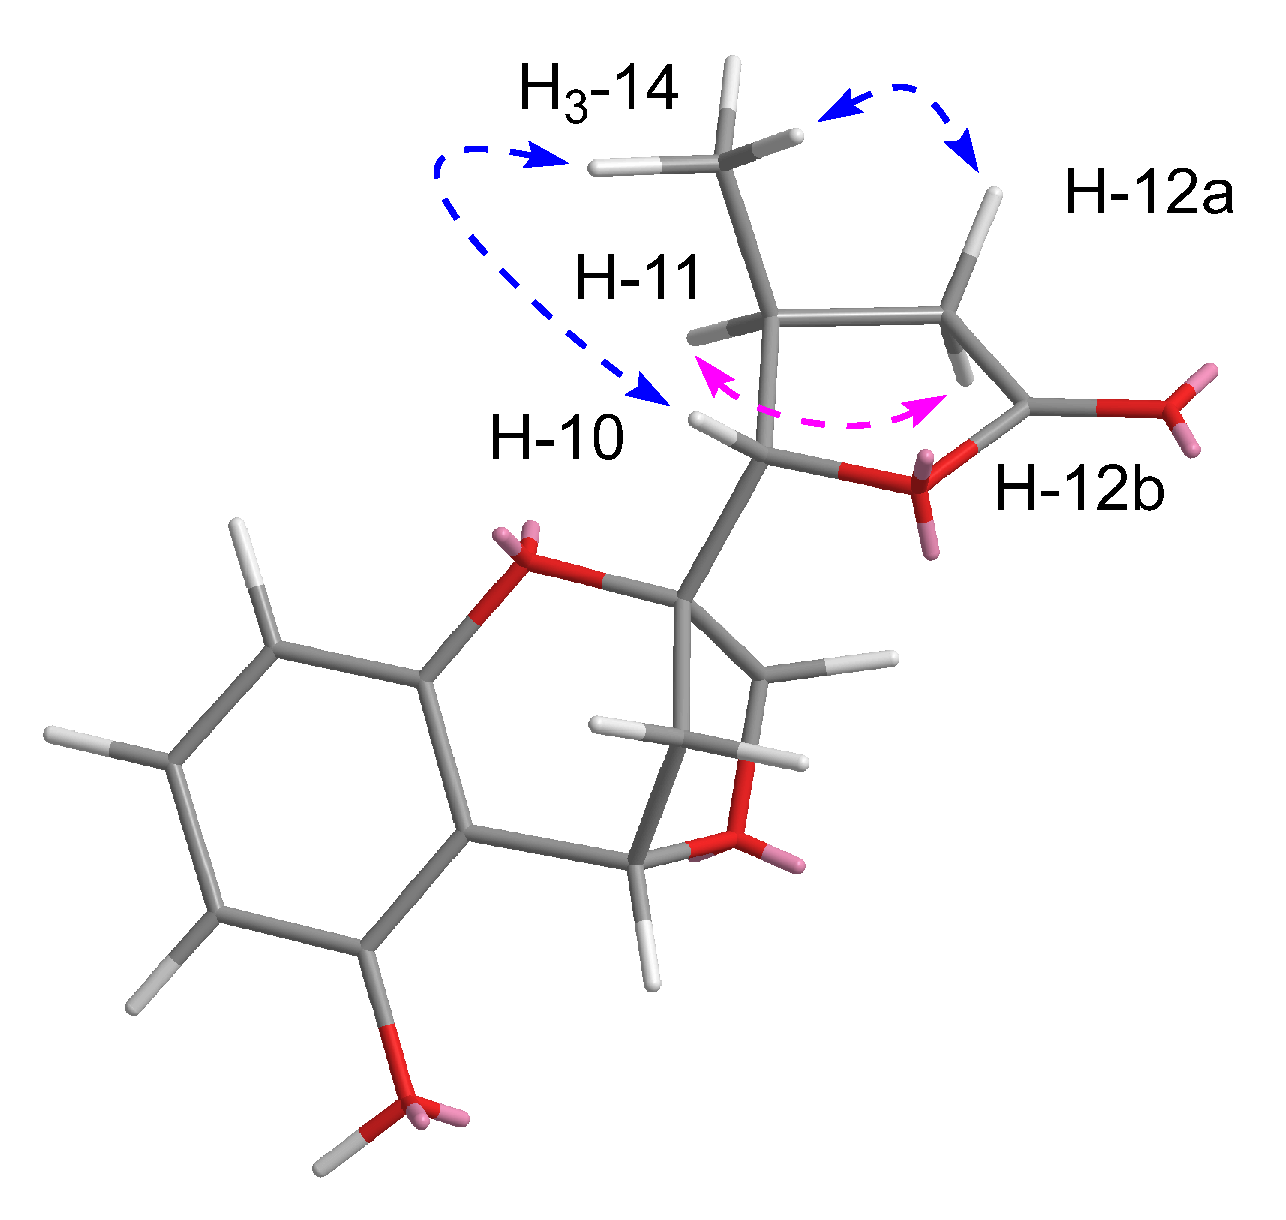
The relative configuration between C-10 and C-11 position was deduced by the rotating overhauser effect spectroscopy (ROESY) data. The cross-peaks (Figure 3) of H-10/H3-14/H-12a and H-11/H-12b suggested the trans configuration of H-10 and H-11. However, due to the lack of ROESY effects between H-4and H2-9, the relative configurations of C-2 and C-4 could not be identified unambiguously.
In order to establish the complete relative configuration, the quantum chemical calculations of the NMR data of the possible diastereomers, 1a and 1b, were performed. Initially, an exhaustive conformation searching was conducted by Merck Molecular Force Field (MMFF) in Spartan′16 (Wavenfunction, Irvine, CA, USA). Conformers with energy less than 10 kcal mol−1 energy window were generated and reoptimized using DFT (Density Functional Theory) calculations at the b3lyp/6-31+g (d, p) level. Frequency calculations were performed at the same level to confirm that each optimized conformer was true minimum and to estimate their relative thermal free energy (ΔG) at 298.15 K.
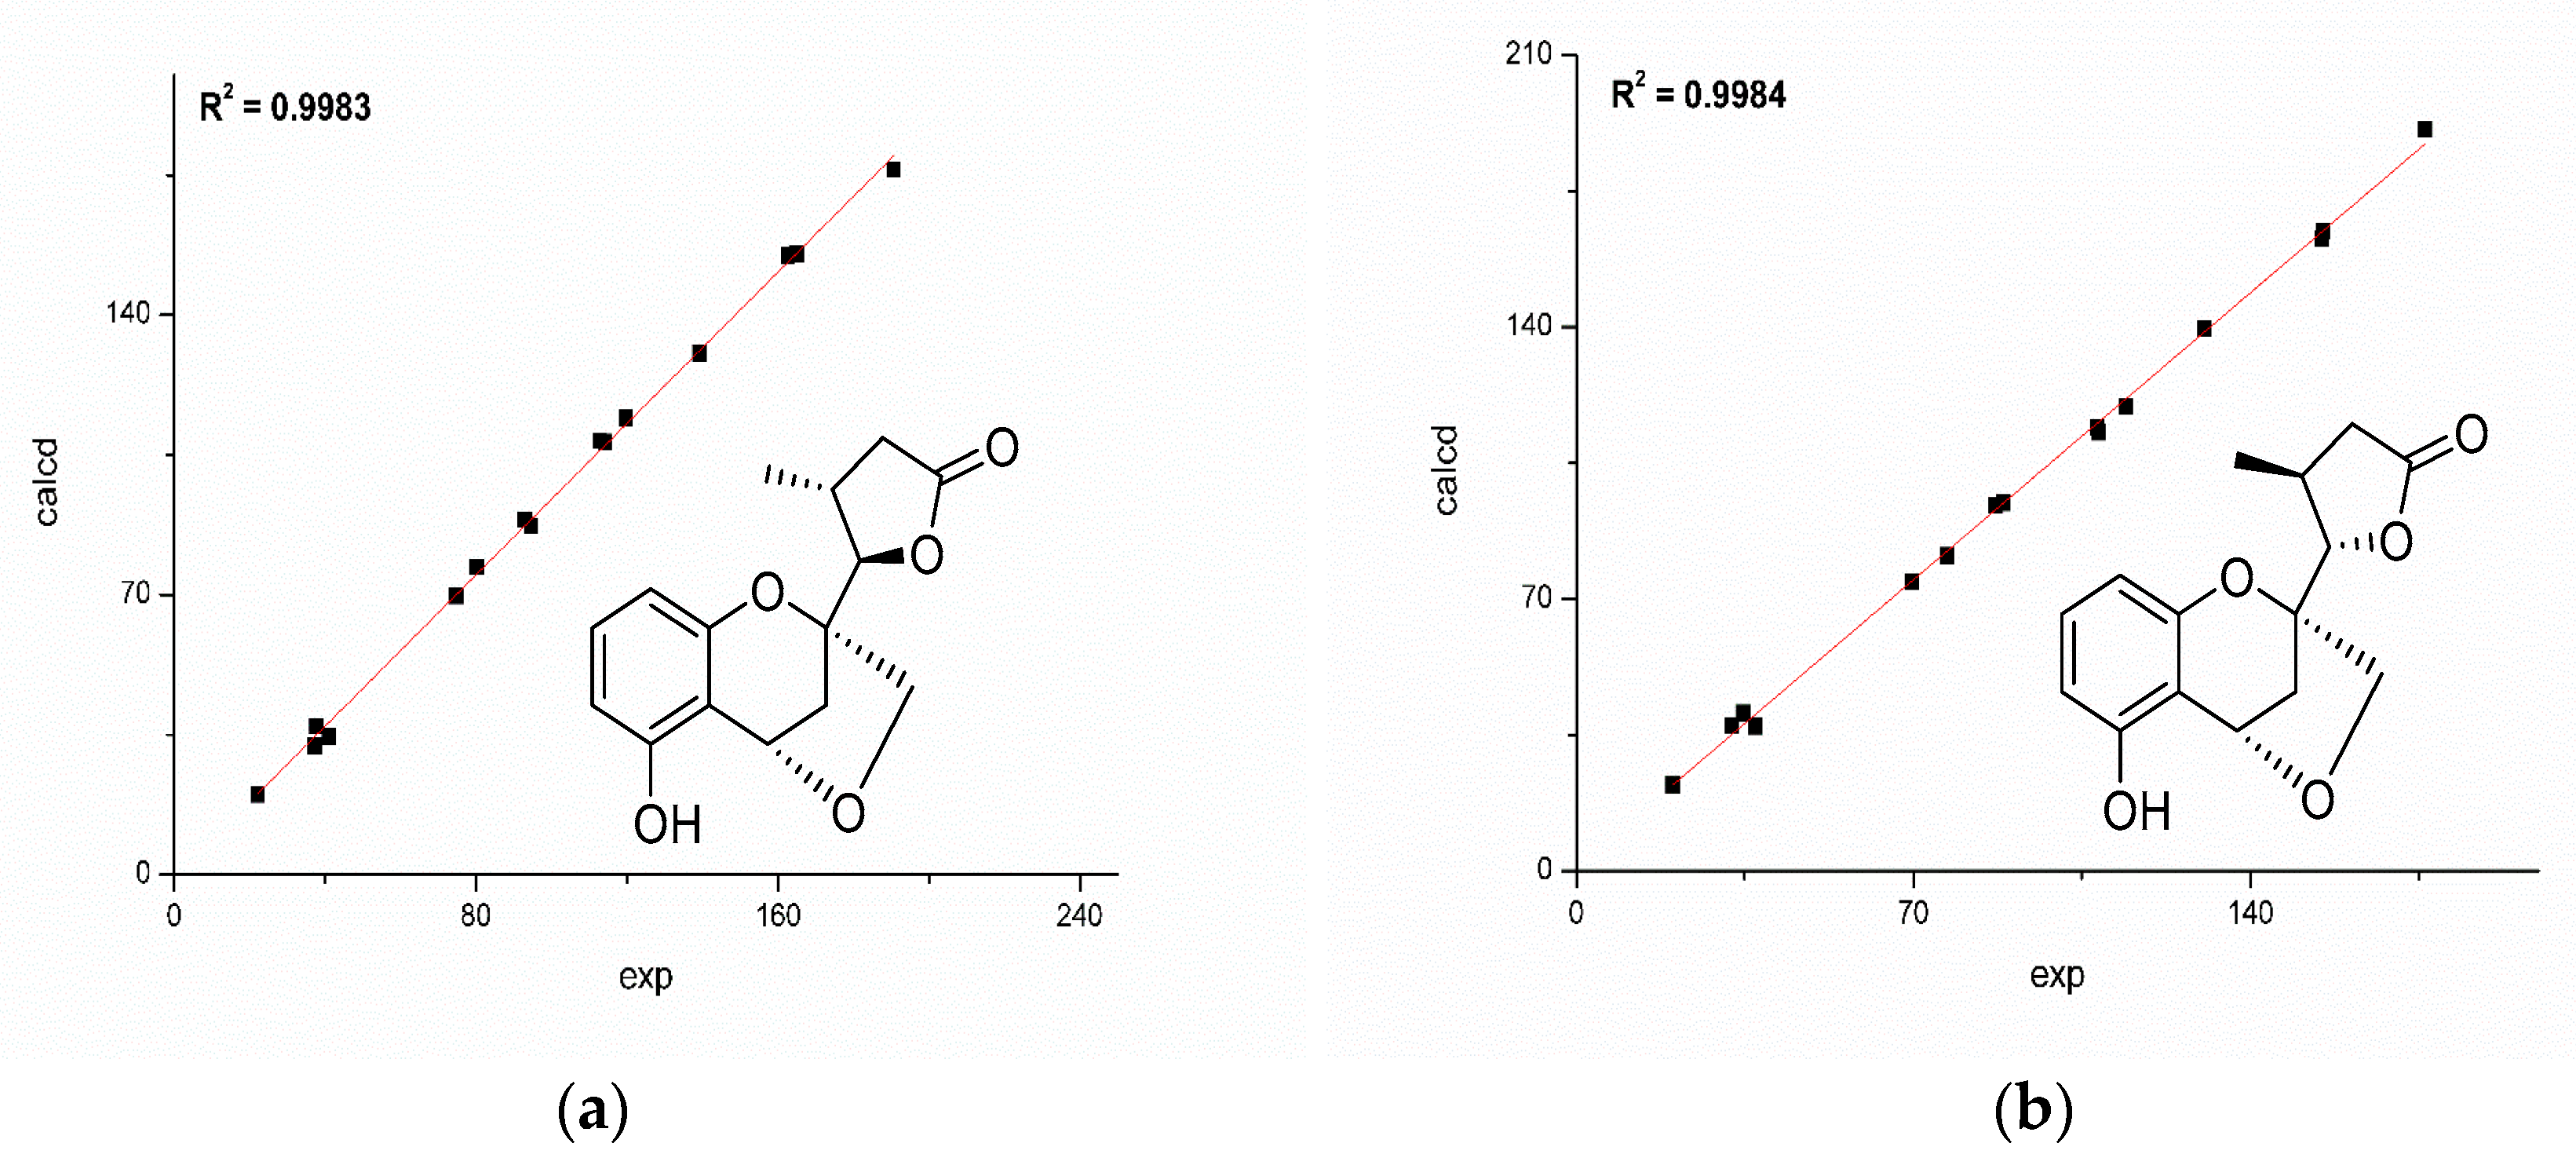
The reoptimized conformers were further subjected to 13C-NMR chemical shifts at the mPW1PW91-SCRF/6-311+G (d, p) level in acetone. The result indicated that both 1a and 1b shared similar correlation coefficients (R2: 1a 0.9983; 1b 0.9984, Figure 4), but the DP4+ (carbon data) simulation suggested 1b should be the true candidate with 74.12% probability compared with those of 1a (22.88% probability). Besides, 1a exhibited a mean absolute error (MAE) value of 1.6 ppm, while 1b showed a slightly better value of 1.5 ppm.
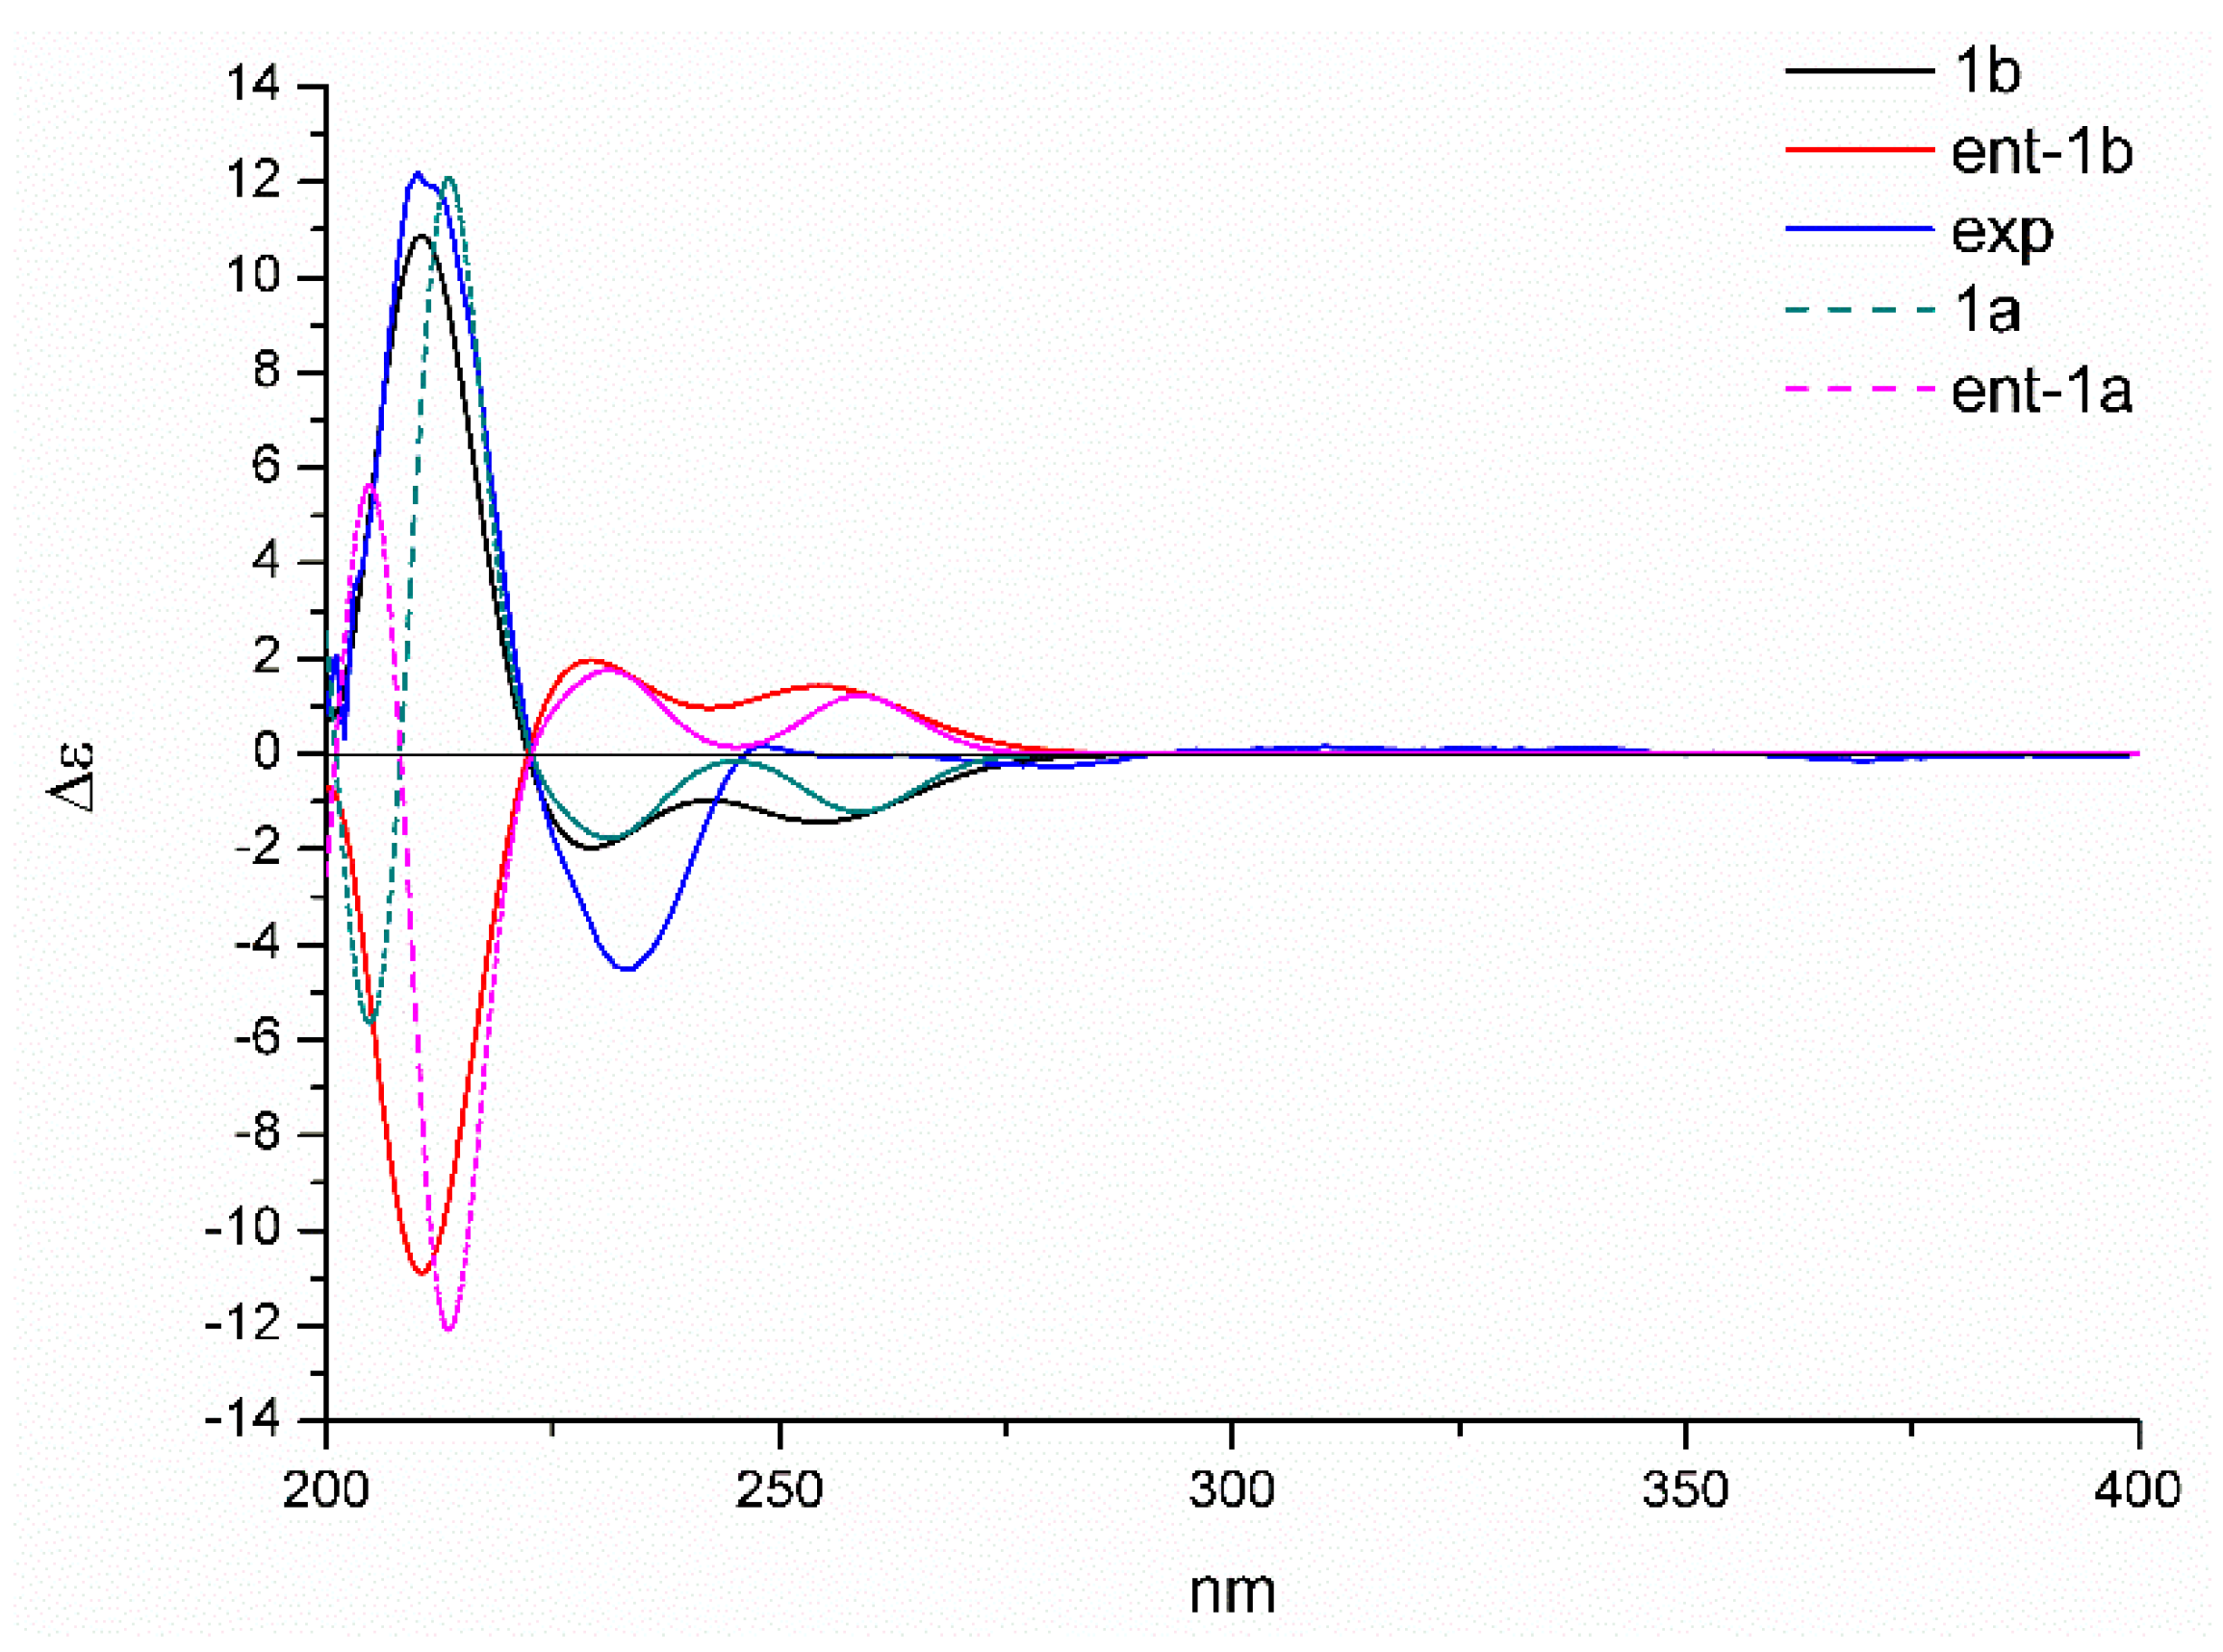
Moreover, the absolute configuration could be established by the electron capture detection (ECD) calculation. The reoptimized conformers in the previous NMR calculations were selected, and the theoretical spectra of 1a/ent-1a and 1b/ent-1b were generated at b3lyp/6-311+g (d, p) level. The result showed that the calculated plot of 2S,4S,10S,11S-1 (1b) gave the best agreement with the experimental spectrum (Figure 5), which exhibited the key positive Cotton effect at 210 nm and the negative Cotton effect at 230 nm. Hence, the absolute configuration of 1 was determined to be 2S,4S,10S,11S-1.
Compound 2 was obtained as white crystals. Its molecular formula was established to be C16H14O6 on the basis of HRESIMS at m/z 303.0866 [M + H]+ (calcd for 303.0869), indicating ten degrees of unsaturation. The UV absorption at 279 nm and IR peak at 1636 cm−1 suggested the existence of α, β-unsaturated carbonyl group. The 1H-NMR spectrum of 2 revealed a methine group at δH 8.08 (1H, s, H-2), a double bond at [δH 7.41 (1H, d, J = 16.1 Hz, H-11), 7.29 (1H, d, J = 16.1 Hz, H-10)], two meta-coupled aromatic protons at [δH 6.96 (1H, d, J = 2.4 Hz, H-6), 6.92 (1H, d, J = 2.4 Hz, H-8)], two methoxyl signals at at [δH 4.03 (3H, s, H3-15), 3.93 (3H, s, H3-13)], and a methyl signal at 2.35 (3H, s, H3-12). The 13C-NMR (Table 2) combined with HMBC spectra (Figure 2) of 2 revealed 16 carbon signals, including one methyl, two methoxyls, five sp2 methines, and eight quaternary carbons including three carbonyl carbons at δC at 198.7, 174.2, and 169.2. By comparing the 1D-NMR data with those of diaporchromanones A–D, which were obtained as isomers from Diaporthe phaseolorum, compound 2 should have constructed a chromanone backbone but with a dehydrated side chain [18]. The 1H–1H COSY spectrum showed the presence of one coupling fragment, H-10/H-11. The HMBC correlations (Figure 2) from H-2 to C-3/C-4/C-8a, H-8 to C-7/C-8a, and H-6 to C-4a established the core structure of a chroman-4-one. Moreover, the HMBC cross peaks from H-6/H-15 to C-14 and H-13 to C-7 indicated a chroman-4-one skeleton, which was substituted with an ester group at C-5 and a methoxyl group at C-7. From H-9 to C-3/C-4, H-10 to C-3, a double bond was linked with C-3. Meanwhile, the geometry of the Δ9,10 was deduced to be E based on the large coupling constants (J = 16.1 Hz). Finally, according to the correlations from H-9/H-10/H3-12 to C-11, an acetyl was elucidated. The above mentioned data led to the establishment of the structure of 2.
Compound 3 was isolated as a yellow oil. Its molecular formula was established to be C17H12O7 on the basis of HRESIMS at m/z 327.0514 [M − H]− (calcd for 327.0504), indicating twelve degrees of unsaturation. UV spectrum exhibited an obvious absorption band at 434 nm, indicating a large conjugated system in 3. The 1H-NMR spectrum (Table 3) of 3 revealed two phenol signals at [δH 12.12 (1H, br s, 1-OH), 12.12 (1H, br s, 9-OH)], an aromatic ring system present at [δH 7.63 (1H, br s, H-2), 7.31 (1H, br s, H-4)], and [δH 7.12 (1H, d, J = 2.4 Hz, H-6), 6.58 (1H, d, J = 2.4 Hz, H-8)], and one methyl signal at δH 2.14 (3H, s, H-13). The 13C-NMR (Table 3) and the HMBC spectra (Figure 2) of 3 revealed 17 carbon signals, one methyl, one sp3 methylenes, four sp2 methines, and eleven quaternary carbons including three carbonyl carbons at δC 189.4, 181.3, and 170.2. The key HMBC 3J correlations from H-4, H-6 to C-5, H-2/H-4 to C-10a, H-8 to C-6/C-9a along with weak 4J signal from H-4 to C-10 helped define the central anthracene-9,10-dione ring. The relations from H-11 to C-3/C-12 and H3-13 to C-12 established the fragment of methyl acetate at C-3. Moreover, the characteristic downfield chemical shifts of 1-OH and 9-OH (δH 12.12 ppm) suggested the substituted location at C-1 and C-9, forming hydrogen bonds with the carbonyl carbon (C-10).
2.2. Cytotoxicity Activity
Compounds 1–6 were evaluated for their cytotoxicities against four human cancer cell lines: SF-268, MCF-7, HepG-2, and A549. Compound 4 was found to exhibit significant effects against MCF-7, HepG-2, and A549, with IC50 values of 2.60, 2.55, and 4.64 μM, respectively (Table 4).
3. Materials and Methods
3.1. General Experimental Procedures
UV spectra were recorded on a Shimadzu UV-2600 spectrophotometer (Shimadzu, Kyoto, Japan). IR data were acquired on a Shimadzu IR Affinity-1 spectrometer (Shimadzu, Kyoto, Japan). 1D- and 2D-NMR spectra were obtained on a Bruker AVANCE IIITM HD 600 MHz NMR spectrometer (Bruker, Fällanden, Switzerland) using TMS as an internal standard. HRESIMS and electrospray ionization-mass spectrometry (ESIMS) data were measured, respectively, on a Thermo MAT95XP high resolution mass spectrometer (Thermo Fisher Scientific, Bremen, Germany) and an Agilent Technologies 1290-6430A Triple Quad LC/MS (Agilent Technologies, Palo Alto, CA, USA). Optical rotations were obtained on an Anton Paar MCP-500 spectropolarimeter (Anton Paar, Graz, Austria) with MeOH as solvent at 25 °C. CD spectra were determined using a Jasco 820 spectropolarimeter (Jasco Corporation, Kyoto, Japan). Preparative HPLC collection used a C18 column (YMC-pack ODS-A, 250 × 20 mm, 5 µm, 12 nm, YMC Co., Ltd., Kyoto, Japan). Semipreparative HPLC separations were performed utilizing a C18 column (YMC-pack ODS-A/AQ, 250 × 10 mm, 5 µm, 12 nm, YMC CO., Ltd., Kyoto, Japan). Column chromatography (CC) was performed on silica gel (200–300 mesh, Qingdao Marine Chemical Inc., Qingdao, China) and Sephadex LH-20 (Amersham Biosciences, Uppsala, Sweden). Solvents for isolation were analytical grade (Guangzhou Chemical Regents Company, Ltd., Guangzhou, China). TLC spots were visualized under UV light and by dipping into 10% H2SO4 in alcohol followed by heating.
3.2. Fungal Material
The fungal strain FS431 was isolated from a marine sediment sample collected from the Indian Ocean (depth 3605 m, 7°57.75944′ N, 89°19.43851′ E) in March 2016 and identified as Diaporthe phaseolorum based on sequencing of the internal transcribed spacer (ITS) region (Accession No.MK459544) with 99% similarity to Diaporthe phaseolorum MJ14 (Accession No.KM203581). The strain was deposited at the Guangdong Provincial Key Laboratory of Microbial Culture Collection and Application, Guangdong Institute of Microbiology.
3.3. Fermentation and Extraction
D. phaseolorum FS431 was cultured for 5 days at 28 °C in a potato dextrose agar (PDA) culture plate. The mycelial plugs were transferred to ten 500 mL Erlenmeyer flasks, each containing 250 mL potato dextrose broth (20% potato, 2% glucose, 0.3% KH2PO4, 0.15% MgSO4·7H2O, and 250 mL water with 1.5% sea salt), and then incubated on a rotary shaker at 120 r/m and 28 °C for 4 days as seed cultures. After that, each of the seed cultures (20 mL) was transferred into autoclaved 3 L Erlenmeyer flasks (total of 10 bottles), each containing 480 g of rice and 600 mL of 3% saline water. All flasks were incubated statically at room temperature for 30 days.
3.4. Isolation and Purification
The fermented rice substrate was extracted three times with ethyl acetate (EtOAc), and the combined EtOAc layers were evaporated to dryness under vacuum to afford the EtOAc extract (122.7 g). The EtOAc extract was chromatographed on a silica gel (200–300 mesh) column eluted with a step gradient of petroleum ether (PE)–EtOAc (v/v 30:1, 20:1, 10:1, 5:1, 2:1, 1:1, 0:1) and CH2Cl2–MeOH (v/v 20:1, 10:1, 5:1) to give 10 fractions (Fr. 1–Fr. 10). Fr. 6 was chromatographed by ODS column chromatography using gradient elution of H2O–MeOH (30–100%) to give 7 subfractions (Fr. 6.1–Fr. 6.7). Fr. 6.3 was purified by silica gel flash column chromatography (PE/EtOAc v/v 10:1–2:1) to yield 4 fractions (Fr. 6.3.1–Fr. 6.3.4). Fr. 6.3.4 was subjected to CC on Sephadex LH-20 (CH2Cl2/MeOH v/v, 1:1,) and semiprep-HPLC (MeOH/H2O v/v, 50:50, 3 mL/min) to give compound 1 (3.3 mg, tR = 9.2 min) and 6 (10.5 mg, tR = 11.8 min). Fr. 6.6 was purified by silica gel flash column chromatography (PE/CH2Cl2 v/v 5:1–1:1) to yield 4 fractions (Fr. 6.6.1–Fr. 6.6.4). Fr. 6.6.2 was purified by Sephadex LH-20 (CH2Cl2/MeOH, 1:1, v/v) to yield compound 3 (5.3 mg). Fr. 6.6.4 was purified by Sephadex LH-20 (CH2Cl2/MeOH, 1:1, v/v) to yield 2 fractions (Fr. 6.6.4.1–Fr. 6.6.4.2), and Fr. 6.6.4.1 was further purified by semiprep-HPLC (MeOH/H2O v/v 60:40, 3 mL/min) to yield compound 2 (3.2 mg, tR = 20.5 min). Fr. 6.6.4.2 was purified by semiprep-HPLC (MeOH/H2O, 70:30, v/v, 3 mL/min) to yield compound 7 (3.2 mg, tR = 13 min). Fr. 6.7 was purified by silica gel flash column chromatography (PE/CH2Cl2 v/v 20:1–5:1) to yield (Fr. 6.7.1–Fr. 6.7.2). Fr. 6.7.2 was then purified by semiprep-HPLC (MeOH/H2O v/v 90:10, 3 mL/min) to yield compound 4 (23.0 mg, tR = 6.3 min) and compound 5 (7.4 mg, tR = 7.3 min).
3.5. Quantum Chemical Calculation of NMR Chemical Shifts and ECD Spectra
MMFF and DFT/TD-DFT calculations were carried out using the Spartan′14 software (Wavefunction Inc., Irvine, CA, USA) and the Gaussian 09 program, respectively. Conformers that had an energy window lower the 5 kcal·mol−1 were generated and optimized using DFT calculations at the b3lyp/6-31+g (d, p) level. Frequency calculations were performed at the same level to confirm that each optimized conformer was true minimum and to estimate their relative thermal free energy (ΔG) at 298.15 K. Conformers with the Boltzmann distribution over 2% were chosen for 13C-NMR and ECD calculations at mPW1PW91/6-311+g (d, p) and b3lyp/6-311+g (d, p) level, respectively. Additionally, solvent effects were considered based on the self-consistent reaction field (SCRF) method with the polarizable continuum model (PCM). Details of the conformers’ information were provided in Supporting Information. The ECD spectrum was generated by the SpecDis program using a Gaussian band shape with 0.22 eV exponential half-width from dipole-length dipolar and rotational strengths. The DP4+ probability simulations were conducted using an applet available at http://www-jmg.ch.cam.ac.uk/tools/nmr/DP4/.
3.6. Cytotoxic Activity Assay
Cytotoxicity of compounds (1–6) were assayed against four tumor cell lines, including SF-268 (human glioma cell line), MCF-7 (human breast adenocarcinoma cell line), HepG-2 (human liver cell line), and A549 (human lung cancer cell line). Assays were performed by the SRB method [19] with doxorubicin as the positive control. Cells (180 μL) with a density of 30,000 cells/mL of media were injected into 96-well plates and incubated at 37 °C for 24 h under 5% CO2. Then, tested compounds (20 μL) were added. After incubating for 72 h, cell monolayers were fixed with 50 μL trichloroacetic acid (w/v: 50%) and stained with 0.4% SRB (dissolved in 1% acetic acid) for 30 min. The monolayers were washed by 1% acetic acid three times to remove the unbound dye. Finally, the mixtures were dissolved in 200 µL Tris base solution (10 mM) and recorded the OD at 570 nm using a microplate reader. All data were obtained in triplicate.
3.7. Spectroscopic Data
Phaseolorin G (1): Yellow powder, [α = +35.4 (c 0.08, MeOH); UV (MeOH) λmax (log ε) 205 (3.49), 278 (2.28) nm; CD ∆ε (0.18 mg/mL, MeOH) λmax (∆ε) 210 (+12.2), 233 (-4.5), 248 (+0.2) nm; IR (KBr) νmax 3225, 2924, 1740, 1260 cm−1; 1H- and 13C-NMR data, see Table 1 and Supplementary Materials; (−)-HRESIMS m/z 275.0926 [M − H]− (calcd for C15H15O5 275.0919).
Phaseolorin H (2): White crystals, m.p. 289−291 °C; λmax (log ε) 207 (3.62), 279 (3.21) nm; IR (KBr) νmax 3225, 2920, 1636, 1260 cm−1; 1H- and 13C-NMR data, see Table 2 and Supplementary Materials; (+)-m/z 303.0866 [M + H]+ (calcd for C16H15O6 303.0869).
Phaseolorin I (3): Yellow oil, λmax (log ε) 222 (3.14), 265 (2.82), 286 (2.83), 434 (2.61) nm; IR (KBr) νmax 3300, 2922, 1609, 1260 cm−1; 1H- and 13C-NMR data, see Table 3 and Supplementary Materials; (−)-HRESIMS m/z 327.0514 [M − H]− (calcd for C17H11O7 327.0504).
4. Conclusions
The chemical investigation of the deep-sea derived fungus D. phaseolorum FS431 led to isolation of three new polyketides, named phaseolorin G-I (1–3), together with three known compounds (4–6). Their structures were elucidated by the detailed analysis of spectroscopic data and quantum chemical calculations. Compound 4 exhibited significant cytotoxic activities against MCF-7, HepG-2, and A549 cancer cell lines with IC50 values of 2.60, 2.55, and 4.64 µM, respectively. This study makes a contribution to the chemical diversities of polyketides from deep-sea derived fungi.
Supplementary Materials
The Supplementary Materials are available online. Figures S1–S24: HRESIMS, CD, UV, IR, 1D- and 2D-NMR spectra of compounds 1–3; Figures S25–S30: 1D-NMR spectra of compounds 4–6.
Author Contributions
Data curation, Z.L., Z.N.; Formal analysis, Z.L., H.-X.L.; Funding Acquisition, W.Z.; Investigation, Z.N., Z.L., Y.-C.C., and H.-H.L.; Project Administration, W.Z.; Resources, H.G. and S.-N.L.; Writing—Original Draft, Z.N.; Writing—Review & Editing, Z.L. and W.Z.; Supervision, Z.L. and W.Z.
Funding
This work was supported financially by the National Natural Science Foundation of China (41906106), Science and Technology Program of Guangzhou, China (201607020018), the Team Project of the Natural Science Foundation of Guangdong Province (2016A030312014), and the GDAS’ Project of Science and Technology Development (2019GDASYL-0103007).
Conflicts of Interest
The authors declare no conflicts of interest.
References
- Bugni, T.S.; Ireland, C.M. Marine-derived fungi: A chemically and biologically diverse group of microorganisms. Nat. Prod. Rep. 2004, 21, 143–163. [Google Scholar] [CrossRef] [PubMed]
- Rateb, M.E.; Ebel, R. Secondary metabolites of fungi from marine habitats. Nat. Prod. Rep. 2011, 28, 290. [Google Scholar] [CrossRef] [PubMed]
- Skropeta, D.; Wei, L. Recent advances in deep-sea natural products. Nat. Prod. Rep. 2014, 31, 999–1025. [Google Scholar] [CrossRef] [PubMed]
- Wang, W.; Liao, Y.; Zhang, B.; Gao, M.; Ke, W.; Li, F.; Shao, Z. Citrinin Monomer and Dimer Derivatives with Antibacterial and Cytotoxic Activities Isolated from the Deep Sea-Derived Fungus Penicillium citrinum NLG-S01-P1. Mar. Drugs 2019, 17, 46. [Google Scholar] [CrossRef] [PubMed]
- Pang, X.; Lin, X.; Yang, J.; Zhou, X.; Yang, B.; Wang, J.; Liu, Y. Spiro-Phthalides and Isocoumarins Isolated from the Marine-Sponge-Derived Fungus Setosphaeria sp. SCSIO41009. J. Nat. Prod. 2018, 81, 1860–1868. [Google Scholar] [CrossRef] [PubMed]
- Luo, X.W.; Yang, J.; Chen, F.M.; Lin, X.P.; Chen, C.M.; Zhou, X.F.; Liu, S.W.; Liu, Y.H. Structurally diverse polyketides from the mangrove-derived fungus Diaporthe sp. SCOSIC 41011 with their anti-influenza A virus activities. Front. Chem. 2018, 6, 1–10. [Google Scholar] [CrossRef] [PubMed]
- Chang, F.-R.; Wang, S.-W.; Li, C.-Y.; Lu, Y.-Y.; Liu, S.-Y.V.; Chen, C.-Y.; Wu, Y.-C.; Cheng, Y.-B. Natural Products from Diaporthe arecae with Anti-Angiogenic Activity. Isr. J. Chem. 2019, 59, 439–445. [Google Scholar] [CrossRef]
- Li, G.; Kusari, S.; Kusari, P.; Kayser, O.; Spiteller, M. Endophytic Diaporthe sp. LG23 produces a potent antibacterial tetracyclic triterpenoid. J. Nat. Prod. 2015, 78, 2128–2132. [Google Scholar] [CrossRef] [PubMed]
- Tian, W.; Liao, Z.; Zhou, M.; Wang, G.; Wu, Y.; Gao, S.; Qiu, D.; Liu, X.; Lin, T.; Chen, H. Cytoskyrin C, an unusual asymmetric bisanthraquinone with cage-like skeleton from the endophytic fungus Diaporthe sp. Fitoterapia 2018, 128, 253–257. [Google Scholar] [CrossRef] [PubMed]
- Zhang, C.W.; Ondeyka, J.G.; Herath, K.B.; Guan, Z.Q.; Collado, J.; Platas, G.; Pelaez, F.; Leavitt, P.S.; Gurnett, A.; Nare, B.; et al. Tenellones A and B from a Diaporthe sp.: Two highly substituted benzophenone inhibitors of parasite cGMP-dependent protein kinase activity. J. Nat. Prod. 2005, 68, 611–613. [Google Scholar] [CrossRef] [PubMed]
- Brady, S.F.; Wagenaar, M.M.; Singh, M.P.; Janso, J.E.; Clardy, J. The Cytosporones, New Octaketide Antibiotics Isolated from an Endophytic Fungus. Org. Lett. 2000, 2, 4043–4046. [Google Scholar] [CrossRef] [PubMed]
- Calcul, L.; Waterman, C.; Ma, W.S.; Lebar, M.D.; Harter, C.; Mutka, T.; Morton, L.; Maignan, P.; Olphen, A.; Kyle, D.E.; et al. Screening Mangrove Endophytic Fungi for Antimalarial Natural Products. Mar. Drugs 2013, 11, 5036–5050. [Google Scholar] [CrossRef] [PubMed]
- Hu, M.; Yang, X.Q.; Wan, C.P.; Wang, B.Y.; Yin, H.Y.; Shi, L.J.; Wu, Y.M.; Yang, Y.B.; Zhou, H.; Ding, Z.T. Potential antihyperlipidemic polyketones from endophytic Diaporthe sp. JC-J7 in Dendrobium nobile. RSC Adv. 2018, 8, 41810–41817. [Google Scholar] [CrossRef] [Green Version]
- Isaka, M.; Jaturapat, A.; Rukseree, K.; Danwisetkanjana, K.; Tanticharoen, M.; Thebtaranonth, Y. Phomoxanthones A and B, Novel Xanthone Dimers from the Endophytic FungusPhomopsisSpecies. J. Nat. Prod. 2001, 64, 1015–1018. [Google Scholar] [CrossRef] [PubMed]
- Wagenaar, M.M.; Clardy, J. Dicerandrols, new antibiotic and cytotoxic dimers produced by the fungus Phomopsis longicolla isolated from an endangered mint. J. Nat. Prod. 2001, 64, 1006–1009. [Google Scholar] [CrossRef] [PubMed]
- Zhang, L.-H.; He, F.-J.; Hua, H.-M.; Liu, B.; Wang, H.-F.; Liu, F.; Bai, J.; Chen, G.; Pei, Y.-H. Isolation of a New Compound from Penicillium oxalicum. Chem. Nat. Compd. 2016, 52, 821–823. [Google Scholar]
- Guo, H.; Liu, Z.-M.; Chen, Y.-C.; Tan, H.-B.; Li, S.-N.; Li, H.-H.; Gao, X.-X.; Liu, H.-X.; Zhang, W.-M. Chromone-Derived Polyketides from the Deep-Sea Fungus Diaporthe phaseolorum FS431. Mar. Drugs 2019, 17, 182. [Google Scholar] [CrossRef] [PubMed]
- Cui, H.; Liu, Y.N.; Li, J.; Huang, X.S.; Yan, T.; Cao, W.H.; Liu, H.J.; Long, Y.H.; She, Z.G. Diaporindenes A−D: Four unusual 2,3-dihydro-1H-indene analogues with anti-inflammatory activities from the mangrove endophytic fungus Diaporthe sp. SYSU-HQ3. J. Org. Chem. 2018, 83, 11804–11813. [Google Scholar] [CrossRef] [PubMed]
- Skehan, P.; Scudiero, D.; Vistica, D.; Bokesch, H.; Kenney, S.; Storeng, R.; Monks, A.; McMahon, J.; Warren, J.T.; Boyd, M.R. New Colorimetric Cytotoxicity Assay for Anticancer-Drug Screening. J. Natl. Cancer Inst. 1990, 82, 1107–1112. [Google Scholar] [CrossRef] [PubMed]
Sample Availability: Samples of the compounds 1–6 are available from the authors. |
Figure 1.
Chemical structures of compounds 1–6.

Figure 2.
Key 1H–1H COSY and HMBC correlations for compounds 1–3.
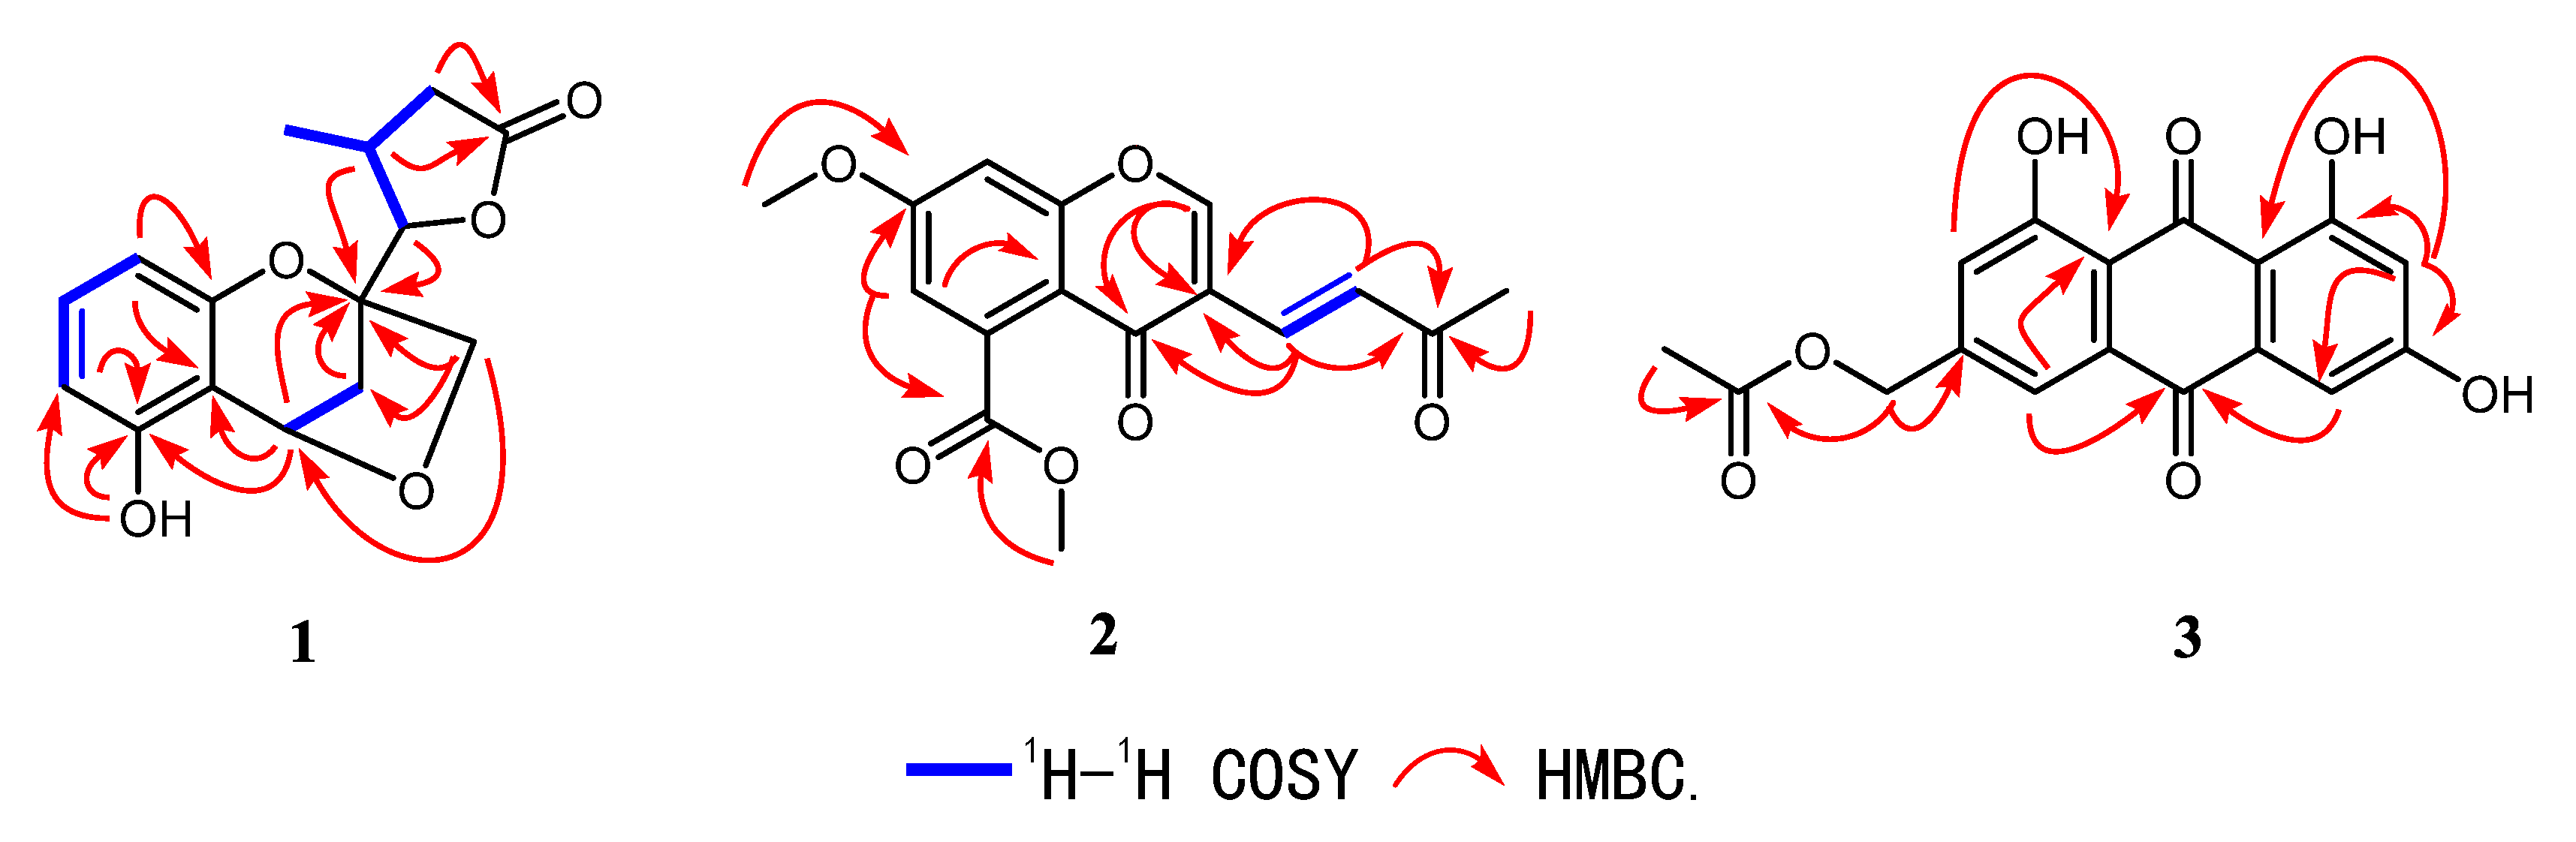
Figure 3.
Key rotating overhauser effect (ROE) correlations of compound 1.

Figure 4.
Correlations between experimental and calculated 13C-NMR chemical shifts of 1a (a) and 1b (b).
Figure 4.
Correlations between experimental and calculated 13C-NMR chemical shifts of 1a (a) and 1b (b).

Figure 5.
Calculated and experimental electron capture detection (ECD) spectra of 1 in methanol.


Table 1.
1H-NMR (600 MHz) and 13C-NMR (150 MHz) data for 1 in acetone-d6.
| No. | δH (J in Hz) | δC |
|---|---|---|
| 2 | 87.2, C | |
| 3a | 2.22 (1H, m) | 34.9, CH2 |
| 3b | 2.14 (1H, m) | |
| 4 | 5.44 (1H, d, 5.0) | 69.7, CH |
| 4a | 114.2, C | |
| 5 | 154.8, C | |
| 6 | 6.42 (1H, br d, 8.0) | 108.5, CH |
| 7 | 6.97 (1H, t, 8.1) | 130.4, CH |
| 8 | 6.31 (1H, br d, 8.0) | 108.2, CH |
| 8a | 155.2, C | |
| 9 | 4.05 (2H, s) | 77.0, CH2 |
| 10 | 4.51 (1H, d, 4.0) | 88.7, CH |
| 11 | 2.08 (1H, m) | 32.2, CH |
| 12a | 2.24 (1H, m) | 37.4, CH2 |
| 12b | 2.85 (1H, overlapped) | |
| 13 | 176.4, C | |
| 14 | 1.28 (3H, d, 6.1) | 20.0, CH3 |
| 5-OH | 8.59 (1H, br s) |
Table 2.
1H-NMR (600 MHz) and 13C-NMR (150 MHz) data for 2 in CDCl3.
| No. | δH (J in Hz) | δC |
|---|---|---|
| 2 | 8.08 (1H, s) | 156.5, CH |
| 3 | 119.6, C | |
| 4 | 174.2, C | |
| 4a | 114.8, C | |
| 5 | 135.3, C | |
| 6 | 6.96 (1H, d, 2.4) | 113.9, CH |
| 7 | 163.2, C | |
| 8 | 6.92 (1H, d, 2.4) | 101.8, CH |
| 8a | 157.3, C | |
| 9 | 7.29 (1H, d, 16.1) | 133.0, CH |
| 10 | 7.41 (1H, d, 16.1) | 129.7, CH |
| 11 | 198.7, C | |
| 12 | 2.35 (3H, s) | 28.6, CH3 |
| 13 | 3.93 (3H, s) | 56.2, CH3 |
| 14 | 169.2, C | |
| 15 | 4.03 (3H, s) | 53.2, CH3 |
Table 3.
1H-NMR (600 MHz) and 13C-NMR (150 MHz) data for 3 in DMSO-d6.
| Position | δH (J in Hz) | δC |
|---|---|---|
| 1 | 161.3, C | |
| 2 | 7.30 (1H, br s) | 122.3, CH |
| 3 | 145.6, C | |
| 4 | 7.63 (1H, br s) | 117.8, CH |
| 4a | 133.3, C | |
| 5 | 181.3, C | |
| 5a | 135.1, C | |
| 6 | 7.12 (1H, br d, 2.4) | 109.2, CH |
| 7 | 166.2, C | |
| 8 | 6.58 (1H, br d, 2.4) | 108.0, CH |
| 9 | 164.6, C | |
| 9a | 108.9, C | |
| 10 | 189.4, C | |
| 10a | 115.1, C | |
| 11 | 5.18 (2H, s) | 64.2, CH2 |
| 12 | 170.2, C | |
| 13 | 2.14 (3H, s) | 20.6, CH3 |
| 1-OH | 12.12 (1H, br s) | 161.3, C |
| 9-OH | 12.12 (1H, br s) |
Table 4.
IC50 (μM) of compounds 4–5 against four tumor cell lines.
| NO. | SF-268 | MCF-7 | HepG-2 | A549 |
|---|---|---|---|---|
| 4 | 37.86 ± 1.28 | 2.60 ± 0.28 | 2.55 ± 0.06 | 4.64 ± 0.30 |
| 5 | 45.26 ± 3.18 | 48.08 ± 1.55 | 49.58 ± 0.45 | 38.64 ± 1.42 |
| doxorubicin | 0.57 ± 0.04 | 0.95 ± 0.06 | 1.18 ± 0.15 | 0.70 ± 0.04 |
© 2019 by the authors. Licensee MDPI, Basel, Switzerland. This article is an open access article distributed under the terms and conditions of the Creative Commons Attribution (CC BY) license (http://creativecommons.org/licenses/by/4.0/).
Share and Cite
MDPI and ACS Style
Niu, Z.; Chen, Y.; Guo, H.; Li, S.-N.; Li, H.-H.; Liu, H.-X.; Liu, Z.; Zhang, W. Cytotoxic Polyketides from a Deep-Sea Sediment Derived Fungus Diaporthe phaseolorum FS431. Molecules 2019, 24, 3062. https://doi.org/10.3390/molecules24173062
AMA Style
Niu Z, Chen Y, Guo H, Li S-N, Li H-H, Liu H-X, Liu Z, Zhang W. Cytotoxic Polyketides from a Deep-Sea Sediment Derived Fungus Diaporthe phaseolorum FS431. Molecules. 2019; 24(17):3062. https://doi.org/10.3390/molecules24173062
Chicago/Turabian StyleNiu, Zheng, Yuchan Chen, Heng Guo, Sai-Ni Li, Hao-Hua Li, Hong-Xin Liu, Zhaoming Liu, and Weimin Zhang. 2019. "Cytotoxic Polyketides from a Deep-Sea Sediment Derived Fungus Diaporthe phaseolorum FS431" Molecules 24, no. 17: 3062. https://doi.org/10.3390/molecules24173062