
The Radiation Sterilization of Ertapenem Sodium in the Solid State


 ,
,  ,
,  , , , and
Abstract
:1. Introduction
2. Results
3. Discussion
4. Materials and Methods
4.1. Standards and Reagents
4.2. Irradiation
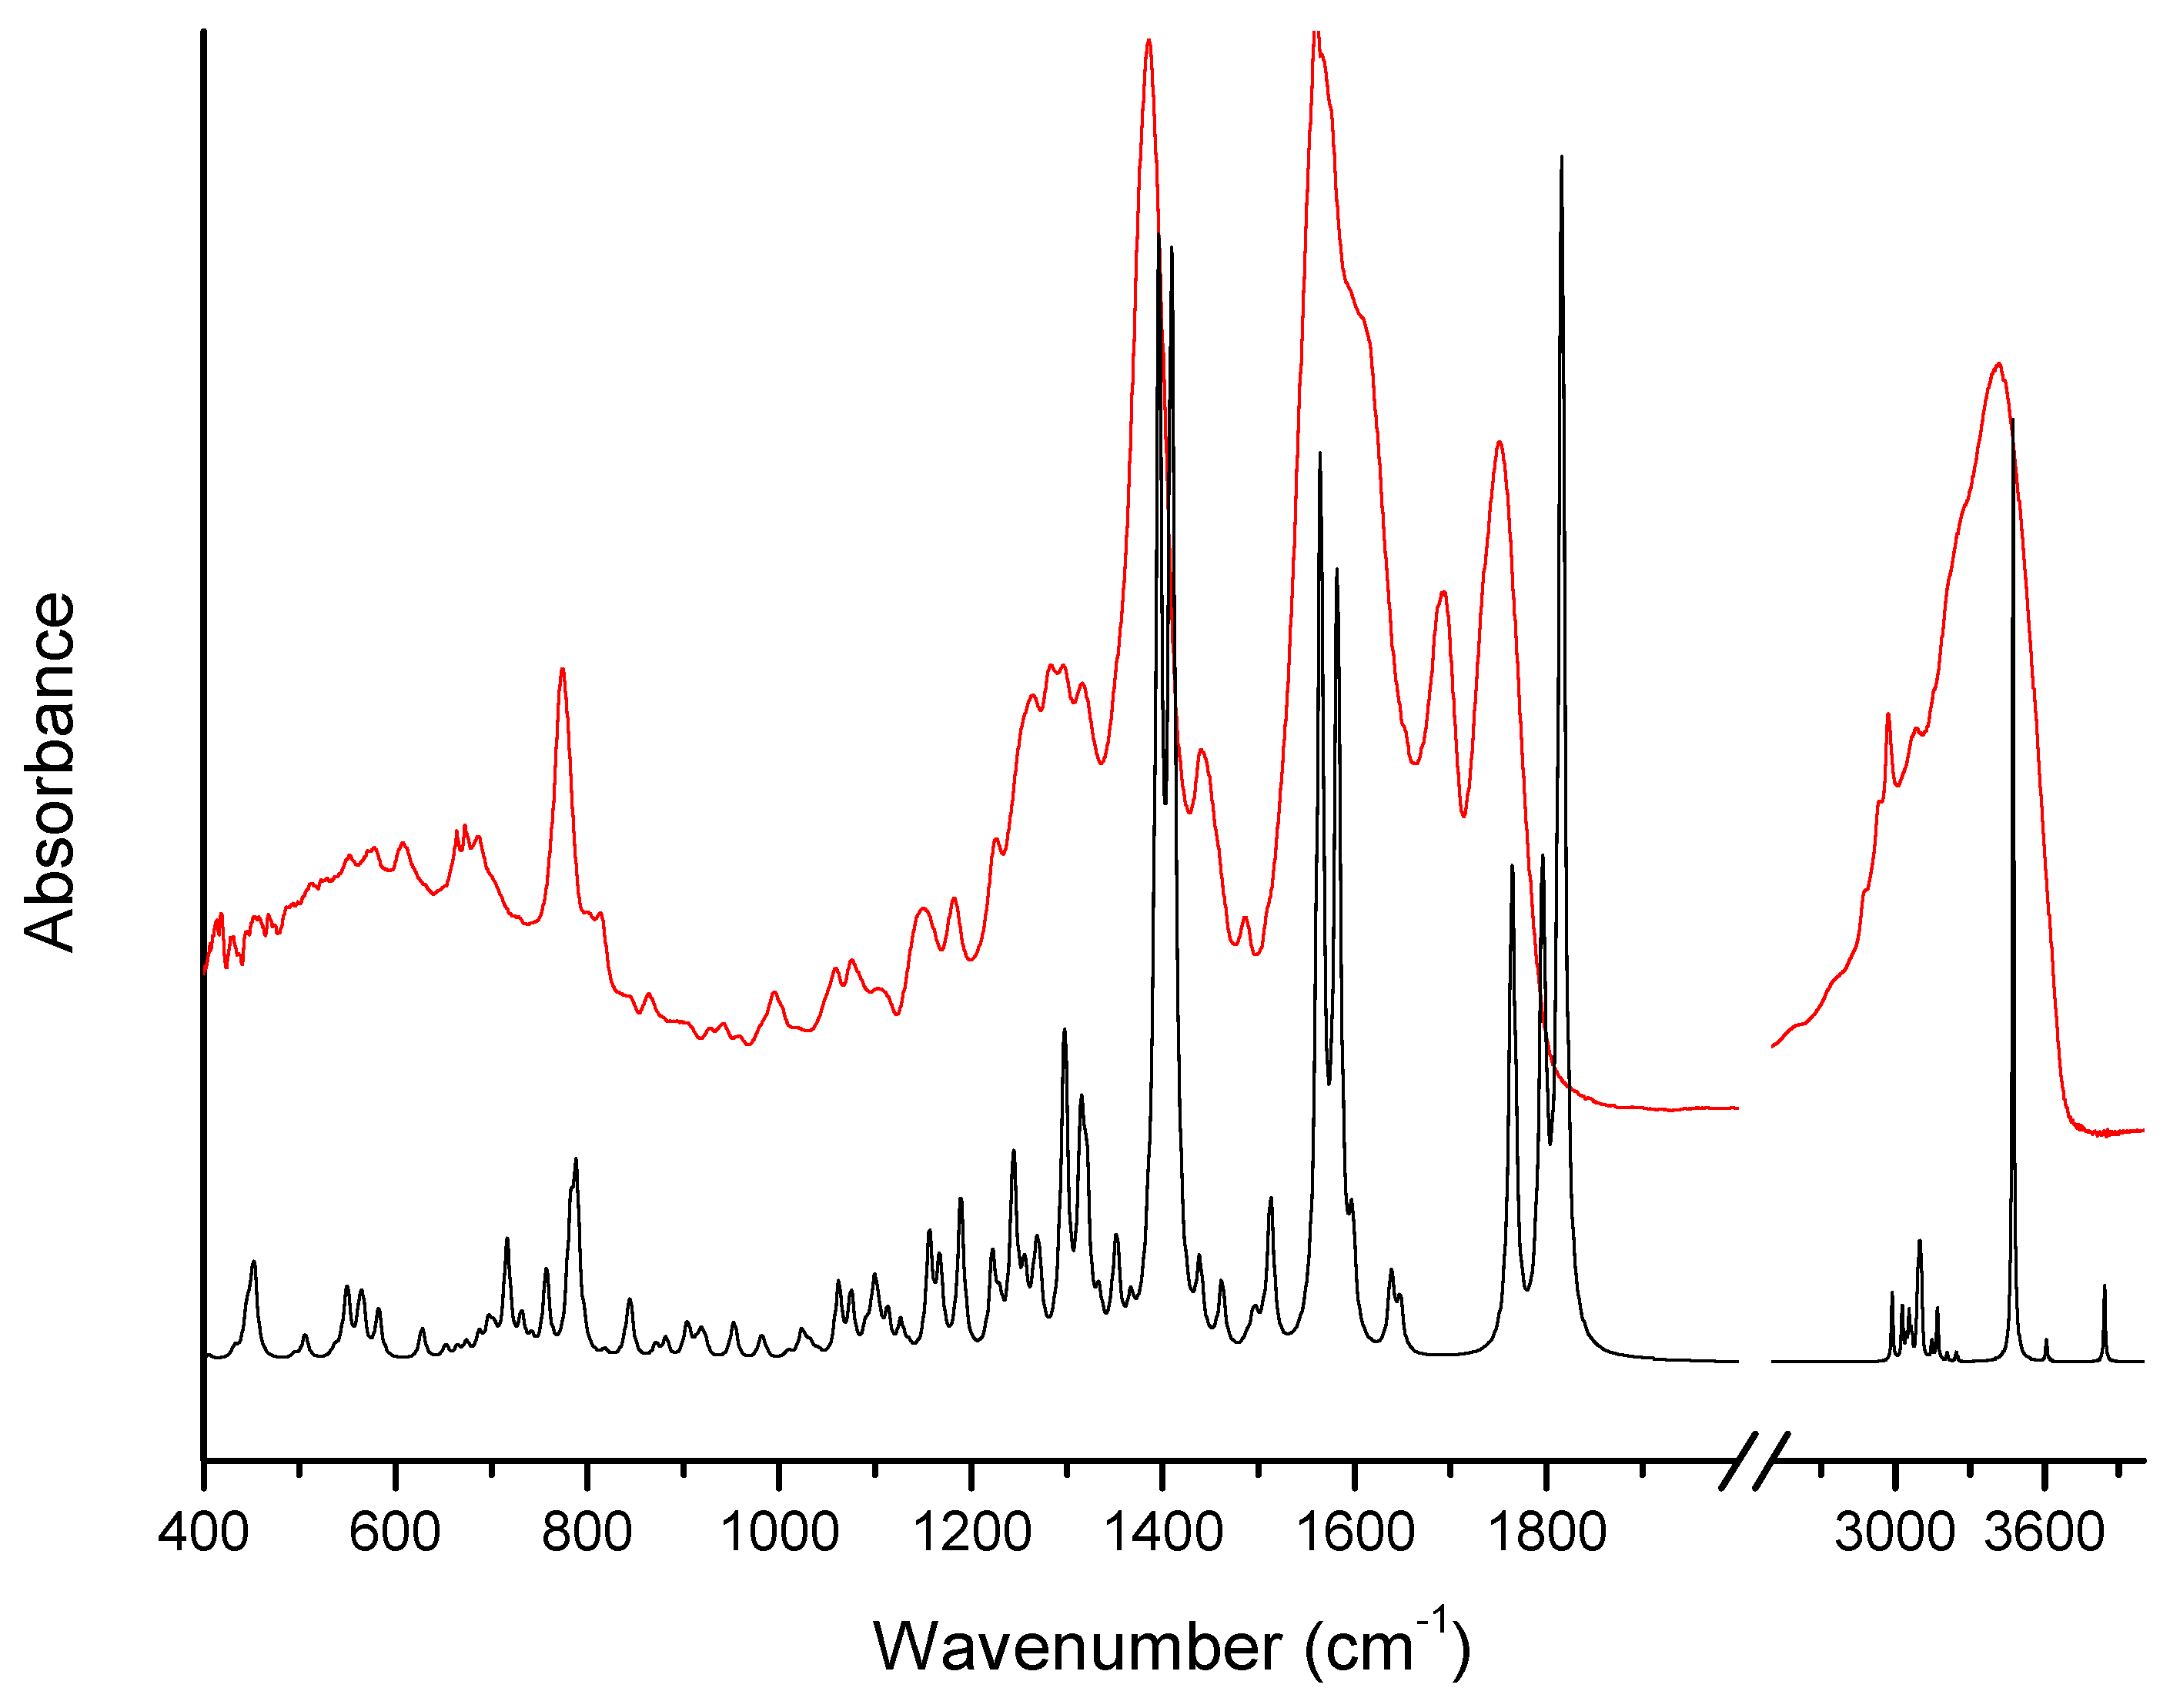
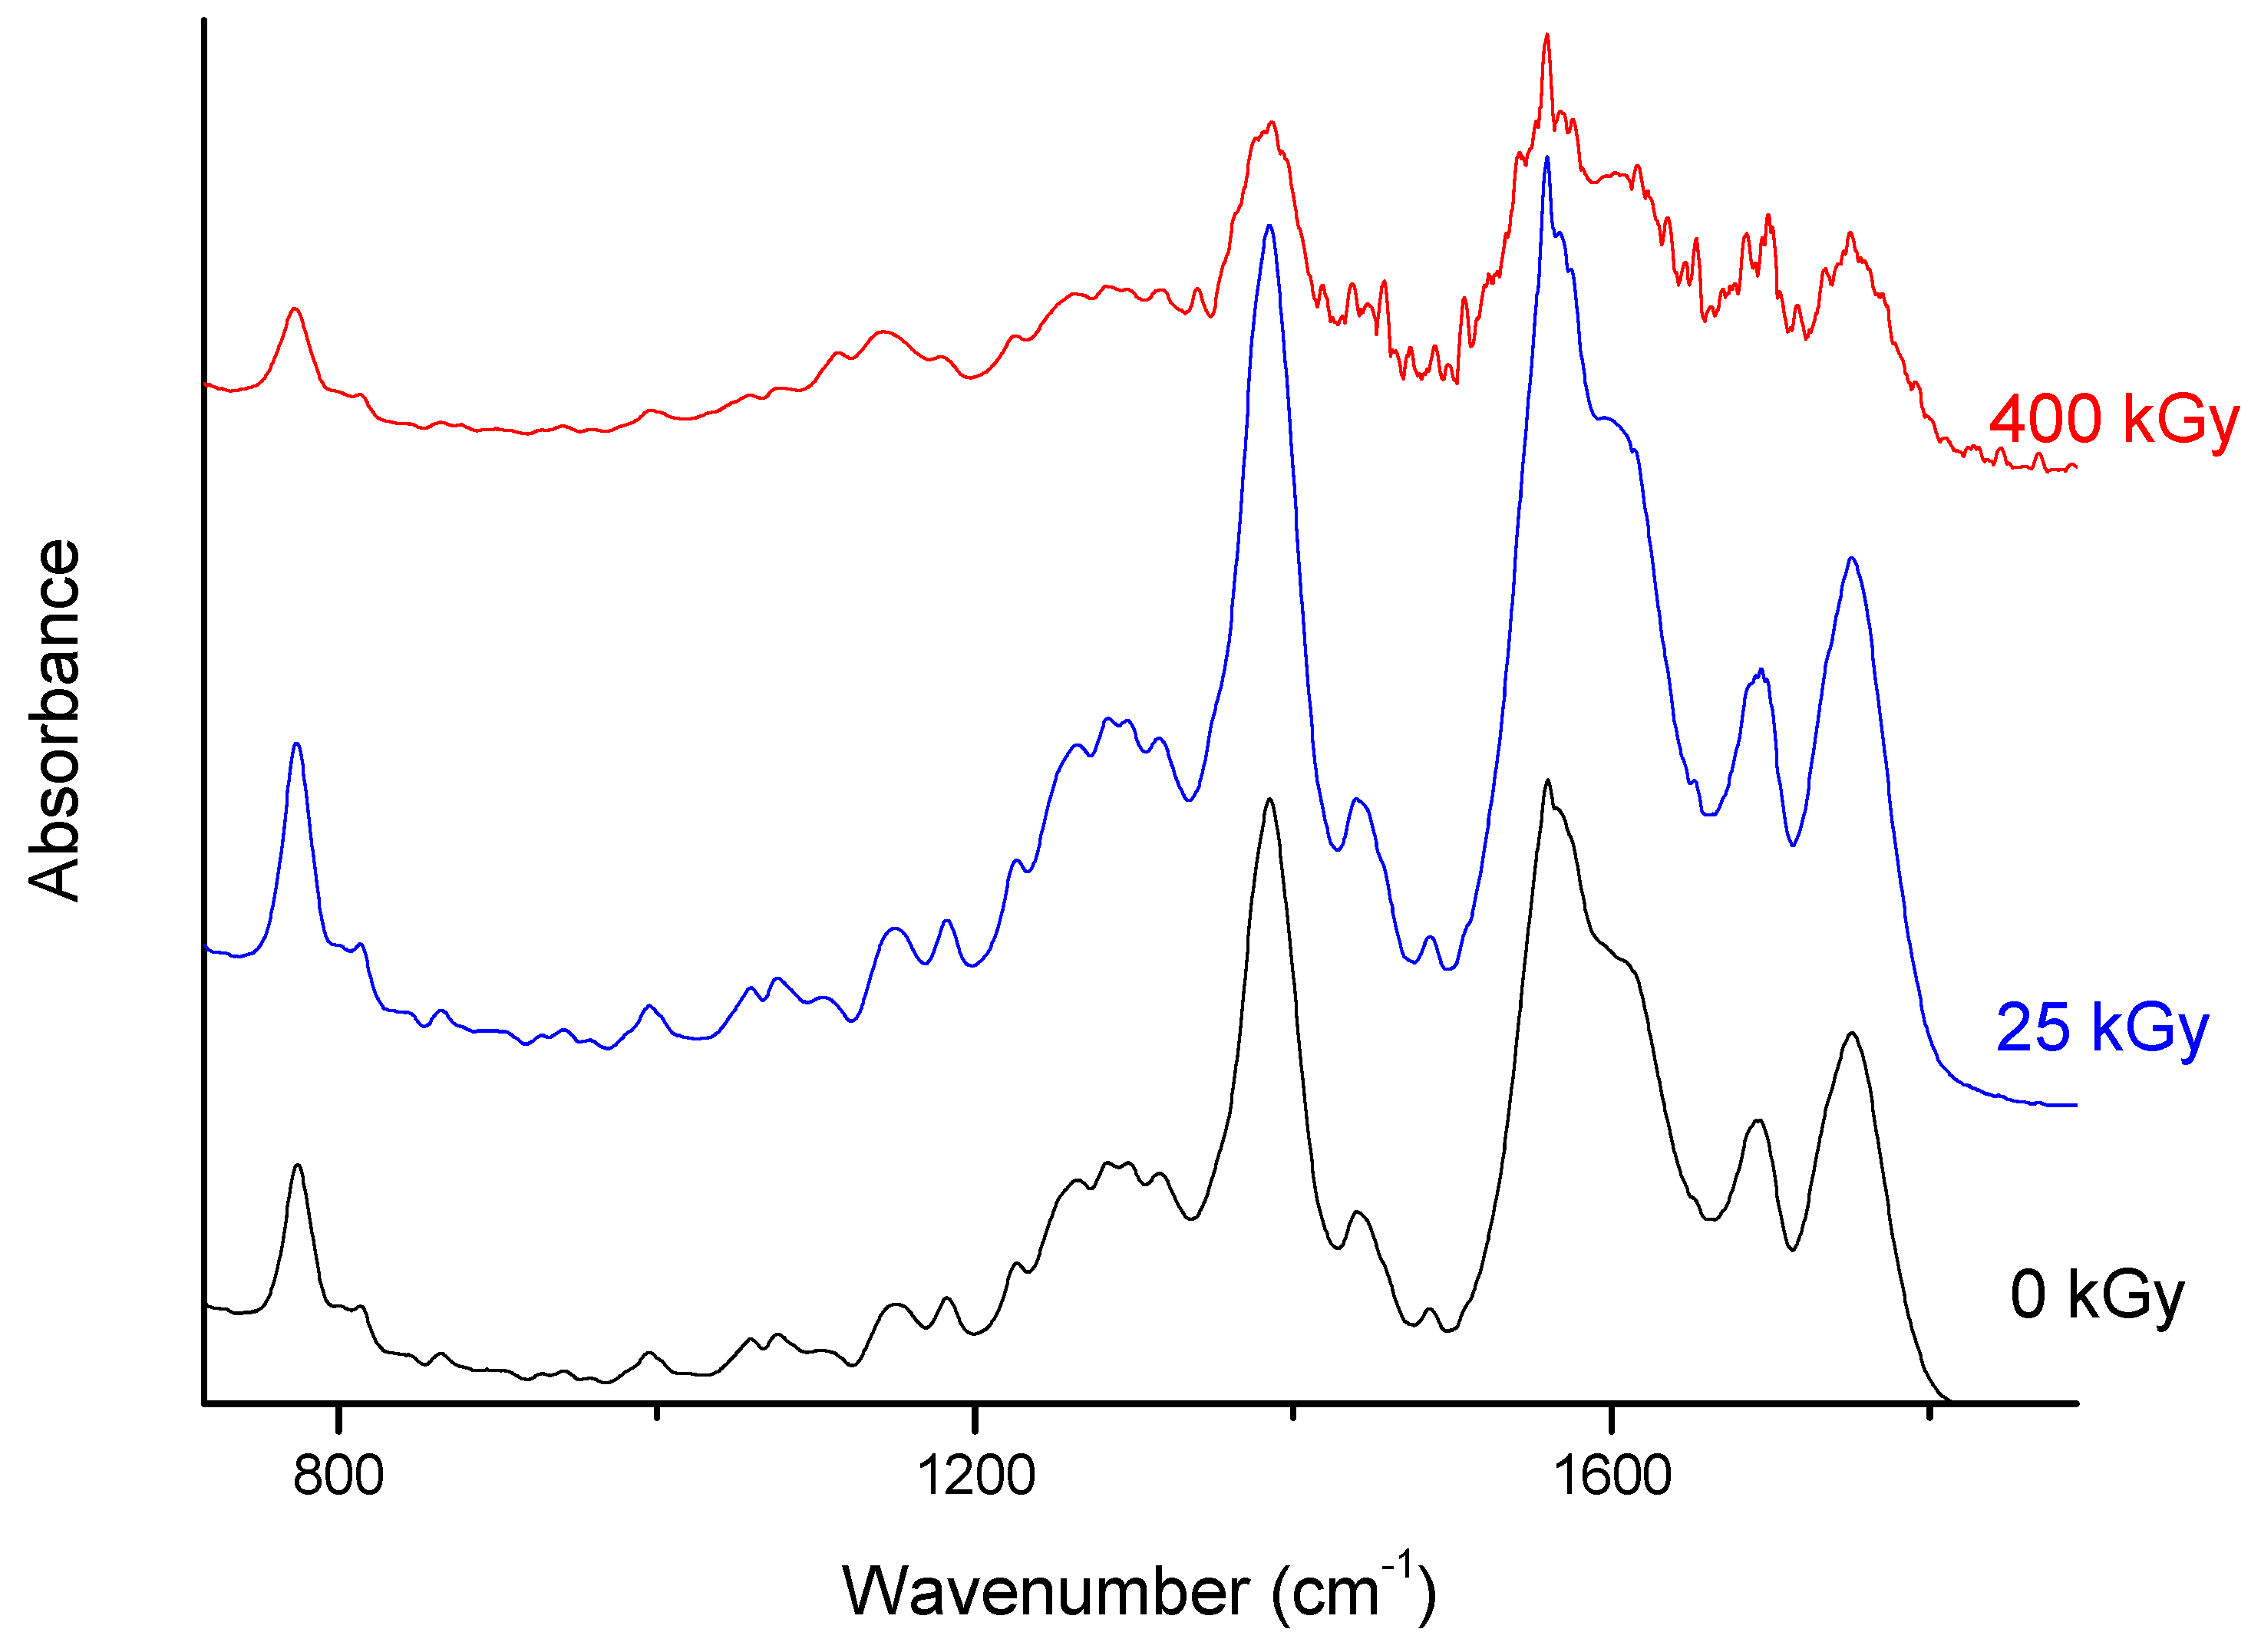
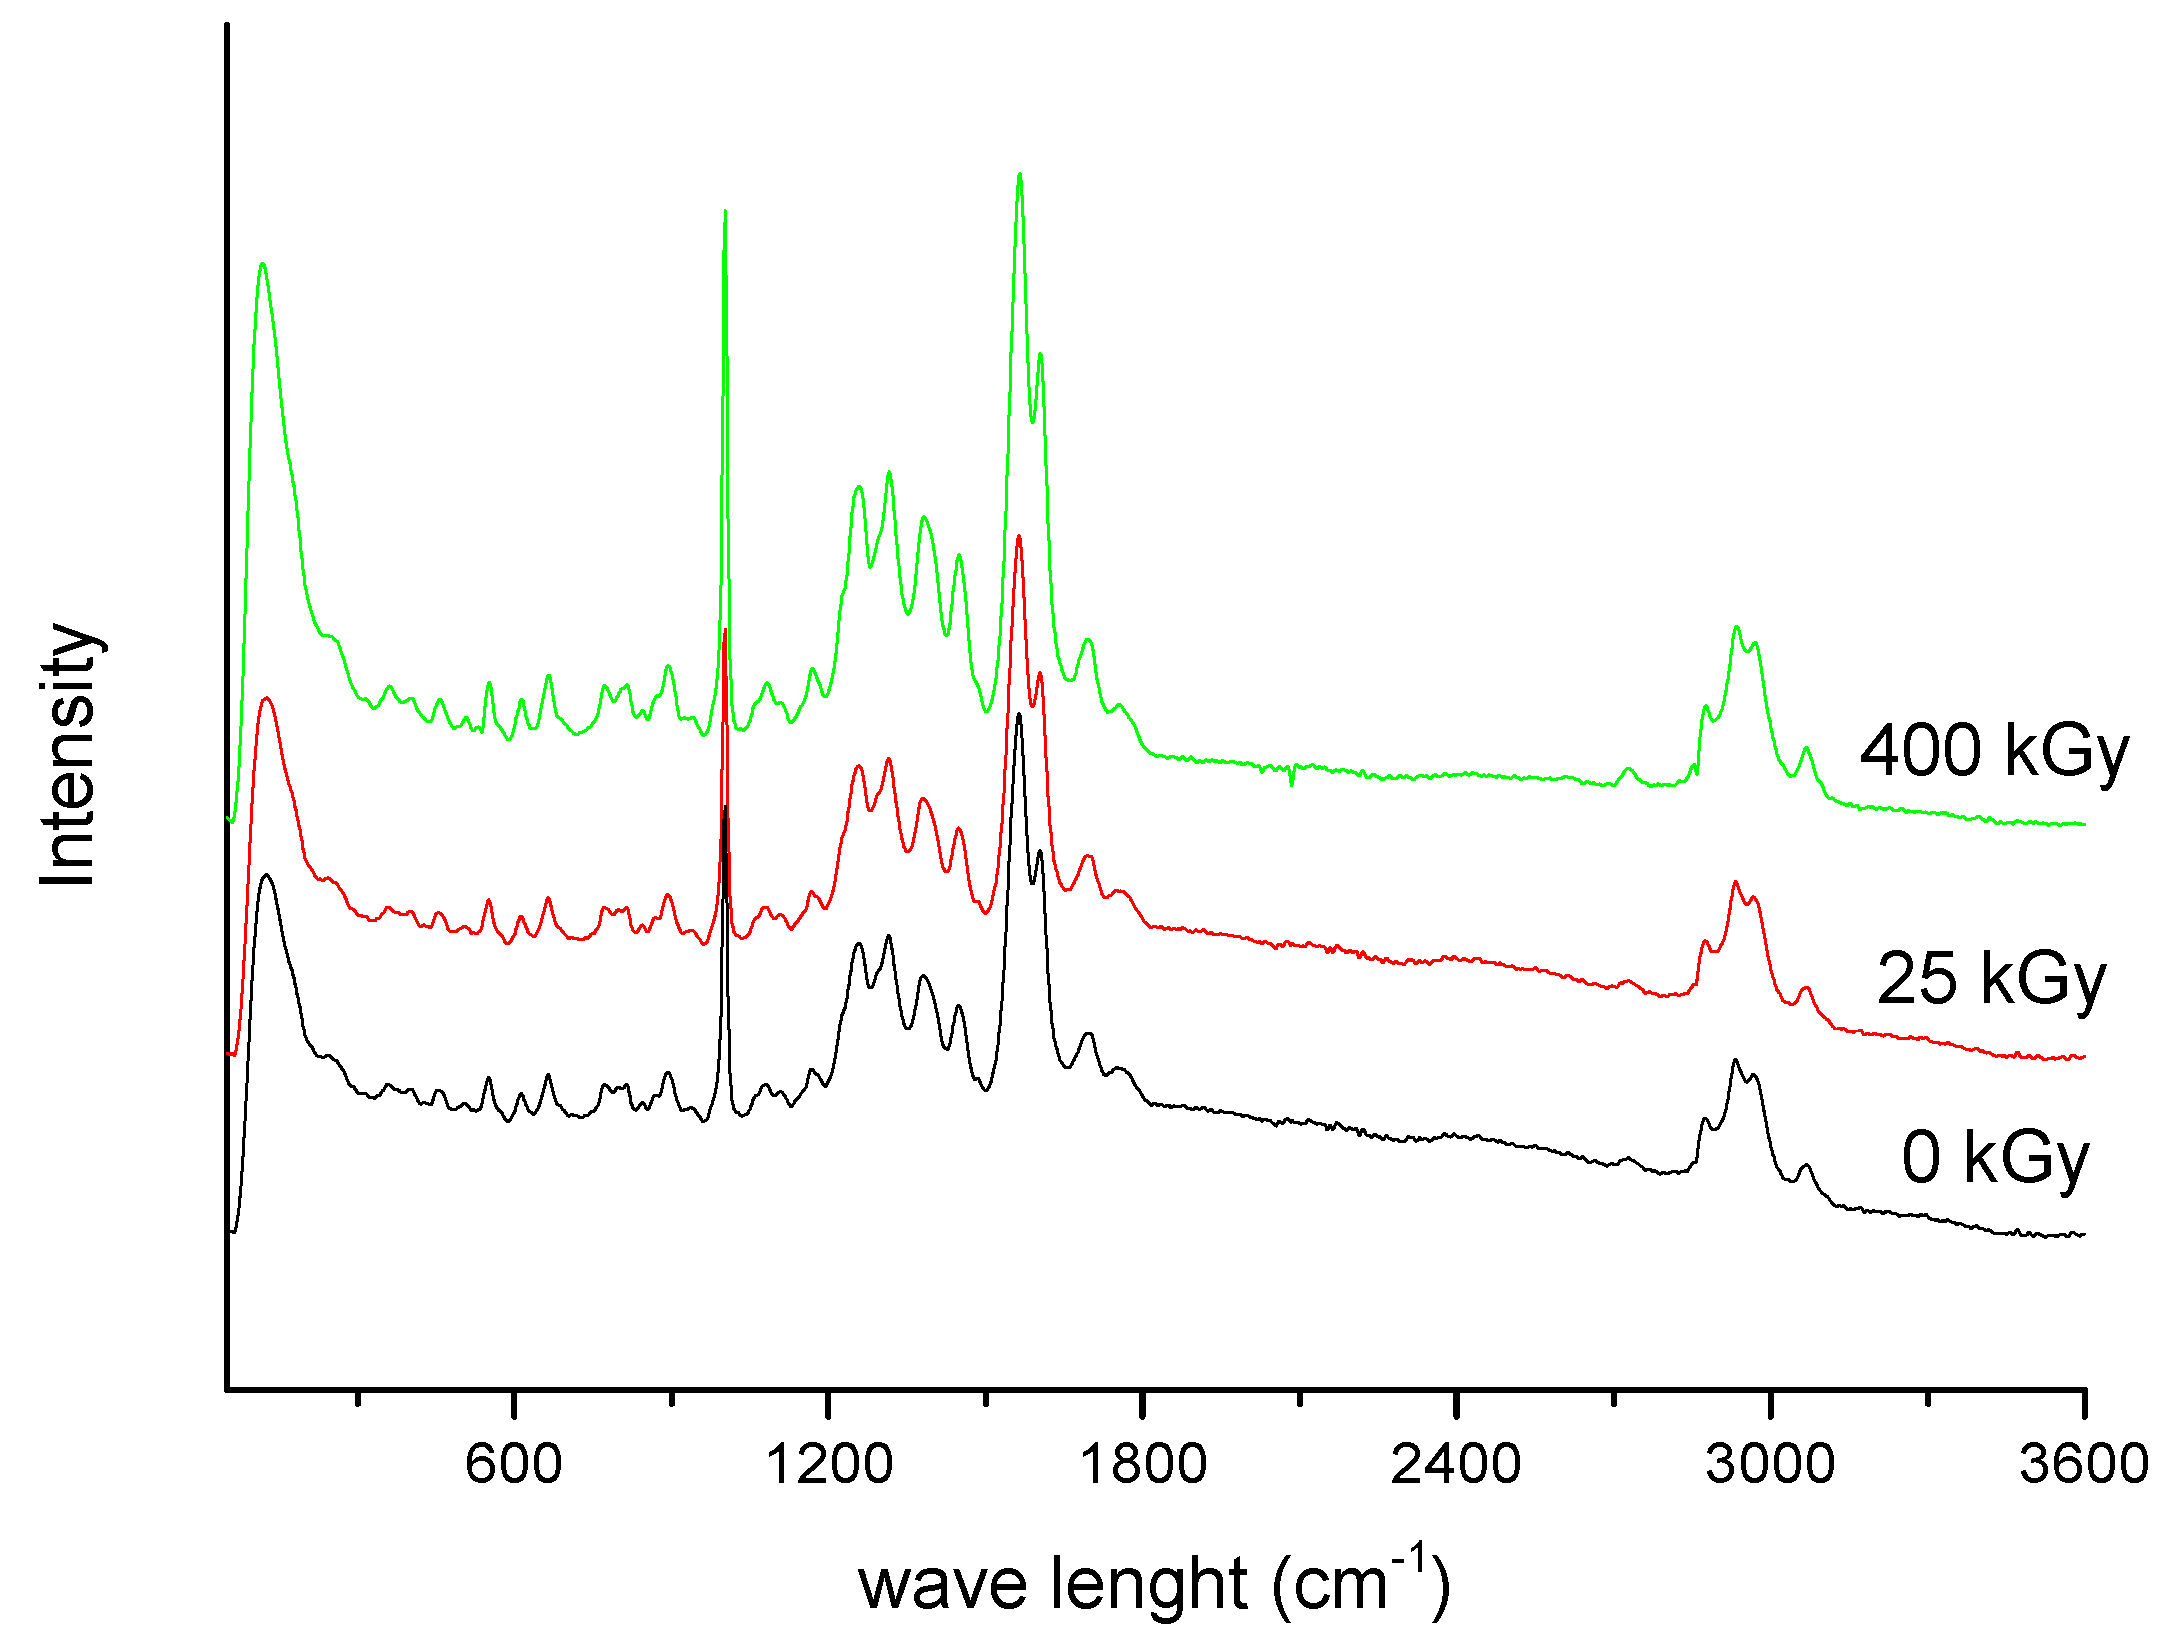
4.3. Fourier Transform Infrared (FT-IR) Spectroscopy
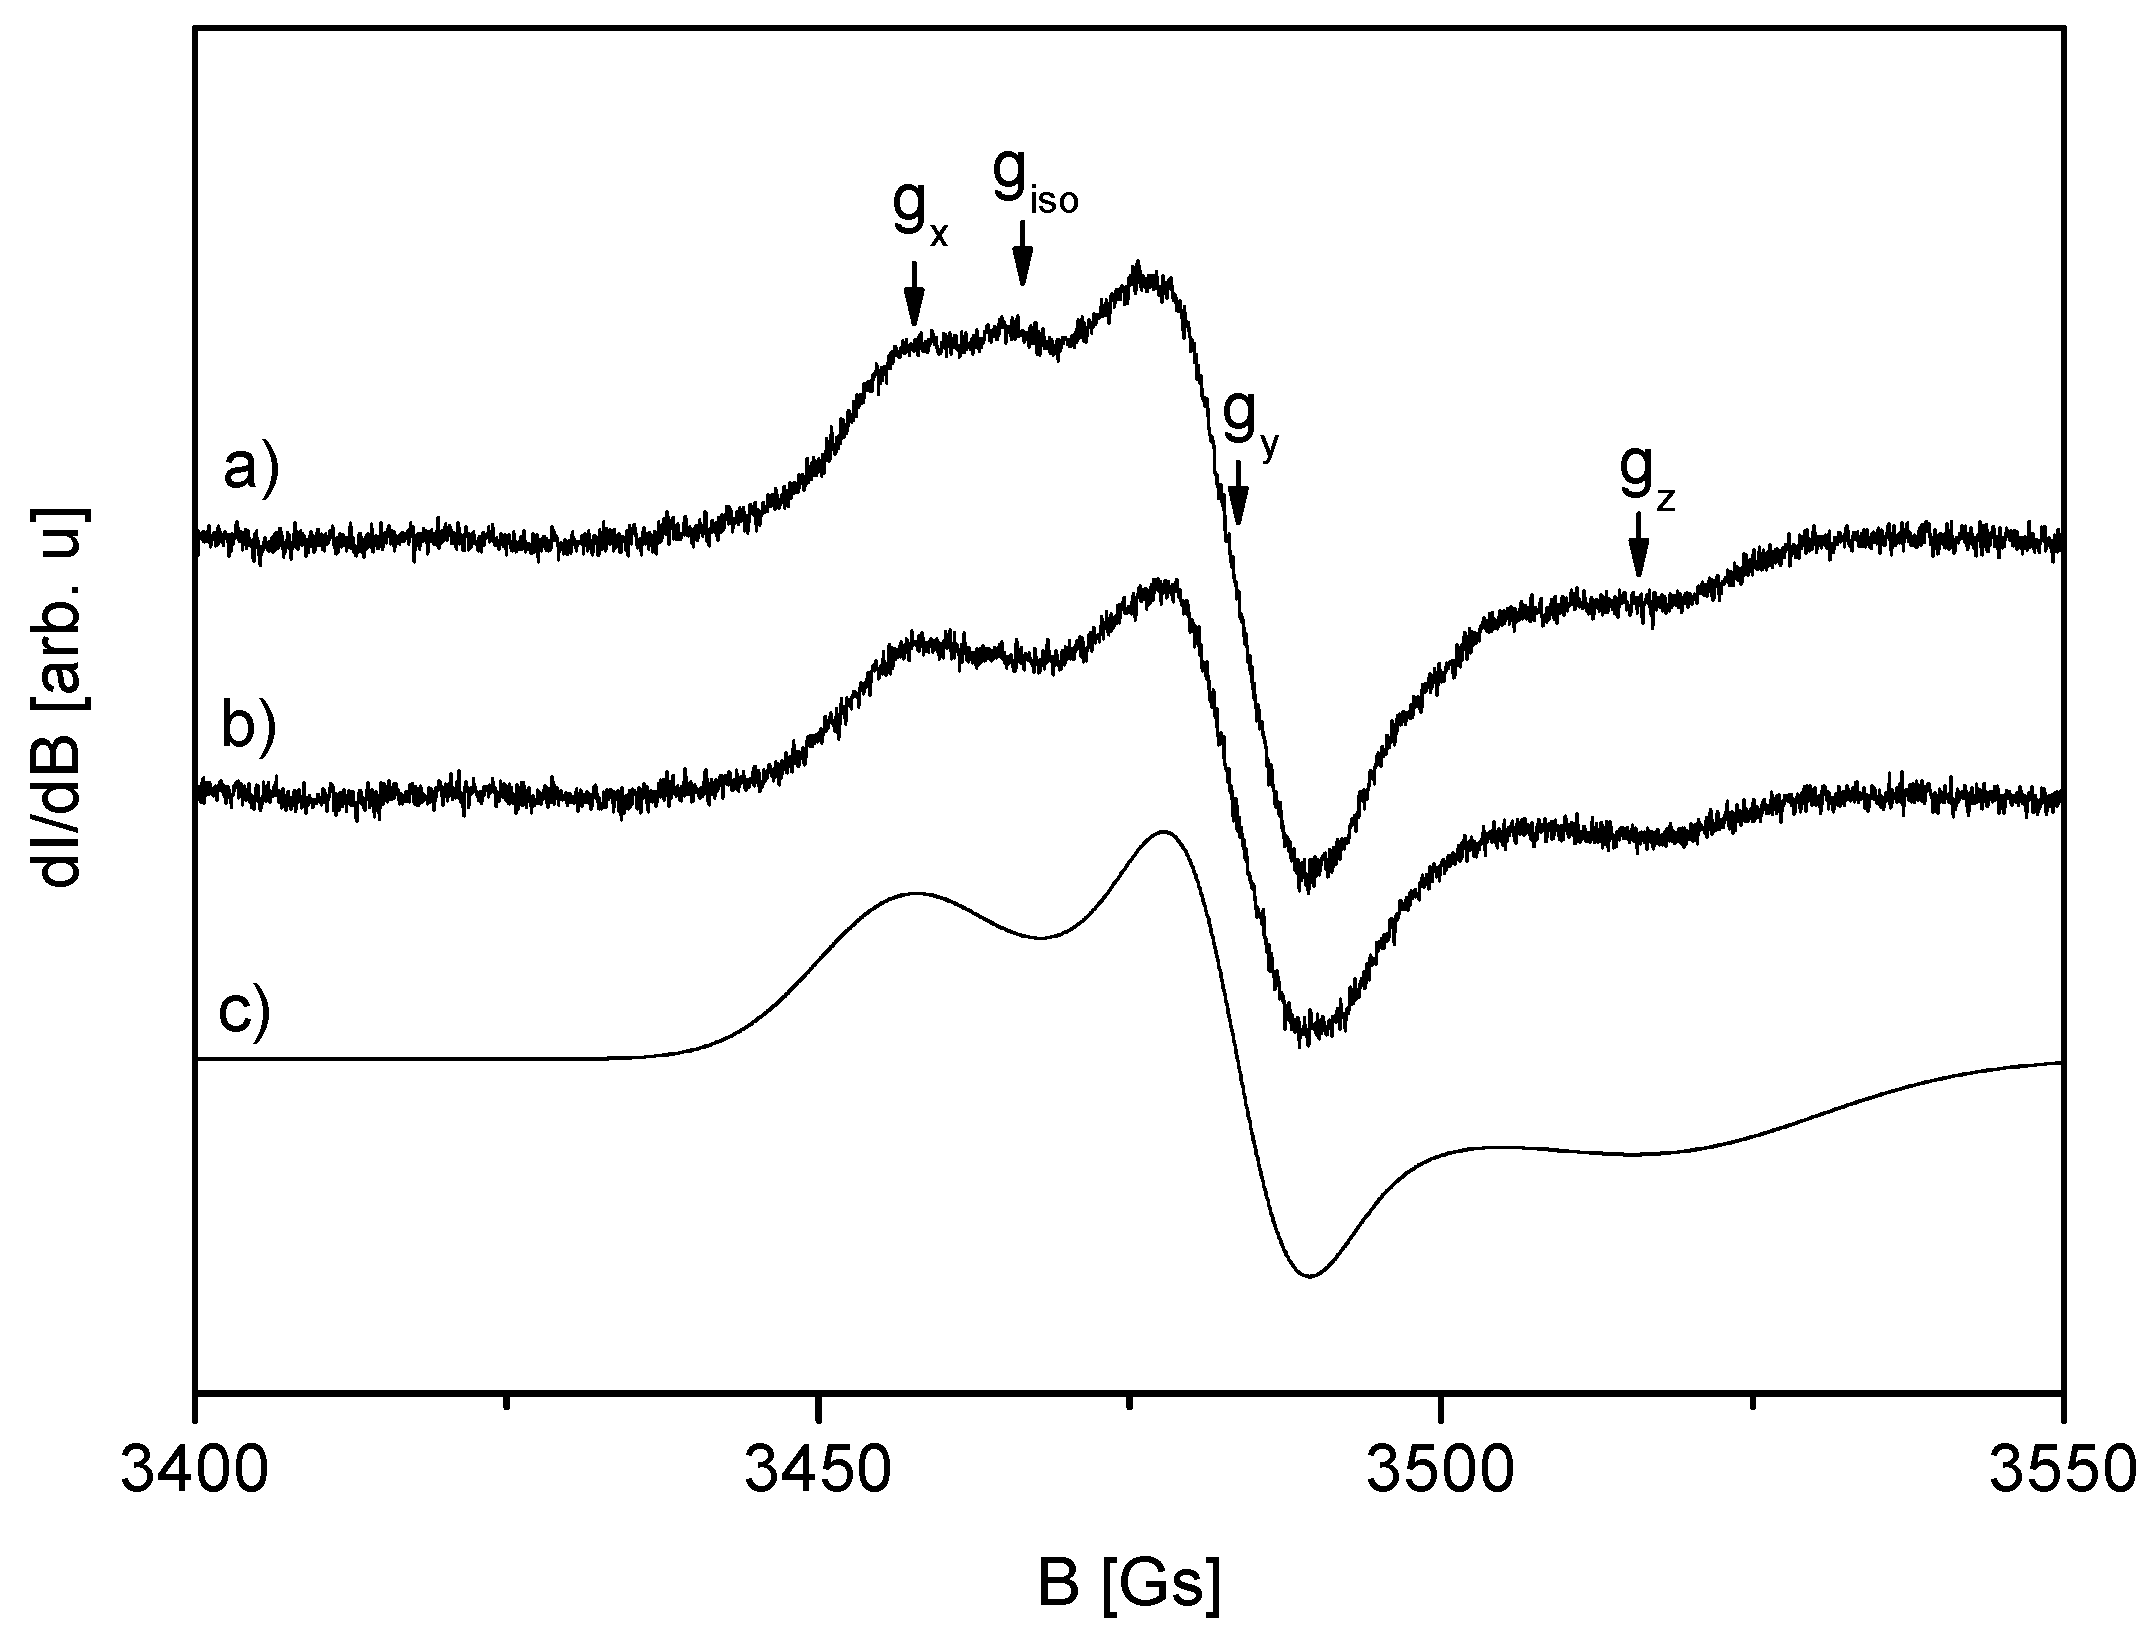
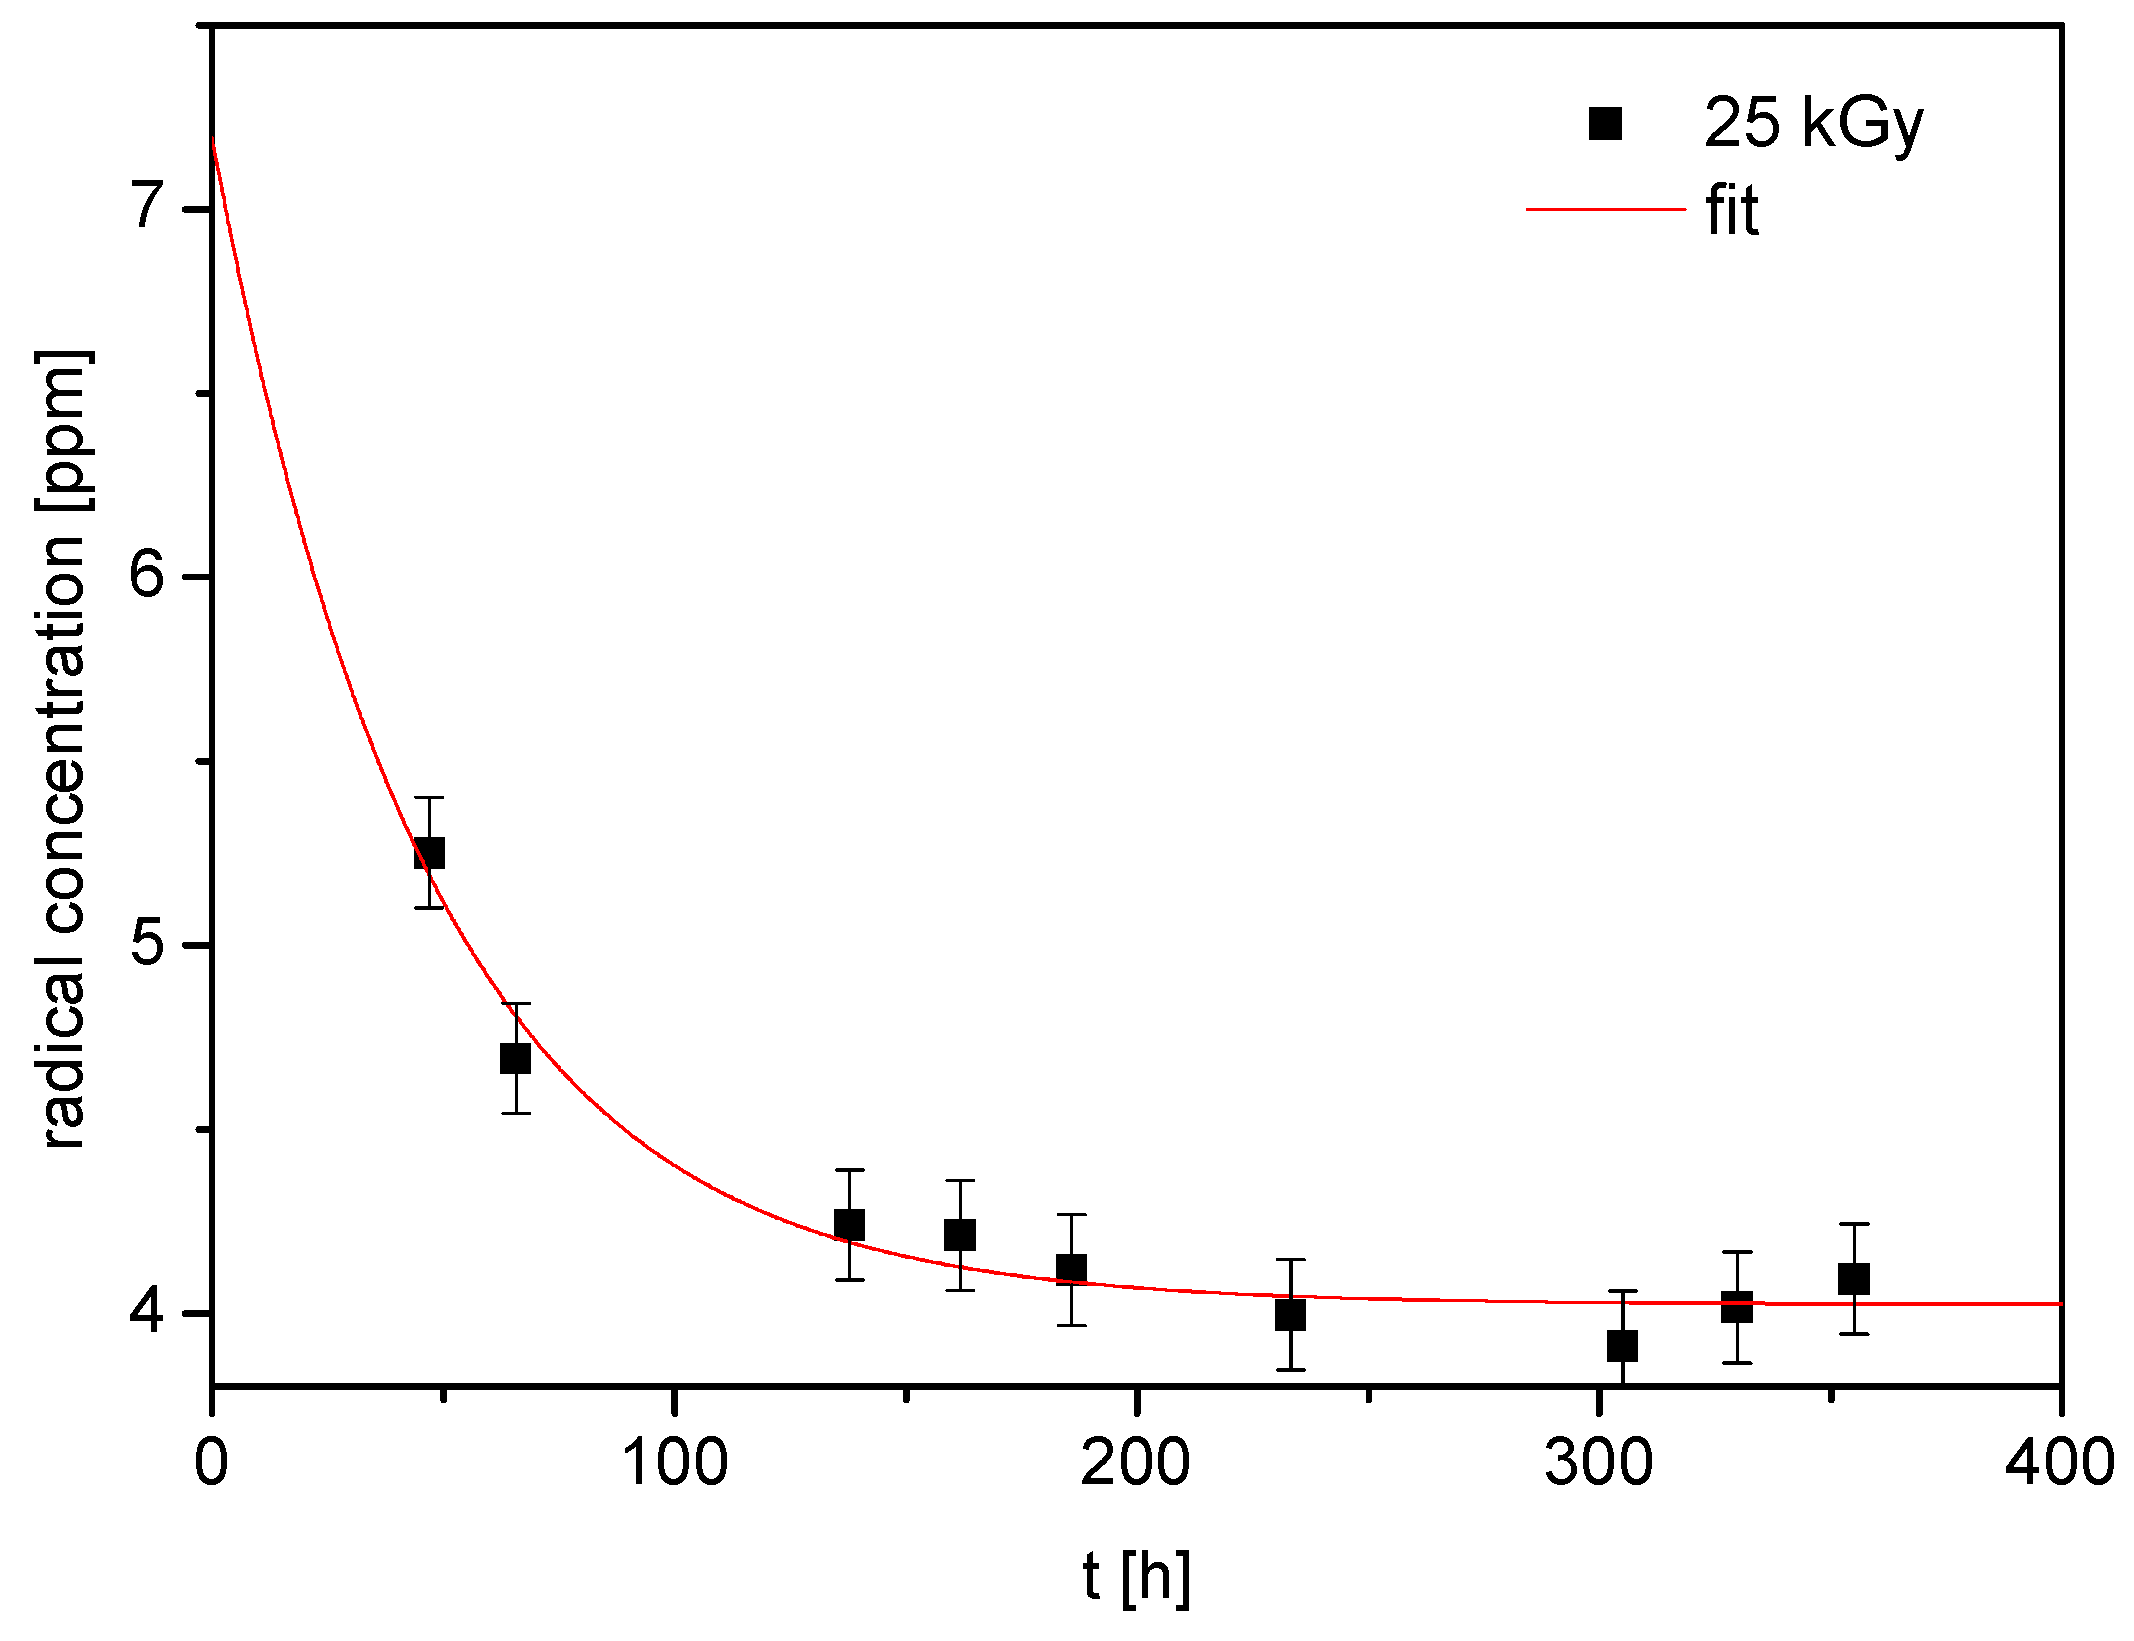
4.4. Electron Paramagnetic Resonance (EPR) Spectroscopy
4.5. High-Performance Liquid Chromatography (HPLC-DAD) Analysis
4.6. HPLC-MS/MS Analysis
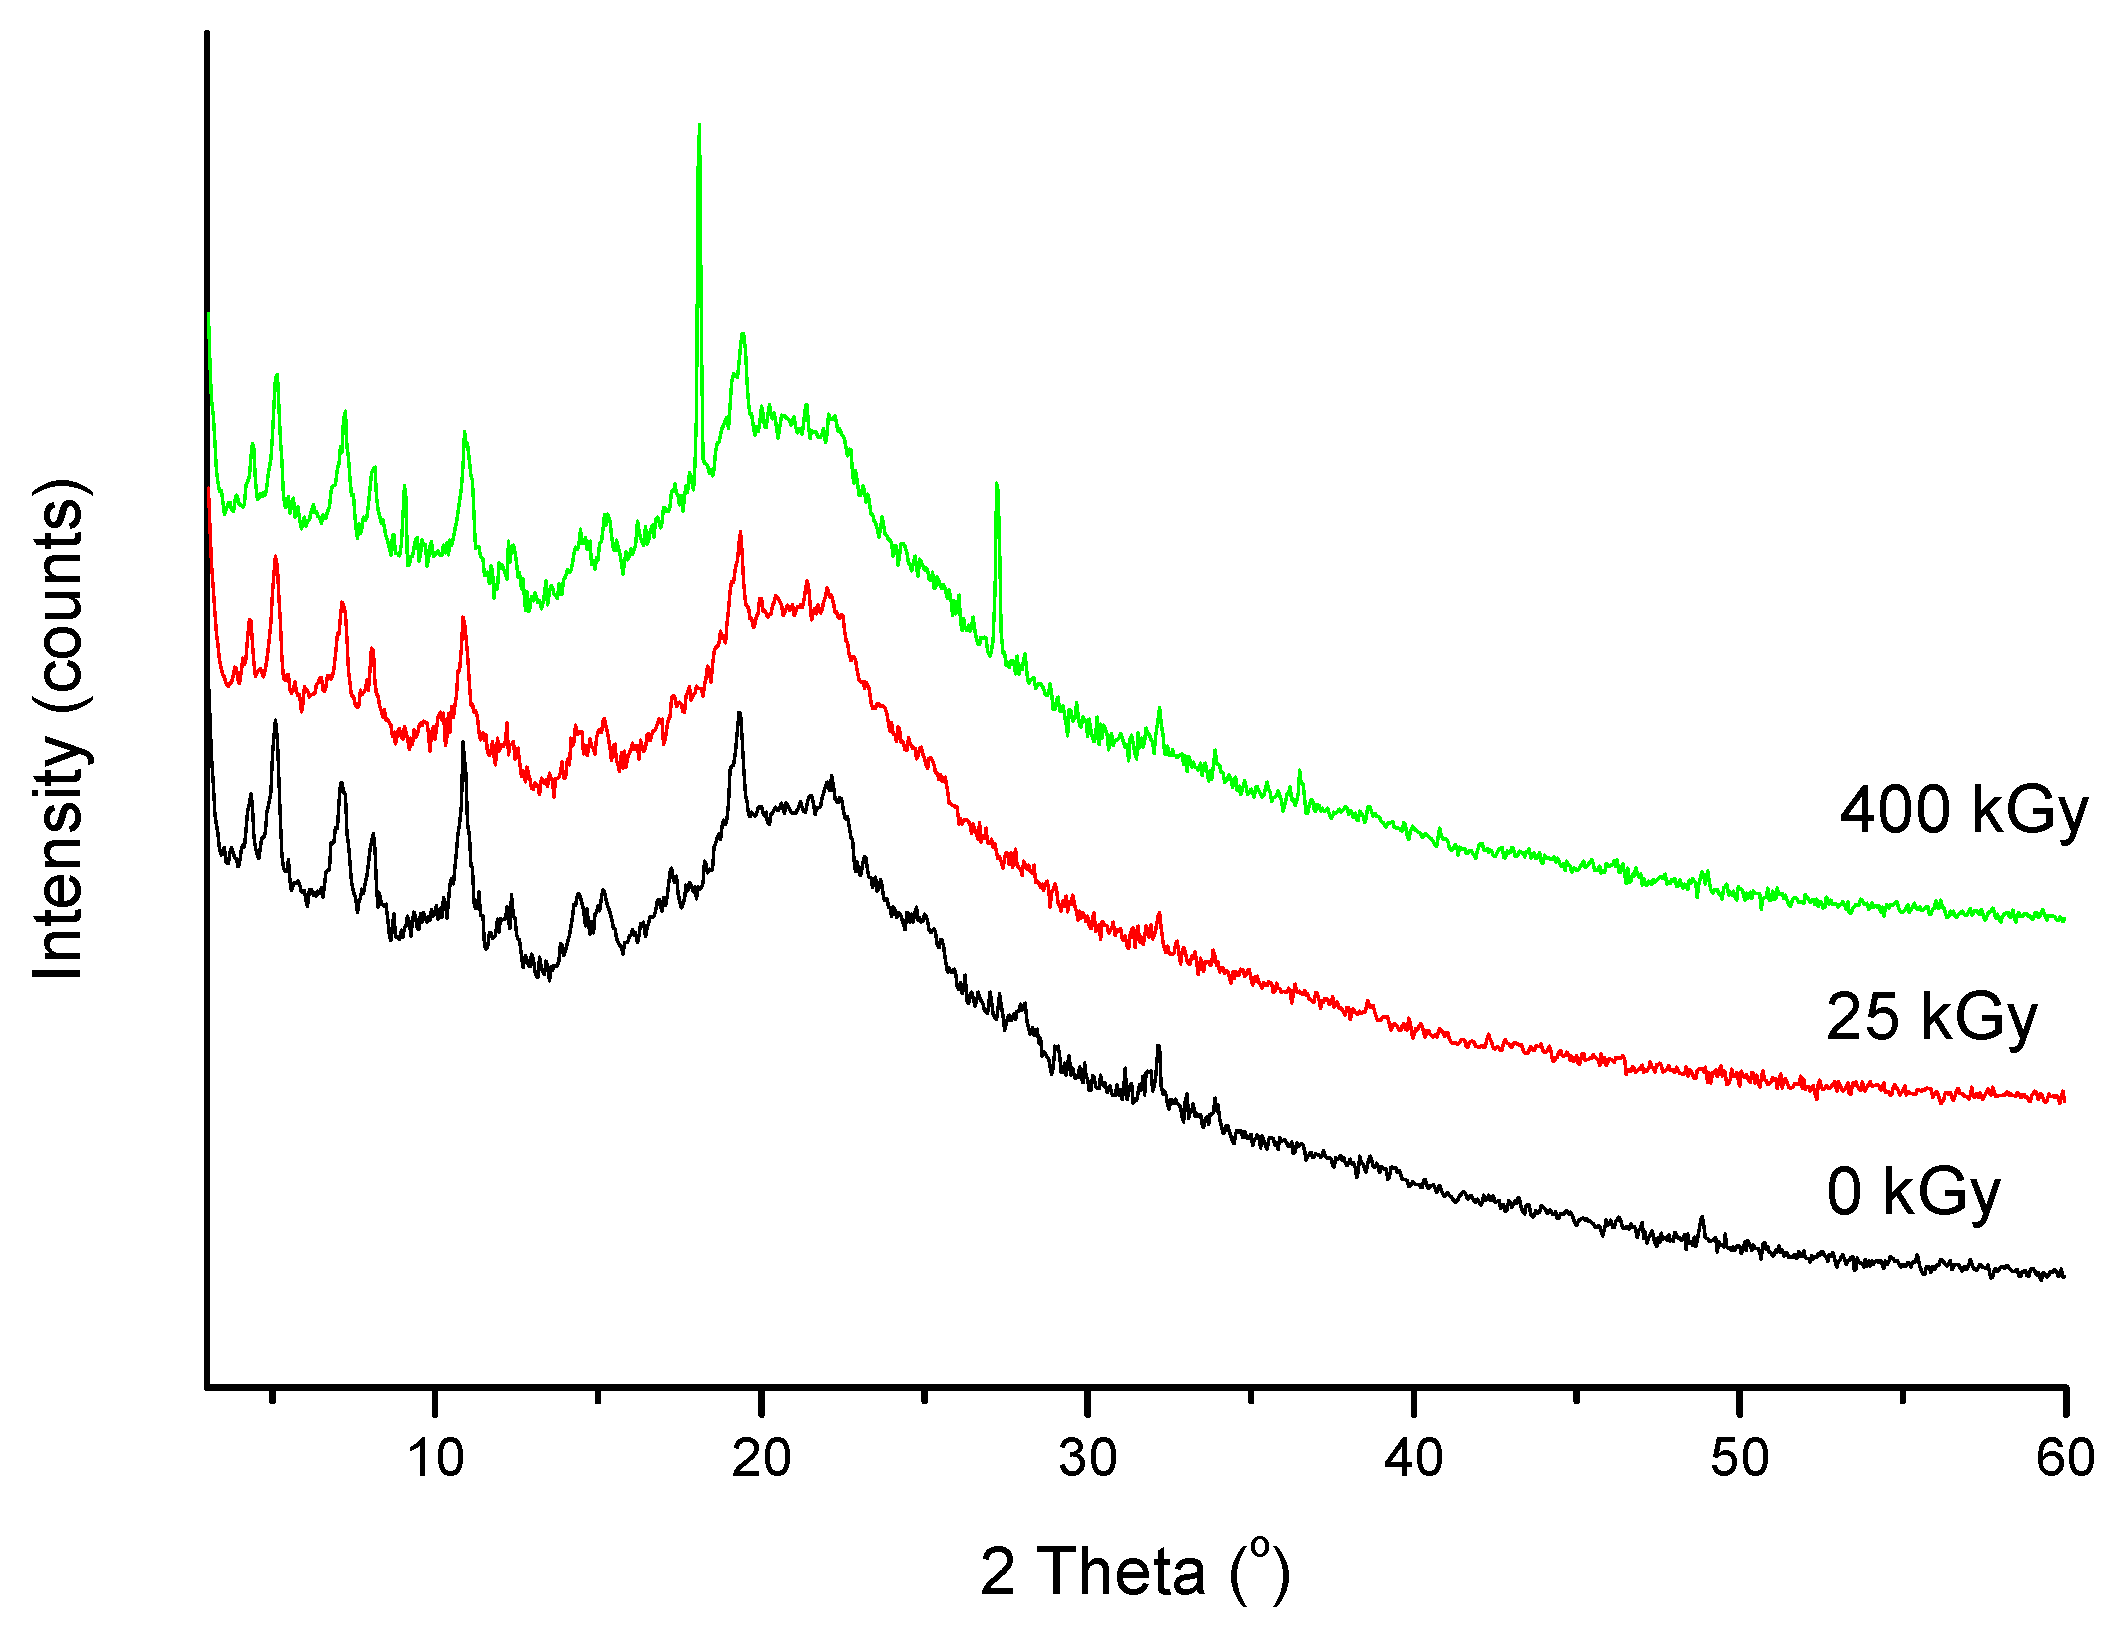
4.7. X-ray Powder Diffraction (XRPD)
4.8. Microbiological Study
5. Conclusions
Author Contributions
Funding
Conflicts of Interest
References
- Zhanel, G.G.; Johanson, C.; Embil, J.M.; Noreddin, A.; Gin, A.; Vercaigne, L.; Hoban, D.J. Ertapenem: Review of a new carbapenem. Expert Rev. Anti-Infect. Ther. 2005, 3, 23–39. [Google Scholar] [CrossRef] [PubMed]
- Behera, B.; Mathur, P.; Das, A.; Kapil, A. Ertapenem susceptibility of extended spectrum beta-lactamase-producing Enterobacteriaceae at a tertiary care centre in India. Singap. Med. J. 2009, 50, 628–632. [Google Scholar]
- Nix, D.E.; Majumdar, A.K.; DiNubile, M.J. Pharmacokinetics and pharmacodynamics of ertapenem: An overview for clinicians. J. Antimicrob. Chemother. 2004, 53, 23–28. [Google Scholar] [CrossRef] [PubMed]
- Odenholt, I. Ertapenem: A new carbapenem. Expert Opin. Investig. Drugs 2001, 10, 1157–1166. [Google Scholar] [CrossRef] [PubMed]
- Zając, M.; Cielecka-Piontek, J.; Jelińska, A. Stability of ertapenem in aqueous solutions. J. Pharm. Biomed. Anal. 2007, 43, 445–449. [Google Scholar] [CrossRef] [PubMed]
- Cielecka-Piontek, J.; Zając, M.; Jelińska, A. A comparison of the stability of ertapenem and meropenem in pharmaceutical preparations in solid state. J. Pharm. Biomed. Anal. 2008, 46, 52–57. [Google Scholar] [CrossRef] [PubMed]
- Garbacki, P.; Zalewski, P.; Skibiński, R.; Kozak, M.; Ratajczak, M.; Lewandowska, K.; Bednarski, W.; Podborska, A.; Mizera, M.; Jelińska, A.; et al. Radiostability of cefoselis sulfate in the solid state. X-ray Spectrom. 2015, 44, 344–350. [Google Scholar] [CrossRef]
- Zalewski, P.; Skibiński, R.; Szymanowska-Powałowska, D.; Piotrowska, H.; Kozak, M.; Pietralik, Z.; Bednarski, W.; Cielecka-Piontek, J. The radiolytic studies of cefpirome sulfate in the solid state. J. Pharm. Biomed. Anal. 2016, 118, 410–416. [Google Scholar] [CrossRef]
- Zalewski, P.; Skibiński, R.; Szymanowska-Powałowska, D.; Piotrowska, H.; Bednarski, W.; Cielecka-Piontek, J. Radiolytic studies of cefozopran hydrochloride in the solid state. Electron. J. Biotechnol. 2017, 25, 28–32. [Google Scholar] [CrossRef]
- Zalewski, P.; Szymanowska-Powałowska, D.; Garbacki, P.; Paczkowska, M.; Talaczyńska, A.; Cielecka-Piontek, J. The radiolytic studies of ceftriaxone in the solid state. Acta Pol. Pharm. 2015, 72, 1253–1258. [Google Scholar]
- Kilińska, K.; Cielecka-Piontek, J.; Skibiński, R.; Szymanowska, D.; Miklaszewski, A.; Bednarski, W.; Tykarska, E.; Stasiłowicz, A.; Zalewski, P. The Radiostability of Meropenem Trihydrate in Solid State. Molecules 2018, 23, 2738. [Google Scholar] [CrossRef]
- Kilińska, K.; Cielecka-Piontek, J.; Skibiński, R.; Szymanowska, D.; Miklaszewski, A.; Bednarski, W.; Zalewski, P. The radiolytic studies of doripenem monohydrate in the solid state. Acta Pol. Pharm. 2018, 75, 1127–1133. [Google Scholar]
- Kilińska, K.; Cielecka-Piontek, J.; Skibiński, R.; Szymanowska, D.; Miklaszewski, A.; Bednarski, W.; Zalewski, P. The radiation sterilization of imipenem and cilastatin in the solid state. Acta Pol. Pharm. 2019, 76, 431–438. [Google Scholar]
- EN ISO 11137, (2006). Available online: https://www.iso.org/standard/33952.html (accessed on 13 August 2019).
- Zając, M.; Cielecka-Piontek, J.; Jelińska, A. Development and validation of UV spectrophotometric and RP-HPLC methods for determination of ertapenem during stability studies. Chem. Anal. 2006, 51, 761–770. [Google Scholar]
- Mai, V.C.; Bednarski, W.; Borowiak-Sobkowiak, B.; Wilkaniec, B.; Samardakiewicz, S.; Morkunas, I. Oxidative stress in pea seedling leaves in response to Acyrthosiphon pisum infestation. Phytochemistry 2013, 93, 49–62. [Google Scholar] [CrossRef]
- CLSI. M07-A9: Methods for Dilution Antimicrobial Susceptibility Tests for Bacteria That Grow Aerobically; Approved Standard—Ninth Edition; CLSI: Wayne, PA, USA, 2012. [Google Scholar]
Sample Availability: Not available. |


| IR (cm−1) | RAMAN (cm−1) | DFT (cm−1) | Bands Assignment |
|---|---|---|---|
| 549 | 544 | Def. β-lactam ring | |
| 613 | 627 | Def. all molecule | |
| 663 | 687 | Def. benzene ring | |
| 675 | 717 | O-H oop. in COOH | |
| 775 | 775 | 788 | N-H oop. in pyrrolidine ring |
| 816 | 818 | Def. β-lactam ring | |
| 892 | 881 | C-C s + C-H w in pyrrolidine ring | |
| 940 | 953 | C-H r in pyrrolidine and benzene rings + C-C s in pyrrolidine ring | |
| 992 | 981 | C-S s | |
| 1001 | 1010 | Breathing benzene ring + C-C s in C-C s + C-N s in pyrrolidine ring | |
| 1057 | 1062 | C-N s between pyrrolidine and benzene rings + def. pyrrolidine ring | |
| 1075 | 1077 | 1075 | Breathing β-lactam ring |
| 1100 | 1100 | 1110 | C-C s near β-lactam ring + C-O s in COH + C-H w near β-lactam ring |
| 1151 | 1156 | C-O s in COH + C-C s near β-lactam ring + C-H w near β-lactam ring | |
| 1169 | 1167 | C-O s in COOH + C-H w | |
| 1180 | 1189 | C-H w near β-lactam and benzene ring | |
| 1228 | 1222 | C-C s between pyrrolidine and benzene rings + C-H t near pyrrolidine ring | |
| 1262 | 1258 | 1268 | C-H t near pyrrolidine ring |
| 1291 | 1315 | C-N s in β-lactam ring + C-H w near β-lactam ring | |
| 1315 | 1316 | 1320 | C-N s between pyrrolidine and benzene rings |
| 1385 | 1382 | 1395 | C-O-H b in COOH |
| 1441 | 1445 | 1438 | C-H b in benzene ring |
| 1565 | 1563 | 1564 | C-N-H b |
| 1572 | 1582 | C=O s in COONa | |
| 1613 | 1597 | C=C s in β-lactam ring | |
| 1656 | 1647 | C=C s in benzene ring | |
| 1692 | 1695 | 1764 | C=O s between pyrrolidine and benzene rings + C-N-H b |
| 1750 | 1755 | 1816 | C=O s in COOH and near β-lactam ring |
| 2726 | 2987 | C-H s in | |
| 2883 | 3055 | C-H s in pyrrolidine ring | |
| 2930 | 3171 | C-H s in pyrrolidine ring | |
| 2976 | 3208 | C-H s in benzene ring | |
| 3263 | 3474 | O-H in COOH group + N-H s in pyrrolidine ring | |
| 3406 | 3843 | O-H s + N-H s |
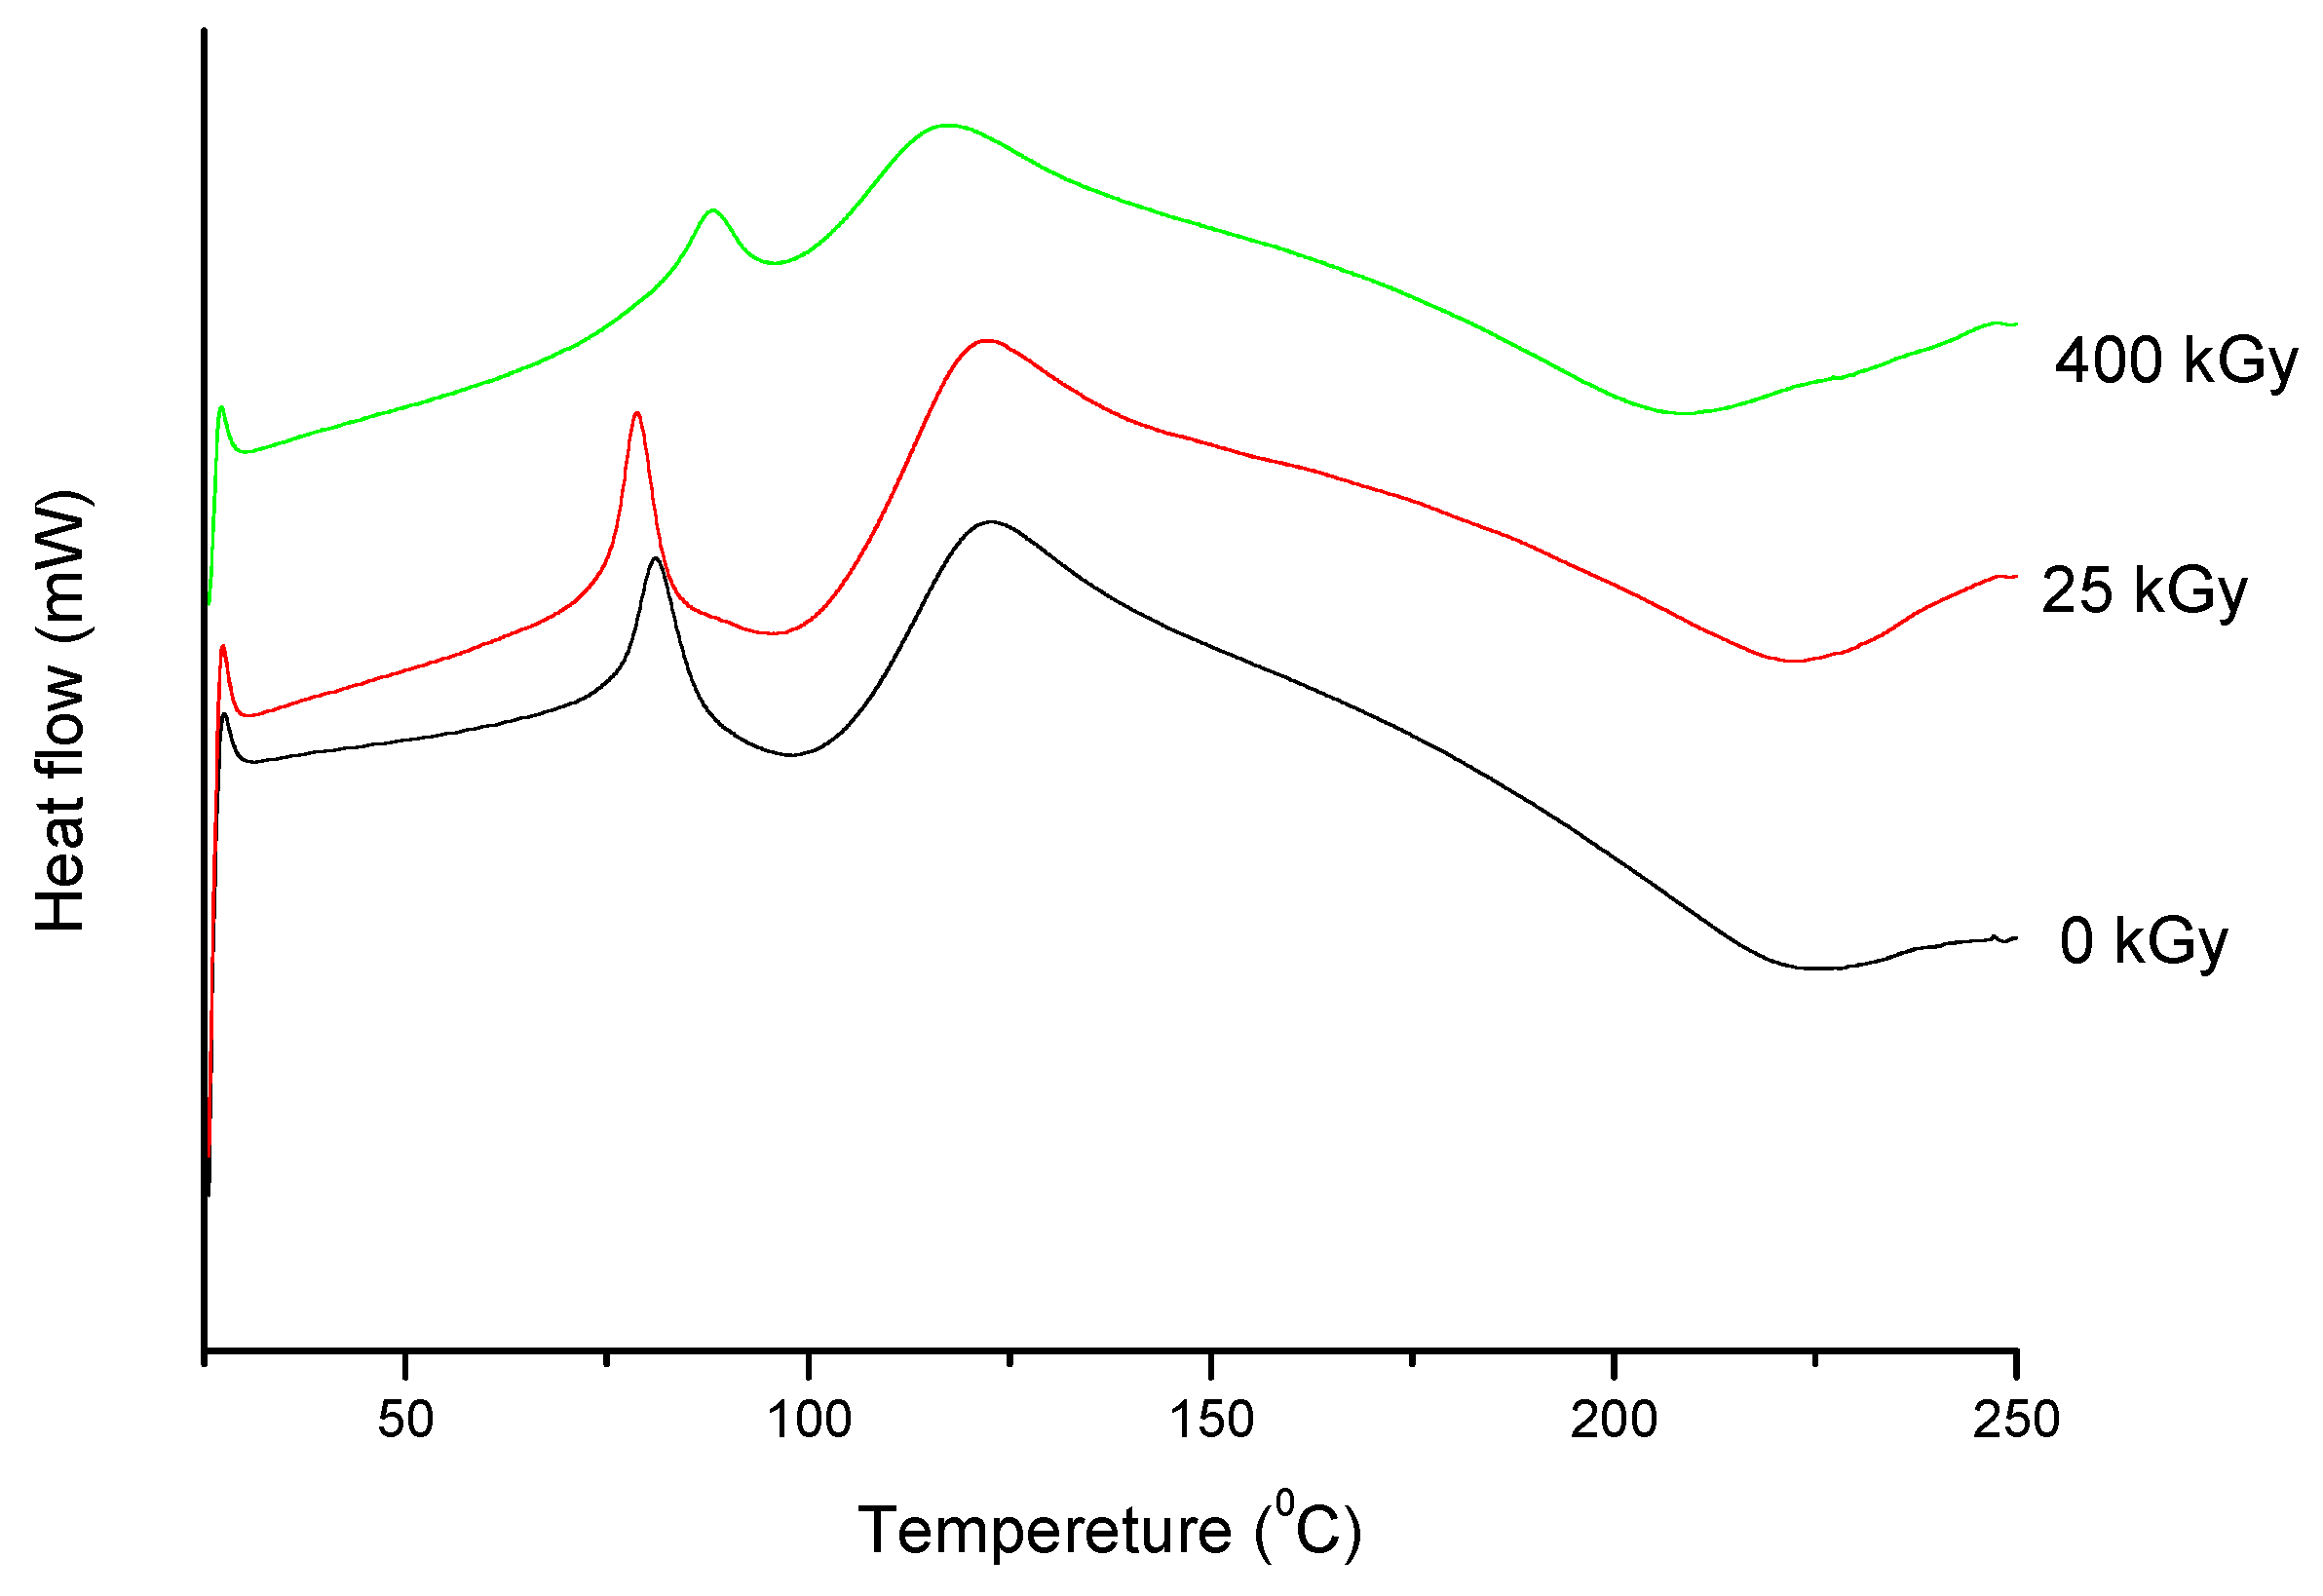
| (kGy) | Tonset (°C) | Tendset (°C) | ΔH (J/g) |
|---|---|---|---|
| 0 | 66.5 | 73.9 | 52.2 |
| 25 | 70.8 | 78.7 | 42.2 |
| 400 | 72.9 | 83.5 | 29.5 |
| Microorganism | 0 kGy | 25 kGy | 400 kGy |
|---|---|---|---|
| Pseudomonas mirabilis ATCC 12453 | 250 | 250 | - |
| Escherichia coli ATCC 25922 | 250 | 250 | - |
| Salmonella typhimurium ATCC 14028 | 250 | 250 | 250 |
| Acinetobacter baumanii ATCC 19606 | 125 | 250 | 250 |
| Enterococcus faecalis ATTC 29212 | 250 | 250 | - |
| Salmonella enteriditis ATCC 13076 | 250 | 250 | 250 |
| Enterobacter aerogenes ATCC 13048 | 125 | 125 | - |
| Pseudomonas aeruginosa ATCC 27853 | 250 | 250 | - |
| Pediococcus pentosaceus | 250 | 250 | 250 |
| Staphylococcus aureus ATCC 25923 | 250 | 250 | - |
| Chemical Structure | Retention Time | Measured Mass (m/z) | Theoretical Mass (m/z) | Mass Error (ppm) | Molecular Formula [M + H+] | MS/MS Fragmentation Ions (m/z) | MS/MS Fragment Formula |
|---|---|---|---|---|---|---|---|
Ertapenem | 7.3 | 476.14955 | 476.14859 | 2.01 | C22H26N3O7S | 432.15889 346.12227 233.09189 181.07941 114.03702 68.05031 | C20H22N3O6S C17H21N3O3S C12H13N2O3 C9H11NO3 C6H10O2 C4H6N |
E1 | 4.2 | 235.10871 | 235.10771 | 4.56 | C12H15N2O3 | 99.98675 70.06612 | C5H12N2 C4H8N |
E2 | 5.5 | 267.07880 | 267.07978 | 1.63 | C12H15N2O3S | 230.96416 182.03794 102.03734 68.04946 | C12H11N2O3 C8H10N2OS C4H8NS C4H6N |
© 2019 by the authors. Licensee MDPI, Basel, Switzerland. This article is an open access article distributed under the terms and conditions of the Creative Commons Attribution (CC BY) license (http://creativecommons.org/licenses/by/4.0/).
Share and Cite
Kilińska, K.; Cielecka-Piontek, J.; Skibiński, R.; Szymanowska, D.; Miklaszewski, A.; Lewandowska, K.; Bednarski, W.; Mizera, M.; Tykarska, E.; Zalewski, P. The Radiation Sterilization of Ertapenem Sodium in the Solid State. Molecules 2019, 24, 2944. https://doi.org/10.3390/molecules24162944
Kilińska K, Cielecka-Piontek J, Skibiński R, Szymanowska D, Miklaszewski A, Lewandowska K, Bednarski W, Mizera M, Tykarska E, Zalewski P. The Radiation Sterilization of Ertapenem Sodium in the Solid State. Molecules. 2019; 24(16):2944. https://doi.org/10.3390/molecules24162944
Chicago/Turabian StyleKilińska, Karolina, Judyta Cielecka-Piontek, Robert Skibiński, Daria Szymanowska, Andrzej Miklaszewski, Kornelia Lewandowska, Waldemar Bednarski, Mikołaj Mizera, Ewa Tykarska, and Przemysław Zalewski. 2019. "The Radiation Sterilization of Ertapenem Sodium in the Solid State" Molecules 24, no. 16: 2944. https://doi.org/10.3390/molecules24162944
APA StyleKilińska, K., Cielecka-Piontek, J., Skibiński, R., Szymanowska, D., Miklaszewski, A., Lewandowska, K., Bednarski, W., Mizera, M., Tykarska, E., & Zalewski, P. (2019). The Radiation Sterilization of Ertapenem Sodium in the Solid State. Molecules, 24(16), 2944. https://doi.org/10.3390/molecules24162944