
Comparison of Physicochemical, Microbiological Properties and Bioactive Compounds Content of Grassland Honey and other Floral Origin Honeys

Abstract
:1. Introduction
2. Results
2.1. Water Content Determination
2.2. Electrical Conductivity (EC)
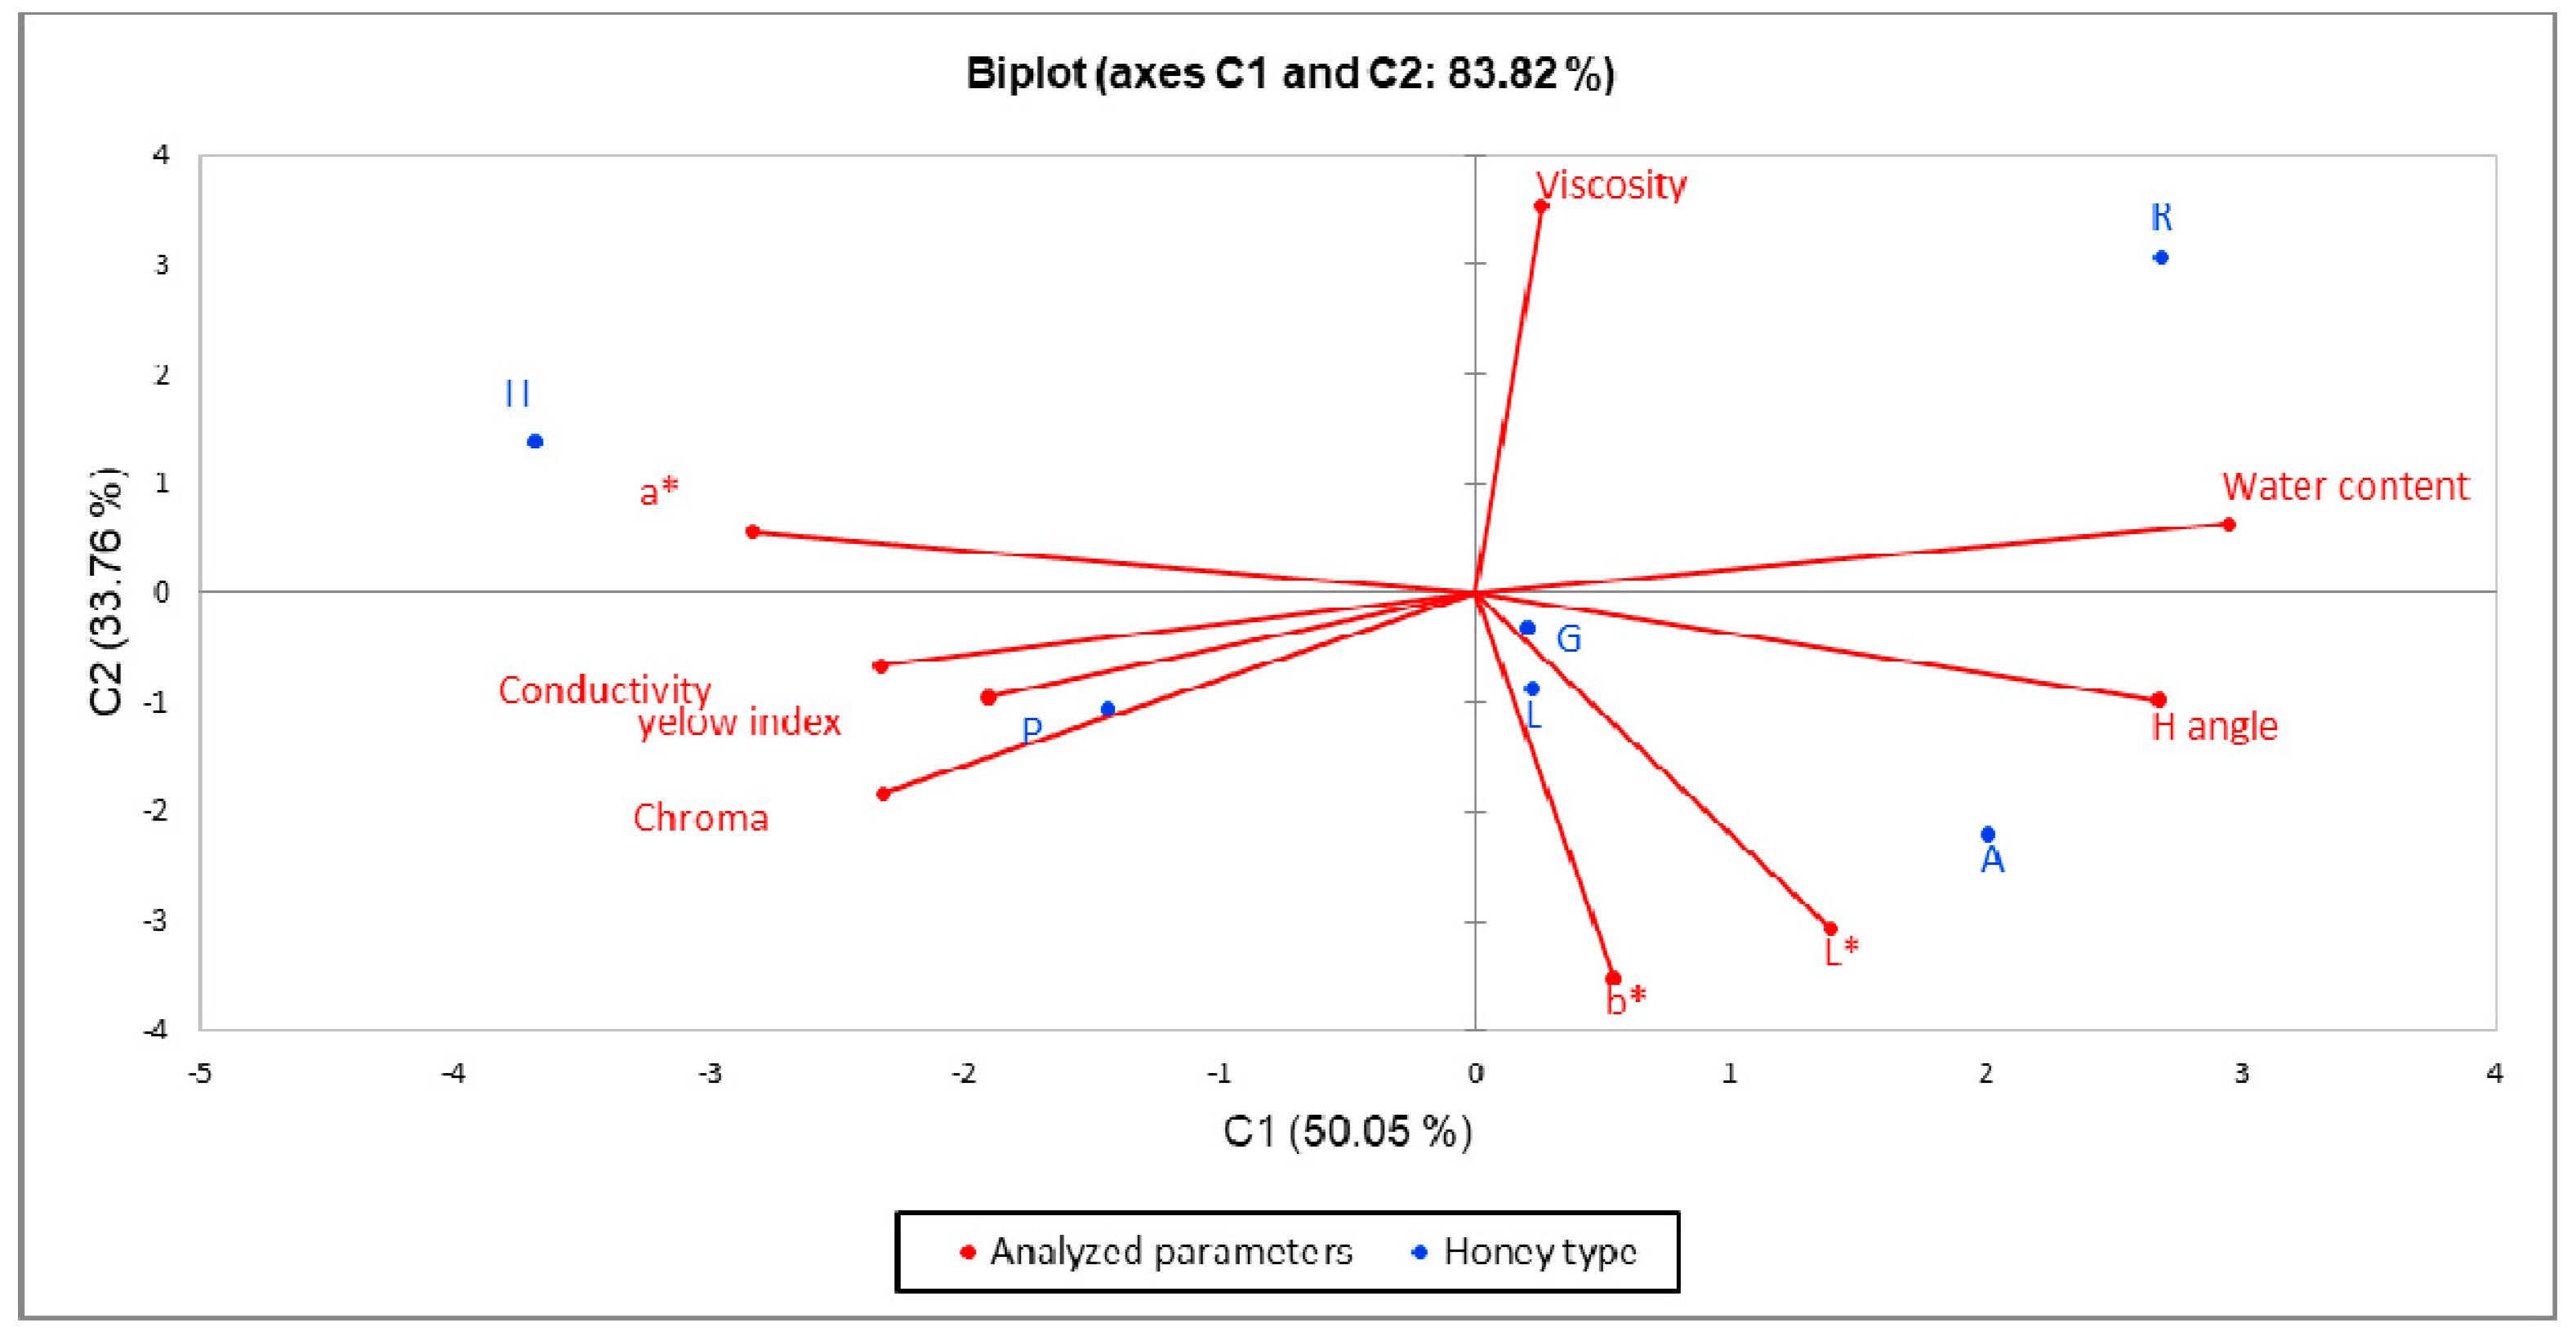
2.3. Color
2.4. Viscosity
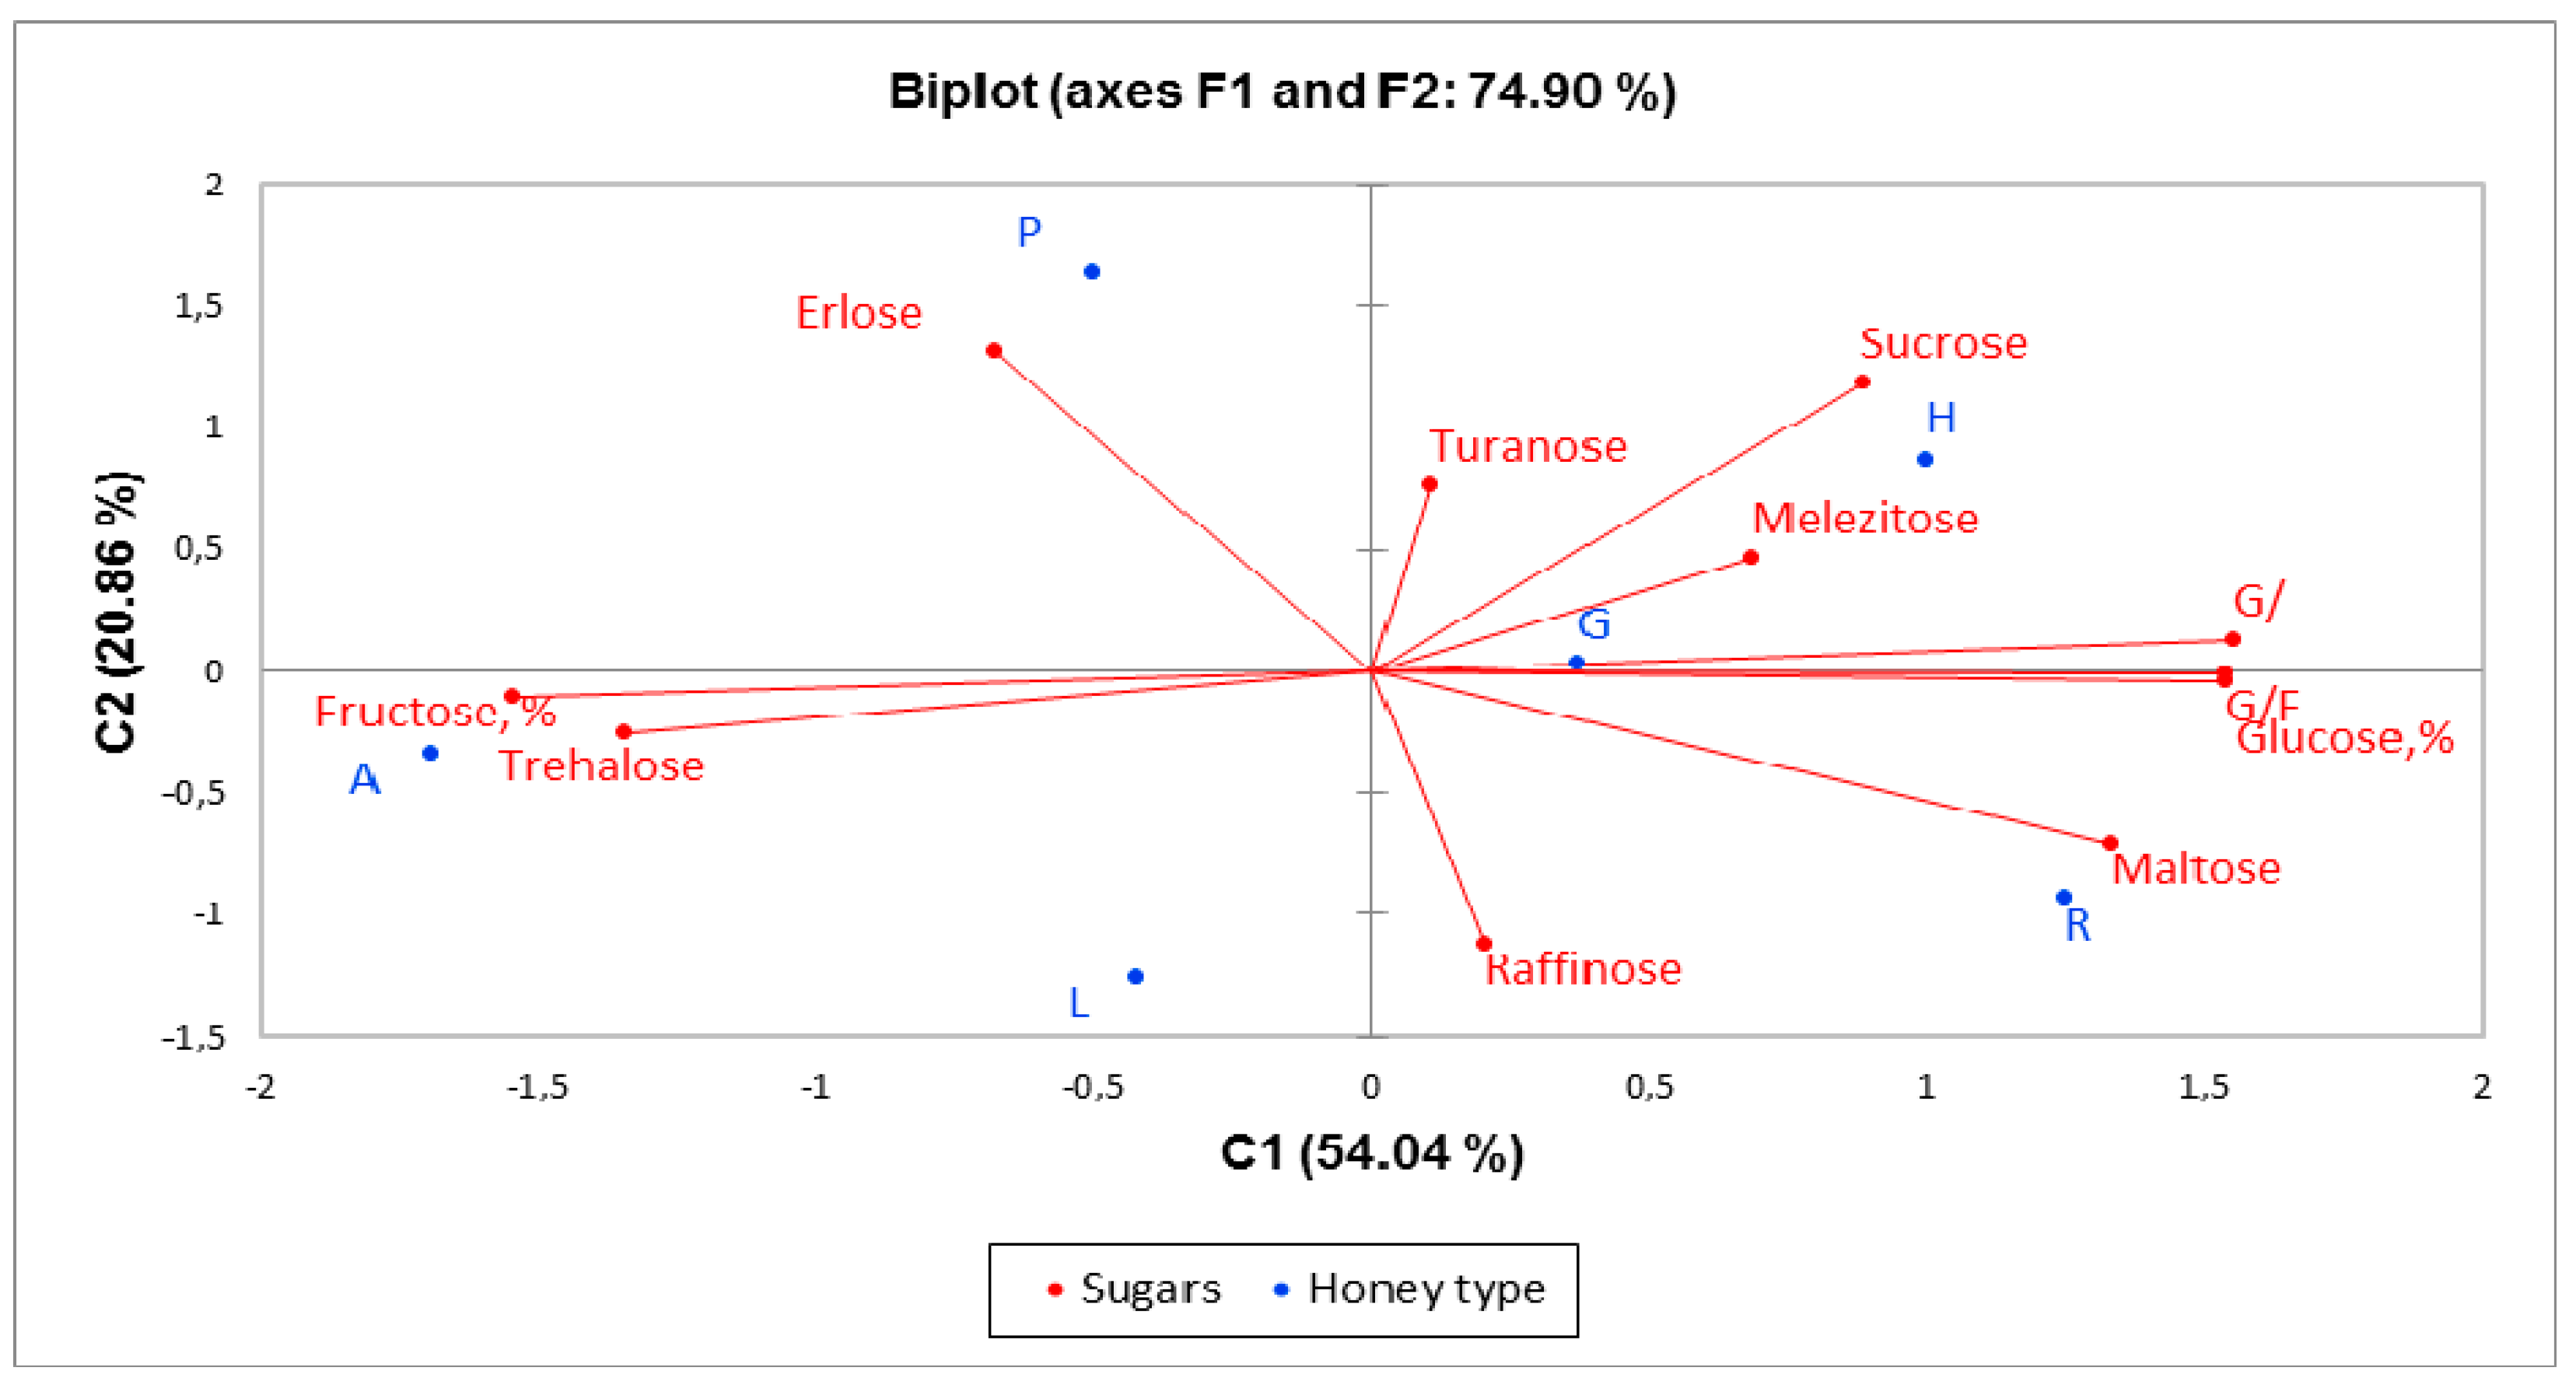
2.5. Sugars
2.6. Phenolic Compounds
2.7. Microbiological Analysis
3. Discussion
4. Materials and Methods
4.1. Materials
4.2. Methods
4.2.1. Water Content
4.2.2. Sugars
4.2.3. Phenolic Compounds
4.2.4. Color was Determined by the Chromometer CR 410—Konica Minolta
4.2.5. Electrical Conductivity
4.2.6. Viscosity
4.2.7. Microbiologic Analysis
- Number of standard counts. Serial dilutions from 10−1 to 10−3 of the initial dilution inoculated on agar plates were recommended. The plates were incubated for 48 h at 30 °C.
- Bacillus. The initial dilution was brought to 80 °C and held at this temperature for 10 min, after which it was cooled rapidly in ice. Bacteria for aerobic spore formation were inoculated on agar medium. The plates were incubated for 48 h at 30 °C.
- Number of coliforms. Inoculation was carried out on Agar Deoxycholate-Citrate Lactose medium (ADCL- todylabrotaories.com). The plates were incubated for 24 h at 37 °C.
- Yeast. From the initial dilution, they were inoculated on agar potato-dextrose medium (PDA) and incubated for 72 h at 25 °C.
- Molds. The mold was inoculated on Sabouroud agar medium and incubated for 7 days at 25 °C [20].
4.3. Statistical Analysis
5. Conclusions
Supplementary Materials
Author Contributions
Funding
Conflicts of Interest
References
- Council Directive 2001/110/EC of 20 December 2001 relating to honey. Off. J. Eur. Commun. 2002, L.10, 47–52.
- Subramanian, R.; Umesh Hebbar, H.; Rastogi, N.K. Processing of honey: A review. Int. J. Food Properties 2007, 10, 127–143. [Google Scholar] [CrossRef]
- Cimpoiu, C.; Hosu, A.; Miclaus, V.; Puscas, A. Determination of the floral origin of some romanian honeys on the basis of physical and biochemical properties. Spectrochim. Acta Part A Mol. Biomol. Spectrosc. 2013, 100, 149–154. [Google Scholar] [CrossRef] [PubMed]
- Gyoo Yeol, J.; Gregory, S. A Functional Protein Chip for Pathway Optimization and in Vitro Metabolic Engineering. Science 2004, 304, 428–431. [Google Scholar] [CrossRef]
- Tornuk, F.; Karaman, S.; Ozturk, I.; Toker, O.S.; Tastemur, B.; Sagdic, O.; Dogan, M.; Kayacier, A. Quality characterization of artisanal and retail turkish blossom honeys: Determination of physicochemical, microbiological, bioactive properties and aroma profile. Ind. Crops Prod. 2013, 46, 124–131. [Google Scholar] [CrossRef]
- Manyi-Loh, C.E.; Clarke, A.M.; Ndip, N. An overview of honey: Therapeutic properties and contribution in nutrition and human health. Afr. J. Microbiol. Res. 2011, 5, 844–852. [Google Scholar]
- Mariela, P.; Maria, C.C.; Chrysoula, T.; Guillermina, A.F.; Andreas, T.; Cecilia, E.L. Correlations of sensory parameters with physicochemical characteristics of Argentinean honeys by multivariate statistical techniques. Int. J. Food Sci. Technol. 2017, 1–10. [Google Scholar] [CrossRef]
- Bardy, J.; Slevin, N.J.; Mais, K.L.; Molassiotis, A. A systematic review of honey uses and its potential value within oncology care. J. Clin. Nurs. 2008, 17, 2604–2623. [Google Scholar] [CrossRef]
- Gül, A.; Pehlivan, T. Antioxidant activities of some monofloral honey types produced across turkey. Saudi J. Biol. Sci. 2018, 25, 1056–1065. [Google Scholar] [CrossRef]
- Mouhoubi-Tafinine, Z.; Ouchemoukh, S.; Bey Bachir, M.; Louaileche, H.; Tamendjari, A. Effect of storage on hydroxymethylfurfural (HMF) and color of some Algerian honey. Int. Food Res. J. 2018, 25, 1044–1050. [Google Scholar]
- Beretta, G.; Granata, P.; Ferrero, M.; Orioli, M.; Facino, R.M. Standardization of antioxidant properties of honey by a combination of spectrophotometric/fluorimetric assays and chemometrics. Anal. Chim. Acta 2005, 533, 185–191. [Google Scholar] [CrossRef]
- Boukraâ, L. Honey in Traditional and Modern Medicine. In Traditional Herbal Medicines for Modern Times; CRC Press, Taylor & Francis Group: New York, NY, USA, 2015. [Google Scholar]
- Kuś, P.M.; Szweda, P.; Jerković, I.; Tuberoso, C.I.G. Activity of Polish unifloral honeys against pathogenic bacteria and its correlation with color, phenolic content, antioxidant capacity and other parameters. Lett. Appl. Microbiol. 2016, 62, 269–276. [Google Scholar] [CrossRef]
- Das, A.; Datta, S.; Mukherjee, S.; Bose, S.; Ghosh, S.; Dhar, P. Evaluation of antioxidative, antibacterial and probiotic growth stimulatory activities of Sesamum indicum honey containing phenolic compounds and lignans. J. Food Sci. Technol. 2015, 61, 244–250. [Google Scholar] [CrossRef]
- FAO. A Guide to the Services Provided by Bees and the Sustainable Harvesting, Processing and Marketing of their Products; Food and Agriculture Organization of the United Nations: Rome, Italy, 2009. [Google Scholar]
- Gomes, S.; Dias, L.G.; Moreira, L.L.; Rodrigues, P.; Estevinho, L. Physicochemical, microbiological and antimicrobial properties of commercial honeys from Portugal. Food Chem. Toxicol. 2010, 48, 544–548. [Google Scholar] [CrossRef] [Green Version]
- Codex Alimentarius Commission. Draft Revised Standard for Honey (at Step 10 of the Codex Procedure); Codex Alimentarius Commission, FAO: Rome, Italy, 2001; Volume 25, pp. 19–26. [Google Scholar]
- Azenedo, L.; Azeredo, M.; De Souza, S.; Dautra, L. Protein content and physiochemical properties in honey samples of ApisMelliferaof different floral origins. Food Chem. 2003, 80, 249–254. [Google Scholar] [CrossRef]
- Scripca, L.; Amariei, S. Research on Honey Crystalization. Rev. de Chimie 2018, 69, 2953–2957. [Google Scholar]
- Alves, A.; Ramos, A.; Gonçalves, M.M.; Bernardo, M.; Mendes, B. Antioxidant activity, quality parameters and mineral content of Portuguese monofloral honeys. J. Food Composit. Analy. 2013, 30, 130–138. [Google Scholar] [CrossRef]
- Thrasyvoulou, A.; Tananaki, C.; Goras, G.; Karazafiris, E.; Dimou, M.; Liolios, V.; Gounari, S. Legislation of honey criteria and standards. J. Apicultural Res. 2018, 57, 88–96. [Google Scholar] [CrossRef]
- Kowalski, S.; Łukasiewicz, M.; Berski, W. Applicability of physico-chemical parameters of honey for identification of the botanical origin. Acta Sci. Polonorum. Technol. Aliment. 2013, 12, 51–59. [Google Scholar]
- Yücel, Y.; Sultanog, P. Characterization of honeys from hatay region by their physicochemical properties combined with chemometrics. Food Biosci. 2013, 1, 16–25. [Google Scholar] [CrossRef]
- Dobre, I.; Georgescu, L.A.; Alexe, P.; Escuredo, O.; Seijo, M.C. Rheological behavior of different honey types from Romania. Food Res. Int. 2012, 49, 126–132. [Google Scholar] [CrossRef]
- Escuredo, O.; Dobre, I.; Fernández-González, M.; Seijo, M.C. Contribution of botanical origin and sugar composition of honeys on the crystallization phenomenon. Food Chem. 2014, 149, 84–90. [Google Scholar] [CrossRef]
- Dimins, F.; Kuka, P.; Cakste, I. Content of carbohydrates and specific rotation angle of honey. In Proceedings of the 3rd Baltic Conference on Food Science and Technology, Jelgava, Latvia, 17–18 April 2008. [Google Scholar]
- Schuler, P. Natural antioxidants exploited commercially. In Food Antioxidants; Hudson, B.J.F., Ed.; Elsevier Applied Science: London, UK, 1990. [Google Scholar]
- Wintersteen, C.L.; Andrae, L.M.; Engeseth, N.J. Effect of heat treatment on antioxidant capacity and flavor volatiles of mead. J. Food Sci. 2007, 70, 119–126. [Google Scholar] [CrossRef]
- Kaskoniene, E.; Venskutonis, P.R. Floral Markers in Honey of Various Botanical and Geographic Origins: A Review. Compr. Rev. Food Sci. Food Safety 2010, 9, 620–634. [Google Scholar] [CrossRef]
- Campone, L.; Piccinelli, A.L.; Pagano, I.; Carabetta, S.; Di Sanzo, R.; Russo, M.; Rastrelli, L. Determination of phenolic compounds in honey using dispersie liquid-liquid microextraction. J. Chromatography A 2014, 1334, 5–9. [Google Scholar] [CrossRef]
- Leticia, M.; Estevinho, X.F.; Julio, A.; Seijas, M. Pilar Vazquez-Tato, Organic honey from Trás-Os-Montes region (Portugal): Chemical, palynological, microbiological and bioactive compounds characterization. Food Chem. Toxicol. 2012, 50, 258–264. [Google Scholar]
- –Brudzynski, K.; Maldonado-Alvarez, L. Identification of Ubiquinones in Honey: A New View on Their Potential Contribution to Honey’s Antioxidant State. Molecules 2018, 23, 3067. [Google Scholar] [CrossRef]
- Grecka, K.; Kuś, P.; Worobo, R.; Szweda, P. Study of the anti-staphylococcal potential of honeys produced in Northern Poland. Molecules 2018, 23, 260. [Google Scholar] [CrossRef]
- Bucekova, M.; Jardekova, L.; Juricova, V.; Bugarova, V.; Di Marco, G.; Gismondi, A.; Klaudiny, J. Antibacterial Activity of Different Blossom Honeys: New Findings. Molecules 2019, 24, 1573. [Google Scholar] [CrossRef]
- Mărghitaş Al, L.; Dezmirean, D.; Moisea, A.; Bobis, O.; Laslo, L.; Bogdanov, S. Physico-chemical and bioactive properties of different floral origin honeys from Romania. Food Chem. 2009, 863–867. [Google Scholar]
- Dżugan, M.; Tomczyk, M.; Sowa, P.; Grabek-Lejko, D. Antioxidant activity as biomarker of honey variety. Molecules 2018, 23, 2069. [Google Scholar] [CrossRef]
- Ciucure, C.T.; Geană, E.I. Phenolic compounds profile and biochemical properties of honeys in relationship to the honey floral sources. Phytochem. Analy. 2019, 30, 481–492. [Google Scholar] [CrossRef]
- Kavanagh, S.; Gunnoo, J.; Passos, T.M.; Stout, J.C.; White, B. Physicochemical properties and phenolic content of honey from different floral origins and from rural versus urban landscapes. Food Chem. 2019, 272, 66–75. [Google Scholar] [CrossRef]
- Granum, P.E. Bacillus cereus. Foodborne pathogens. Microbiol. Mol. Boil. 2005, 409–419. [Google Scholar]
- Pomastowski, P.; Złoch, M.; Rodzik, A.; Ligor, M.; Kostrzewa, M.; Buszewski, B. Analysis of bacteria associated with honeys of different geographical and botanical origin using two different identification approaches: MALDI-TOF MS and 16S rDNA PCR technique. PLoS ONE 2019, 14, e0217078. [Google Scholar] [CrossRef]
- Sanders, M.E.; Akkermans, L.M.; Haller, D.; Hammerman, C.; Heimbach, J.T.; Hörmannsperger, G.; Huys, G. Safety assessment of probiotics for human use. Gut Microbes 2010, 1, 164–185. [Google Scholar] [CrossRef]
- Serra, C.R.; Almeida, E.M.; Guerreiro, I.; Santos, R.; Merrifield, D.L.; Tavares, F.; Enes, P. Selection of carbohydrate-active probiotics from the gut of carnivorous fish fed plant-based diets. Sci. Rep. 2019, 9, 6384. [Google Scholar] [CrossRef]
- Bogdanov, S. Harmonised Methods of the European Honey Commision. 2002, e, 1–63. Available online: http://www.ihc-platform.net/ihcmethods2009.pdf (accessed on 23 January 2019).
- Biesaga, M.; Pyrzyńska, K. Stability of bioactive polyphenols from honey during different extraction methods. Food chem. 2013, 136, 46–54. [Google Scholar] [CrossRef]
- Pontis, J.A.; Costa, L.A.M.A.D.; Silva, S.J.R.D.; Flach, A. Color, phenolic and flavonoid content, and antioxidant activity of honey from Roraima, Brazil. Food Sci. Technol. 2014, 34, 69–73. [Google Scholar] [CrossRef] [Green Version]
- Nii Korley, K.; George, T.O.; Mary, O.; Victoria, A.; Papa, T.A. Determination of color parameters of gamma irradiated, fresh and dried mushrooms during storage, Croatian. J. Food Technol. Biotechnol. Nutr. 2015, 10, 66–71. [Google Scholar]
- Ankit Kumar, V.K. Tiwari, Studies on color parameters of brown rice at various moisture contents using different storage structures. Res. Env. Life Sci. 2017, 10, 315–318. [Google Scholar]
- Naman, M.; Faid, M.; Chakib, E.A. Microbiological and physico-chemical proprieties of Marocan Honey. Int. J. Agric. Bio. 2005, 7, 773–776. [Google Scholar]
Sample Availability: The honey samples are available from the authors for limited time. |


| Honey Variety | Water Content, % | L* | a* | b* | Chroma | Hue angle, (degrees) | Yellow Index | Conductivity (mS/cm) | Viscosity (Pa·s) | |
|---|---|---|---|---|---|---|---|---|---|---|
| Rape (n = 14) | Mean ± SD | 17.32 ± 0.45 | 26.06 ± 5.55 | −0.72 ± 0.64 | 7.83 ± 4.12 | 3.51 ± 0.93 | 84.99 ± 3.36 | 42.48 ± 6.05 | 0.14 ± 0.02 | 12.69 ± 1.12 |
| Min | 16.70 | 17.61 | −2.19 | 4.56 | 2.66 | 76.77 | 25.03 | 0.11 | 10.96 | |
| Max | 18.00 | 38.07 | −0.14 | 18.61 | 5.79 | 88.81 | 78.93 | 0.19 | 14.73 | |
| Honeydew (n = 9) | Mean ± SD | 16.62 ± 0.71 | 21.71 ± 1.38 | 7.06 ± 1.20 | 8.36 ± 1.45 | 5.53 ± 0.38 | 49.72 ± 5.55 | 55.24 ± 10.10 | 0.64 ± 0.05 | 8.46 ± 0.74 |
| Min | 15.70 | 19.67 | 5.35 | 6.17 | 4.80 | 41.82 | 36.97 | 0.57 | 7.14 | |
| Max | 17.90 | 23.84 | 9.29 | 10.24 | 5.94 | 57.29 | 69.40 | 0.73 | 9.47 | |
| Polyfloral (n = 16) | Mean ± SD | 16.78 ± 0.65 | 36.13 ± 2.16 | 4.69 ± 0.74 | 13.77 ± 0.57 | 5.87 ± 0.22 | 71.26 ± 2.51 | 54.67 ± 4.43 | 0.38 ± 0.05 | 6.63 ± 1.30 |
| Min | 15.90 | 31.90 | 3.24 | 12.74 | 5.46 | 66.28 | 48.87 | 0.28 | 4.18 | |
| Max | 17.90 | 39.65 | 5.98 | 14.82 | 6.21 | 76.39 | 62.14 | 0.45 | 8.62 | |
| Linden (n = 21) | Mean ± SD | 17.01 ± 0.51 | 33.06 ± 1.76 | −0.49 ± 0.31 | 13.85 ± 0.69 | 4.39 ± 0.21 | 87.96 ± 1.32 | 60.02 ± 4.50 | 0.61 ± 0.04 | 6.37 ± 0.96 |
| Min | 16.00 | 27.92 | −1.21 | 12.43 | 4.02 | 85.05 | 51.29 | 0.55 | 4.76 | |
| Max | 17.90 | 35.27 | −0.12 | 14.94 | 4.84 | 89.52 | 70.20 | 0.72 | 8.06 | |
| Acacia (n = 21) | Mean ± SD | 17.13 ± 0.48 | 49.26 ± 2.23 | −1.11 ± 0.32 | 15.05 ± 1.07 | 4.92 ± 0.17 | 85.73 ± 1.30 | 43.77 ± 4.01 | 0.28 ± 0.04 | 3.35 ± 0.65 |
| Min | 16.30 | 45.28 | −1.69 | 13.25 | 4.56 | 83.20 | 35.98 | 0.22 | 2.12 | |
| Max | 18.00 | 52.61 | −0.45 | 16.38 | 5.29 | 88.43 | 51.27 | 0.35 | 4.27 | |
| Grassland (n = 12) | Mean ± SD | 17.03 ± 0.38 | 32.77 ± 1.94 | 1.81 ± 1.74 | 13.31 ± 0.78 | 4.87 ± 0.52 | 82.22 ± 7.46 | 58.15 ± 3.68 | 0.31 ± 0.04 | 7.71 ± 0.72 |
| Min | 16.30 | 29.34 | 0.31 | 12.15 | 4.35 | 62.63 | 52.04 | 0.24 | 6.39 | |
| Max | 17.60 | 35.23 | 6.29 | 14.59 | 5.99 | 88.78 | 63.39 | 0.35 | 8.64 | |
| Honey Variety | Sugars (g/100 g) | |||||||||||
|---|---|---|---|---|---|---|---|---|---|---|---|---|
| Glucose | Fructose | Sucrose | Trehalose | Melezitose | Maltose | Erlose | Turanose | Raffinose | G/F | G/W | ||
| Rape (n = 14) | Mean ± SD | 39.95 ± 1.54 | 30.26 ± 1.06 | 0.93 ± 0.66 | 0.01 ± 0.00 | 0.01 ± 0.00 | 0.29 ± 0.43 | 0.00 ± 0.02 | 0.17 ± 0.13 | 0.05 ± 0.12 | 1.31 ± 0.09 | 2.30 ± 0.12 |
| Min. | 38.02 | 28.58 | 0.00 | 0.00 | 0.00 | 0.00 | 0.00 | 0.01 | 0.00 | 1.20 | 2.16 | |
| Max. | 42.55 | 31.54 | 1.76 | 0.02 | 0.02 | 1.24 | 0.10 | 0.44 | 0.43 | 1.48 | 2.49 | |
| Honeydew (n = 9) | Mean ± SD | 36.41 ± 0.54 | 32.41 ± 0.19 | 1.36 ± 0.28 | 0.04 ± 0.00 | 4.89 ± 1.56 | 0.27 ± 0.33 | 0.42 ± 0.53 | 0.10 ± 0.06 | 0.01 ± 0.01 | 1.12 ± 0.02 | 2.19 ± 0.09 |
| Min. | 35.68 | 32.14 | 0.74 | 0.03 | 1.24 | 0.00 | 0.00 | 0.03 | 0.00 | 1.09 | 2.03 | |
| Max. | 37.21 | 32.68 | 1.80 | 0.04 | 5.84 | 0.76 | 1.54 | 0.20 | 0.02 | 1.15 | 2.34 | |
| Polyfloral (n = 16) | Mean ± SD | 31.96 ± 0.26 | 38.55 ± 0.61 | 1.12 ± 0.57 | 0.25 ± 0.02 | 0.71 ± 0.14 | 0.01 ± 0.02 | 1.23 ± 2.66 | 0.23 ± 0.20 | 0.03 ± 0.01 | 0.82 ± 0.02 | 1.90 ± 0.07 |
| Min. | 31.62 | 37.54 | 0.19 | 0.23 | 0.58 | 0.00 | 0.00 | 0.00 | 0.01 | 0.80 | 1.79 | |
| Max. | 32.31 | 39.35 | 1.95 | 0.28 | 1.12 | 0.08 | 8.85 | 0.71 | 0.05 | 0.86 | 2.02 | |
| Linden (n = 21) | Mean ± SD | 30.88 ± 0.41 | 40.48 ± 0.53 | 0.51 ± 0.44 | 0.32 ± 0.03 | 1.98 ± 0.42 | 0.20 ± 0.53 | 0.08 ± 0.16 | 0.11 ± 0.12 | 0.05 ± 0.09 | 0.76 ± 0.02 | 1.81 ± 0.06 |
| Min. | 30.30 | 39.43 | 0.08 | 0.28 | 1.13 | 0.00 | 0.00 | 0.00 | 0.00 | 0.73 | 1.70 | |
| Max. | 31.56 | 41.15 | 1.67 | 0.38 | 2.56 | 2.34 | 0.68 | 0.40 | 0.38 | 0.80 | 1.92 | |
| Acacia (n = 21) | Mean ± SD | 26.21 ± 1.62 | 44.11 ± 1.03 | 0.63 ± 0.51 | 1.85 ± 0.95 | 0.04 ± 0.01 | 0.05 ± 0.14 | 0.53 ± 1.15 | 0.12 ± 0.14 | 0.02 ± 0.03 | 0.59 ± 0.05 | 1.53 ± 0.10 |
| Min. | 23.63 | 42.65 | 0.04 | 0.83 | 0.03 | 0.00 | 0.00 | 0.00 | 0.00 | 0.51 | 1.32 | |
| Max. | 28.26 | 45.98 | 1.58 | 3.74 | 0.07 | 0.62 | 4.28 | 0.45 | 0.13 | 0.66 | 1.66 | |
| Grassland (n = 12) | Mean ± SD | 36.82 ± 1.91 | 36.64 ± 3.66 | 0.60 ± 0.28 | 0.29 ± 0.20 | 1.88 ± 1.36 | 0.18 ± 0.31 | 0.07 ± 0.15 | 0.19 ± 0.16 | 0.02 ± 0.01 | 1.02 ± 0.14 | 2.16 ± 0.12 |
| Min. | 34.26 | 31.85 | 0.27 | 0.03 | 0.03 | 0.00 | 0.00 | 0.01 | 0.00 | 0.83 | 1.99 | |
| Max. | 39.98 | 41.23 | 0.99 | 0.47 | 3.11 | 0.87 | 0.52 | 0.44 | 0.04 | 1.19 | 2.34 | |
| Honey Variety | Phenolic Compound (mg/100 g) | ||||||||||||||
|---|---|---|---|---|---|---|---|---|---|---|---|---|---|---|---|
| Gallic Acid | Protocatechuic Acid | 4-Hydroxy Benzoic Acid | Vanilic Acid | Chlorogenic Acid | Caffeic Acid | P-Coumaric Acid | Rosmarinic Acid | Myricetin | Quercitin | Luteolin | Kaempferol | Total Poliphenols | Total Poliphenols Content, mg GAE/100 g | ||
| Rape (n = 14) | Mean ± SD | 0.00 ± 0.01 | 0.01 ± 0.05 | 0.01 ± 0.03 | 0.01 ± 0.03 | 0.02 ± 0.05 | 0.04 ± 0.05 | 0.03 ± 0.05 | 0.00 ± 0.00 | 0.00 ± 0.00 | 0.00 ± 0.00 | 0.00 ± 0.00 | 0.00 ± 0.00 | 0.14 ± 0.04 | 0.17 ± 0.02 |
| Min | 0.00 | 0.00 | 0.00 | 0.00 | 0.00 | 0.00 | 0.00 | 0.00 | 0.00 | 0.00 | 0.00 | 0.00 | 0.08 | 0.12 | |
| Max | 0.07 | 0.21 | 0.14 | 0.14 | 0.17 | 0.15 | 0.16 | 0.00 | 0.00 | 0.00 | 0.00 | 0.00 | 0.21 | 0.22 | |
| Honeydew (n = 9) | Mean ± SD | 0.14 ± 0.22 | 2.44 ± 4.62 | 0.18 ± 0.37 | 5.74 ± 9.19 | 0.37 ± 0.65 | 0.74 ± 1.80 | 0.12 ± 0.09 | 14.01 ± 23.95 | 3.47 ± 6.47 | 2.91 ± 6.95 | 0.08 ± 0.24 | 0.27 ± 0.40 | 30.49 ± 22.13 | 32.5 ± 0.8 |
| Min | 0.00 | 0.00 | 0.00 | 0.00 | 0.00 | 0.00 | 0.00 | 0.00 | 0.00 | 0.00 | 0.00 | 0.00 | 14.87 | 14.95 | |
| Max | 0.61 | 13.32 | 0.99 | 24.81 | 1.78 | 5.53 | 0.23 | 60.60 | 19.75 | 21.21 | 0.71 | 1.18 | 80.38 | 80.47 | |
| Polyfloral (n = 16) | Mean ± SD | 1.27 ± 2.10 | 0.15 ± 0.24 | 0.08 ± 0.18 | 1.20 ± 1.03 | 0.13 ± 0.31 | 0.14 ± 0.45 | 0.29 ± 0.55 | 3.80 ± 2.37 | 0.50 ± 0.85 | 1.23 ± 1.89 | 0.07 ± 0.28 | 0.24 ± 0.35 | 9.13 ± 1.84 | 9.36 ± 1.82 |
| Min | 0.00 | 0.00 | 0.00 | 0.00 | 0.00 | 0.00 | 0.00 | 0.00 | 0.00 | 0.00 | 0.00 | 0.00 | 6.54 | 6.78 | |
| Max | 5.23 | 0.65 | 0.52 | 3.10 | 1.16 | 1.84 | 2.32 | 6.57 | 2.26 | 6.13 | 1.12 | 1.21 | 12.81 | 12.94 | |
| Linden (n = 21) | Mean± SD | 1.10 ± 1.28 | 0.22 ± 0.43 | 0.10 ± 0.19 | 0.00 ± 0.00 | 0.15 ± 0.47 | 0.10 ± 0.28 | 0.12 ± 0.29 | 0.57 ± 1.36 | 0.31 ± 0.59 | 0.03 ± 0.10 | 0.00 ± 0.00 | 0.01 ± 0.04 | 2.71 ± 1.64 | 2.83 ± 1.63 |
| Min | 0.00 | 0.00 | 0.00 | 0.00 | 0.00 | 0.00 | 0.00 | 0.00 | 0.00 | 0.00 | 0.00 | 0.00 | 0.94 | 1.06 | |
| Max | 3.97 | 1.72 | 0.54 | 0.00 | 2.15 | 1.20 | 1.25 | 4.67 | 1.92 | 0.48 | 0.00 | 0.20 | 5.44 | 5.49 | |
| Acacia (n = 21) | Mean± SD | 0.02 ± 0.05 | 0.00 ± 0.00 | 0.00 ± 0.01 | 0.00 ± 0.02 | 0.01 ± 0.03 | 0.03 ± 0.03 | 0.02 ± 0.06 | 0.00 ± 0.00 | 0.00 ± 0.00 | 0.00 ± 0.00 | 0.00 ± 0.00 | 0.00 ± 0.00 | 0.08 ± 0.06 | 0.09 ± 0.05 |
| Min | 0.00 | 0.00 | 0.00 | 0.00 | 0.00 | 0.00 | 0.00 | 0.00 | 0.00 | 0.00 | 0.00 | 0.00 | 0.02 | 0.04 | |
| Max | 0.20 | 0.00 | 0.02 | 0.09 | 0.14 | 0.09 | 0.29 | 0.00 | 0.00 | 0.00 | 0.00 | 0.00 | 0.28 | 0.32 | |
| Grassland (n = 12) | Mean ± SD | 0.53 ± 1.50 | 2.31 ± 3.52 | 0.52 ± 1.40 | 7.35 ± 12.48 | 0.41 ± 1.34 | 0.44 ± 1.08 | 3.78 ± 8.60 | 3.35 ± 2.81 | 0.92 ± 1.10 | 1.16 ± 1.52 | 0.14 ± 0.32 | 0.60 ± 1.27 | 21.50 ± 10.73 | 22.16 ± 11.01 |
| Min | 0.00 | 0.00 | 0.00 | 0.00 | 0.00 | 0.00 | 0.00 | 0.00 | 0.00 | 0.00 | 0.00 | 0.00 | 12.97 | 13.01 | |
| Max | 5.23 | 8.85 | 4.78 | 44.81 | 4.67 | 3.56 | 24.23 | 6.23 | 2.67 | 4.26 | 0.92 | 4.53 | 45.85 | 45.88 | |
© 2019 by the authors. Licensee MDPI, Basel, Switzerland. This article is an open access article distributed under the terms and conditions of the Creative Commons Attribution (CC BY) license (http://creativecommons.org/licenses/by/4.0/).
Share and Cite
Scripcă, L.A.; Norocel, L.; Amariei, S. Comparison of Physicochemical, Microbiological Properties and Bioactive Compounds Content of Grassland Honey and other Floral Origin Honeys. Molecules 2019, 24, 2932. https://doi.org/10.3390/molecules24162932
Scripcă LA, Norocel L, Amariei S. Comparison of Physicochemical, Microbiological Properties and Bioactive Compounds Content of Grassland Honey and other Floral Origin Honeys. Molecules. 2019; 24(16):2932. https://doi.org/10.3390/molecules24162932
Chicago/Turabian StyleScripcă, Laura Agripina, Liliana Norocel, and Sonia Amariei. 2019. "Comparison of Physicochemical, Microbiological Properties and Bioactive Compounds Content of Grassland Honey and other Floral Origin Honeys" Molecules 24, no. 16: 2932. https://doi.org/10.3390/molecules24162932
APA StyleScripcă, L. A., Norocel, L., & Amariei, S. (2019). Comparison of Physicochemical, Microbiological Properties and Bioactive Compounds Content of Grassland Honey and other Floral Origin Honeys. Molecules, 24(16), 2932. https://doi.org/10.3390/molecules24162932