
Comparison of Retention Behavior between Supercritical Fluid Chromatography and Normal-Phase High-Performance Liquid Chromatography with Various Stationary Phases


Abstract
:1. Introduction
2. Results and Discussion
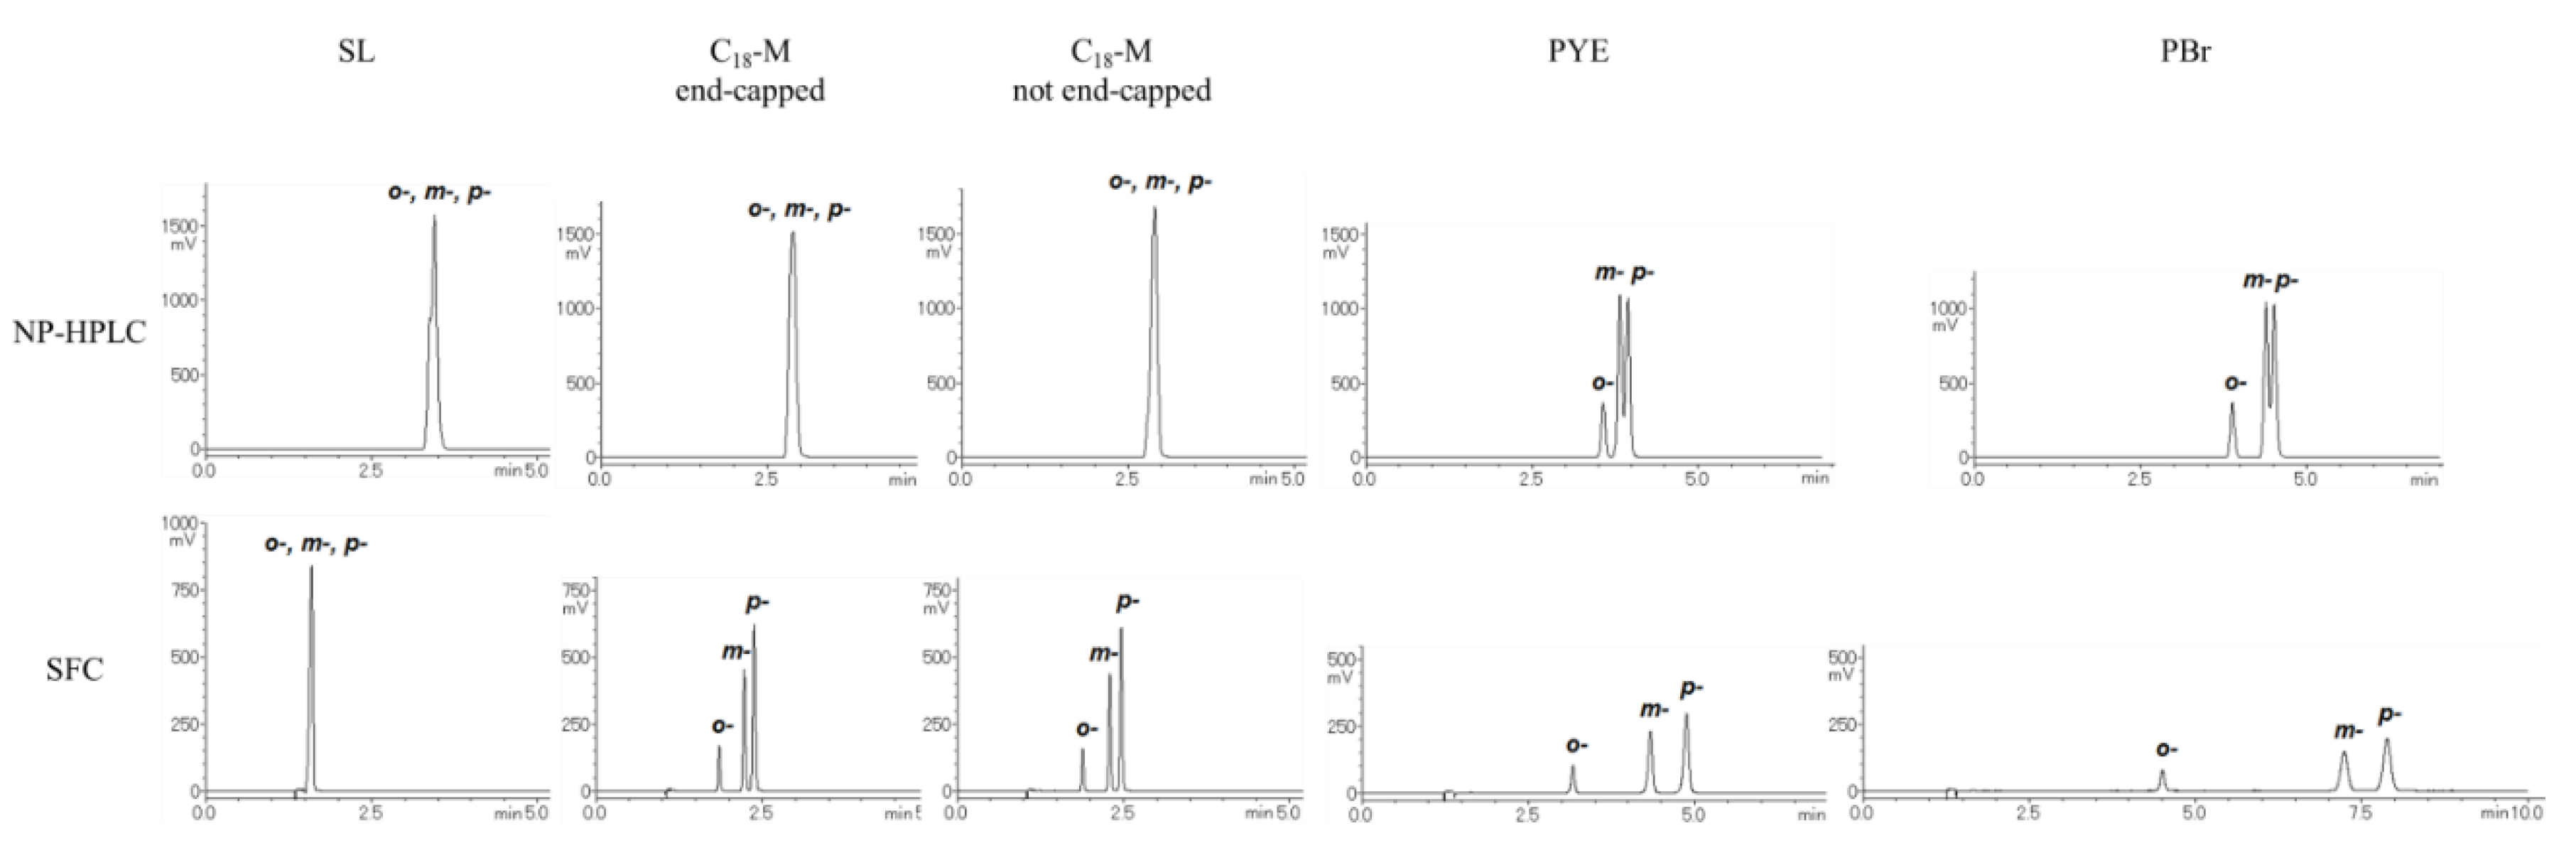
2.1. Comparison between NP-HPLC and SFC
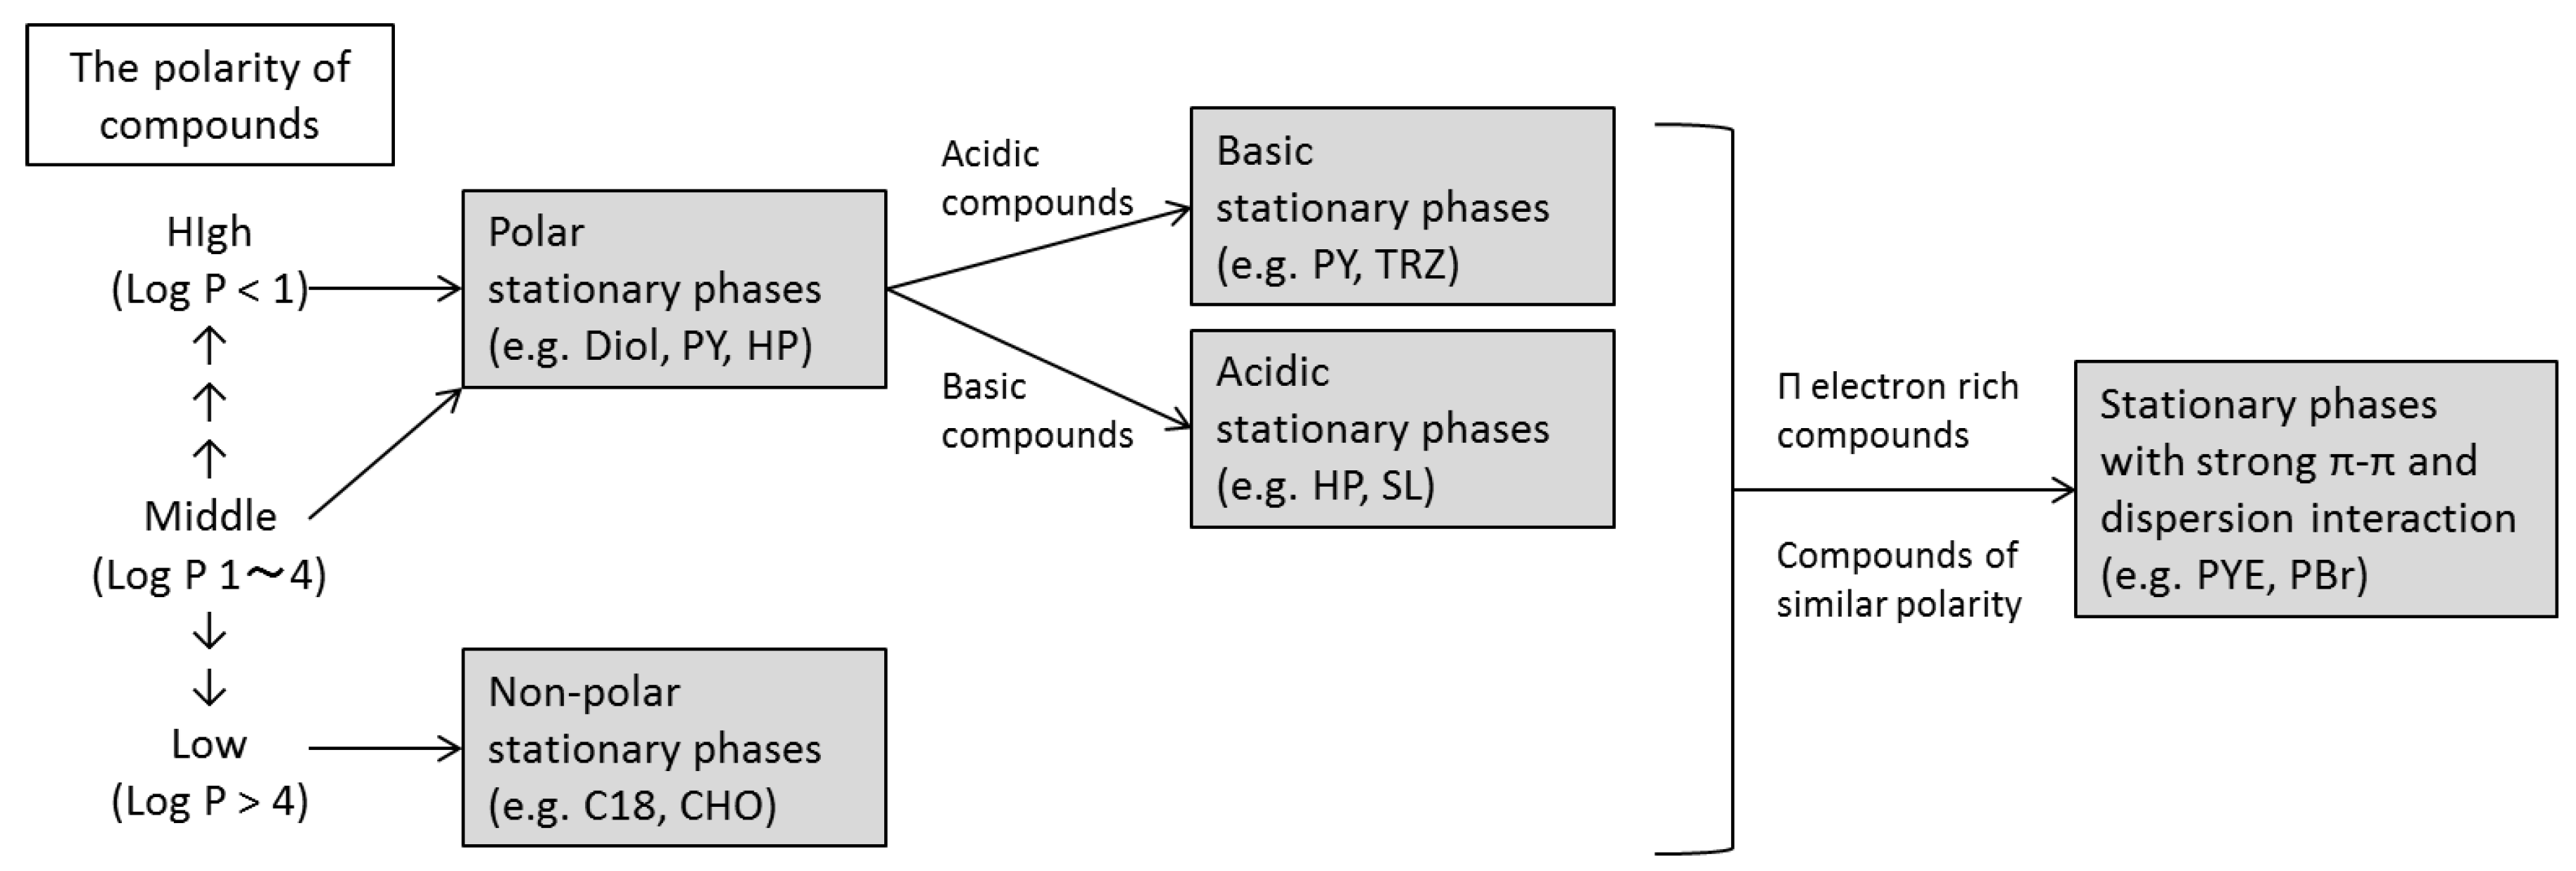
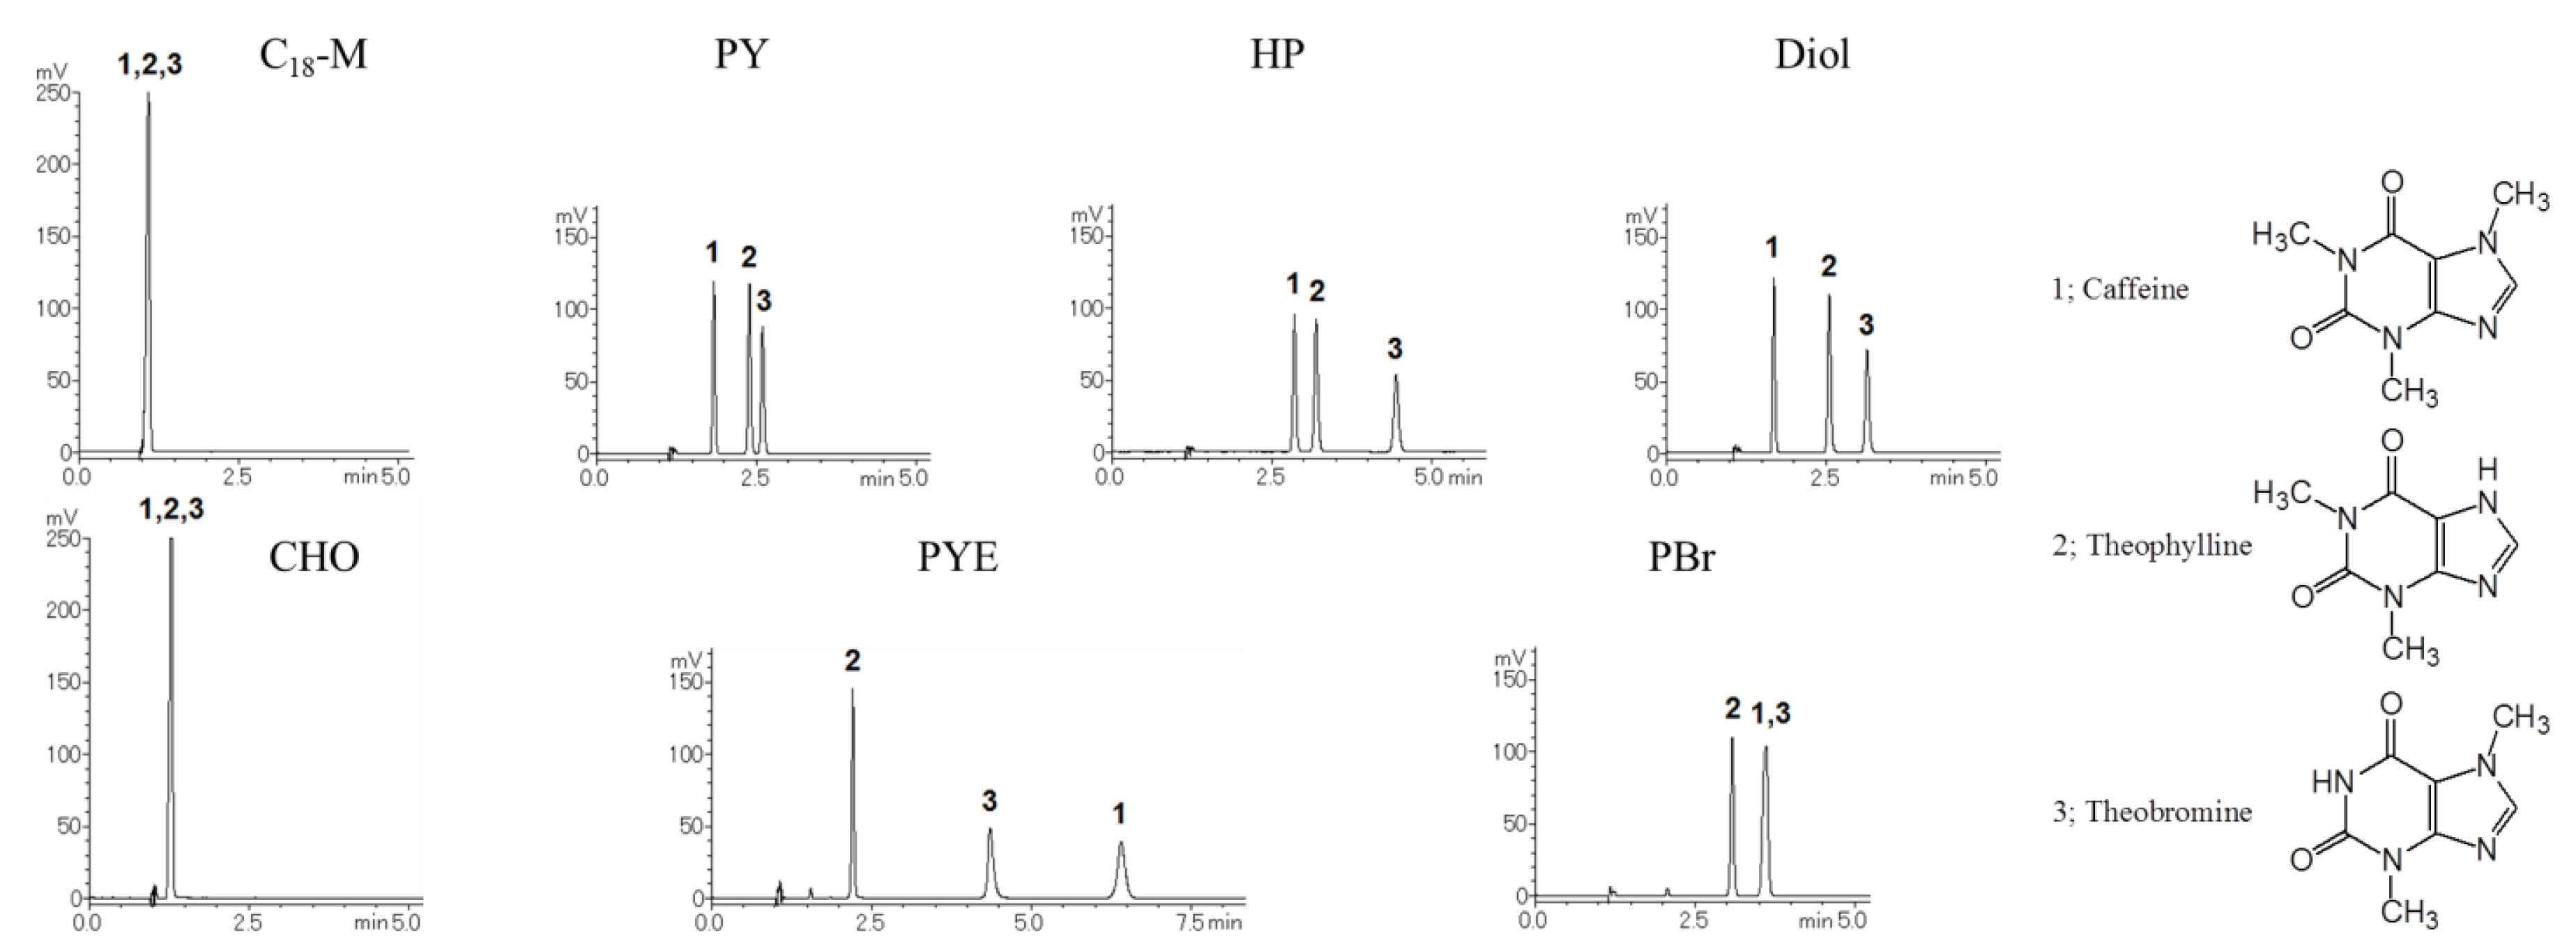
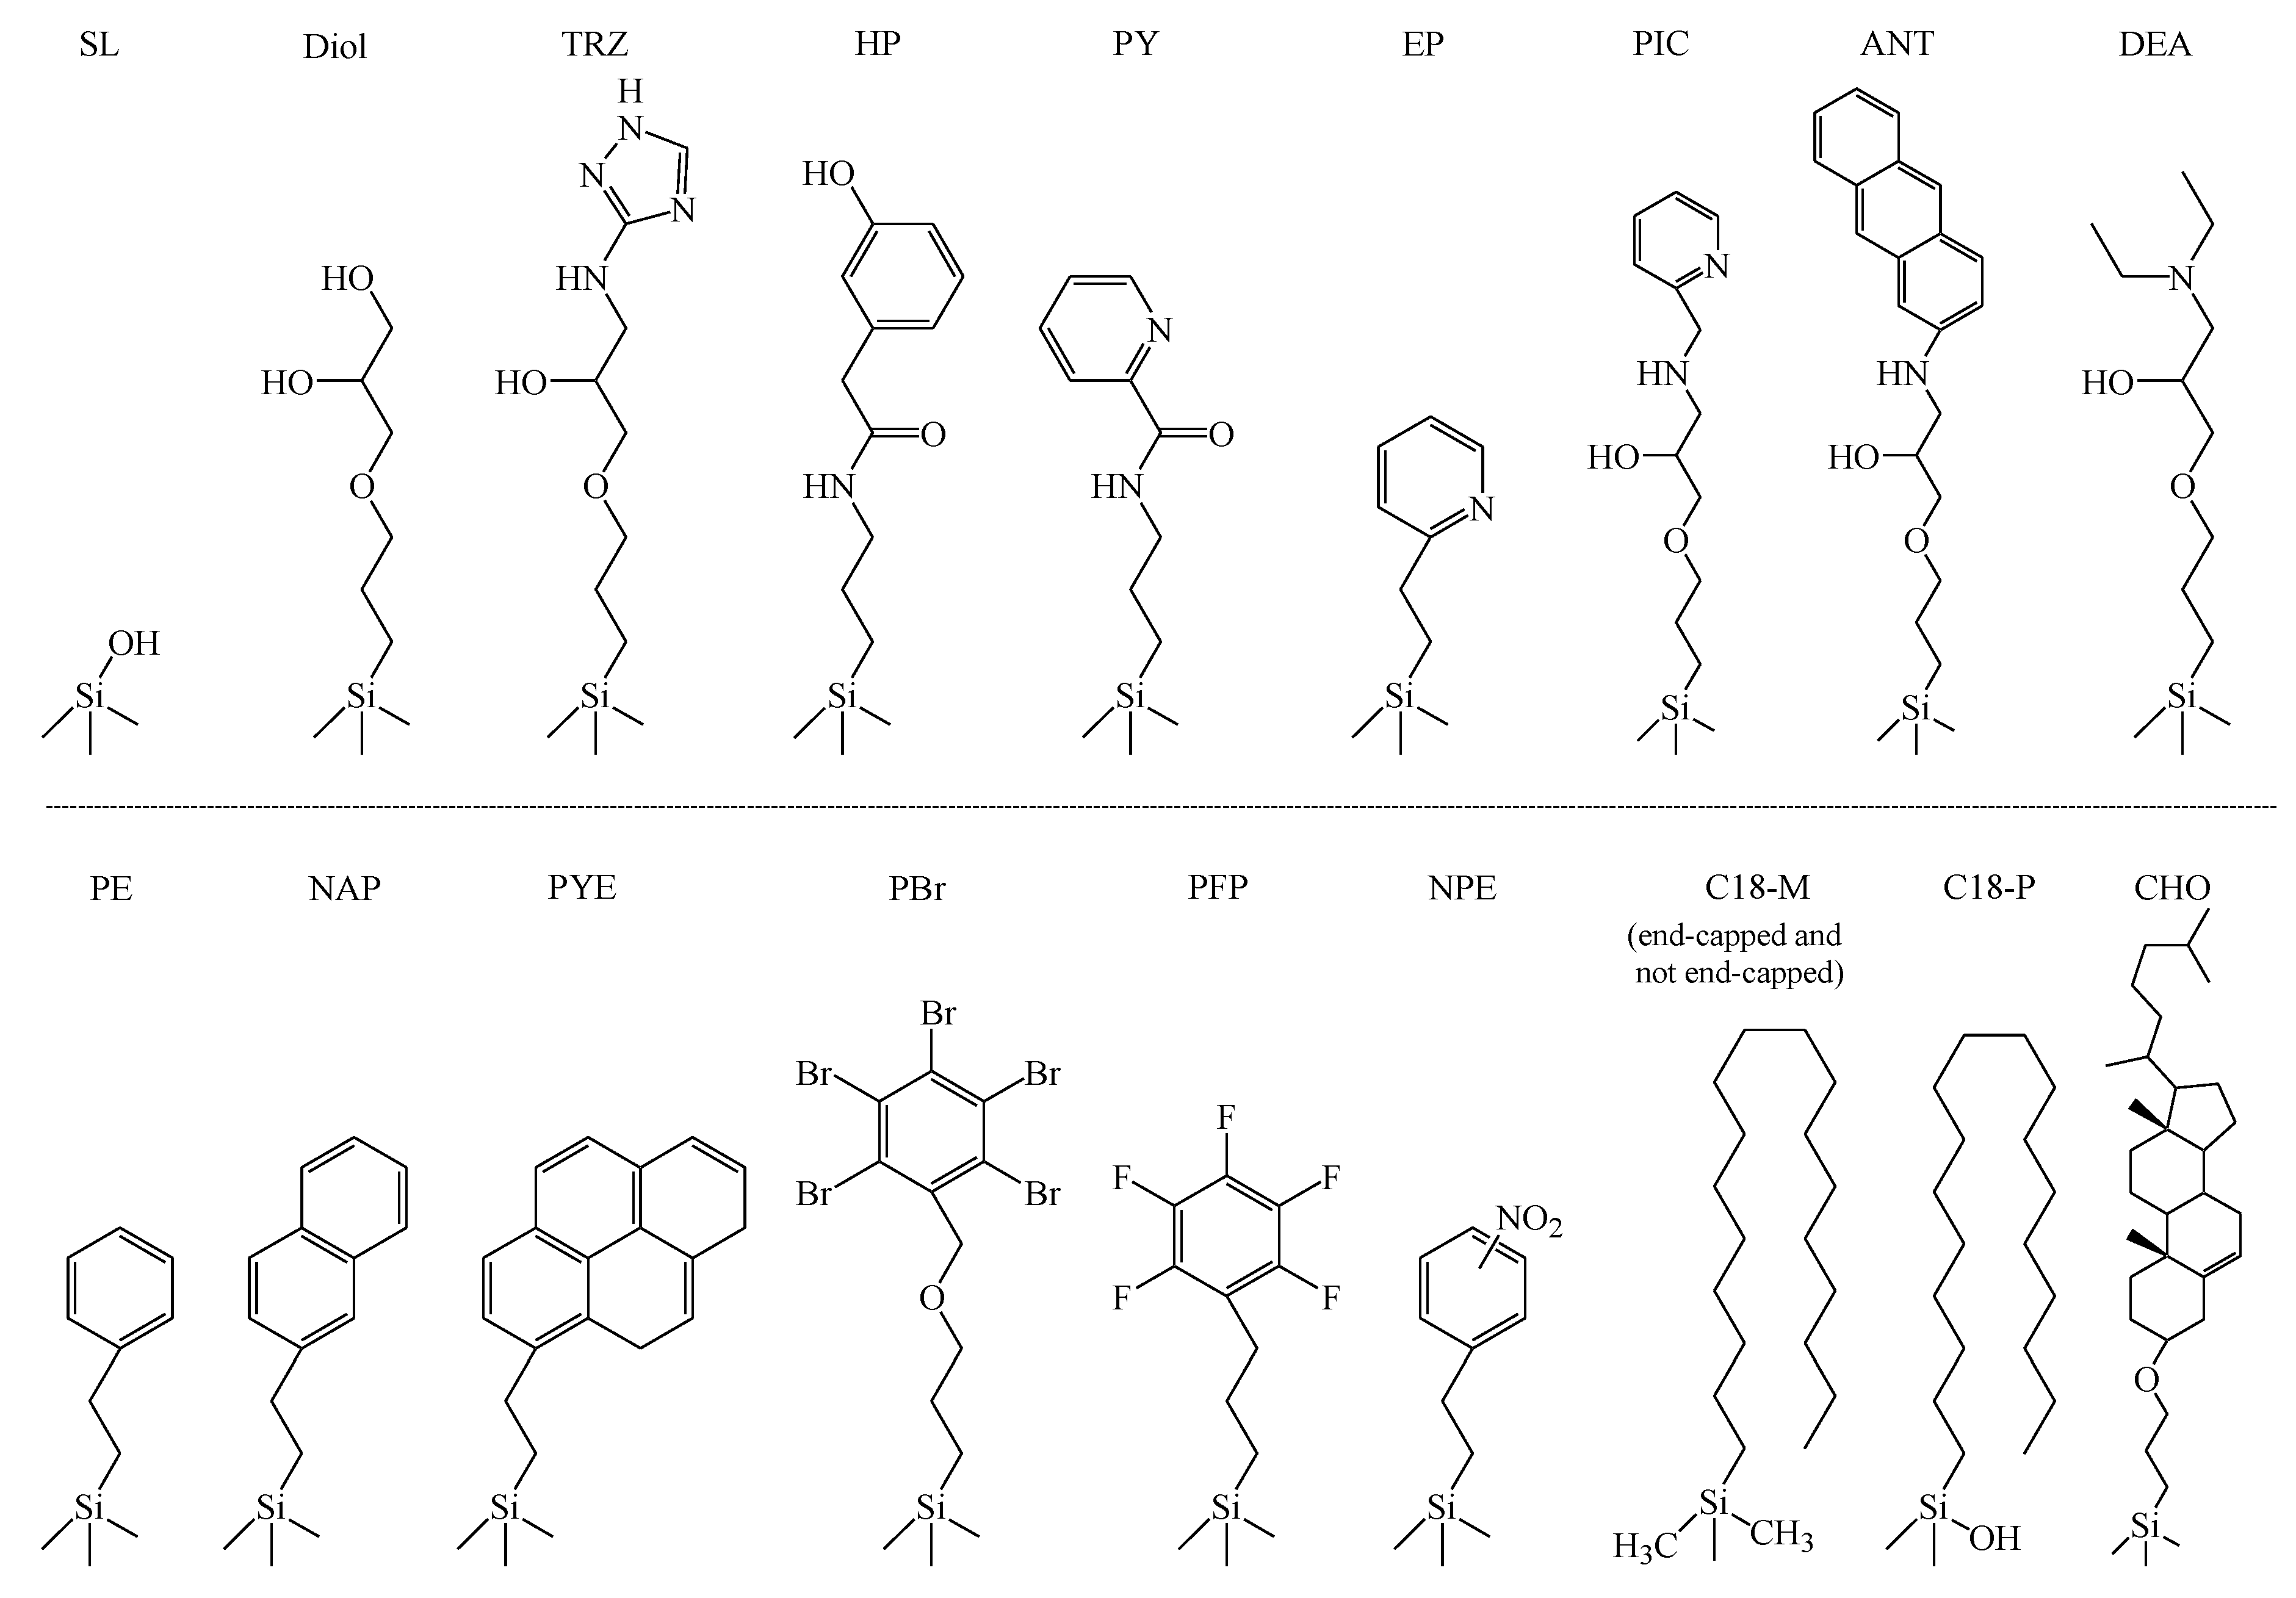
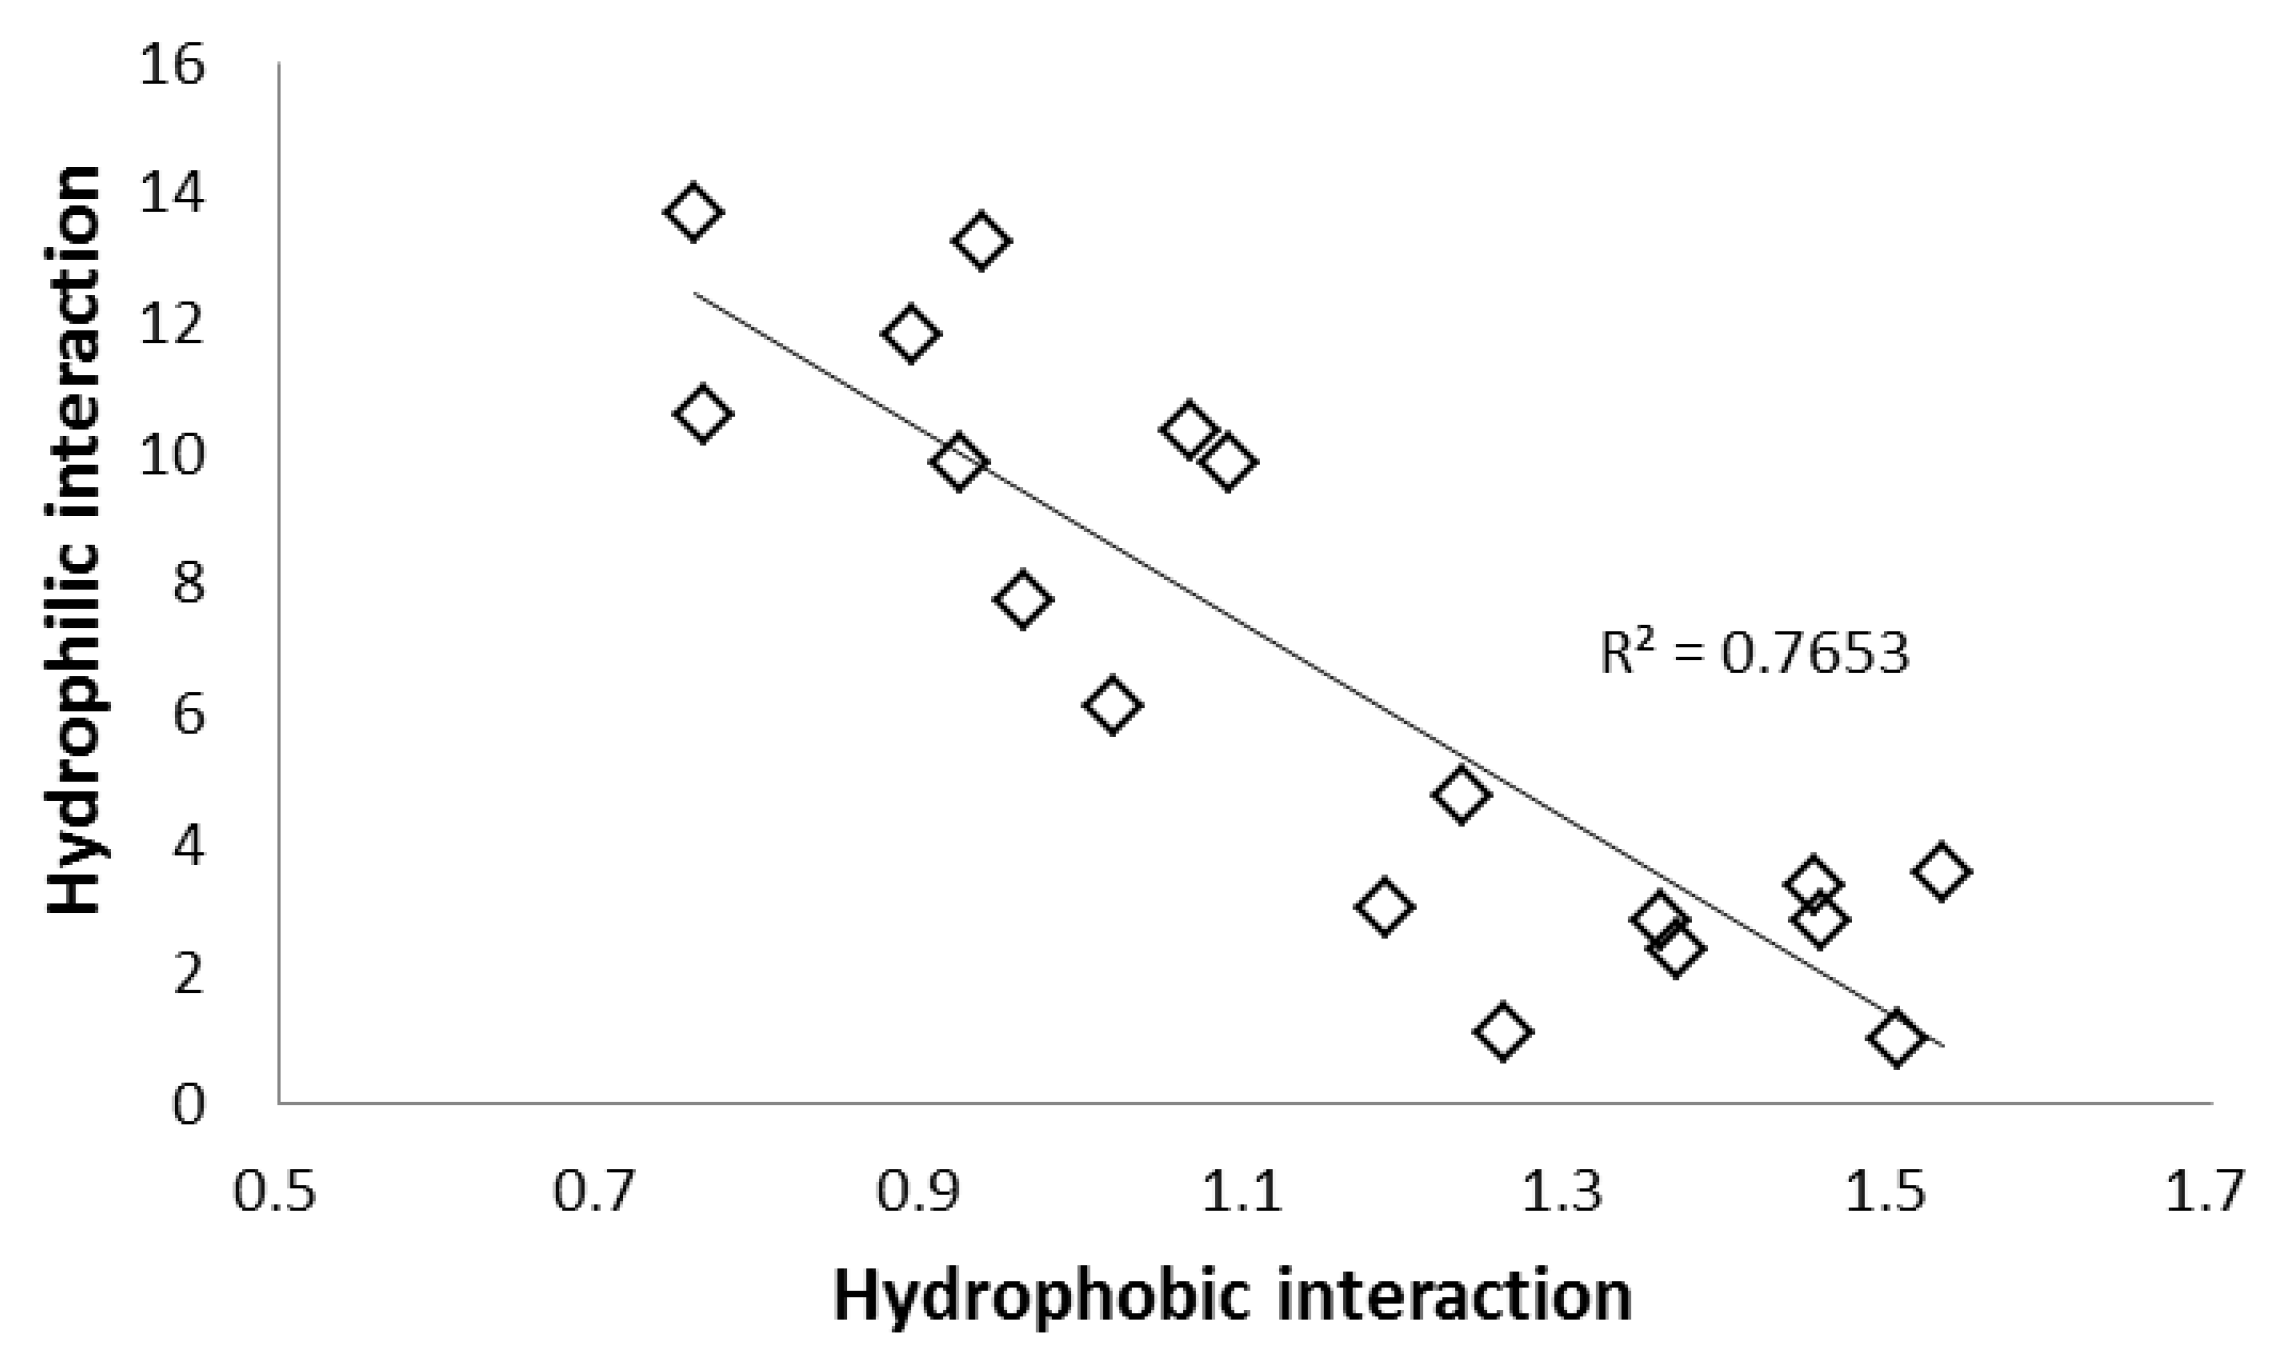
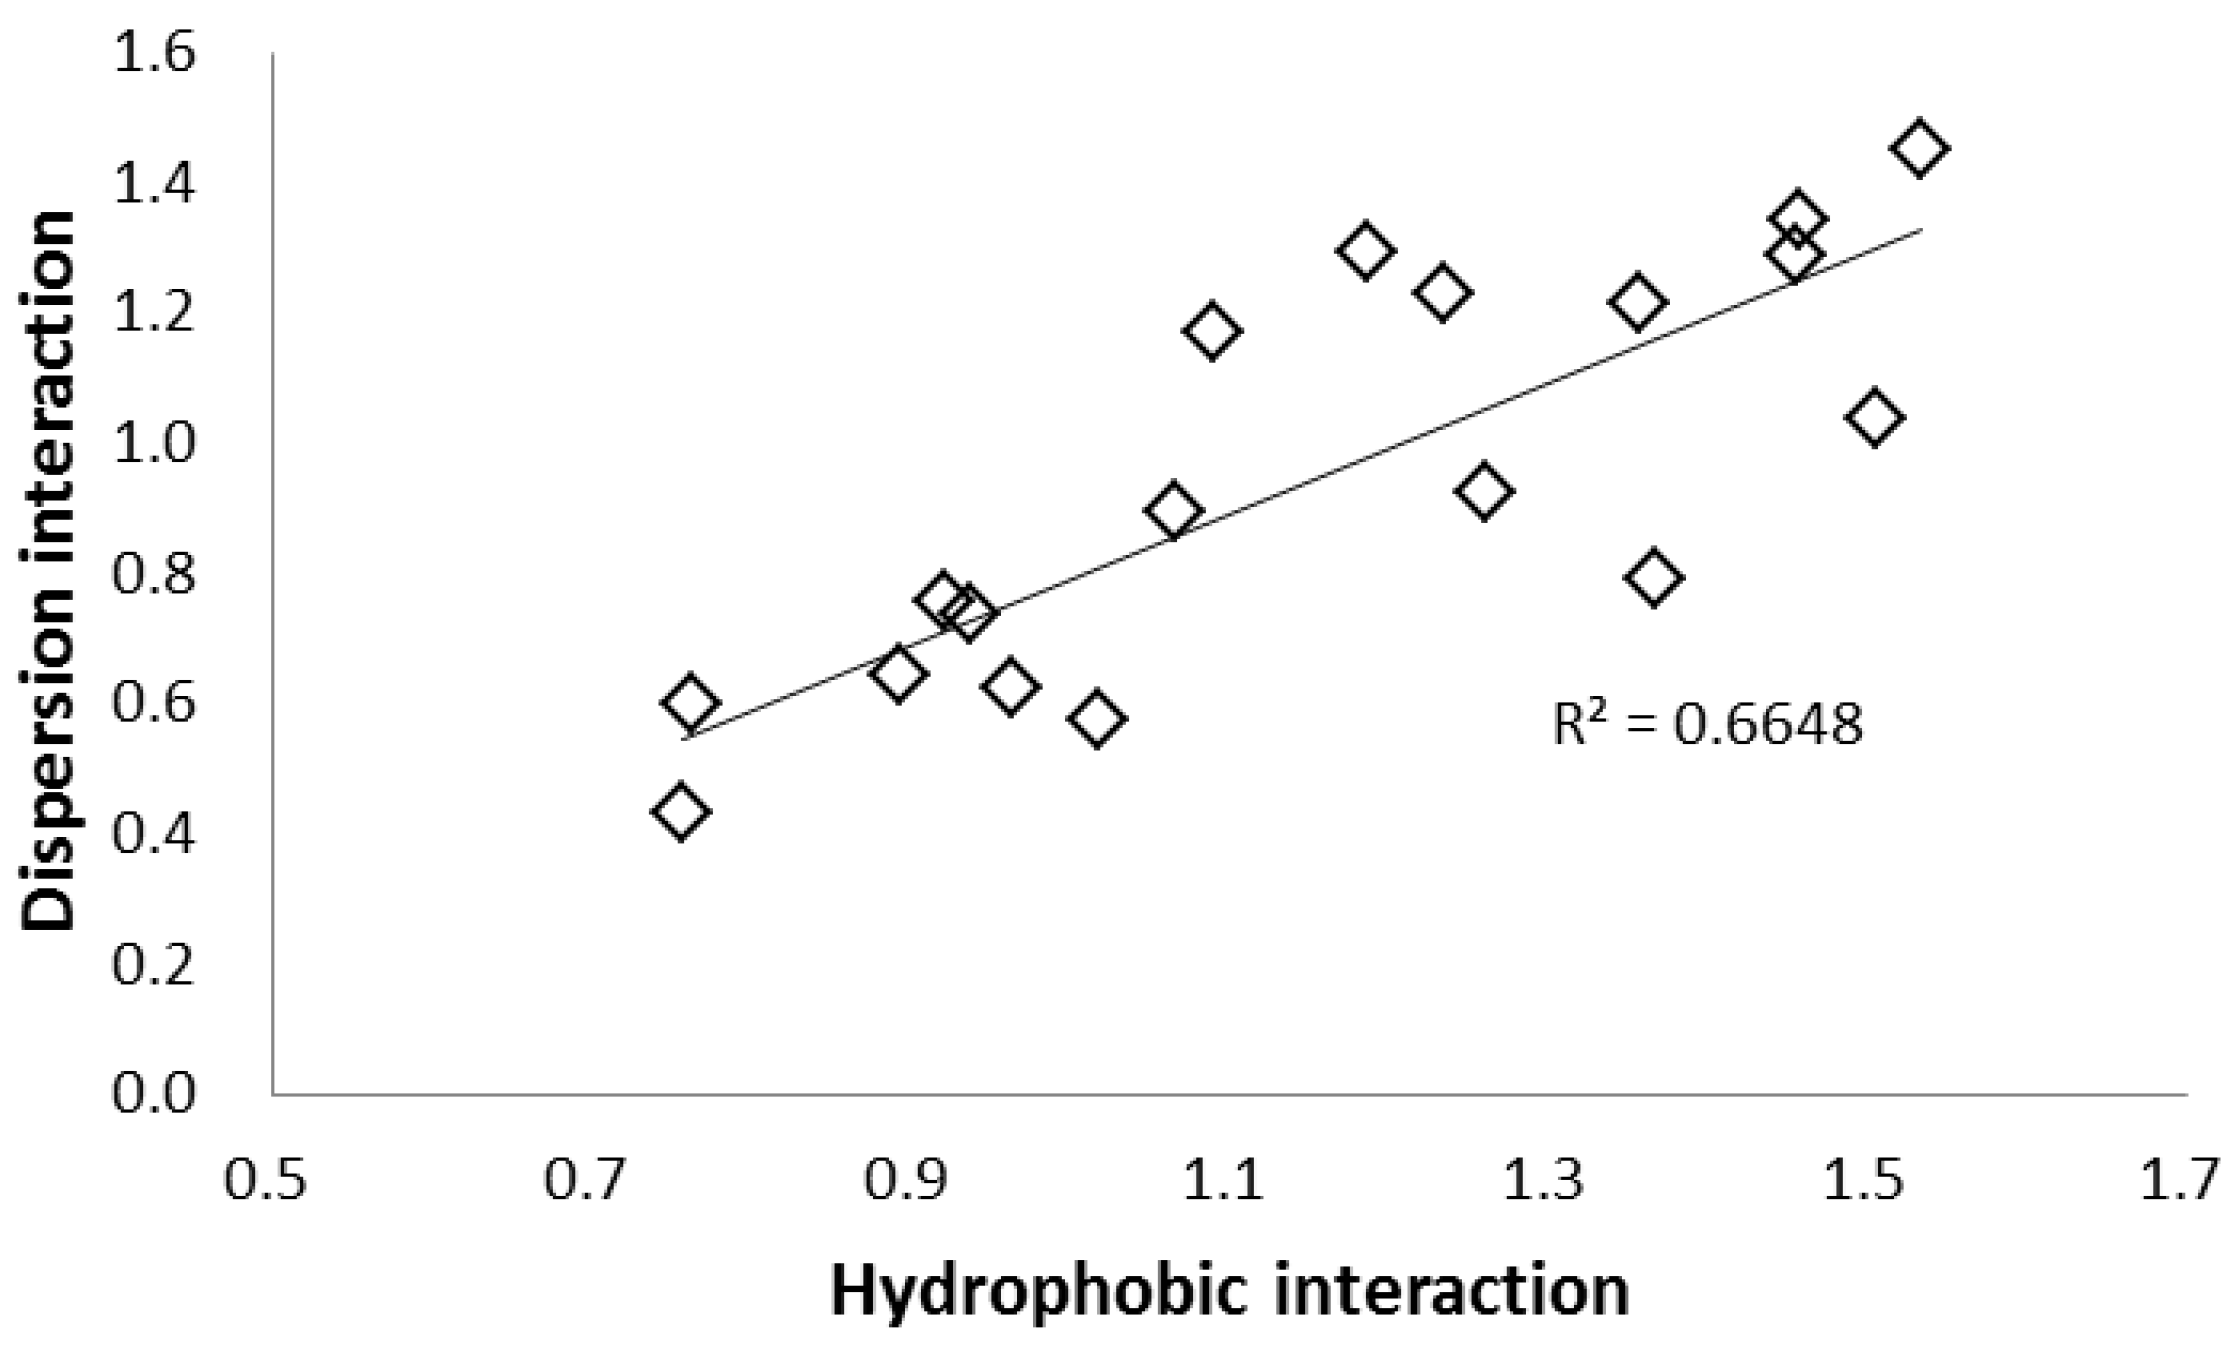
2.2. Selectivity of the Stationary Phases
3. Materials and Methods
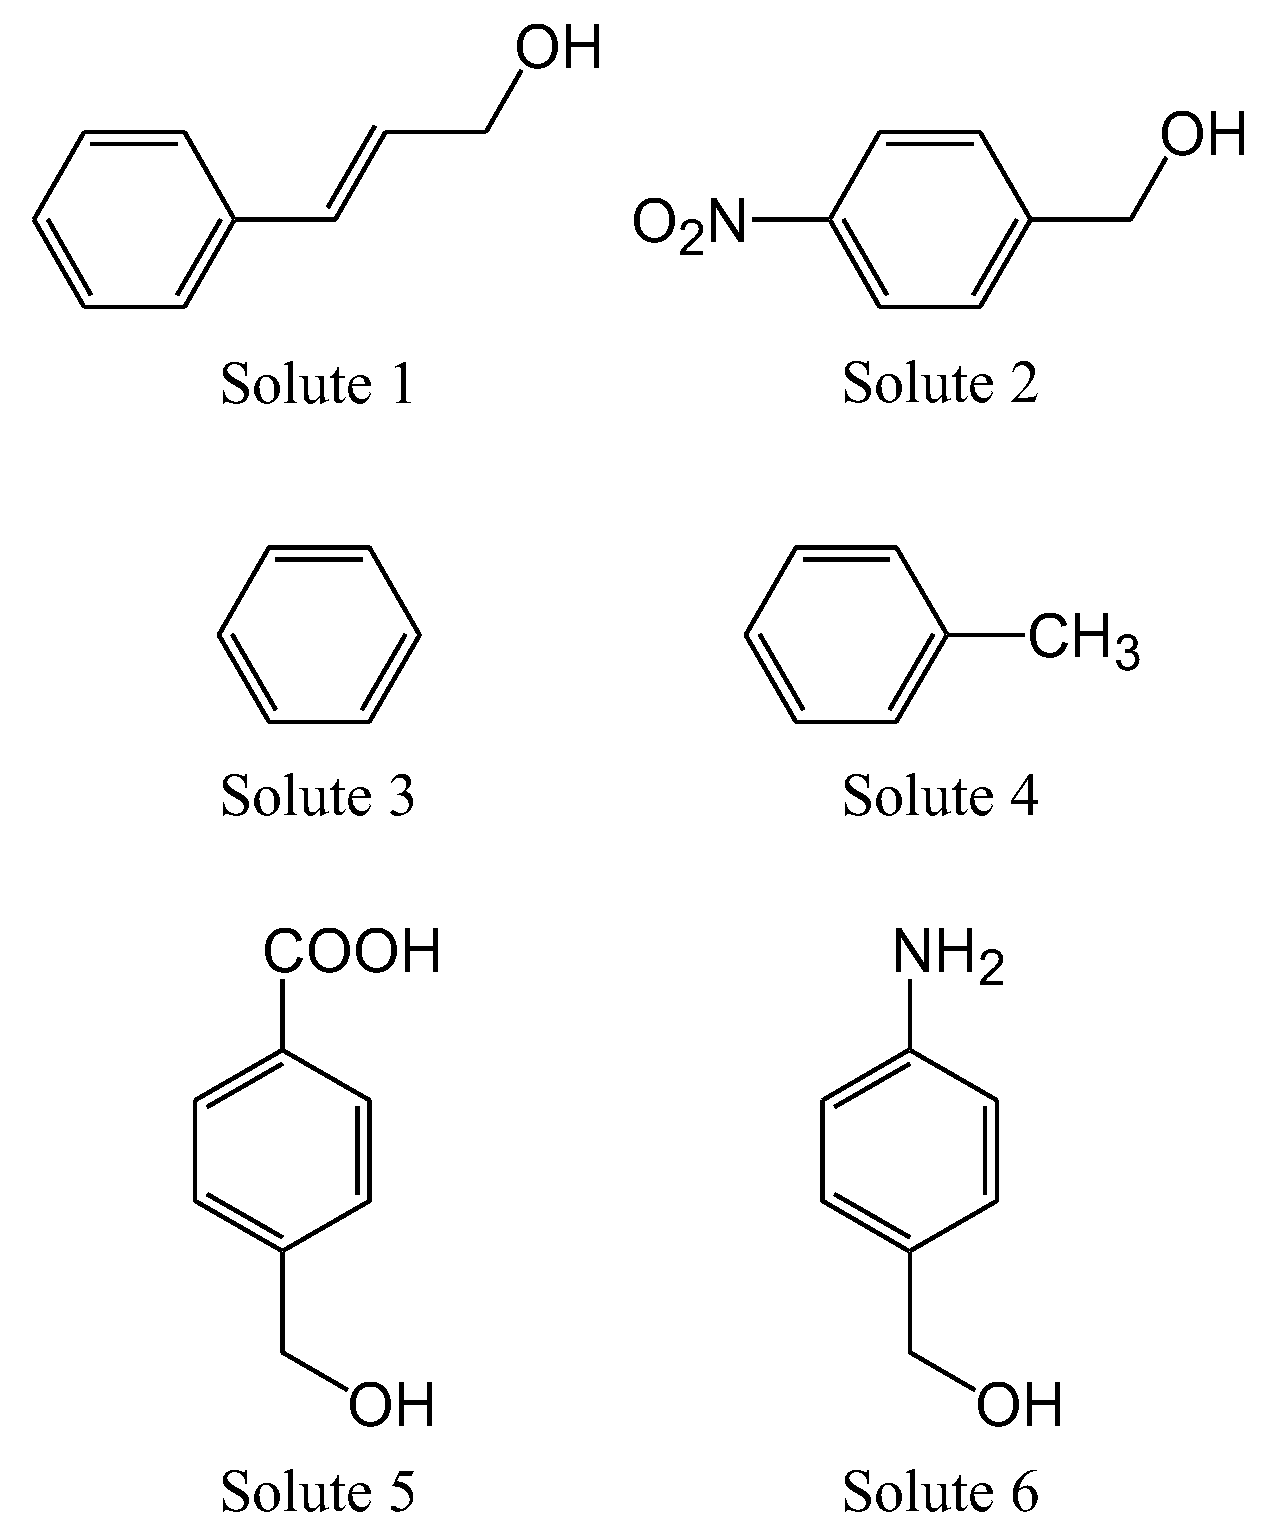
3.1. Chemicals and Reagents
3.2. SFC Conditions
3.3. HPLC Conditions
3.4. Data Analysis
4. Conclusions
Author Contributions
Funding
Acknowledgments
Conflicts of Interest
References
- Enmark, M.; Glenne, E.; Leśko, M.; Langborg, A.; Weinmann, A.L.; Leek, T.; Kaczmarski, K.; Klarqvist, M.; Samuelsson, J.; Fornstedt, T. Investigation of robustness for supercritical fluid chromatography separation of peptides: Isocratic vs. gradient mode. J. Chromatogr. A 2018, 1568, 177–187. [Google Scholar] [CrossRef] [PubMed]
- Cantrell, G.O.; Stringham, R.W.; Blackwell, J.A.; Weckwerth, J.D.; Carr, P.W. Effect of Various Modifiers on Selectivity in Packed-Column Subcritical and Supercritical Fluid Chromatography. Anal. Chem. 1996, 68, 3645–3650. [Google Scholar] [CrossRef]
- West, C.; Lesellier, E. Effects of mobile phase composition on retention and selectivity in achiral supercritical fluid chromatography. J. Chromatogr. A 2013, 1302, 152–162. [Google Scholar] [CrossRef] [PubMed]
- Glenne, E.; Öhlén, K.; Leek, H.; Klarqvist, M.; Samuelsson, J.; Fornstedt, T. A closer study of methanol adsorption and its impact on solute retentions in supercritical fluid chromatography. J. Chromatogr. A 2016, 1442, 129–139. [Google Scholar] [CrossRef] [PubMed]
- Åsberg, D.; Enmark, M.; Samuelsson, J.; Fornstedt, T. Evaluation of co-solvent fraction, pressure and temperature effects in analytical and preparative supercritical fluid chromatography. J. Chromatogr. A 2014, 1374, 254–260. [Google Scholar] [CrossRef]
- Forss, E.; Haupt, D.; Stålberg, O.; Enmark, M.; Samuelsson, J.; Fornstedt, T. Chemometric evaluation of the combined effect of temperature, pressure, and co-solvent fractions on the chiral separation of basic pharmaceuticals using actual vs. set operational conditions. J. Chromatogr. A 2017, 1499, 165–173. [Google Scholar] [CrossRef]
- Bernal, J.L.; Martin, M.T.; Toribio, L. Supercritical fluid chromatography in food analysis. J. Chromatogr. A 2013, 1313, 24–36. [Google Scholar] [CrossRef]
- Abbott, E.; Veenstra, T.D.; Issaq, H.J. Clinical and pharmaceutical applications of packed-column supercritical fluid chromatography. J. Sep. Sci. 2008, 31, 1223–1230. [Google Scholar] [CrossRef]
- Takahashi, K. Polymer analysis by supercritical fluid chromatography. J. Biosci. Bioeng. 2013, 116, 133–140. [Google Scholar] [CrossRef]
- Desfontaine, V.; Guillarme, D.; Francotte, E.; Nováková, L. Supercritical fluid chromatography in pharmaceutical analysis. J. Pharm. Biomed. Anal. 2015, 113, 56–71. [Google Scholar] [CrossRef]
- Berger, A. Separation of polar solutes by packed column supercritical fluid chromatography. J. Chromatogr. A 1997, 785, 3–33. [Google Scholar] [CrossRef]
- Bamba, T. Application of supercritical fluid chromatography to the analysis of hydrophobic metabolites. J. Sep. Sci. 2008, 31, 1274–1278. [Google Scholar] [CrossRef] [PubMed]
- Bamba, T.; Lee, J.W.; Matsubara, A.; Fukusaki, E. Metabolic profiling of lipids by supercritical fluid chromatography/mass spectrometry. J. Chromatogr. A 2012, 1250, 212–219. [Google Scholar] [CrossRef]
- Tyśkiewicz, K.; Dębczak, A.; Gieysztor, R.; Szymczak, T.; Rój, E. Determination of fat-and water-soluble vitamins by supercritical fluid chromatography: A review. J. Sep. Sci. 2018, 41, 336–350. [Google Scholar] [CrossRef] [PubMed]
- Shulaev, V.; Isaac, G. Supercritical fluid chromatography coupled to mass spectrometry – A metabolomics perspective. J. Chromatogr. A 2018, 1092, 499–505. [Google Scholar] [CrossRef]
- Regalado, E.L.; Schafer, W.; McClain, R.; Welch, C.J. Chromatographic resolution of closely related species: Separation of warfarin and hydroxylated isomers. J. Chromatogr. A 2013, 1314, 266–275. [Google Scholar] [CrossRef] [PubMed]
- Li, J.R.; Li, M.; Xia, B.; Ding, L.S.; Xu, H.X.; Zhou, Y. Efficient optimization of ultra-high- performance supercritical fluid chromatographic separation of Rosa sericea by response surface methodology. J. Sep. Sci. 2013, 36, 2114–2120. [Google Scholar] [CrossRef]
- Prothmann, J.; Sun, M.; Spégel, P.; Sandahl, M.; Turner, C. Ultra-high-performance supercritical fluid chromatography with quadrupole-time-of-flight mass spectrometry (UHPSFC/QTOF-MS) for analysis of lignin-derived monomeric compounds in processed lignin samples. Anal. Bioanal. Chem. 2017, 409, 7049–7061. [Google Scholar] [CrossRef] [Green Version]
- Hamimi, S.A.; Sandahl, M.; Armeni, M.; Turner, C.; Spégel, P. Screening of stationary phase selectivities for global lipid profiling by ultrahigh performance supercritical fluid chromatography. J. Chromatogr. A 2018, 1548, 76–82. [Google Scholar] [CrossRef]
- Lesellier, E.; West, C. Combined supercritical fluid chromatographic methods for the characterization of octadecylsiloxane-bonded stationary phases. J. Chromatogr. A 2007, 1149, 345–357. [Google Scholar] [CrossRef]
- West, C.; Lesellier, E. A unified classification of stationary phases for packed column supercritical fluid chromatography. J. Chromatogr. A 2008, 1191, 21–39. [Google Scholar] [CrossRef] [PubMed]
- West, C.; Fougere, L.; Lesellier, E. Combined supercritical fluid chromatographic tests to improve the classification of numerous stationary phases used in reversed-phase liquid chromatography. J. Chromatogr. A 2008, 1189, 227–244. [Google Scholar] [CrossRef] [PubMed]
- Mitchell, C.R.; Benz, N.J.; Zhang, S. Characterization of stationary phases by a linear solvation energy relationship utilizing supercritical fluid chromatography. J. Sep. Sci. 2010, 33, 3060–3067. [Google Scholar] [CrossRef] [PubMed]
- West, C.; Khater, S.; Lesellier, E. Characterization and use of hydrophilic interaction liquid chromatography type stationary phases in supercritical fluid chromatography. J. Chromatogr. A 2012, 1250, 182–195. [Google Scholar] [CrossRef] [PubMed]
- West, C.; Lesellier, E. Orthogonal screening system of columns for supercritical fluid chromatography. J. Chromatogr. A 2008, 1203, 105–113. [Google Scholar] [CrossRef]
- West, C.; Ogden, J.; Lesellier, E. Possibility of predicting separations in supercritical fluid chromatography with the solvation parameter model. J. Chromatogr. A 2009, 1216, 5600–5607. [Google Scholar] [CrossRef] [PubMed]
- Galea, C.; Mangelings, D.; Heyden, Y.V. Characterization and classification of stationary phases in HPLC and SFC – A review. Anal. Chim. Acta 2015, 886, 1–15. [Google Scholar] [CrossRef]
- West, C.; Lemasson, E.; Bertin, S.; Hennig, P.; Lesellier, E. An improved classification of stationary phases for ultra-high performance supercritical fluid chromatography. J. Chromatogr. A 2016, 1440, 212–228. [Google Scholar] [CrossRef]
- Sun, M.; Barbero, S.R.; Johannsen, M.; Smirnova, I.; Gurikov, P. Retention characteristics of silica materials in carbon dioxide/methanol mixtures studied by inverse supercritical fluid chromatography. J. Chromatogr. A 2019, 1588, 127–136. [Google Scholar] [CrossRef]
- Blilie, A.L.; Greibrokk, T. Modifier effects on retention and peak shape in supercritical fluid chromatography. Anal. Chem. 1985, 57, 2239–2242. [Google Scholar] [CrossRef]
- Ruta, J.; Rudaz, S.; McCalley, D.V.; Veuthey, J.-L.; Guillarme, D. A systematic investigation of the effect of sample diluent on peak shape in hydrophilic interaction liquid chromatography. J. Chromatogr. A 2010, 1217, 8230–8240. [Google Scholar] [CrossRef] [PubMed]
- Heaton, J.C.; McCalley, D.V. Some factors that can lead to poor peak shape in hydrophilic interaction chromatography, and possibilities for their remediation. J. Chromatogr. A 2016, 1427, 37–44. [Google Scholar] [CrossRef] [PubMed]
- Sánchez-Camargo, A.; del, P.; Parada-Alonso, F.; Ibáñez, E.; Cifuentes, A. Recent applications of on-line supercritical fluid extraction coupled to advanced analytical techniques for compounds extraction and identification. J. Sep. Sci. 2019, 42, 243–257. [Google Scholar] [CrossRef] [PubMed]
- Lesellier, E. Retention mechanisms in super/subcritical fluid chromatography on packed columns. J. Chromatogr. A 2009, 1216, 1881–1890. [Google Scholar] [CrossRef] [PubMed]
- Lesellier, E.; West, C. The many faces of packed column supercritical fluid chromatography – A critical review. J. Chromatogr. A 2015, 1382, 2–46. [Google Scholar] [CrossRef] [PubMed]
- Lesellier, E. Overview of the retention in subcritical fluid chromatography with varied polarity stationary phases. J. Sep. Sci. 2008, 31, 1238–1251. [Google Scholar] [CrossRef] [PubMed]
- Lemasson, E.; Bertin, S.; Hennig, P.; Lesellier, E.; West, C. Comparison of ultra-high performance methods in liquid and supercritical fluid chromatography coupled to electrospray ionization – mass spectrometry for impurity profiling of drug candidates. J. Chromatogr. A 2016, 1472, 117–128. [Google Scholar] [CrossRef] [PubMed]
- Zhu, L.-l.; Zhao, Y.; Xu, Y.-w.; Sun, Q.-l.; Sun, X.-g.; Kang, L.-p.; Yan, R.-y.; Zhang, J.; Liu, C.; Ma, B.-p. Comparison of ultra-high performance supercritical fluid chromatography and ultra-high performance liquid chromatography for the separation of spirostanol saponins. J. Pharm. Biomed. Anal. 2016, 120, 72–78. [Google Scholar] [CrossRef]
- Wang, Z.; Zhang, H.; Liu, O.; Donovan, B. Development of an orthogonal method for mometasone furoate impurity analysis using supercritical fluid chromatography. J. Chromatogr. A 2011, 1218, 2311–2319. [Google Scholar] [CrossRef]
- Alexander, A.J.; Zhang, L.; Hooker, T.F.; Tomasella, F.P. Comparison of supercritical fluid chromatography and reverse phase liquid chromatography for the impurity profiling of the antiretroviral drugs lamivudine. J. Pharm. Biomed. Anal. 2013, 78–79, 243–251. [Google Scholar] [CrossRef]
- Tarafder, A. Metamorphosis of supercritical fluid chromatography to SFC: An Overview. TrAC, Trends Anal. Chem. 2016, 81, 3–10. [Google Scholar] [CrossRef]
- Tanaka, N.; Tokuda, Y.; Iwaguchi, K.; Araki, M. Effect of stationary phase structure on retention and selectivity in reversed-phase liquid chromatography. J. Chromatogr. A 1982, 239, 761–772. [Google Scholar] [CrossRef]
- Reubsaet, J.L.E.; Vieskar, R. Characterisation of π–π interactions which determine retention of aromatic compounds in reversed-phase liquid chromatography. J. Chromatogr. A 1999, 841, 147–154. [Google Scholar] [CrossRef]
- Marchand, D.H.; Croes, K.; Dolan, J.W.; Snyder, L.R.; Henry, R.A.; Kallury, K.M.R.; Waite, S.; Carr, P.W. Column selectivity in reversed-phase liquid chromatography: VIII. Phenylalkyl and fluoro-substituted columns. J. Chromatogr. A 2005, 1062, 65–78. [Google Scholar] [CrossRef] [PubMed]
- Croes, K.; Steffens, A.; Marchand, D.H.; Snyder, L.R. Relevance of π–π and dipole–dipole interactions for retention on cyano and phenyl columns in reversed-phase liquid chromatography. J. Chromatogr. A 2005, 1098, 123–130. [Google Scholar] [CrossRef] [PubMed]
- West, C.; Lesellier, E. Characterisation of stationary phases in subcritical fluid chromatography with the solvation parameter model IV: Aromatic stationary phases. J. Chromatogr. A 2006, 1115, 233–245. [Google Scholar] [CrossRef] [PubMed]
- Turowski, M.; Morimoto, T.; Kimata, K.; Monde, H.; Ikegami, T.; Hosoya, K.; Tanaka, N. Selectivity of stationary phases in reversed-phase liquid chromatography based on the dispersion interactions. J. Chromatogr. A 2001, 911, 177–190. [Google Scholar] [CrossRef]
- Sykora, D.; Vozka, J.; Tesarova, E. Chromatographic methods enabling the characterization of stationary phases and retention prediction in high-performance liquid chromatography and supercritical fluid chromatography. J. Sep. Sci. 2016, 39, 115–131. [Google Scholar] [CrossRef]
- van Wasen, U.; Swaid, I.; Schneider, G.M. Physicochemical Principles and Applications of Supercritical Fluid Chromatography (SFC). New analytical methods (19). Angew. Chem. 1980, 19, 575–587. [Google Scholar] [CrossRef]
- Vozka, J.; Kalíková, K.; Roussel, C.; Armstrong, D.W.; Eva Tesařová, E. An insight into the use of dimethylphenyl carbamate cyclofructan 7 chiral stationary phase in supercritical fluid chromatography: The basic comparison with HPLC. J. Sep. Sci. 2013, 36, 1711–1719. [Google Scholar] [CrossRef]
- PubChem Homepage. Available online: https://pubchem.ncbi.nlm.nih.gov/ (accessed on 17 April 2019).
- Kawachi, Y.; Ikegami, T.; Takubo, H.; Ikegami, Y.; Miyamoto, M.; Tanaka, N. Chromatographic characterization of hydrophilic interaction liquid chromatography stationary phases: Hydrophilicity, charge effects, structural selectivity, and separation efficiency. J. Chromatogr. A 2011, 1218, 5903–5919. [Google Scholar] [CrossRef] [PubMed]
Sample Availability: Samples of the compounds are not available from the authors. |


| Column Name | Stationary Phase (Abbreviation) | k (HPLC) | k (SFC) | k of SFC/k of HPLC | |||
|---|---|---|---|---|---|---|---|
| Solute 1 | Solute 2 | Solute 1 | Solute 2 | Solute 1 | Solute 2 | ||
| COSMOSIL 5SL-II | Silica gel (SL) | 0.65 | 1.34 | 0.77 | 1.51 | 1.18 | 1.13 |
| COSMOSIL 5HILIC | Triazole group (TRZ) | 1.14 | 2.69 | 1.30 | 2.32 | 1.15 | 0.86 |
| COSMOSIL 5HP | Hydroxyphenyl group (HP) | 0.86 | 1.67 | 1.10 | 1.63 | 1.29 | 0.97 |
| COSMOSIL 5PY | Pyridinyl group (PY) | 0.82 | 2.26 | 0.92 | 2.07 | 1.12 | 0.91 |
| Prototype EP | Pyridinylethyl group (EP) | 0.65 | 1.62 | 0.73 | 1.47 | 1.12 | 0.90 |
| COSMOSIL 5C18-MS-II | Octadecyl group (C18-M end-capped) | 0.00 | 0.00 | 0.20 | 0.13 | -- | -- |
| Prototype C18(not end-capped) | Octadecyl group (C18-M not end-capped) | 0.00 | 0.00 | 0.32 | 0.23 | -- | -- |
| COSMOSIL 5Cholester | Cholesteryl group (CHO) | 0.00 | 0.08 | 0.44 | 0.50 | -- | -- |
| COSMOSIL 5πNAP | Naphthylethyl group (NAP) | 0.08 | 0.21 | 0.47 | 0.68 | 6.06 | 3.17 |
| COSMOSIL 5PYE | Pyrenylethyl group (PYE) | 0.13 | 0.51 | 0.81 | 1.66 | 6.40 | 3.27 |
| COSMOSIL 5PBr | Pentabromophenyl group (PBr) | 0.09 | 0.26 | 1.11 | 1.47 | 12.13 | 5.64 |
| Column Name | Stationary Phase (Abbreviation) | k (HPLC) | k (SFC) | ||
|---|---|---|---|---|---|
| Solute 3 | Solute 4 | Solute 3 | Solute 4 | ||
| COSMOSIL 5SL-II | Silica gel (SL) | 0.02 | 0.00 | 0.00 | 0.01 |
| COSMOSIL 5HILIC | Triazole group (TRZ) | 0.03 | 0.01 | 0.00 | 0.01 |
| COSMOSIL 5HP | Hydroxyphenyl group (HP) | 0.02 | 0.01 | 0.00 | 0.02 |
| COSMOSIL 5PY | Pyridinyl group (PY) | 0.02 | 0.01 | 0.00 | 0.02 |
| Prototype EP | Pyridinylethyl group (EP) | 0.02 | 0.01 | 0.00 | 0.02 |
| COSMOSIL 5C18-MS-II | Octadecyl group (C18-M end-capped) | 0.02 | 0.01 | 0.17 | 0.22 |
| Prototype C18 (not end-capped) | Octadecyl group (C18-M not end-capped) | 0.04 | 0.02 | 0.07 | 0.12 |
| COSMOSIL 5Cholester | Cholesteryl group (CHO) | 0.02 | 0.01 | 0.11 | 0.17 |
| COSMOSIL 5πNAP | Naphthylethyl group (NAP) | 0.00 | 0.00 | 0.03 | 0.07 |
| COSMOSIL 5PYE | Pyrenylethyl group (PYE) | 0.01 | 0.00 | 0.03 | 0.07 |
| COSMOSIL 5PBr | Pentabromophenyl group (PBr) | 0.01 | 0.01 | 0.12 | 0.23 |
| Column Name | Stationary Phase (Abbreviation) | k (HPLC) | k (SFC) | k of SFC/k of HPLC | |||
|---|---|---|---|---|---|---|---|
| Solute 5 | Solute 6 | Solute 5 | Solute 6 | Solute 5 | Solute 6 | ||
| COSMOSIL 5SL-II | Silica gel (SL) | 0.66 | 1.24 | 0.81 | 1.32 | 1.23 | 1.06 |
| COSMOSIL 5HP | Hydroxyphenyl group (HP) | 2.19 | 3.31 | 2.24 | 3.27 | 1.02 | 0.99 |
| COSMOSIL 5PY | Pyridinyl group (PY) | 3.06 | 2.28 | 2.83 | 1.50 | 0.93 | 0.66 |
| COSMOSIL 5HILIC | Triazole group (TRZ) | 8.46 | 5.09 | 6.06 | 4.98 | 0.72 | 0.98 |
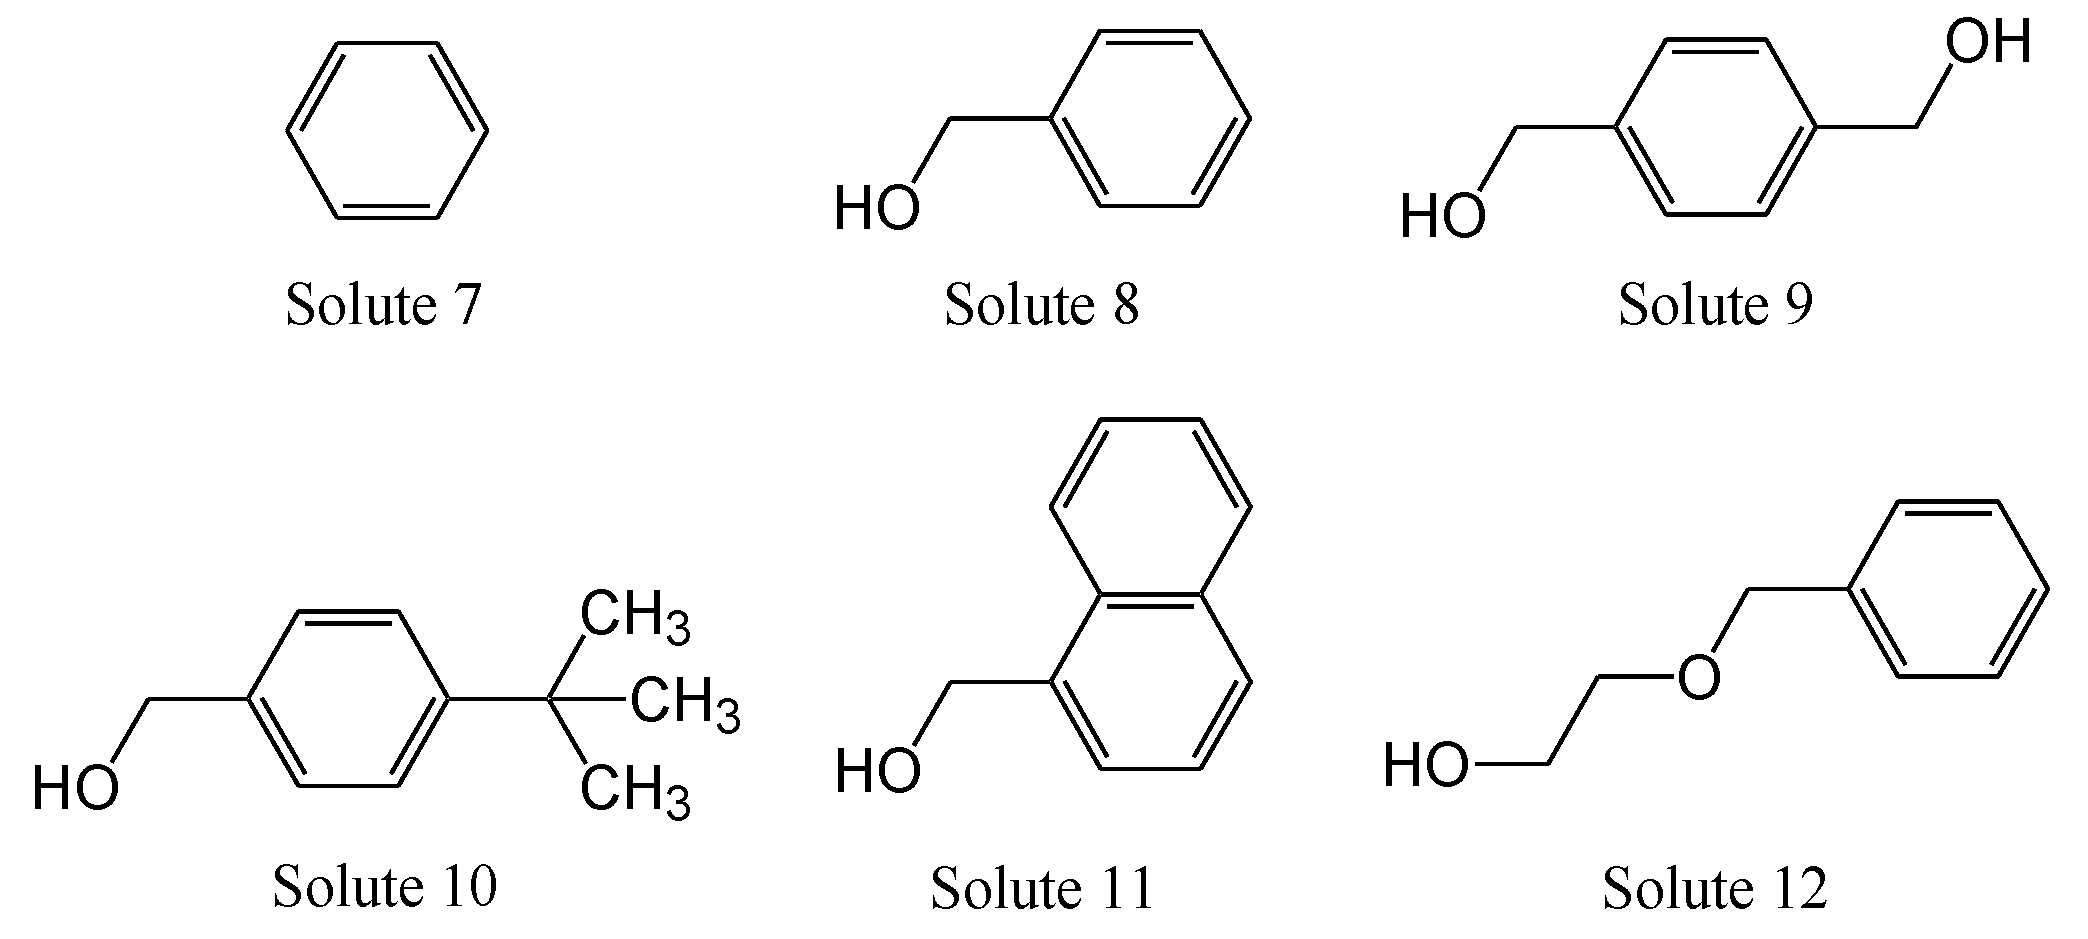
| Column Name | Stationary Phase (Abbreviation) | k (SFC) | (1) | (2) | (3) | (4) | |||||
|---|---|---|---|---|---|---|---|---|---|---|---|
| Solute 7 | Solute 8 | Solute 9 | Solute 10 | Solute 11 | Solute 12 | Hydrophilic Interaction | Hydrophobic Interaction | π-π Interaction | Dispersion Interaction | ||
| COSMOSIL 5SL-II | Silica gel (SL) | 0.00 | 1.06 | 10.42 | 1.16 | 1.85 | 1.24 | 9.83 | 1.09 | 1.74 | 1.17 |
| COSMOSIL 5Diol-120-II | Diol Group (Diol) | 0.00 | 1.50 | 15.82 | 1.14 | 4.46 | 0.90 | 10.56 | 0.76 | 2.98 | 0.60 |
| COSMOSIL 5HILIC | Triazolyl group (TRZ) | 0.00 | 1.76 | 23.23 | 1.65 | 4.29 | 1.29 | 13.22 | 0.94 | 2.44 | 0.74 |
| COSMOSIL 5HP | Hydroxyphenyl group (HP) | 0.00 | 1.31 | 13.52 | 1.40 | 2.98 | 1.17 | 10.33 | 1.07 | 2.28 | 0.90 |
| COSMOSIL 5PY | Pyridinyl group (PY) | 0.00 | 1.10 | 8.46 | 1.06 | 2.83 | 0.69 | 7.70 | 0.96 | 2.58 | 0.63 |
| Prototype EP | Pyridinylethyl group (EP) | 0.00 | 0.91 | 5.51 | 0.92 | 2.08 | 0.52 | 6.08 | 1.02 | 2.30 | 0.57 |
| Prototype PIC | Picolylamine (PIC) | 0.00 | 1.80 | 21.30 | 1.61 | 5.40 | 1.16 | 11.82 | 0.89 | 3.00 | 0.65 |
| Prototype ANT | Aminoanthracene (ANT) | 0.00 | 1.24 | 12.15 | 1.14 | 3.19 | 0.94 | 9.81 | 0.92 | 2.57 | 0.76 |
| Prototype DEA | Diethylamine (DEA) | 0.00 | 2.06 | 28.10 | 1.56 | 5.93 | 0.90 | 13.65 | 0.76 | 2.88 | 0.44 |
| COSMOSIL 5PE-MS | Phenylethyl group (PE) | 0.02 | 0.19 | 0.54 | 0.26 | 0.48 | 0.23 | 2.81 | 1.36 | 2.51 | 1.21 |
| COSMOSIL 5πNAP | Naphthylethyl group (NAP) | 0.00 | 0.31 | 0.85 | 0.45 | 0.95 | 0.41 | 2.79 | 1.46 | 3.10 | 1.34 |
| COSMOSIL 5PYE | Pyrenylethyl group (PYE) | 0.00 | 0.52 | 1.85 | 0.80 | 1.91 | 0.76 | 3.54 | 1.53 | 3.66 | 1.45 |
| COSMOSIL 5PBr | Pentabromophenyl group (PBr) | 0.04 | 0.71 | 2.37 | 1.03 | 3.67 | 0.91 | 3.34 | 1.45 | 5.19 | 1.29 |
| COSMOSIL 5PFP | Pentafluorophenyl group (PFP) | 0.04 | 0.15 | 0.46 | 0.18 | 0.42 | 0.20 | 3.01 | 1.19 | 2.73 | 1.29 |
| COSMOSIL 5NPE | Nitrophenylethyl group (NPE) | 0.00 | 0.50 | 2.36 | 0.62 | 1.27 | 0.62 | 4.70 | 1.23 | 2.54 | 1.23 |
| COSMOSIL 5C18-MS-II | Monomeric octadecyl group (C18-M) | 0.17 | 0.17 | 0.16 | 0.25 | 0.46 | 0.17 | 0.98 | 1.51 | 2.76 | 1.04 |
| COSMOSIL 5C18-AR-II | Polymeric octadecyl group (C18-P) | 0.16 | 0.23 | 0.25 | 0.29 | 0.66 | 0.21 | 1.09 | 1.26 | 2.87 | 0.93 |
| COSMOSIL 5Cholester | Cholesteryl group (CHO) | 0.14 | 0.39 | 0.91 | 0.53 | 1.43 | 0.31 | 2.36 | 1.37 | 3.71 | 0.79 |
© 2019 by the authors. Licensee MDPI, Basel, Switzerland. This article is an open access article distributed under the terms and conditions of the Creative Commons Attribution (CC BY) license (http://creativecommons.org/licenses/by/4.0/).
Share and Cite
Hirose, T.; Keck, D.; Izumi, Y.; Bamba, T. Comparison of Retention Behavior between Supercritical Fluid Chromatography and Normal-Phase High-Performance Liquid Chromatography with Various Stationary Phases. Molecules 2019, 24, 2425. https://doi.org/10.3390/molecules24132425
Hirose T, Keck D, Izumi Y, Bamba T. Comparison of Retention Behavior between Supercritical Fluid Chromatography and Normal-Phase High-Performance Liquid Chromatography with Various Stationary Phases. Molecules. 2019; 24(13):2425. https://doi.org/10.3390/molecules24132425
Chicago/Turabian StyleHirose, Tsunehisa, Daniel Keck, Yoshihiro Izumi, and Takeshi Bamba. 2019. "Comparison of Retention Behavior between Supercritical Fluid Chromatography and Normal-Phase High-Performance Liquid Chromatography with Various Stationary Phases" Molecules 24, no. 13: 2425. https://doi.org/10.3390/molecules24132425