Application of Molecularly Imprinted Polymers (MIP) and Magnetic Molecularly Imprinted Polymers (mag-MIP) to Selective Analysis of Quercetin in Flowing Atmospheric-Pressure Afterglow Mass Spectrometry (FAPA-MS) and in Electrospray Ionization Mass Spectrometry (ESI-MS)

Abstract
:1. Introduction
2. Results and Discussion
2.1. Syntheses of Q-MIP/Q-mag-MIP
2.2. Characterization of Q-MIP/Q-mag-MIP
2.2.1. FTIR Spectra
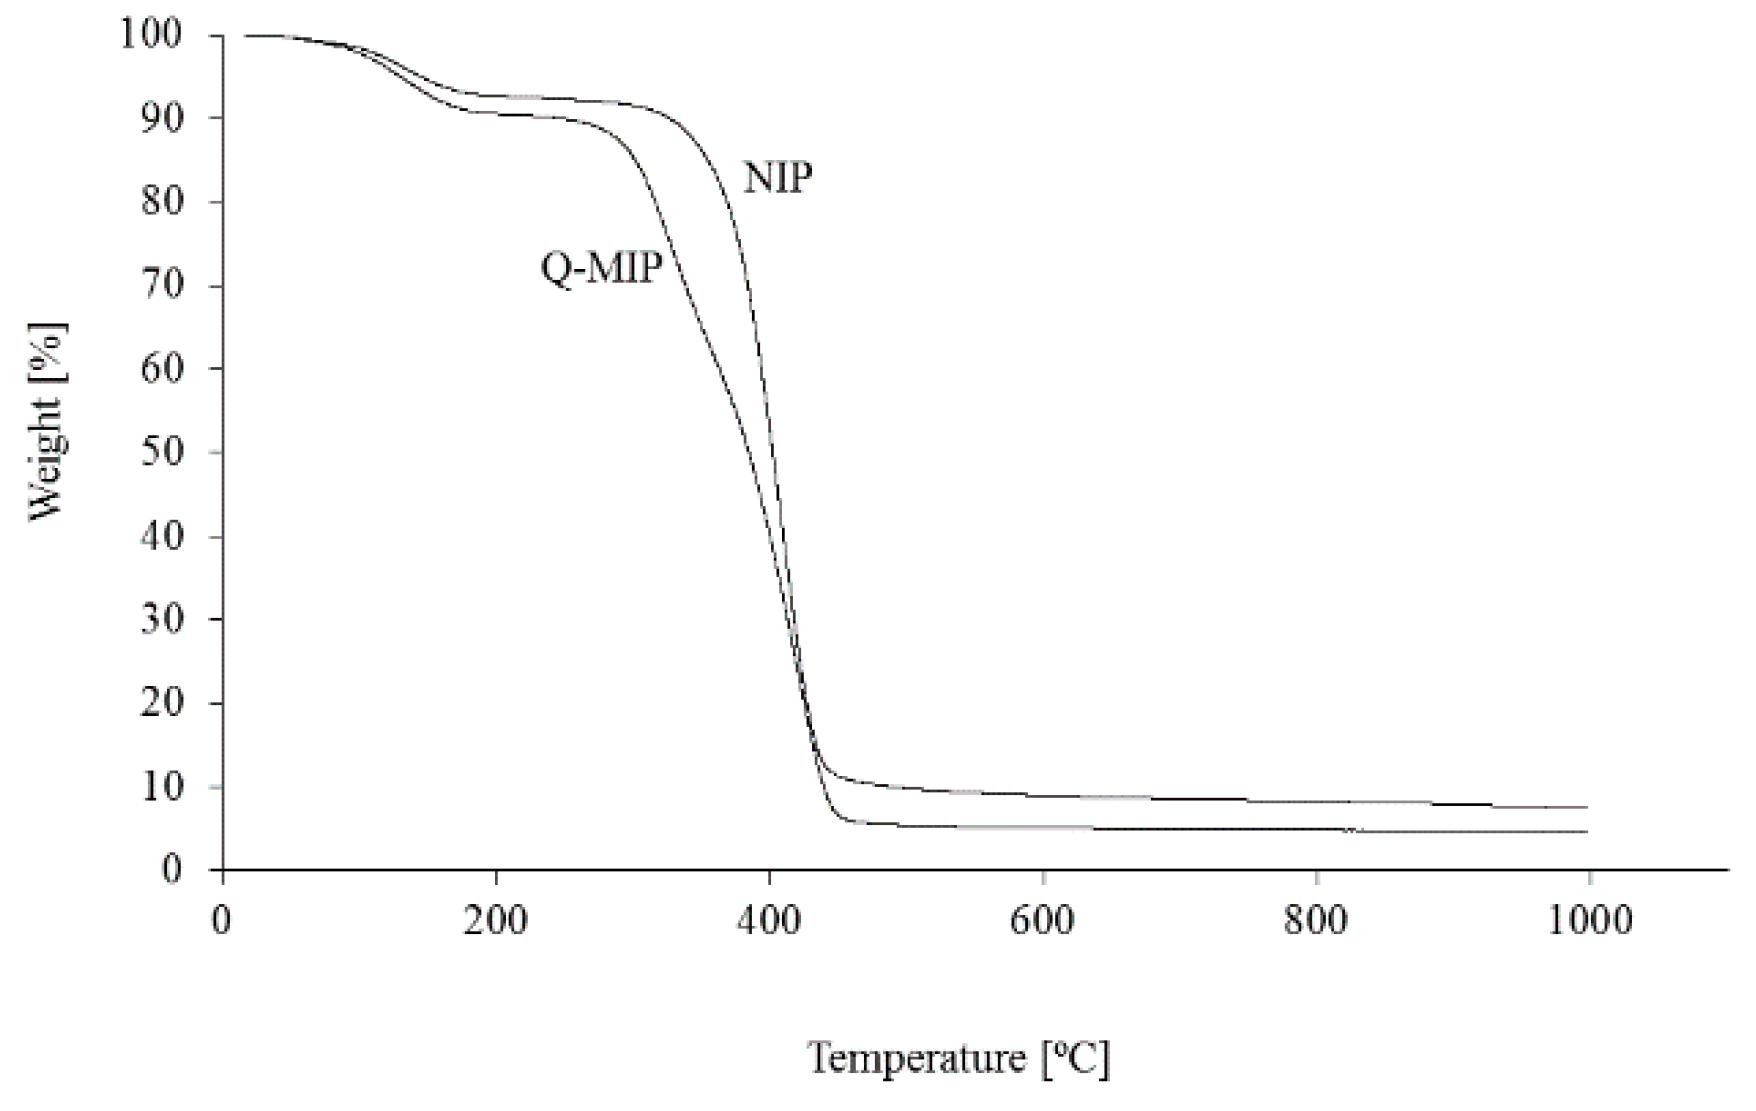
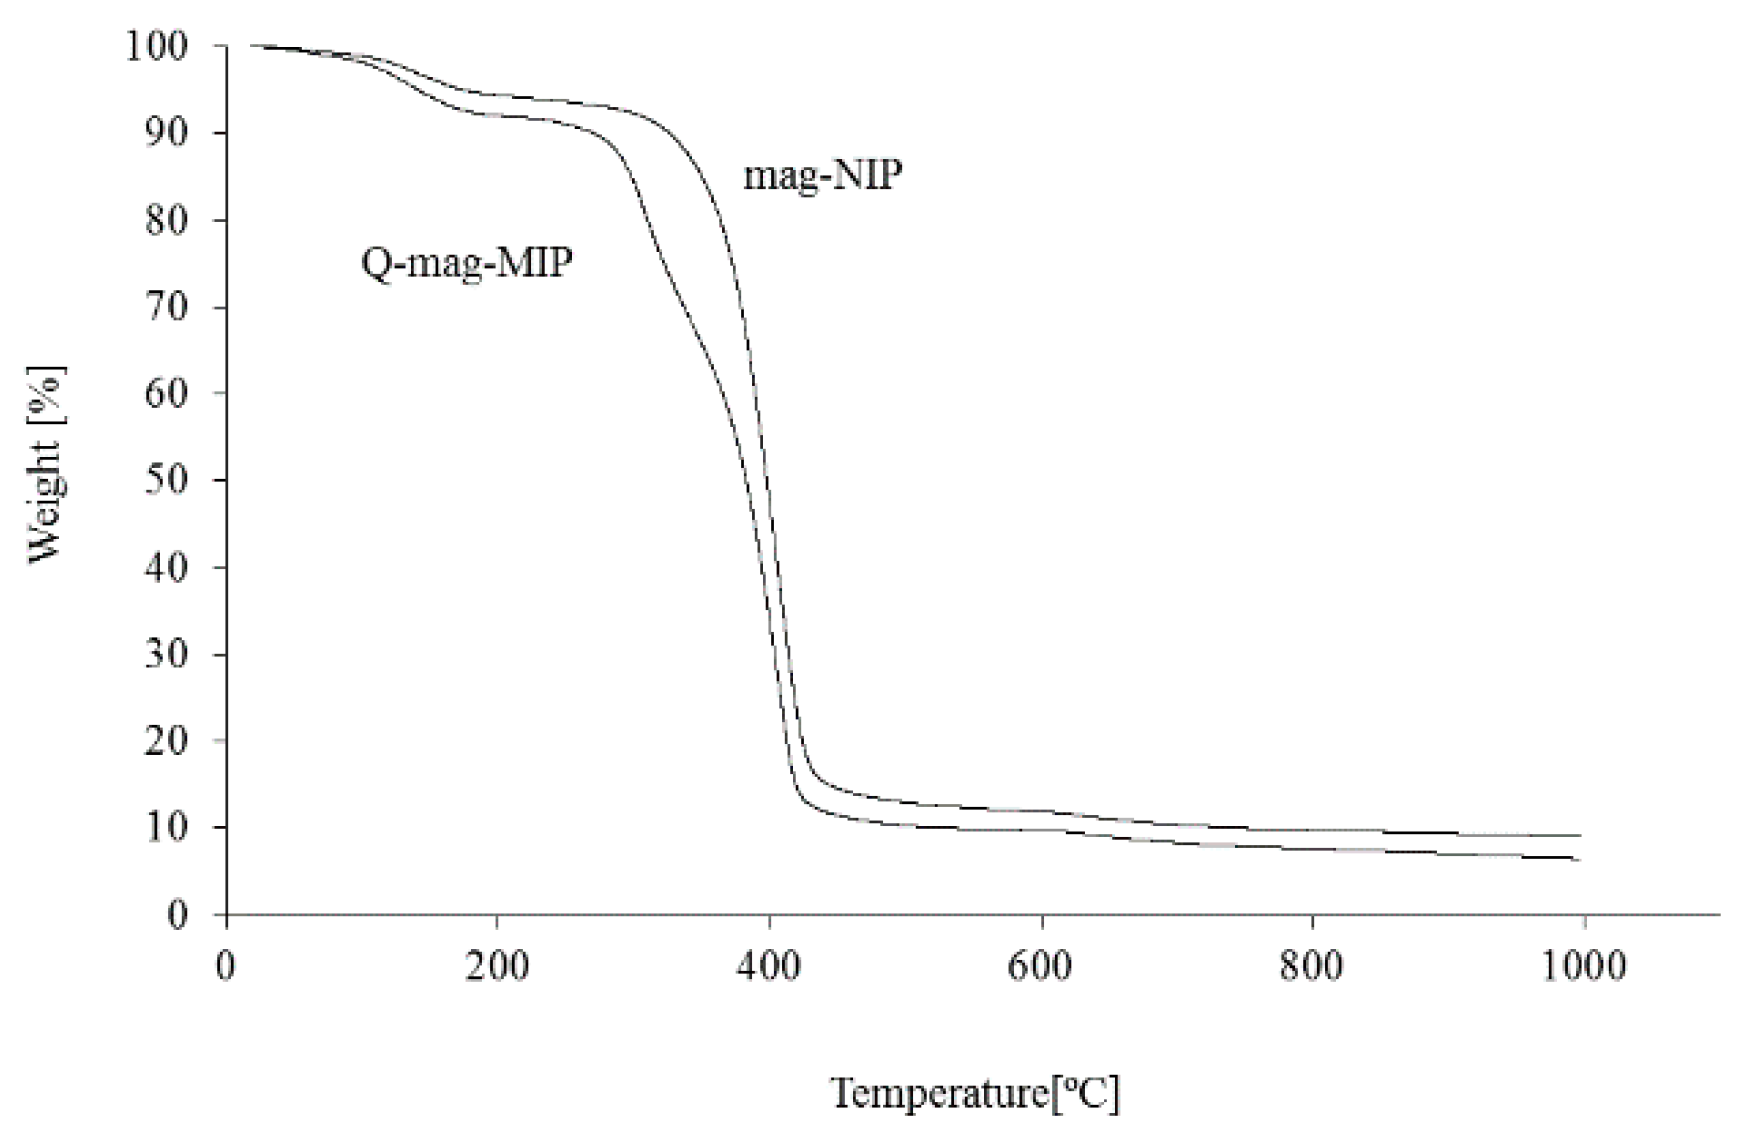
2.2.2. Thermal Analysis
2.2.3. SEM Images
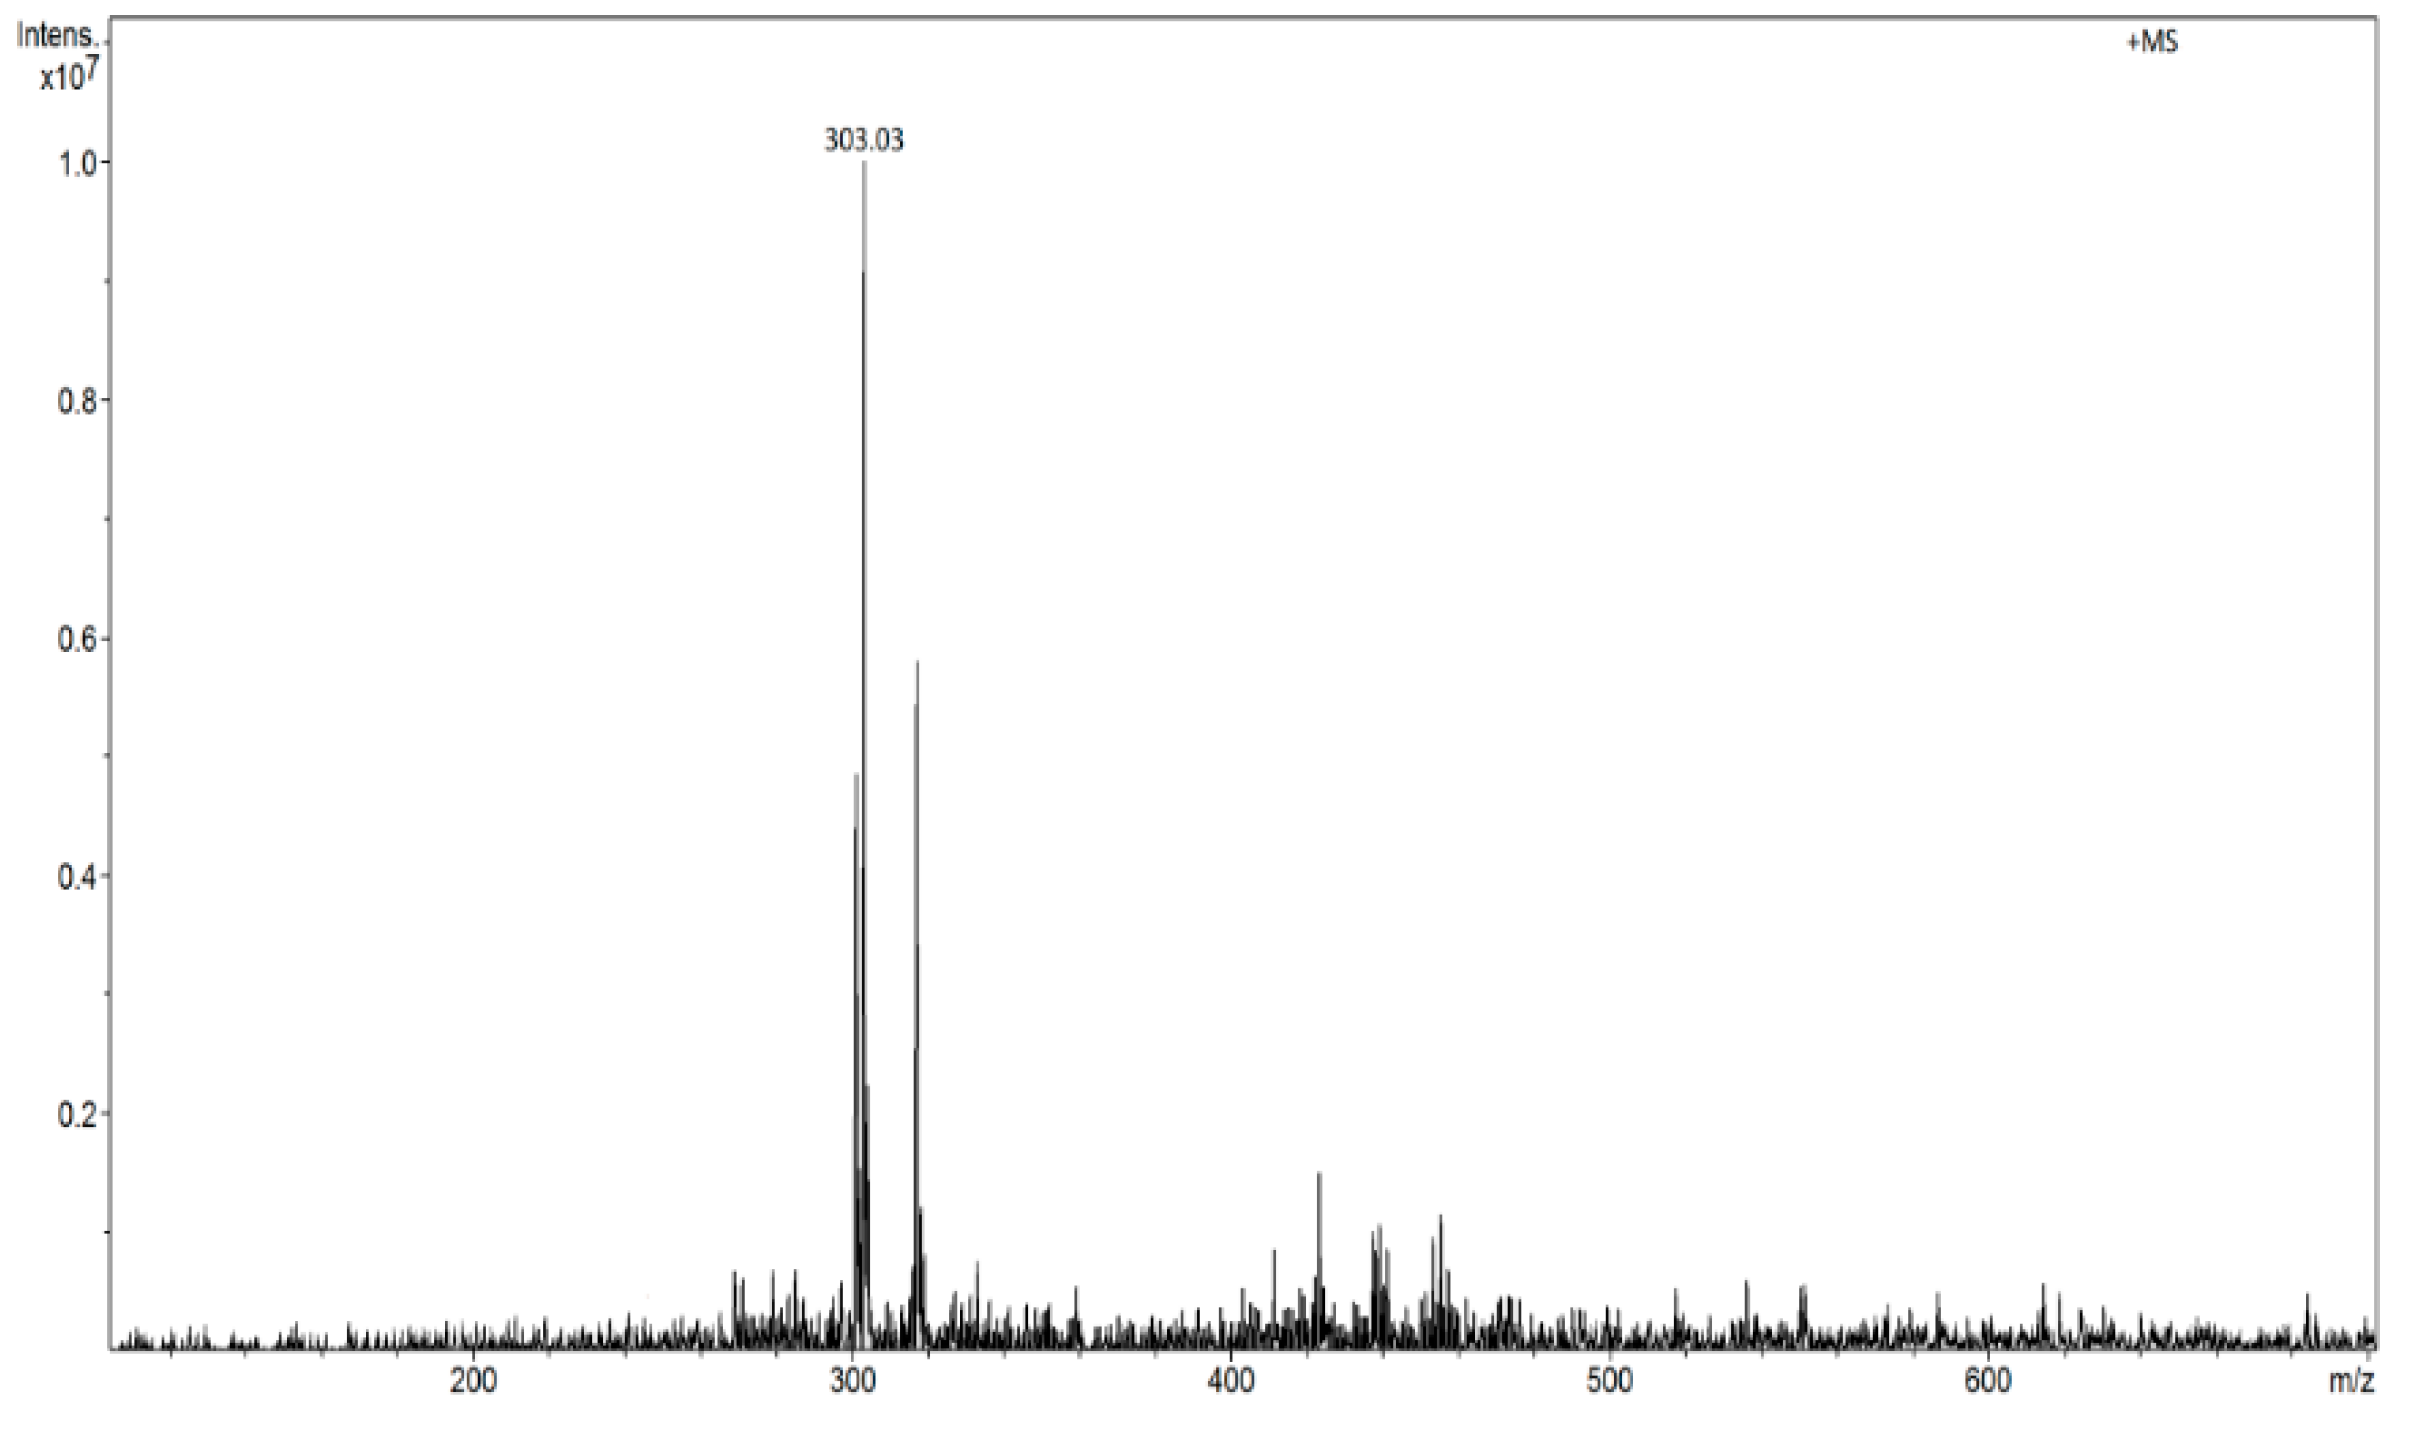
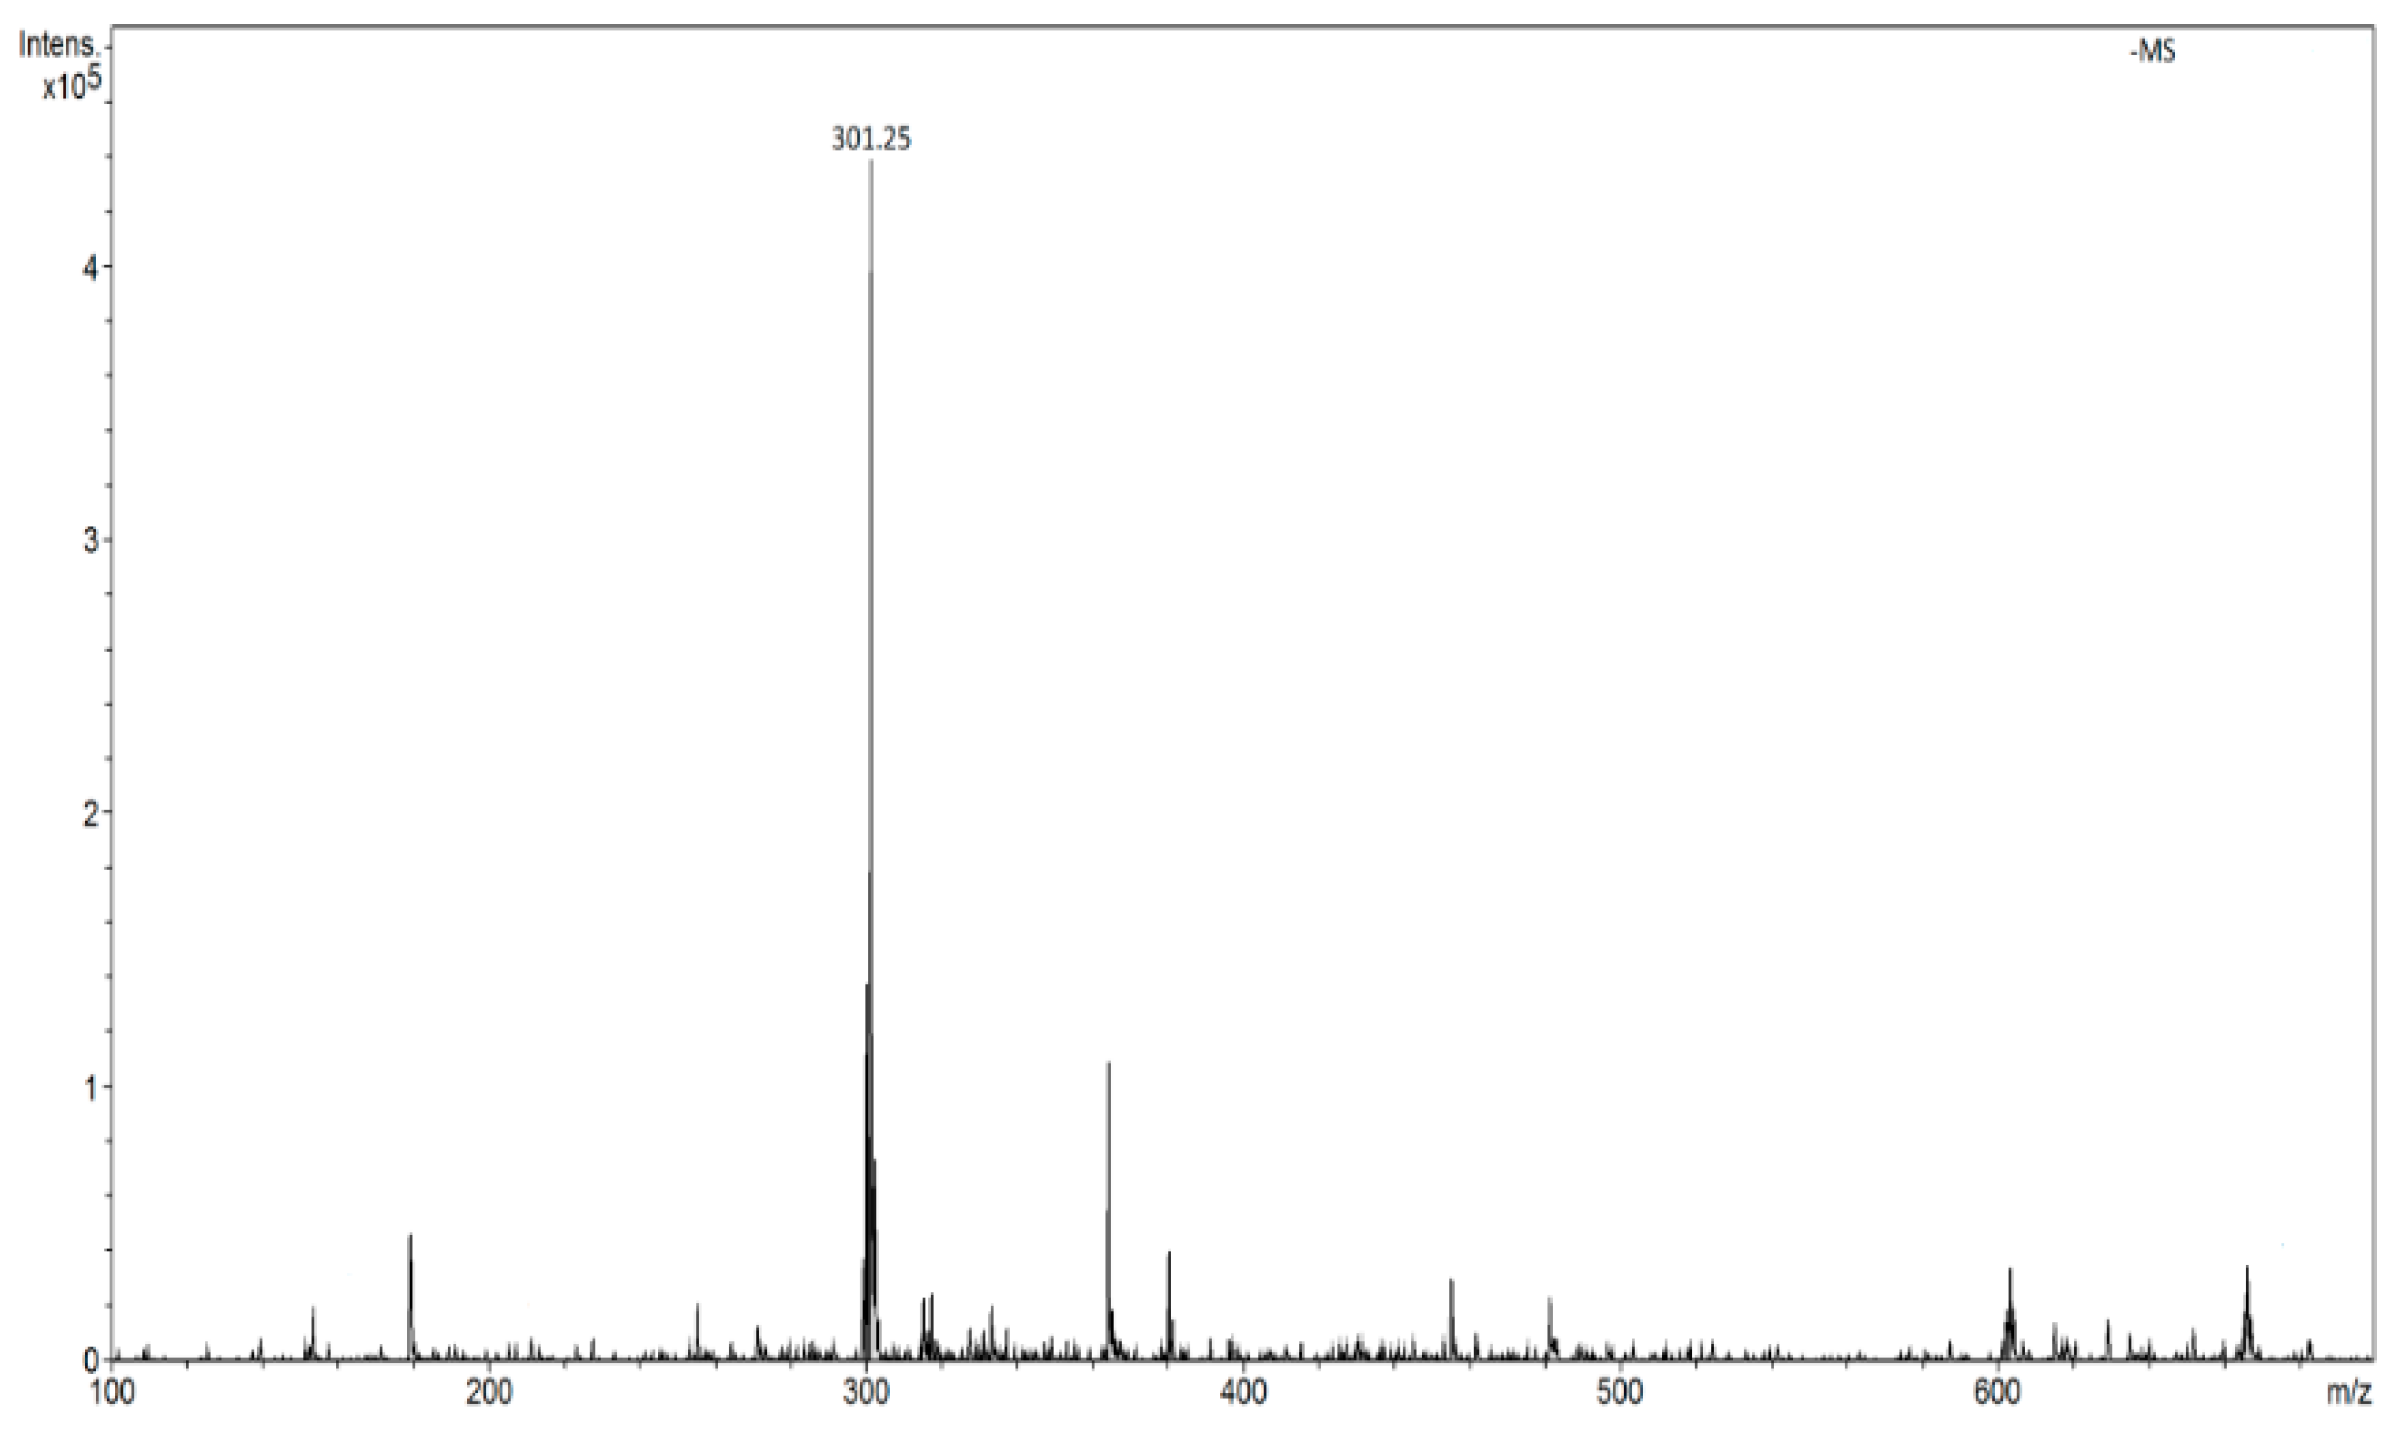
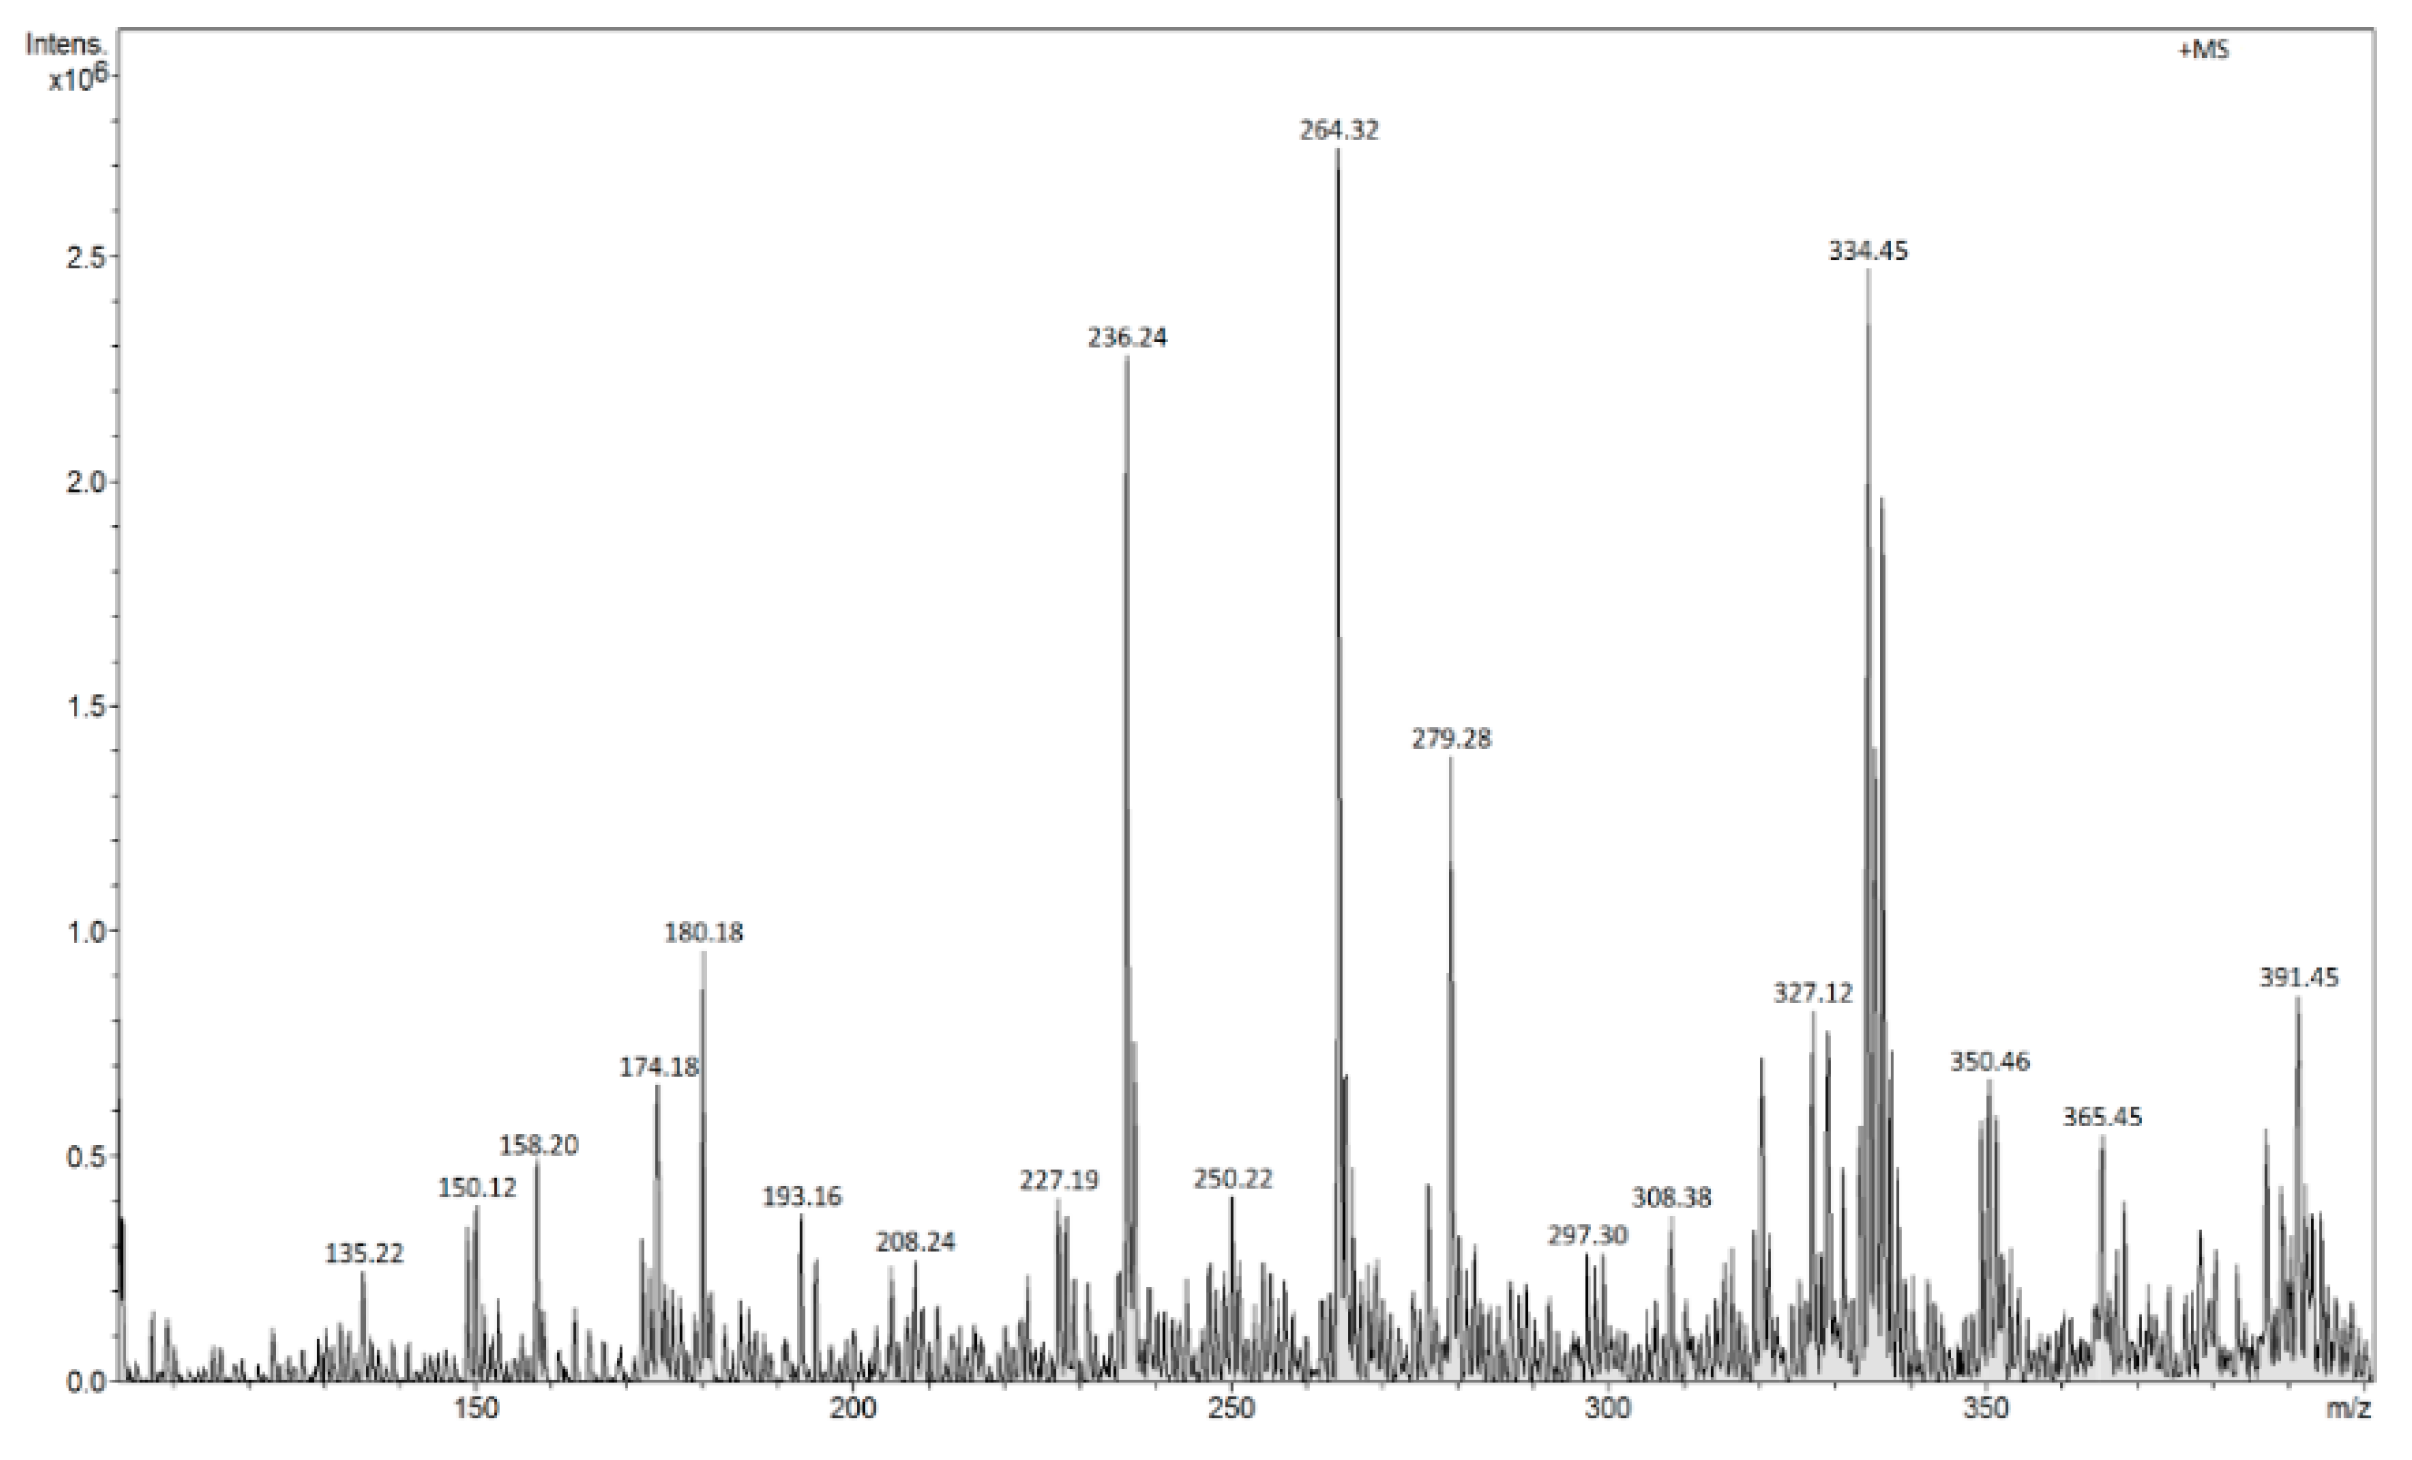
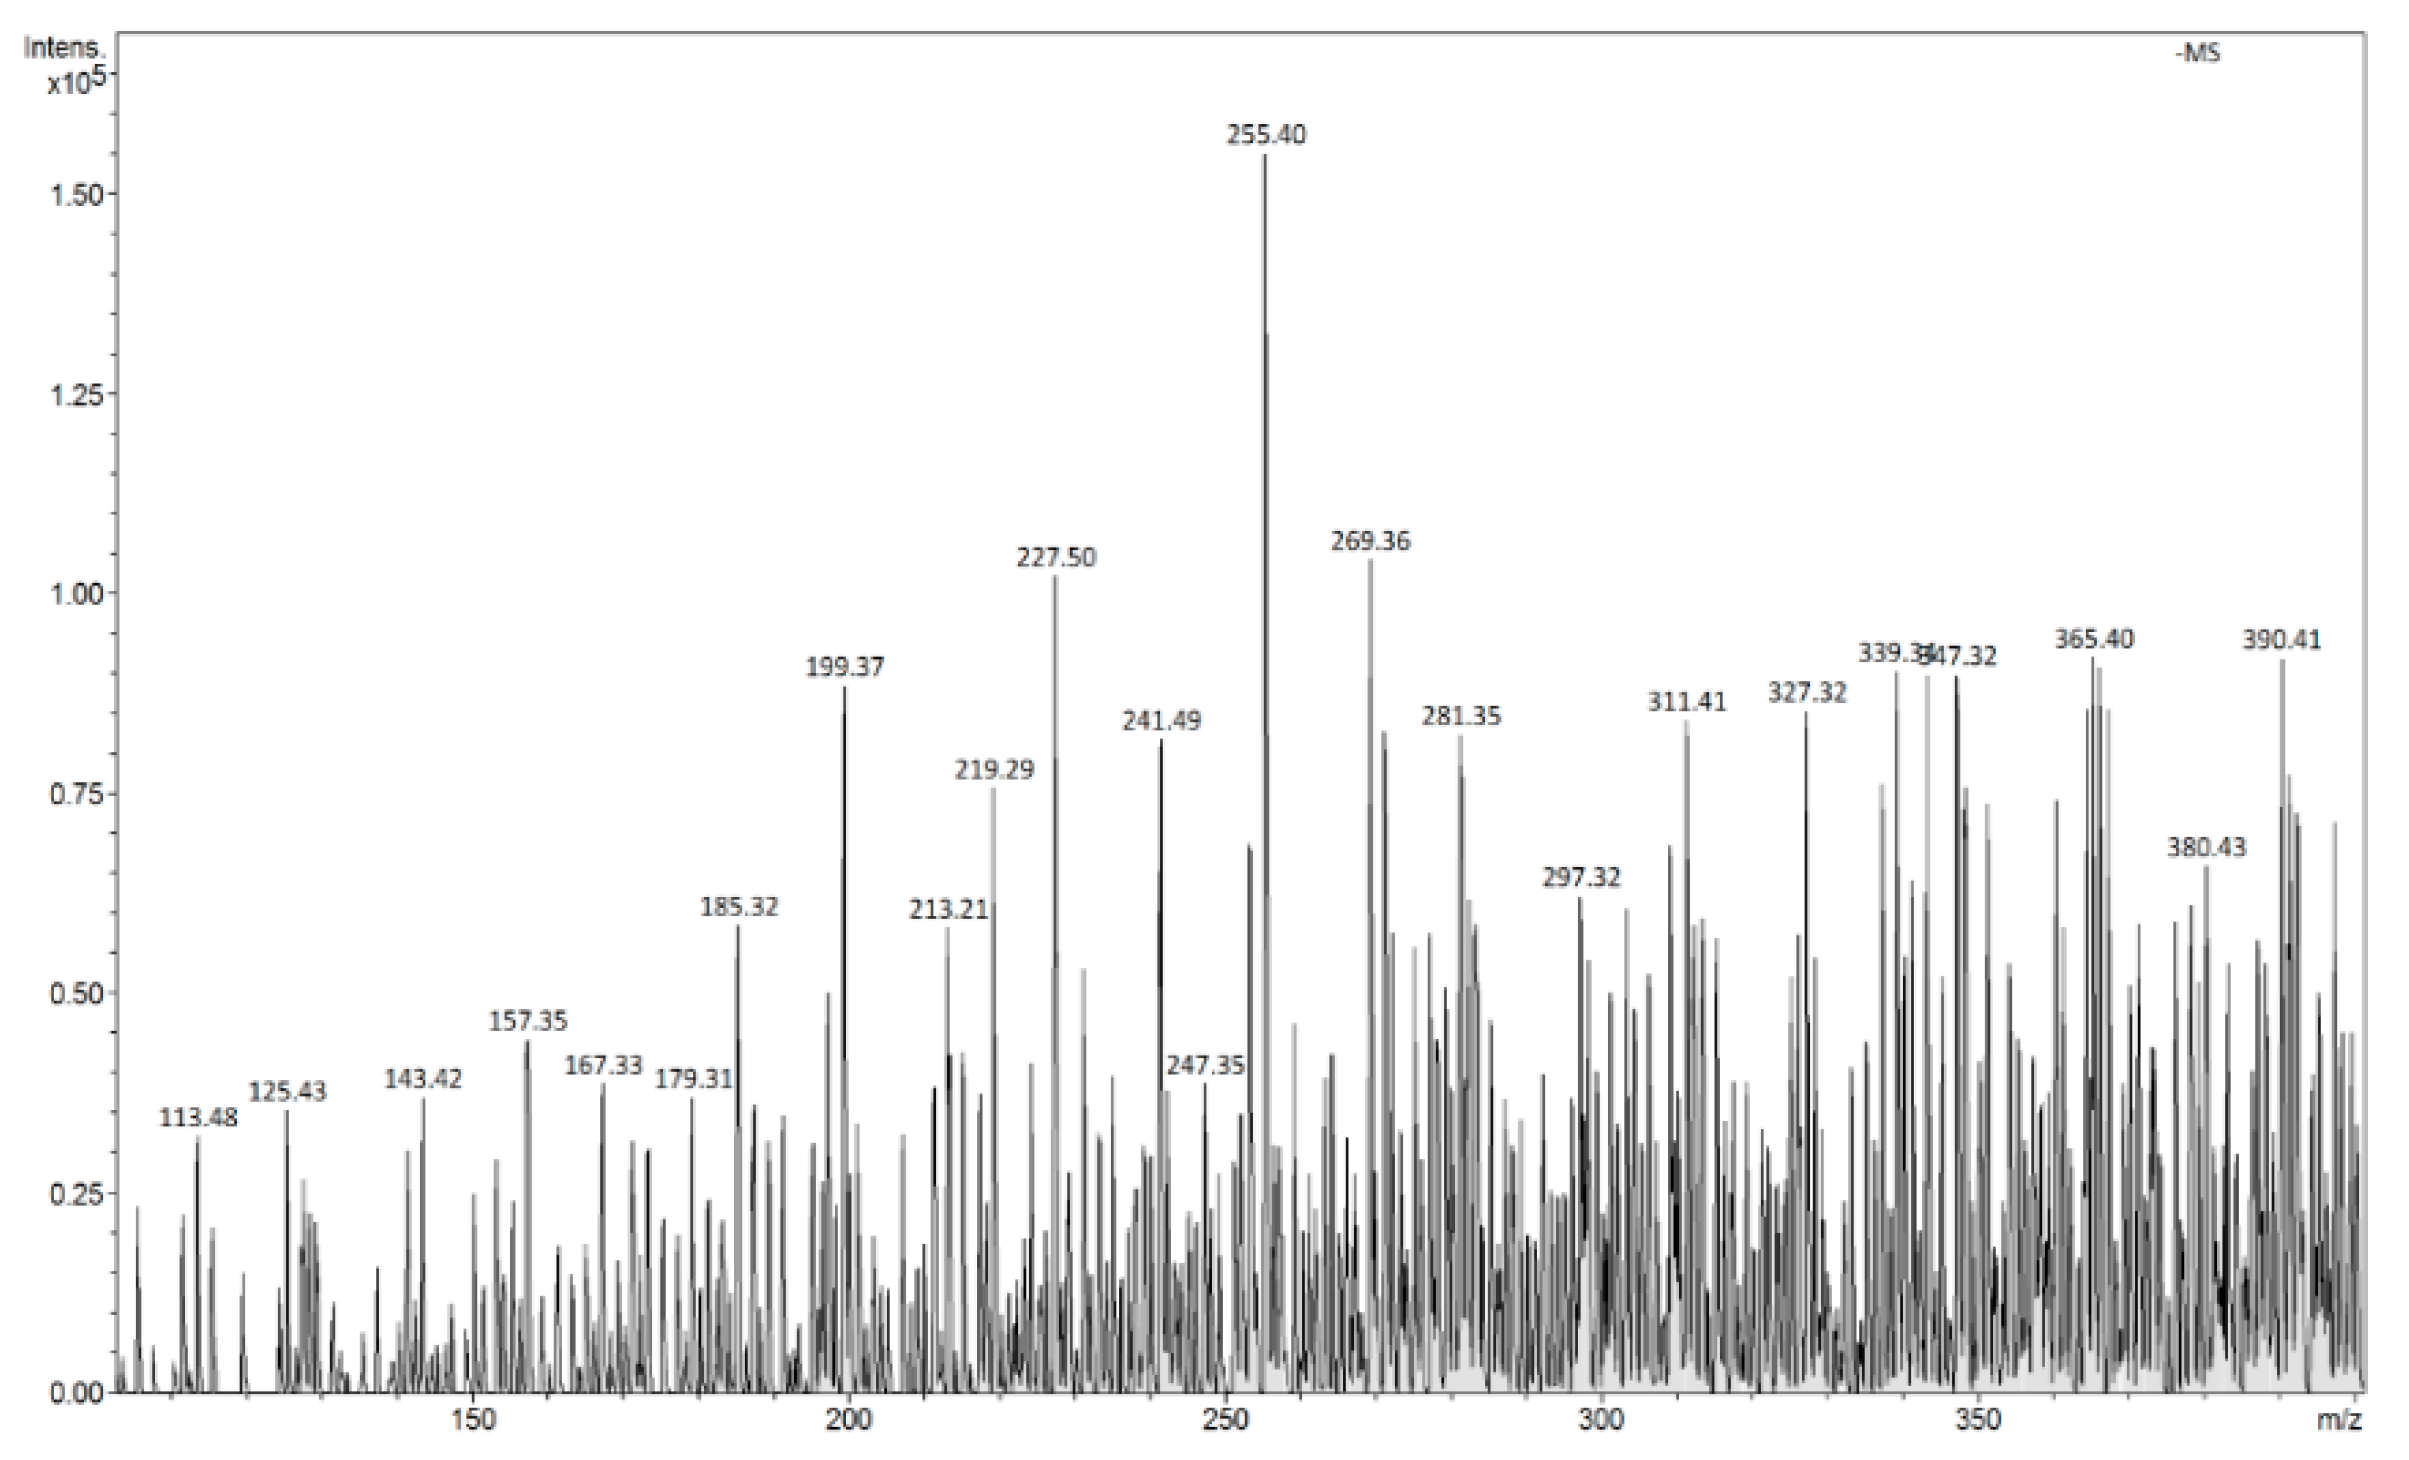
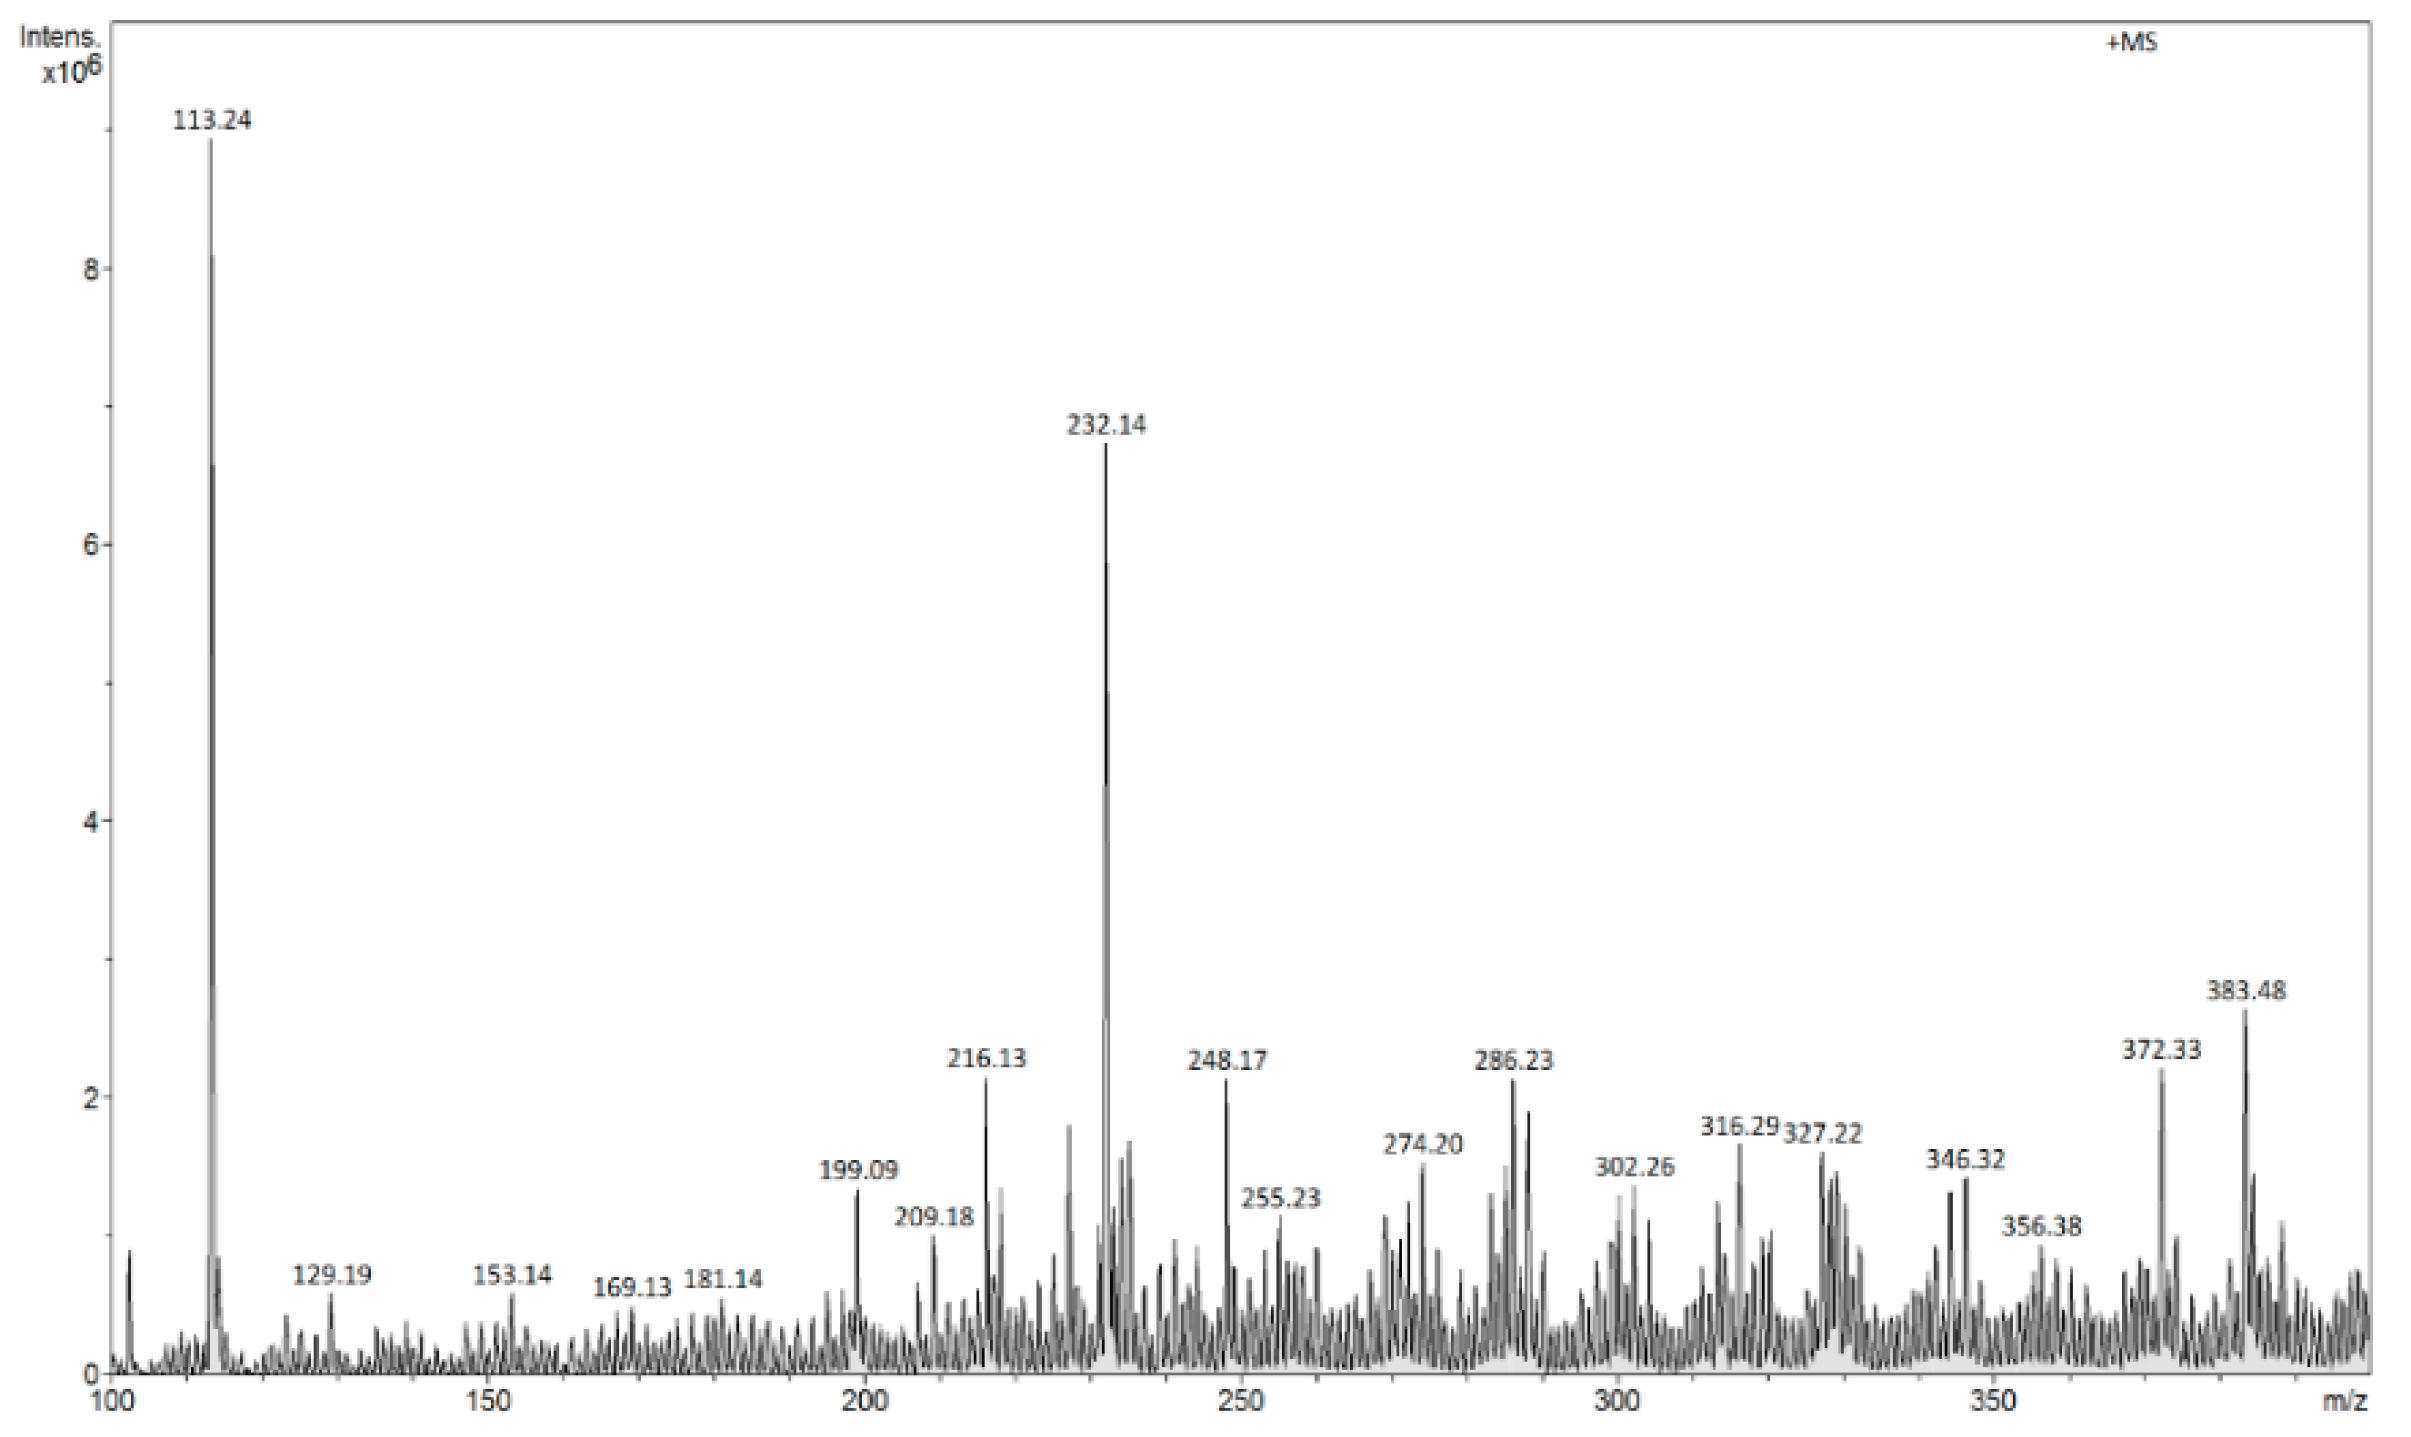
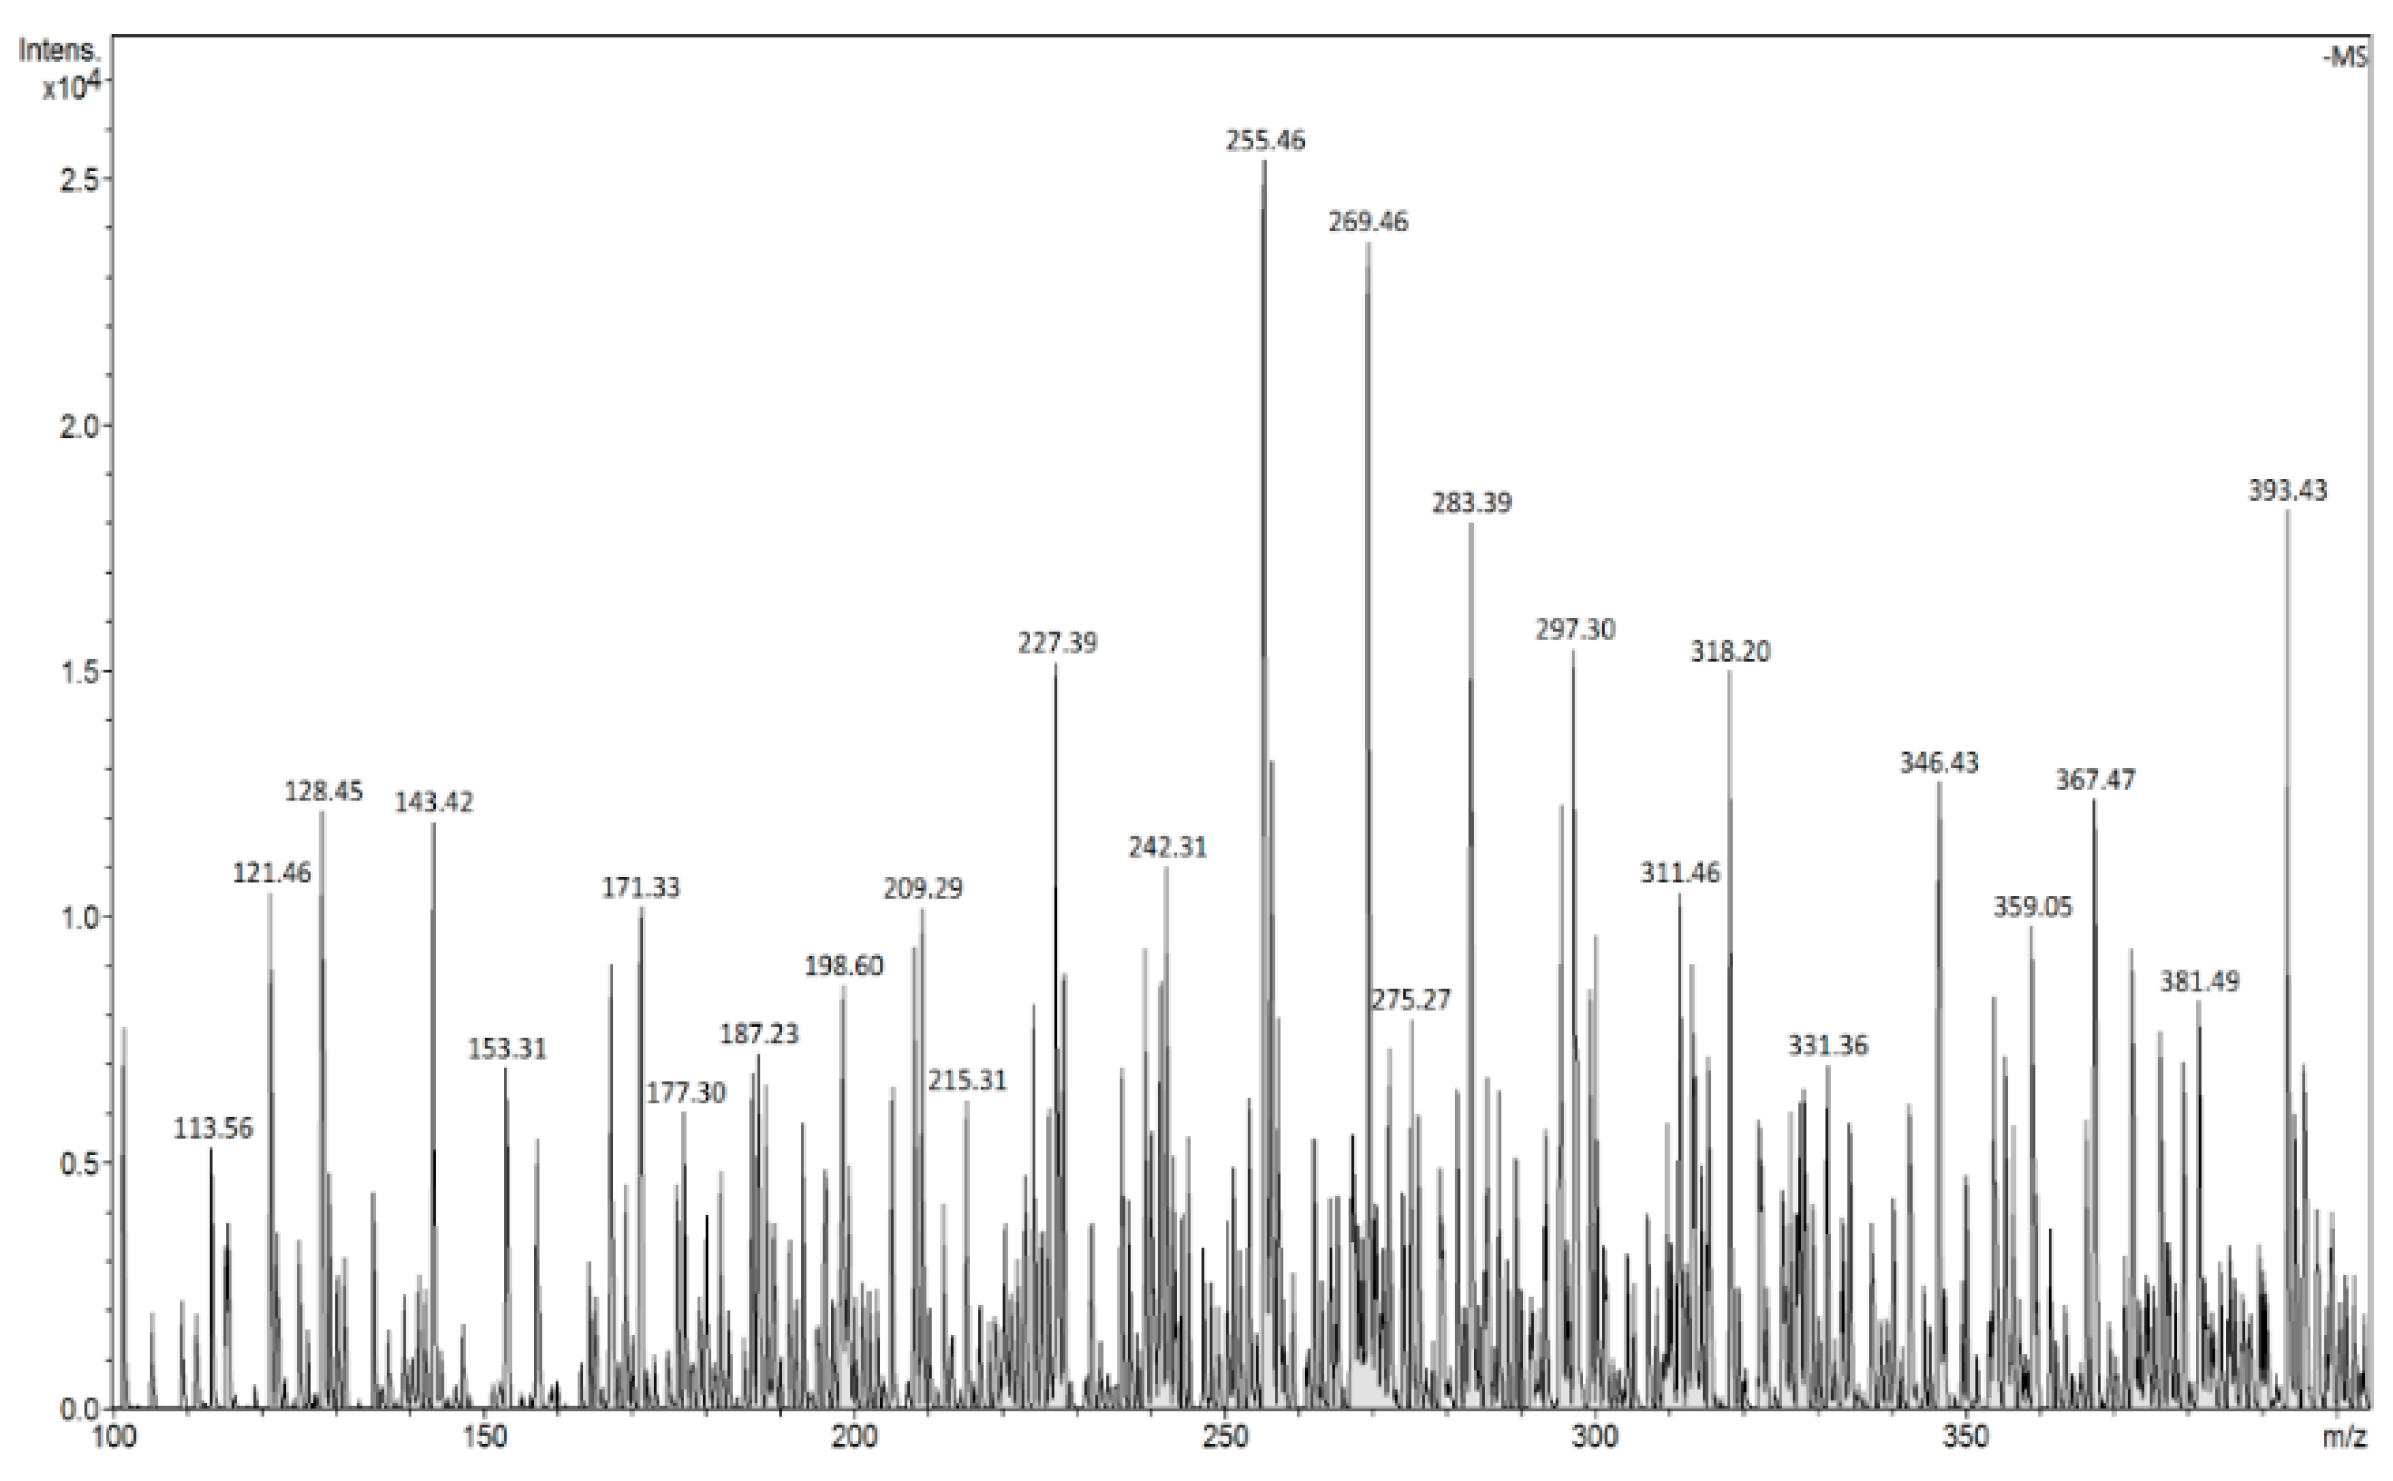
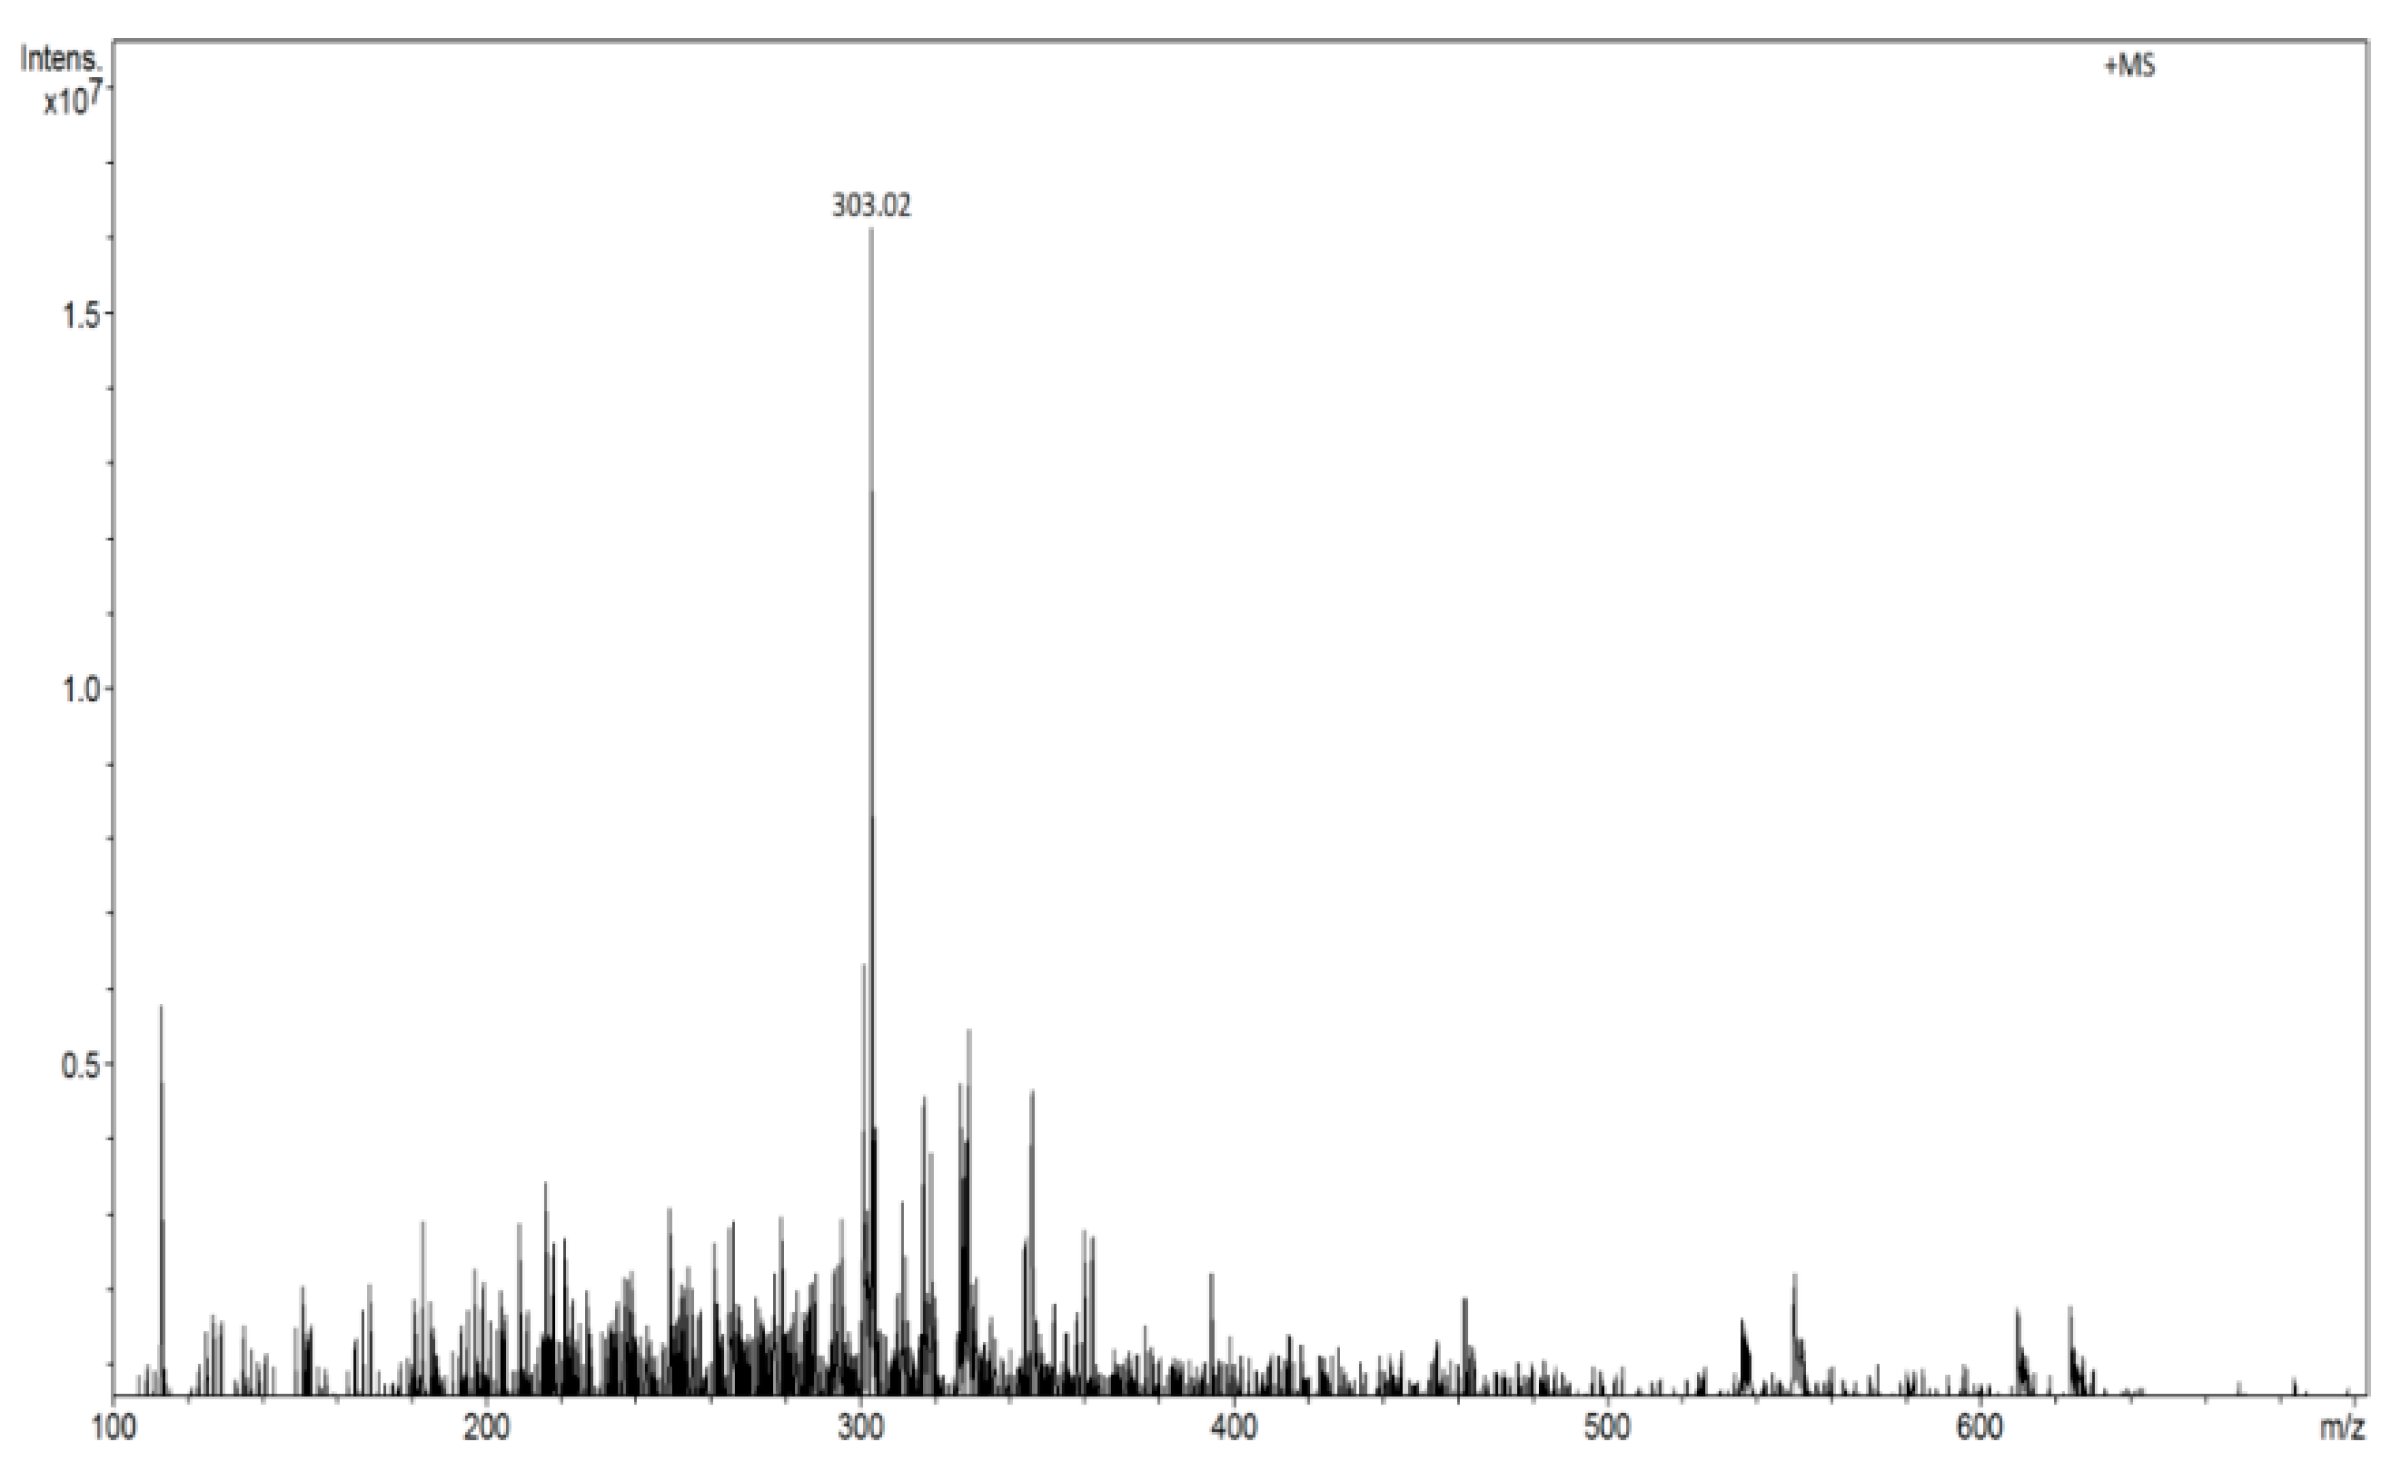
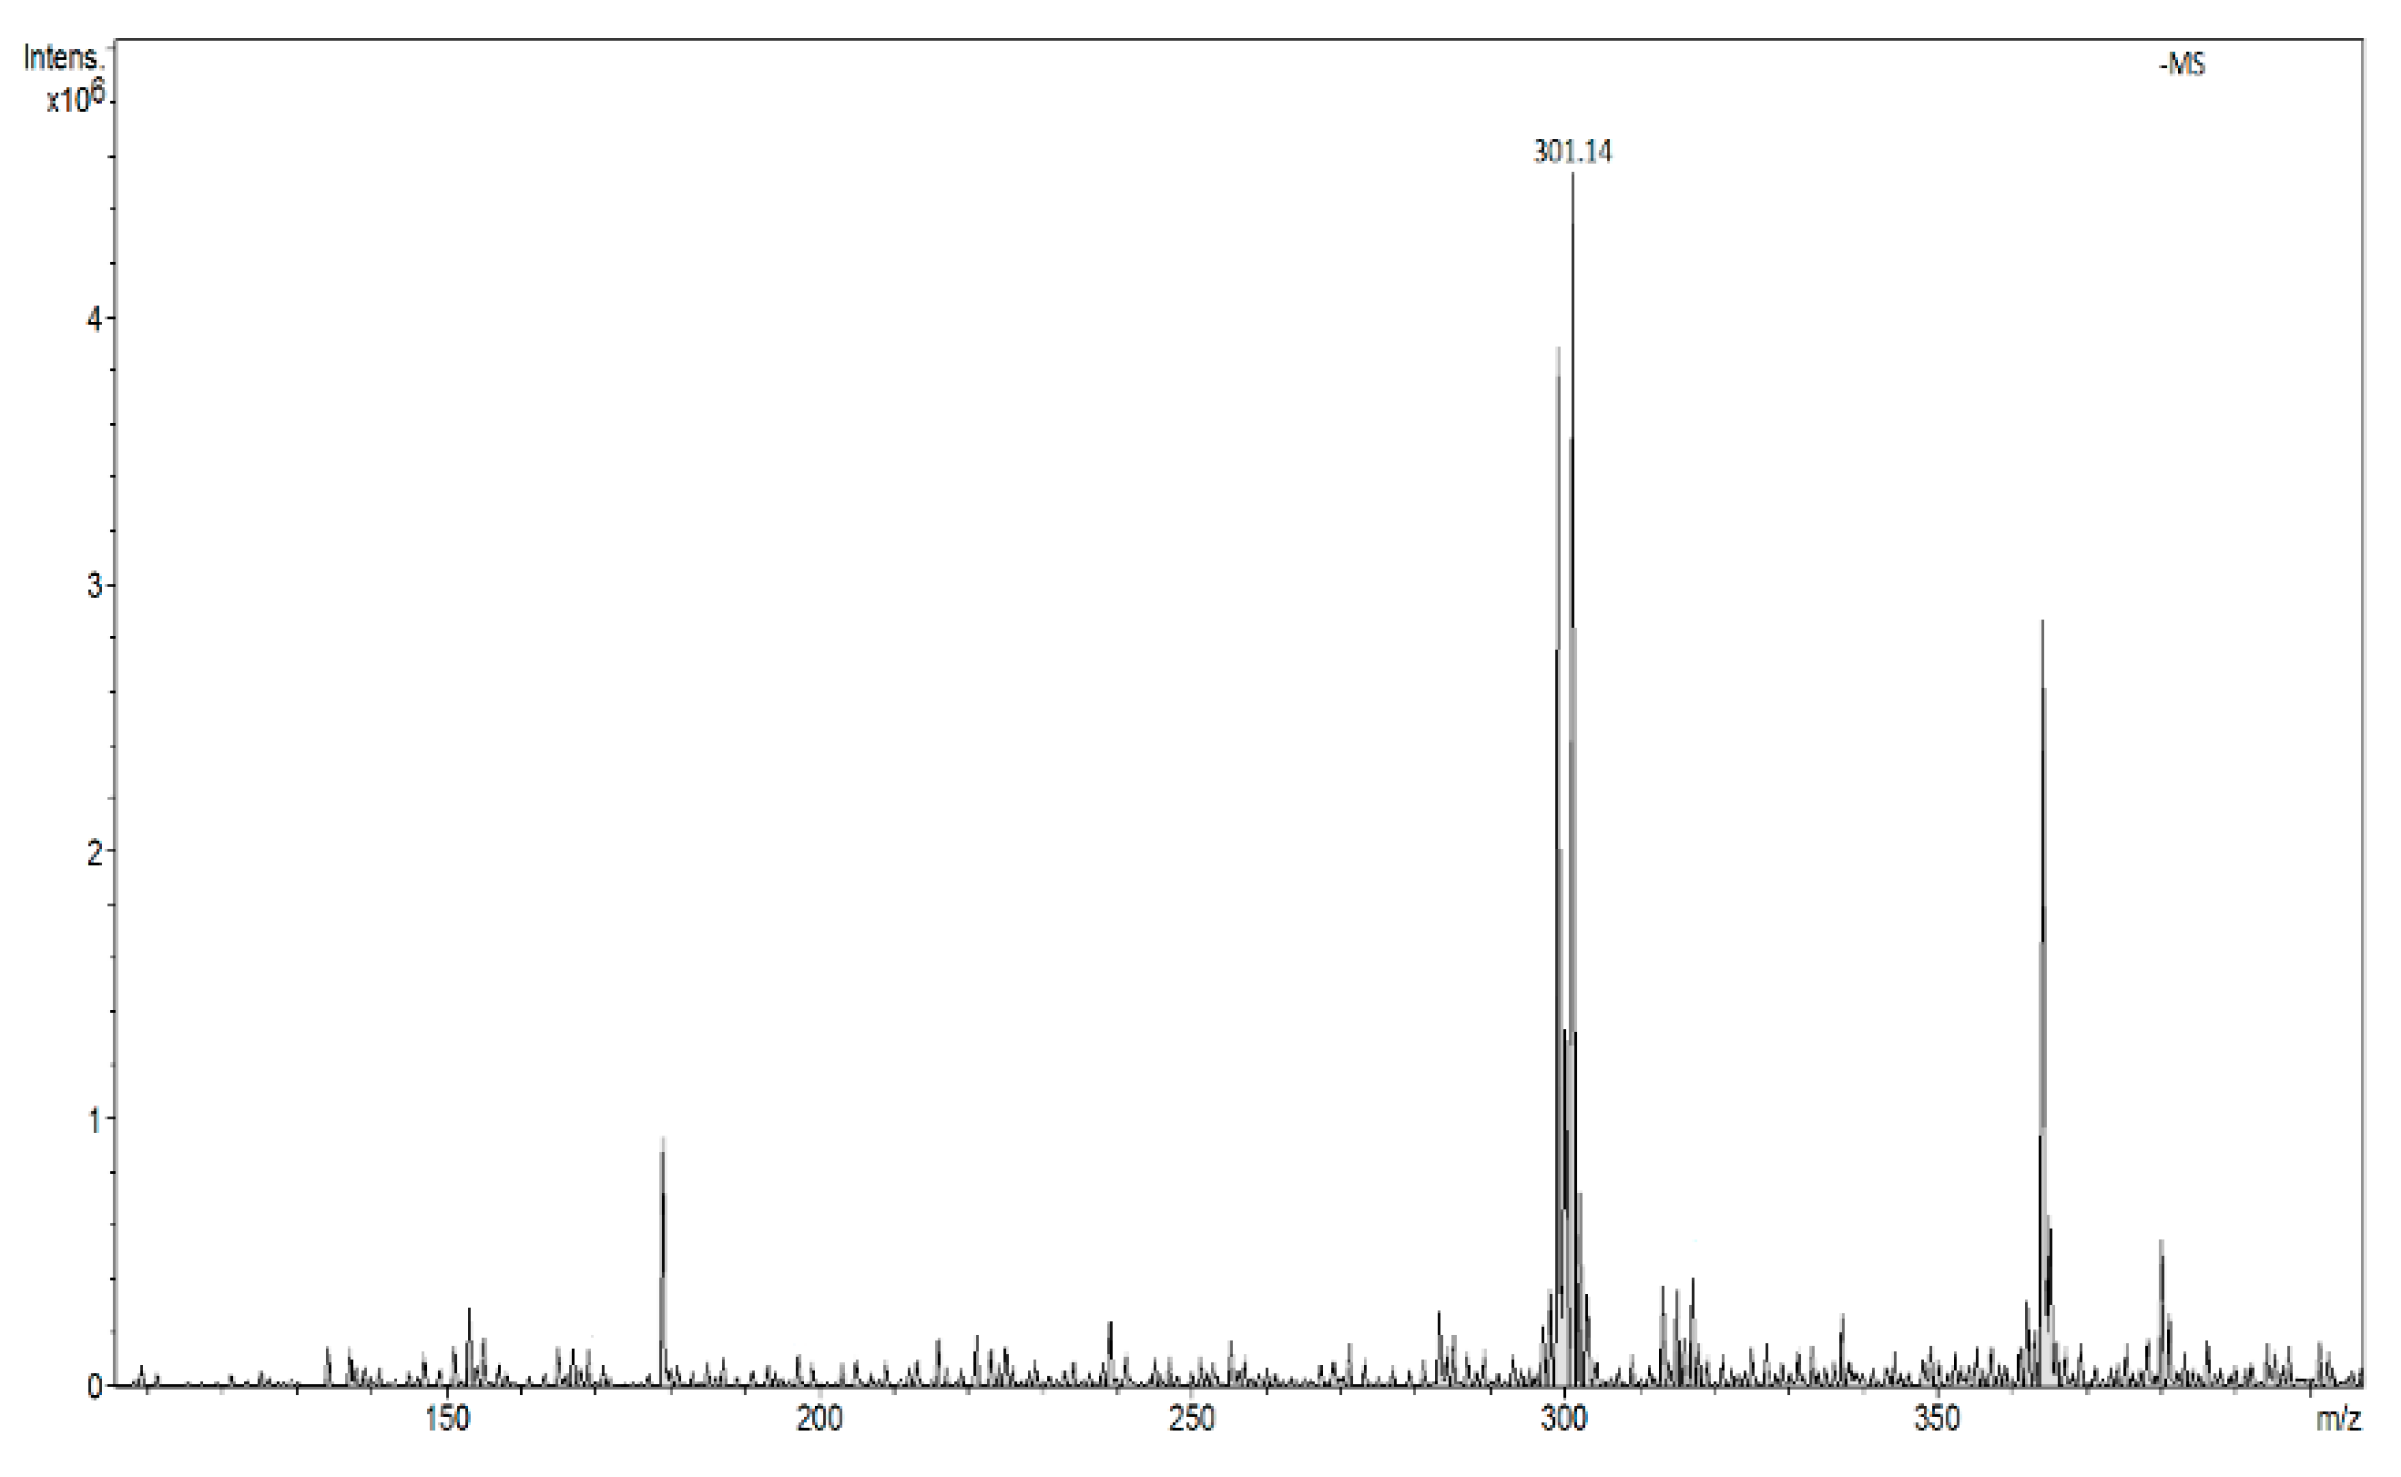
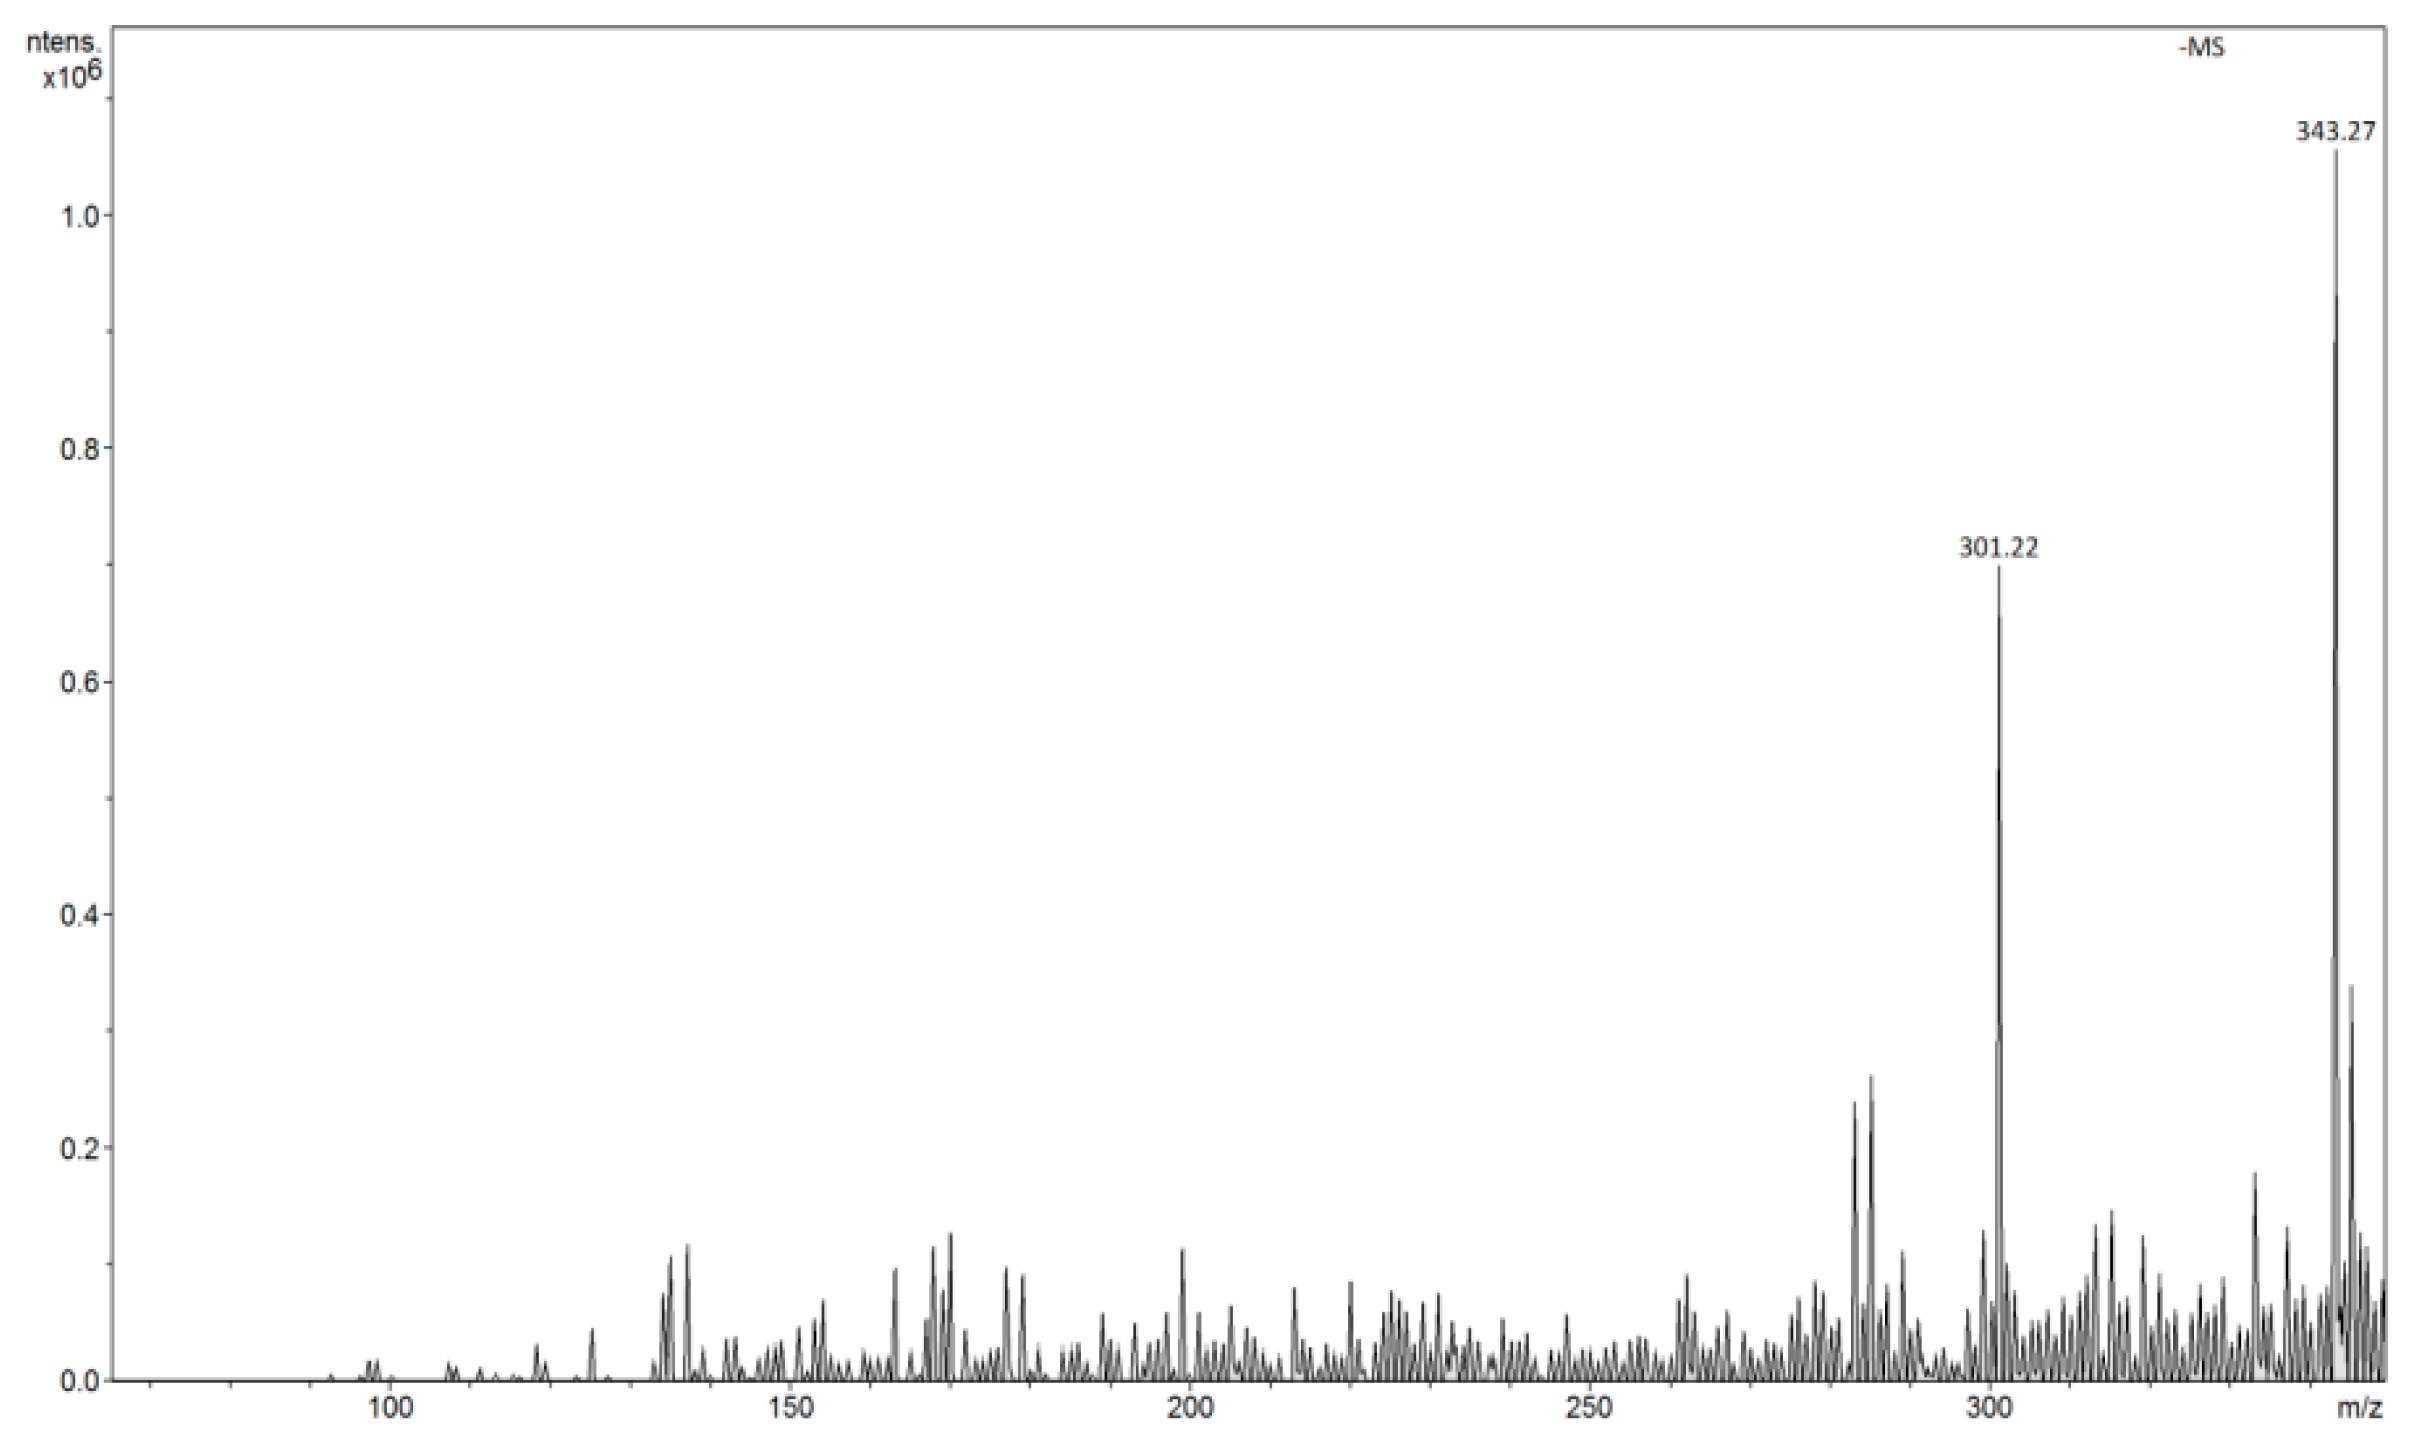
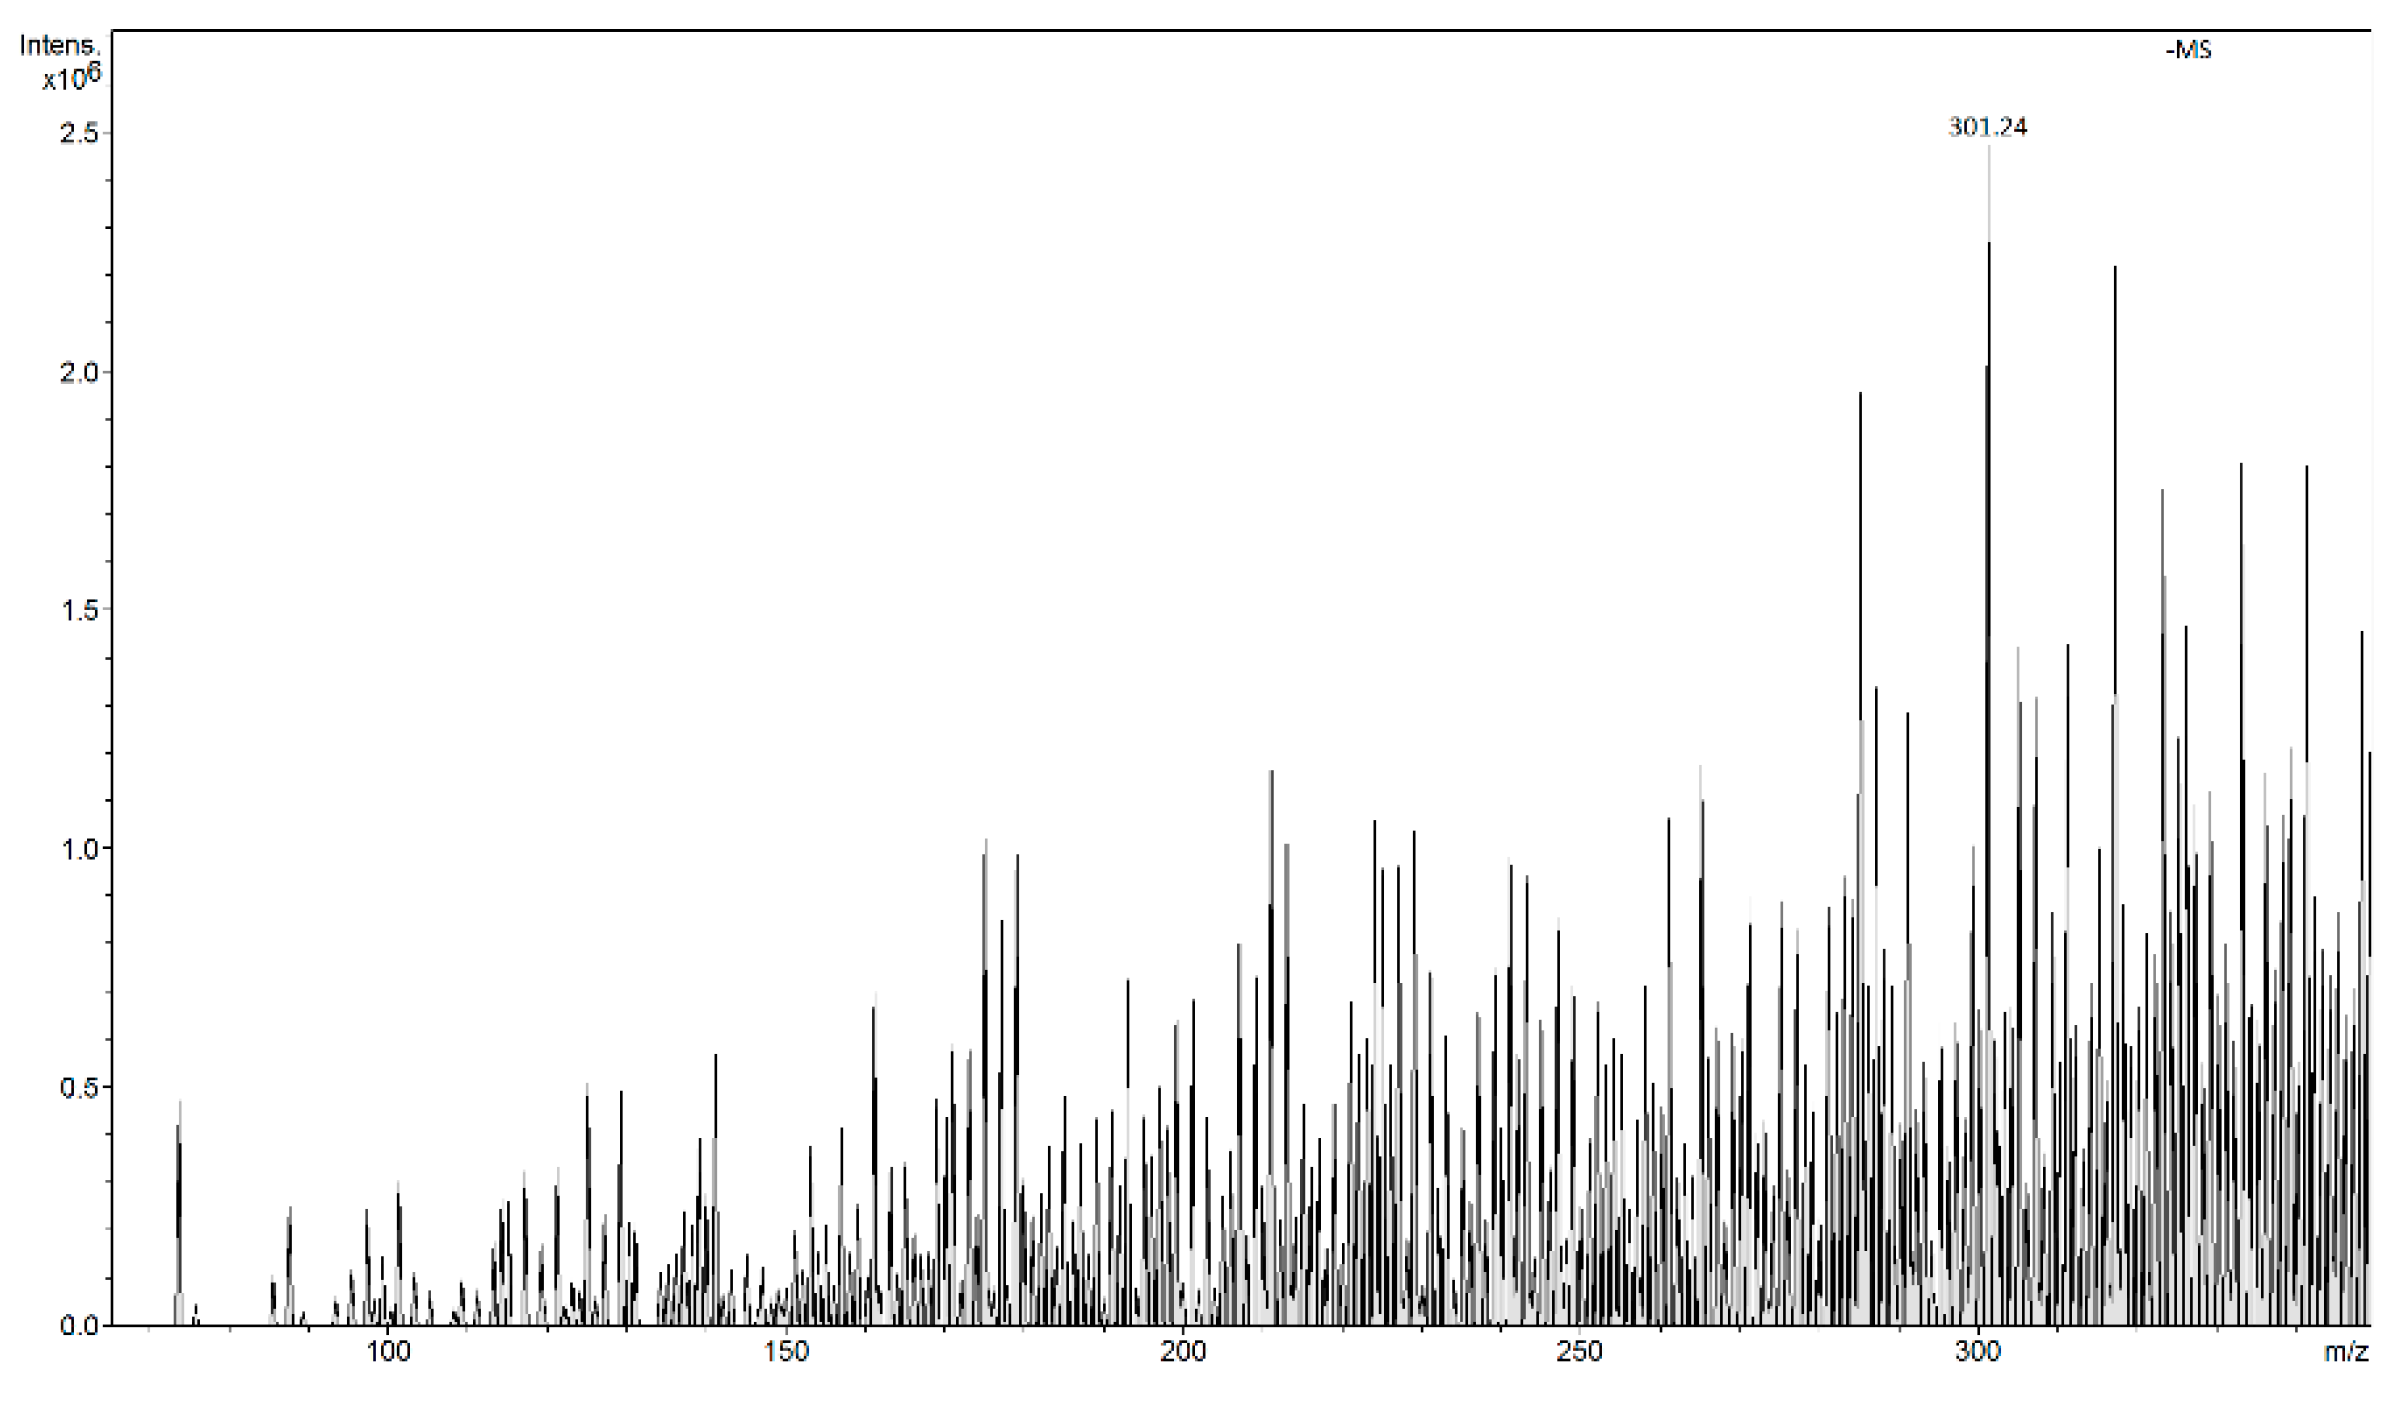
2.2.4. MS Analyzes
3. Materials and Method
3.1. Materials and Chemicals
3.2. Instruments
3.3. Synthesis
3.3.1. MIP
3.3.2. Mag-MIP
3.3.3. NIP and mag-NIP
4. Conclusions
Supplementary Materials
Author Contributions
Funding
Conflicts of Interest
References
- Pakade, V.E.; Molefe, E.D.; Tavengwa, N.T. Quantitative determination of trace concentrations of quercetin from prickly pear skin complex sample extracts by application of molecularly imprinted polymers. J. Environ. Chem. Eng. 2017, 5, 1186–1195. [Google Scholar] [CrossRef]
- Yu, C.; Mosbach, K. Molecular Imprinting Utilizing an Amide Functional Group for Hydrogen Bonding Leading to Highly Efficient Polymers. J. Org. Chem. 1997, 62, 4057–4064. [Google Scholar] [CrossRef]
- Song, X.; Li, J.; Wang, J.; Chen, L. Quercetin molecularly imprinted polymers: Preparation, recognition characteristic and properties as sorbent for solid-phase extraction. Talanta 2009, 80, 694–702. [Google Scholar] [CrossRef] [PubMed]
- Ersoy, S.K.; Tutem, E.; Baskan, K.S.; Apak, R.; Nergiz, C. Preparation, characterization and usage of molecularly imprinted polymer for the isolation of quercetin from hydrolyzed nettle extract. J. Chromatogr. B 2016, 1017, 89–100. [Google Scholar] [CrossRef] [PubMed]
- Xie, J.; Zhu, L.; Luo, H.; Zhou, L.; Li, C.; Xu, X. Direct extraction of specific pharmacophoric flavonoids from gingko leaves using a molecularly imprinted polymer for quercetin. J. Chromatogr. A 2001, 934, 1–11. [Google Scholar] [CrossRef]
- Curcio, M.; Cirillo, G.; Parisi, Q.I.; Iemma, F.; Picci, N.; Puoci, F. Quercetin-Imprinted Nanospheres as Novel Drug Delivery Devices. JFB 2012, 3, 269–282. [Google Scholar] [CrossRef] [PubMed]
- Hong, Y.; Chen, L. Extraction of quercetin from Herba Lysimachiae by molecularly imprinted-matrix solid phase dispersion. J. Chromatogr. B 2013, 941, 38–44. [Google Scholar] [CrossRef] [PubMed]
- Kudrinskaya, V.A.; Dmitrienko, S.G.; Zolotov, A. Synthesis and Study of Sorption Properties of Molecularly Imprinted Polymers for Quercetin. Moscow Univ. Chem. Bullet. 2009, 64, 124–129. [Google Scholar] [CrossRef]
- Pardo, A.; Mespouille, L.; Blankert, B.; Trouillas, P.; Surinf, M.; Dubois, P.; Duez, P. Quercetin-imprinted chromatographic sorbents revisited: Optimization of synthesis and rebinding protocols for application to natural resources. J. Chromatogr. A 2014, 1364, 128–139. [Google Scholar] [CrossRef]
- Krňanová, J.; Denderz, N.; Lehotay, J.; amohýl, M. Determination of Some Flavonoids by HPLC Using Quercetin-Molecularly Imprinted Polymers. J. Liquid Chromatogr. Related Technolo. 2015, 38, 702–708. [Google Scholar] [CrossRef]
- Uzuriaga-Sánchez, R.J.; Khan, S.; Wonga, A.; Picasso, G.; Pividori, M.I.; Taboada Sotomayor, M.D.P. Magnetically separable polymer (Mag-MIP) for selective analysis of biotin in food samples. Food Chem. 2016, 190, 460–467. [Google Scholar] [CrossRef] [PubMed]
- Marć, M.; Kupka, T.; Wieczorek, P.P.; Namieśnik, J. Computational modeling of molecularly imprinted polymers as a green approach to the development of novel analytical sorbents. Trends Analy. Chem. 2018, 98, 64–78. [Google Scholar] [CrossRef]
- Guć, M.; Schroeder, G. The Molecularly Imprinted Polymers. Influence of Monomers on The Properties of Polymers-A Review. World J. Res. Rev. (WJRR) 2017, 5, 36–47. [Google Scholar]
- Yu, L.; Yun, Y.; Zhang, W.; Wang, L. Preparation, recognition characteristics and properties for quercetin molecularly imprinted polymers. J. Desalination Water Treatment 2011, 34, 309–314. [Google Scholar] [CrossRef]
- del Mar Castro López, M.; Cela Pérez, M.C.; Dopico García, M.S.; López Vilarino, J.M.; González Rodríguez, M.V.; Barral Losada, L.F. Preparation, evaluation and characterization of quercetin-molecularly imprinted polymer for preconcentration and clean-up of catechins. Analy. Chim. Acta 2012, 721, 68–78. [Google Scholar] [CrossRef] [PubMed]
- Pakade, V.; Lindahl, S.; Chimuka, L.; Turner, C.; Dmitrienko, S.G.; Kudrinskaya, V.A.; Apyari, V.V. Methods of Extraction, Preconcentration, and Determination of Quercetin. J. Analy. Chem. 2012, 67, 299–311. [Google Scholar]
- Kobylińska, A.; Janas, K.M. Prozdrowotna rola kwercetyny obecnej w diecie człowieka. Postepy. Hig. Med. Dosw. 2015, 69, 51–62. [Google Scholar] [CrossRef]
- Gheribi, E. Związki polifenolowe w owocach i warzywach. Medycyna Rodzinna 2011, 4, 111–115. [Google Scholar]
- Chebotarev, A.N.; Snigur, D.V. Study of the Acid Base Properties of Quercetin in Aqueous Solutions by Color Measurements. J. Analy. Chem. 2015, 70, 55–59. [Google Scholar] [CrossRef]
- Quercetin. Available online: https://www.drugbank.ca/drugs/DB04216 (accessed on 25 February 2019).
- Scigelova, M.; Hornshaw, M.; Giannakopulos, A.; Makarov, A. Fourier Transform Mass Spectrometry. Mol. Cell. Proteomics 2011, 10, 1–19. [Google Scholar] [CrossRef]
- Zenkevich, I.G.; Eshchenko, A.Y.; Makarova, S.V.; Vitenberg, A.G.; Dobryakov, Y.G.; Utsal, V.A. Identification of the Products of Oxidation of Quercetin by Air Oxygen at Ambient Temperature. Molecules 2007, 12, 654–672. [Google Scholar] [CrossRef] [PubMed]
- Tiberti, L.A.; Yariwake, J.H.; Ndjokob, K.; Hostettmannb, K. On-Line LC/UV/MS Analysis of Flavonols in the Three Apple Varieties Most Widely Cultivated in Brazil. J. Braz. Chem. Soc. 2007, 18, 100–105. [Google Scholar] [CrossRef]
- Fabre, N.; de Pharmacognosie, I.R.L.; de Hoffmann, E.; Quetin-Leclercq, J. Determination of Flavone, Flavonol, and Flavanone Aglycones by Negative Ion Liquid Chromatography Electrospray Ion Trap Mass Spectrometry. J. Am. Soc. Mass Spectrum. 2001, 12, 707–715. [Google Scholar] [CrossRef]
- Smoluch, M.; Reszke, E.; Ramsza, A.; Labuz, K.; Silberring, J. Direct analysis of methcathinone from crude reaction mixture by flowing atmospheric-pressure afterglow mass spectrometry. Rapid Commun. Mass Spectrom. 2012, 26, 1577. [Google Scholar] [CrossRef] [PubMed]
- Ceglowski, M.; Kurczewska, J.; Smoluch, M.; Reszke, E.; Silberring, J.; Schroeder, G. Magnetic scavengers as carriers of analytes for flowing atmospheric pressure afterglow mass spectrometry (FAPA-MS). Analyst 2015, 140, 6138. [Google Scholar] [CrossRef] [PubMed]
- Cegłowski, M.; Smoluch, M.; Reszke, E.; Silberring, J.; Schroeder, G. Flowing atmospheric pressure afterglow combined with laser ablation for direct analysis of compounds separated by thin-layer chromatography. Anal. Bioanal. Chem. 2015, 408, 815. [Google Scholar]
- Ghafoor, S.; Ata, S. Synthesis of carboxyl-modified Fe3O4@SiO2 nanoparticles and their utilization for the remediation of cadmium and nickel from aqueous solution. J. Chil. Chem. Soc. 2017, 62, 3588–3592. [Google Scholar] [CrossRef]
Sample Availability: Not available. |


© 2019 by the authors. Licensee MDPI, Basel, Switzerland. This article is an open access article distributed under the terms and conditions of the Creative Commons Attribution (CC BY) license (http://creativecommons.org/licenses/by/4.0/).
Share and Cite
Guć, M.; Schroeder, G. Application of Molecularly Imprinted Polymers (MIP) and Magnetic Molecularly Imprinted Polymers (mag-MIP) to Selective Analysis of Quercetin in Flowing Atmospheric-Pressure Afterglow Mass Spectrometry (FAPA-MS) and in Electrospray Ionization Mass Spectrometry (ESI-MS). Molecules 2019, 24, 2364. https://doi.org/10.3390/molecules24132364
Guć M, Schroeder G. Application of Molecularly Imprinted Polymers (MIP) and Magnetic Molecularly Imprinted Polymers (mag-MIP) to Selective Analysis of Quercetin in Flowing Atmospheric-Pressure Afterglow Mass Spectrometry (FAPA-MS) and in Electrospray Ionization Mass Spectrometry (ESI-MS). Molecules. 2019; 24(13):2364. https://doi.org/10.3390/molecules24132364
Chicago/Turabian StyleGuć, Maria, and Grzegorz Schroeder. 2019. "Application of Molecularly Imprinted Polymers (MIP) and Magnetic Molecularly Imprinted Polymers (mag-MIP) to Selective Analysis of Quercetin in Flowing Atmospheric-Pressure Afterglow Mass Spectrometry (FAPA-MS) and in Electrospray Ionization Mass Spectrometry (ESI-MS)" Molecules 24, no. 13: 2364. https://doi.org/10.3390/molecules24132364