
Polyphenolic Profiling, Quantitative Assessment and Biological Activities of Tunisian Native Mentha rotundifolia (L.) Huds.

 ,
, 
Abstract
:1. Introduction
- (i)
- Identify by both mass-spectrometric and NMR approaches polyphenolics from ten plant populations of Tunisian M. rotundifolia (L.) Huds growing wild in two bioclimatic zones;
- (ii)
- Quantify metanolic extracts by a validated analytical strategy;
- (iii)
- Evaluate the antioxidant and anti-acetylcholinesterase activities of extracts towards their chemical composition.
2. Results and Discussion
3. Material and Methods
3.1. General
3.2. Plant Collection and Extraction
3.3. Total Phenolic Content (TPC) and Total Flavonoid Content (TFC).
3.4. Identification and Quantification of Phenolic Compounds
3.4.1. Identification of Phenolic Compounds
3.4.2. Quantification of Phenolic Compounds
Validation of the UHPLC-MS Quantitative Method
3.5. Antioxidant Activity
3.5.1. Free Radical-Scavenging Assay
3.5.2. β-Carotene Bleaching Assay
3.5.3. Ferric Reducing Power Activity (FRAP Assay)
3.6. Acetylcholinesterase Inhibition Assay
3.7. Statistical Analyses
4. Conclusions
Supplementary Materials
Author Contributions
Funding
Acknowledgments
Conflicts of Interest
References
- Attiya, J.; Bin, G.; Bilal, H.A.; Zabta, K.S.; Tariq, M. Phylogenetics of selected Mentha species on the basis of rps8, rps11 and rps14 chloroplast genes. J. Med. Plants Res. 2012, 6, 30–36. [Google Scholar]
- Pereira, R.O.; Cardoso, M.S. Overview on Mentha and Thymus polyphenols. Curr. Anal. Chem. 2013, 9, 382–396. [Google Scholar] [CrossRef]
- De Sousa Barros, A.; de Morais, S.M.; Ferreira, P.A.T.; Vieira, Í.G.P.; Craveiro, A.A.; dos Santos Fontenelle, R.O.; Silva Alencar de Menezes, J.E.; Ferreira da Silva, F.W.; de Sousa, H.A. Chemical composition and functional properties of essential oils from Mentha species. Ind. Crops Prod. 2015, 76, 557–564. [Google Scholar] [CrossRef]
- Kanatt, S.R.; Chander, R.; Sharma, A. Antioxidant potential of mint (Mentha spicata L.) in radiation-processed lamb meat. Food Chem. 2007, 100, 451–458. [Google Scholar] [CrossRef]
- Oroian, M.; Escriche, I. Antioxidants: characterization, natural sources, extraction and analysis. Food Res. Int. 2015, 74, 10–36. [Google Scholar] [CrossRef] [PubMed]
- Joseph, S.V.; Edirisinghe, I.; Burton-Freeman, B.M. Fruit polyphenols: A review of anti-inflammatory effects in humans. Crit. Rev. Food Sci. Nutr. 2016, 56, 419–444. [Google Scholar] [CrossRef] [PubMed]
- Boffetta, P.; Couto, E.; Wichmann, J.; Ferrari, P.; Trichopoulos, D.; Bueno-de-Mesquita, H.B. Fruit and vegetable intake and overall cancer risk in the European prospective investigation into cancer and nutrition (EPIC). J. Nat. Canc. Inst. 2010, 102, 529–537. [Google Scholar] [CrossRef]
- Brahmi, F.; Hauchard, D.; Guendouze, N.; Madani, K.; Kiendrebeogo, M.; Kamagaju, L.; Duez, P. Phenolic composition, in vitro antioxidant effects and tyrosinase inhibitory activity of three Algerian Mentha species: M. spicata (L.), M. pulegium (L.) and M. rotundifolia (L.) Huds (Lamiaceae). Ind. Crops Prod. 2015, 74, 722–730. [Google Scholar]
- Thilakarathna, S.H.; Rupasinghe, H.P.V. Anti-atherosclerotic effects of fruit bioactive compounds: A review of current scientific evidence. Can. J. Plant Sci. 2012, 92, 407–419. [Google Scholar] [CrossRef]
- Cardona, F.; Andrés-Lacueva, C.; Tulipani, S.; Tinahones, F.J.; Queipo-Ortuño, M.I. Benefits of polyphenols on gut microbiota and implications in human health. J. Nutr. Biochem. 2013, 24, 1415–1422. [Google Scholar] [CrossRef] [Green Version]
- Espín, J.C.; González-sarrías, A.; Tomás-barberán, F.A. The gut microbiota: a key factor in the therapeutic effects of (poly) phenols. Biochem. Pharm. 2017, 139, 82–93. [Google Scholar] [CrossRef]
- Mata, A.T.; Proença, C.; Ferreira, A.R.; Serralheiro, M.L.M.; Nogueira, J.M.F.; Araújo, M.E.M. Antioxidant and antiacetylcholinesterase activities of five plants used as Portuguese food spices. Food Chem. 2007, 103, 778–786. [Google Scholar] [CrossRef]
- Silva, L.; Rodrigues, A.M.; Ciriani, M.; Falé, P.L.V.; Teixeira, V.; Madeira, P.; Machuqueiro, M.; Pacheco, R.; Florencio, M.H.; Ascencao, L.; et al. Antiacetylcholinesterase activity and docking studies with chlorogenic acid, cynarin and arzanol from Helichrysum stoechas (Lamiaceae). Med. Chem. Res. 2017, 26, 2942–2950. [Google Scholar] [CrossRef]
- Sutour, S.; Bradesi, P.; Casanova, J.; Tomi, F. Composition and chemical variability of Mentha suaveolens ssp. suaveolens and M. suaveolens ssp. insularis from Corsica’. Chem. Biodiv. 2010, 7, 1002–1008. [Google Scholar]
- Riahi, L.; Elferchichi, M.; Ghazghazi, H.; Jebali, J.; Ziadi, S.; Aouadhi, C.; Chograni, H.; Zaouali, Y.; Zoghlami, N.; Mliki, A. Phytochemistry, antioxidant and antimicrobial activities of the essential oils of Mentha rotundifolia L. in Tunisia. Ind. Crops Prod. 2013, 49, 883–889. [Google Scholar] [CrossRef]
- Liu, W.; Yin, D.; Li, N.; Hou, X.; Wang, D.; Li, D.; Liu, J. Influence of environmental factors on the active substance production and antioxidant activity in Potentilla fruticosa L. and its quality assessment. Sci. Rep. 2016, 6, 1–18. [Google Scholar]
- Brahmi, F.; Hadj-Ahmed, S.; Zarrouk, A.; Bezine, M.; Nury, T.; Madani, K.; Lizard, G. Evidence of biological activity of Mentha species extracts on apoptotic and autophagic targets on murine RAW264.7 and human U937 monocytic cells. Pharm. Biol. 2017, 55, 286–293. [Google Scholar] [CrossRef]
- Pares, M.E. A pharmacognostic study on Mentha rotundifolia (L.) Hudson. Circle Farm. 1983, 41, 133–152. [Google Scholar]
- Benabdallah, A.; Rahmoune, C.; Boumendjel, M.; Aissi, O.; Messaoud, C. Total phenolic content and antioxidant activity of six wild Mentha species (Lamiaceae) from northeast of Algeria. Asian Pac. J. Trop. Biomed. 2016, 6, 760–766. [Google Scholar] [CrossRef]
- Boussouf, L.; Boutennoune, H.; Kebieche, M.; Adjeroud, N.; Al-Qaoud, K.; Madani, K. Anti-inflammatory, analgesic and antioxidant effects of phenolic compound from Algerian Mentha rotundifolia L. leaves on experimental animals. South Afr. J. Bot. 2017, 113, 77–83. [Google Scholar] [CrossRef]
- Ai, C.B.; Deng, Q.H.; Song, W.Z.; Li, L.N. Salvianolic acid J, a depside from Salvia flava. Phytochemistry 1994, 37, 907–908. [Google Scholar] [CrossRef]
- Chatzopoulou, A.; Karioti, A.; Gousiadou, C.; Lax Vivancos, V.; Kyriazopoulos, P.; Golegou, S.; Skaltsa, H. Depsides and other polar constituents from Origanum dictamnus L. and their in vitro antimicrobial activity in clinical strains. J. Agric. Food Chem. 2010, 58, 6064–6068. [Google Scholar] [CrossRef]
- Matsumoto, K.; Takahashi, H.; Miyake, Y.; Fukuyama, Y. Convenient syntheses of neurotrophic americanol A and isoamericanol A by HRP catalyzed oxidative coupling of caffeic acid. Tetrahedron Lett. 1999, 40, 3185–3186. [Google Scholar] [CrossRef]
- Lin, Y.-L.; Wang, C.-N.; Shiao, Y.-J.; Liu, T.-Y.; Wang, W.-Y. Benzolignanoid and polyphenols from Origanum vulgare. J. Chin. Chem. Soc. 2003, 50, 1079–1083. [Google Scholar] [CrossRef]
- Di Ferdinando, M.; Brunetti, C.; Agati, G.; Tattini, M. Multiple functions of polyphenols in plants inhabiting unfavorable Mediterranean areas. Environ. Exp. Bot. 2014, 103, 107–116. [Google Scholar] [CrossRef]
- Moldovan, R.I.; Oprean, R.; Benedec, D.; Hanganu, D.; Duma, M.; Oniga, I.; Vlase, L. LC-MS analysis, antioxidant and antimicrobial activities for five species of Mentha cultivated in Romania. Digest J. Nanomater. Biostr. 2014, 9, 559–566. [Google Scholar]
- Seladji, M.; Bekhechi, C.; Bendimerad, N. Antioxidant and antimicrobial activity of aqueous and methanolic extracts of Mentha rotundifolia L. from Algeria. Int. J. Pharm. Sci. Rev. Res. 2014, 26, 228–234. [Google Scholar]
- Khaled-Khodja, N.; Boulekbache-Makhlouf, L.; Madani, K. Phytochemical screening of antioxidant and antibacterial activities of methanolic extracts of some Lamiaceae. Ind. Crops Prod. 2014, 61, 41–48. [Google Scholar] [CrossRef]
- Dinis, P.C.; Falé, P.L.; Madeira, P.J.A.; Florêncio, M.H.; Serralheiro, M.L. Acetylcholinesterase inhibitory activity after in vitro gastrointestinal digestion of infusions of Mentha species. Eur. J. Med. Plants 2013, 3, 381–393. [Google Scholar] [CrossRef]
- Uriarte-Pueyo, I.; Calvo, M.I. Flavonoids as acetylcholinesterase inhibitors. Curr. Med. Chem. 2011, 18, 5289–5302. [Google Scholar] [CrossRef]
- Vladimir-Knezevic, S.; Blazekovic, B.; Kindl, M.; Vladic, J.; Lower-Nedza, A.D.; Brantner, A.H. Acetylcholinesterase inhibitory, antioxidant and phytochemical properties of selected medicinal plants of the Lamiaceae family. Molecules 2014, 19, 767–782. [Google Scholar] [CrossRef]
- Habtemariam, S. Molecular pharmacology of rosmarinic and salvianolic acids: potential seeds for Alzeihmeir’s and vascular dementia drugs. Int. J. Mol. Sci. 2018, 19, 458. [Google Scholar] [CrossRef]
- Roseiro, L.B.; Rauter, A.P.; Serralheiro, M.L.M. Polyphenols as acetylcholinesterase inhibitors: Structural specificity and impact on human disease. Nutr. Aging 2012, 1, 99–111. [Google Scholar] [Green Version]
- Katalinic, M.; Rusak, G.; Barovic, J.D.; Sinko, G.; Jelic, D.; Antolovic, R.; Kovarik, Z. Structural aspects of flavonoids as inhibitors of human butyrylcholinesterase. Eur. J. Med. Chem. 2010, 45, 186–192. [Google Scholar] [CrossRef]
- Sezer Senol, F.; Ankli, A.; Reich, R.; Erdogan Orhan, I. HPTLC fingerprinting and cholinesterase inhibitory and metal-chelating capacity of various Citrus cultivars and Olea europaea. Food Technol. Biotechnol. 2016, 54, 275–281. [Google Scholar]
- Shabani, S.; Mirshekar, M.A. Diosmin is neuroprotective in a rat model of scopolamine-induced cognitive impairment. Biomed Pharm. 2018, 108, 1376–1383. [Google Scholar] [CrossRef]
- Singleton, V.L.; Orthofer, R.; Lamuela-Raventos, R.M. Analysis of total phenols and other oxidation substrates and antioxidants by means of Folin-Ciocalteu reagent. Methods Enzym. 1999, 299, 152–178. [Google Scholar]
- Chetoui, I.; Messaoud, C.; Boussaid, M.; Zaouali, Y. Antioxidant activity, total phenolic and flavonoid content variation among Tunisian natural populations of Rhus tripartita (Ucria) Grande and Rhus pentaphylla Desf. Ind. Crops Prod. 2013, 51, 171–177. [Google Scholar]
- Gulluce, M.; Sahin, F.; Sokmen, M.; Ozer, H.; Daferera, D.; Sokmen, A.; Polissiou, M.; Adiguzel, A.; Ozkan, H. Antimicrobial and antioxidant properties of the essential oils and methanol extract from Mentha longifolia L. ssp. longifolia. Food Chem. 2007, 103, 1449–1456. [Google Scholar] [CrossRef]
- Benzie, F.F.; Strain, J.J. The ferric reducing ability of plasma (FRAP) as a measure of ‘‘Antioxidant Power″: The FRAP Assay. Anal. Biochem. 1996, 239, 70–76. [Google Scholar] [CrossRef]
- Eldeen, I.M.S.; Elgorashi, E.E.; Van Staden, J. Antibacterial, anti-inflammatory, anti-cholinesterase and mutagenic effects of extracts obtained from some trees used in South African traditional medicine. J. Ethnopharm. 2005, 102, 457–464. [Google Scholar] [CrossRef] [PubMed]
- Ferreira, A.; Proenca, C.; Serralheiro, M.L.M.; Araujo, M.E.M. The in vitro screening for acetylcholinesterase inhibition and antioxidant activity of medicinal plants from Portugal. J. Ethnopharm. 2006, 108, 31–37. [Google Scholar] [CrossRef] [PubMed]
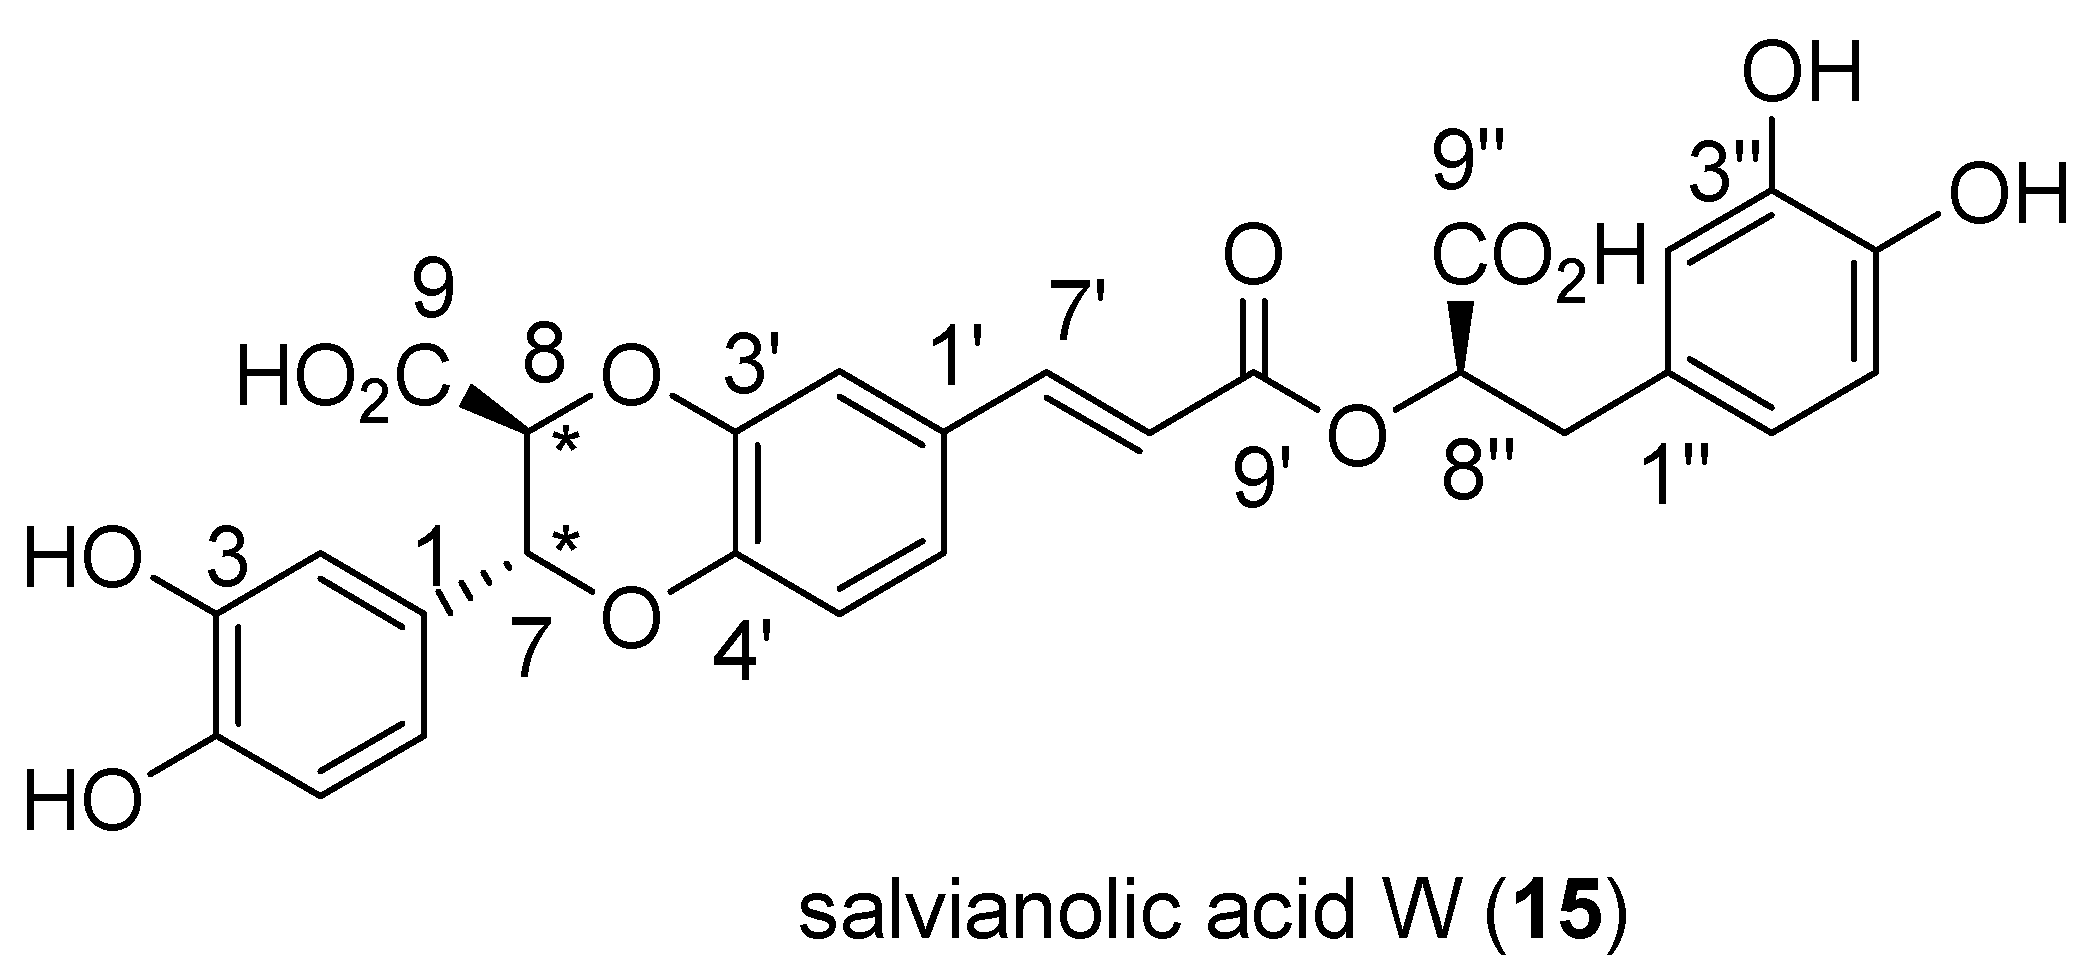
Sample Availability: Sample of novel pure compound salvianolic acid W is available from AC. |


| MROT-1 | MROT-2 | MROT-3 | MROT-4 | MROT-5 | MROT-6 | MROT-7 | MROT-8 | MROT-9 | MROT-10 | |
|---|---|---|---|---|---|---|---|---|---|---|
| Extraction Yield (%) | 17.79 ± 2.16 c | 14.83 ± 0.47 d | 8.12 ± 0.57 f | 14.84 ± 1.37 d | 13.37 ± 2.63 e | 13.92 ± 1.33 e | 19.26 ± 3.62 b | 17.15 ± 0.03 c | 22.54 ± 2.73 a | 19.54 ± 0.81 b |
| Polyphenols (mg GAE/g DW) | 57.11 ± 1.53 a | 39.47 ± 0.28 b | 5.70 ± 0.39 f | 30.09 ± 1.19 cd | 33.17 ± 3.96 c | 25.76 ± 0.49 ed | 33.30 ± 3.05 c | 22.61 ± 0.07 e | 24.80 ± 1.44 ed | 20.55 ± 1.35 e |
| Flavonoids (mg ER/g DW) | 24.11 ± 0.33 a | 21.65 ± 0.09 a | 5.12 ± 0.29 d | 23.66 ± 2.24 a | 23.73 ± 2.34 a | 16.28 ± 1.96 b | 20.55 ± 0.02 a | 10.92 ± 0.01 c | 20.20 ± 0.36 a | 11.79 ± 0.41 c |
| DPPH (IC50 µg/mL) | 15.16 ± 0.16 e | 57.44 ± 3.87 c | 83.50 ± 0.95 b | 21.40 ± 0.85 e | 54.40 ± 0.40 c | 62.26 ± 9.64 c | 40.66 ± 0.66 d | 96.66 ± 3.33 a | 75.50 ± 3.40 b | 86.50 ± 0.97 ab |
| β-carotene (IC50 µg/mL) | 106.66 ± 6.66 f | 115.08 ± 9.34 f | 816.66 ± 11.78 b | 902.50 ± 22.74 a | 936.25 ± 0.69 a | 110.93 ± 10.96 f | 796.66 ± 26.66 b | 196.66 ± 20.27 e | 745.55 ± 4.37 c | 458.33 ± 1.82 d |
| FRAP (µmol eqFe2+/g) | 574.03 ± 0.98 a | 154.54 ± 9.81 h | 62.02 ± 0.95 j | 497.43 ± 21.31 b | 251.15 ± 2.22 f | 115.06 ± 13.77 i | 372.11 ± 0.01 d | 289.65 ± 1.12 e | 209.94 ± 11.43 g | 445.41 ± 12.67 c |
| AChE (IC50 mg/mL) | 0.70 ± 0.03 d | 0.24 ± 0.01 fg | 0.21 ± 0.01 g | 0.27 ± 0.01 f | 0.21 ± 0.01 g | 0.83 ± 0.02 c | 0.87 ± 0.03 c | 0.93 ± 0.01 b | 0.54 ± 0.02 e | 2.16 ± 0.02 a |
| C | 1H, δ, m, J (Hz) a | 13C, ppm a | 1H, δ, m, J (Hz) b | 13C, ppm b | |
|---|---|---|---|---|---|
| 1 | C | - | 129.9 | - | 129.5 |
| 2 | CH | 6.88, d, 1.8 | 115.6 | 6.98, d, 1.1 | 115.2 |
| 3 | C | - | 146.2 | - | 144.0 g |
| 4 | C | - | 146.8 e | - | 145.4 |
| 5 | CH | 6.75, d, 8.1 | 116.2 | 6.85 d | 116.7 |
| 6 | CH | 6.79 c | 120.2 | 6.84 d | 120.1 |
| 7 | CH | 5.16, d, 5.5 | 78.2 | 5.28, d. 4.9 | 77.0 |
| 8 | CH | 4.52, d, 5.5 | 81.1 | 4.69, d, 4.9 | 79.2 |
| 9 | C | - | 174.5 | - | 174.5 |
| 1′ | C | - | 129.3 | - | 128.6 |
| 2′ | CH | 7.16, d, 1.8 | 117.5 | 7.20, d, 1.7 | 117.3 |
| 3′ | C | - | 146.8e | - | 146.0 h |
| 4′ | C | - | 145.8f | - | 144.1 |
| 5′ | CH | 6.96, d, 8.4 | 118.4 | 7.0, d, 8.8 | 117.8 |
| 6′ | CH | 7.12, dd, 8.4, 1.8 | 123.1 | 7.19, dd, 8.8, 1.7 | 123.6 |
| 7′ | CH | 7.57, d, 16.0 | 146.3 | 7.57, d, 16.0 | 146.0 h |
| 8′ | CH | 6.38, d, 16.0 | 117.2 | 6.39, d, 16.0 | 116.0 |
| 9′ | C | - | 168.8 | - | 169.2 |
| 1″ | C | - | 131.3 | - | 131.0 |
| 2″ | CH | 6.80c | 117.1 | 6.85d | 119.6 |
| 3″ | C | - | 145.8 f | - | 144.9 |
| 4″ | C | - | 145.1 | - | 144.0 g |
| 5″ | CH | 6.70, d, 8.1 | 116.3 | 6.80, d, 8.1 | 116.4 |
| 6″ | CH | 6.66, dd, 8.1, 1.8 | 121.7 | 6.74, dd, 8.1, 1.8 | 121.7 |
| 7″ | CH2 | 2.95, dd, 14.3, 10.0 | 38.9 | 2.96, dd, 14.3, 10.0 | 37.9 |
| 3.12, dd, 14.3, 3.2 | 3.13, dd, 14.3, 3.4 | ||||
| 8″ | CH | 5.11, dd, 10.0, 3.2 | 77.9 | 5.04, dd, 10.0, 3.4 | 77.3 |
| 9″ | C | - | 176.9 | - | 177.5 |
| Standard Compound | tR | [M − H]− m/z | Error (ppm) | MS/MS m/z | R2 | Working Range (µg/mL) | LOD (ng/mL) | LOQ (ng/mL) | QC (µg/mL) | Precision (% RSD) | Accuracy (%) | ||
|---|---|---|---|---|---|---|---|---|---|---|---|---|---|
| Intra-Day | Inter-Day | Intra-Day | Inter-Day | ||||||||||
| 0.250 | 10.8 | 9.1 | 98.4 | 96.7 | |||||||||
| Caffeic acid | 1.03 | 179.03443 | 1.90 | 135.04 | 0.9976 | 0.250–10 | 43.7 | 132.6 | 1 | 7.6 | 6.4 | 100.7 | 109.8 |
| 10 | 4.9 | 6.5 | 94.1 | 106.4 | |||||||||
| 0.125 | 7.8 | 7.7 | 94.0 | 96.2 | |||||||||
| Luteolin-7-rutinoside | 1.56 | 593.15064 | 2.26 | 285.04 | 0.9977 | 0.125–10 | 29.8 | 90.4 | 1 | 5.4 | 6.4 | 100.0 | 101.8 |
| 10 | 2.9 | 4.4 | 100.9 | 99.5 | |||||||||
| 0.125 | 2.8 | 4.7 | 96.3 | 99.4 | |||||||||
| Luteolin-7-glucoside | 1.64 | 447.09273 | 1.81 | 285.04 | 0.9960 | 0.125–5 | 17.0 | 35.5 | 1 | 2.4 | 2.4 | 115.0 | 116.0 |
| 5 | 2.5 | 2.7 | 105.5 | 106.6 | |||||||||
| Luteolin-7-glucuronide | 0.125 | 10.8 | 9.6 | 96.3 | 94.8 | ||||||||
| 1.67 | 461.07200 | 1.84 | 285.04 | 0.9983 | 0.125–5 | 39.8 | 120.7 | 1 | 7.9 | 8.0 | 98.8 | 107.6 | |
| 5 | 4.4 | 7.0 | 94.1 | 108.4 | |||||||||
| 0.125 | 3.9 | 5.8 | 90.3 | 94.0 | |||||||||
| Naringin | 1.85 | 579.17138 | 1.48 | 151.00 | 0.9981 | 0.125–10 | 6.1 | 18.3 | 1 | 4.3 | 4.1 | 99.7 | 101.4 |
| 10 | 6.2 | 6.9 | 97.8 | 101.3 | |||||||||
| 0.125 | 5.6 | 7.0 | 85.5 | 89.5 | |||||||||
| Hesperidin | 1.95 | 609.18194 | 0.61 | 301.07 | 0.9973 | 0.125–5 | 3.3 | 10.1 | 1 | 4.4 | 4.6 | 104.7 | 107.0 |
| 5 | 3.9 | 6.1 | 101.3 | 104.5 | |||||||||
| 0.125 | 2.0 | 3.3 | 87.4 | 88.6 | |||||||||
| Apigenin-7-glucoside | 1.99 | 431.09782 | 0.74 | 268.04 | 0.9984 | 0.125–5 | 25.1 | 76.2 | 1 | 2.4 | 2.1 | 108.6 | 109.1 |
| 5 | 2.6 | 3.3 | 107.8 | 109.5 | |||||||||
| 0.125 | 3.2 | 5.9 | 90.1 | 94.0 | |||||||||
| Diosmin | 2.01 | 607.16629 | 1.35 | 299.06 | 0.9993 | 0.125–5 | 4.7 | 14.4 | 1 | 4.7 | 4.8 | 106.9 | 109.4 |
| 5 | 3.1 | 4.5 | 104.1 | 107.0 | |||||||||
| 0.125 | 1.2 | 5.2 | 89.1 | 92.7 | |||||||||
| Rosmarinic acid | 2.08 | 359.07669 | 1.86 | 161.02 | 0.9978 | 0.125–10 | 6.3 | 19.0 | 1 | 2.7 | 2.6 | 104.3 | 105.6 |
| 10 | 3.9 | 4.2 | 101.7 | 103.4 | |||||||||
| 0.250 | 6.3 | 10.3 | 100.3 | 99.8 | |||||||||
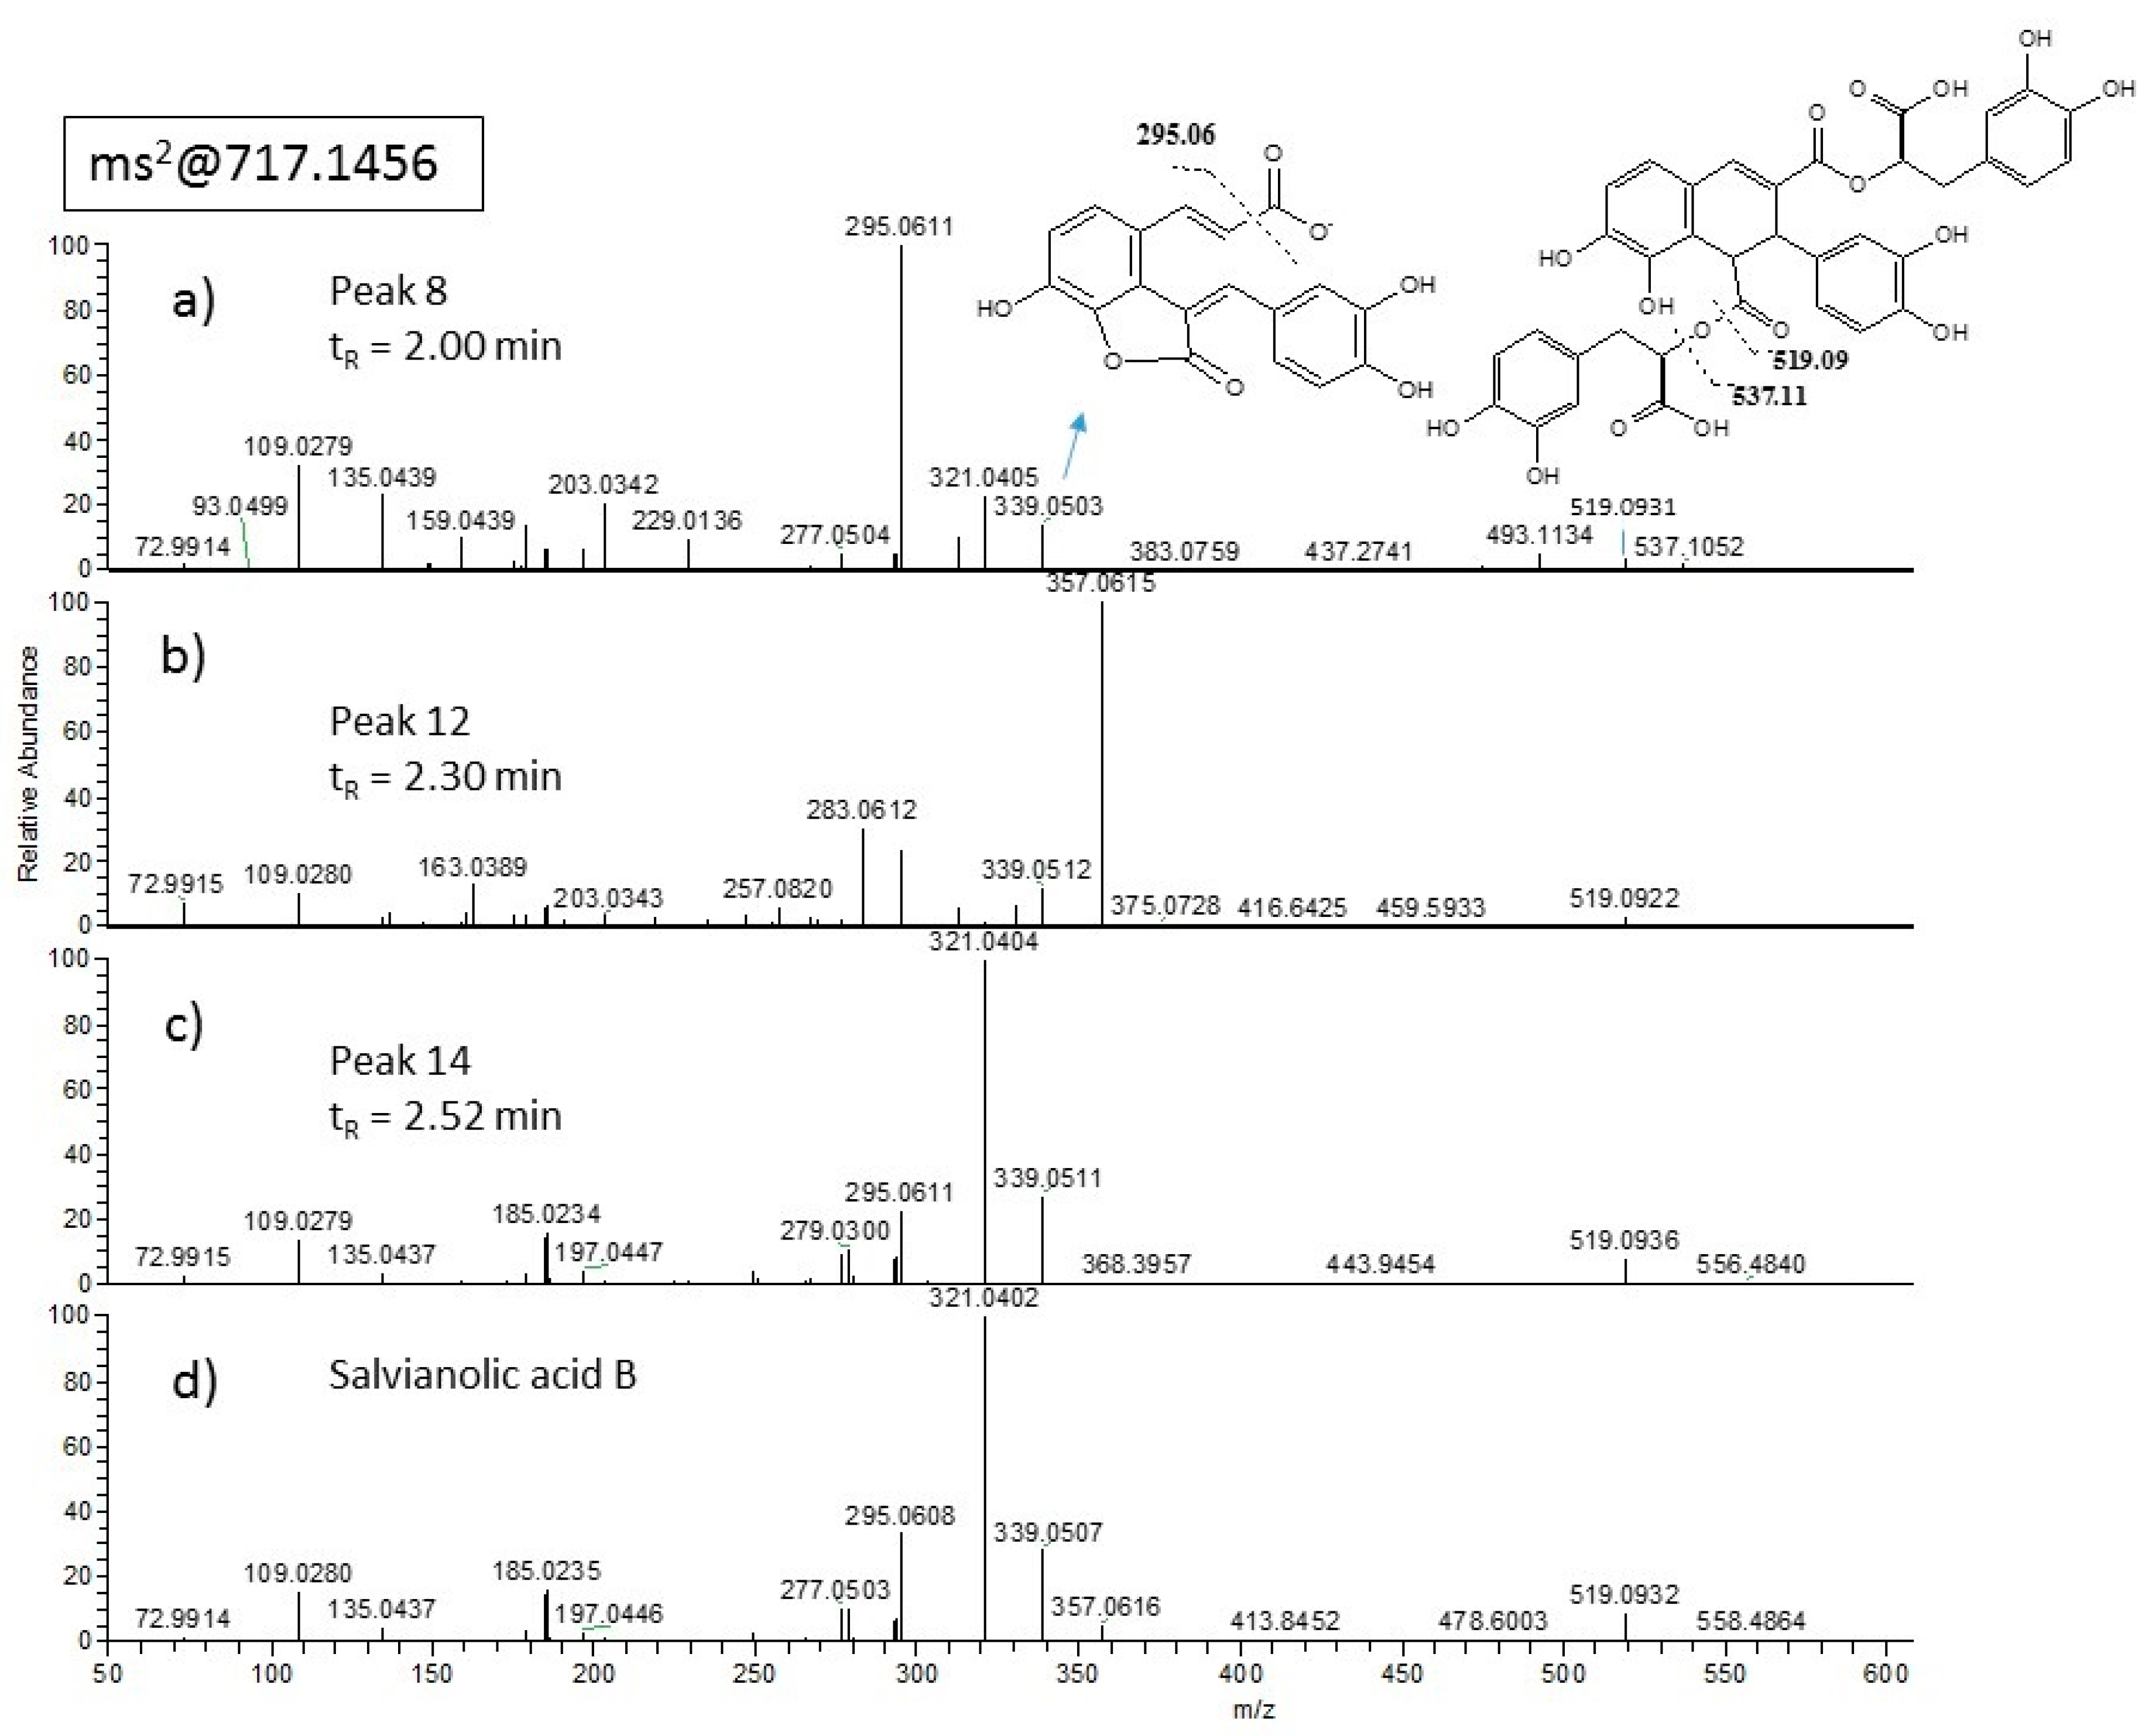
| Salvianolic acid B | 2.49 | 717.14555 | 2.24 | 321.04 | 0.9989 | 0.250–10 | 75.5 | 229.0 | 1 | 12.7 | 14.3 | 93.4 | 93.5 |
| 10 | 12.2 | 14.9 | 100.8 | 101.9 | |||||||||
| 0.125 | 9.4 | 13.8 | 94.0 | 95.3 | |||||||||
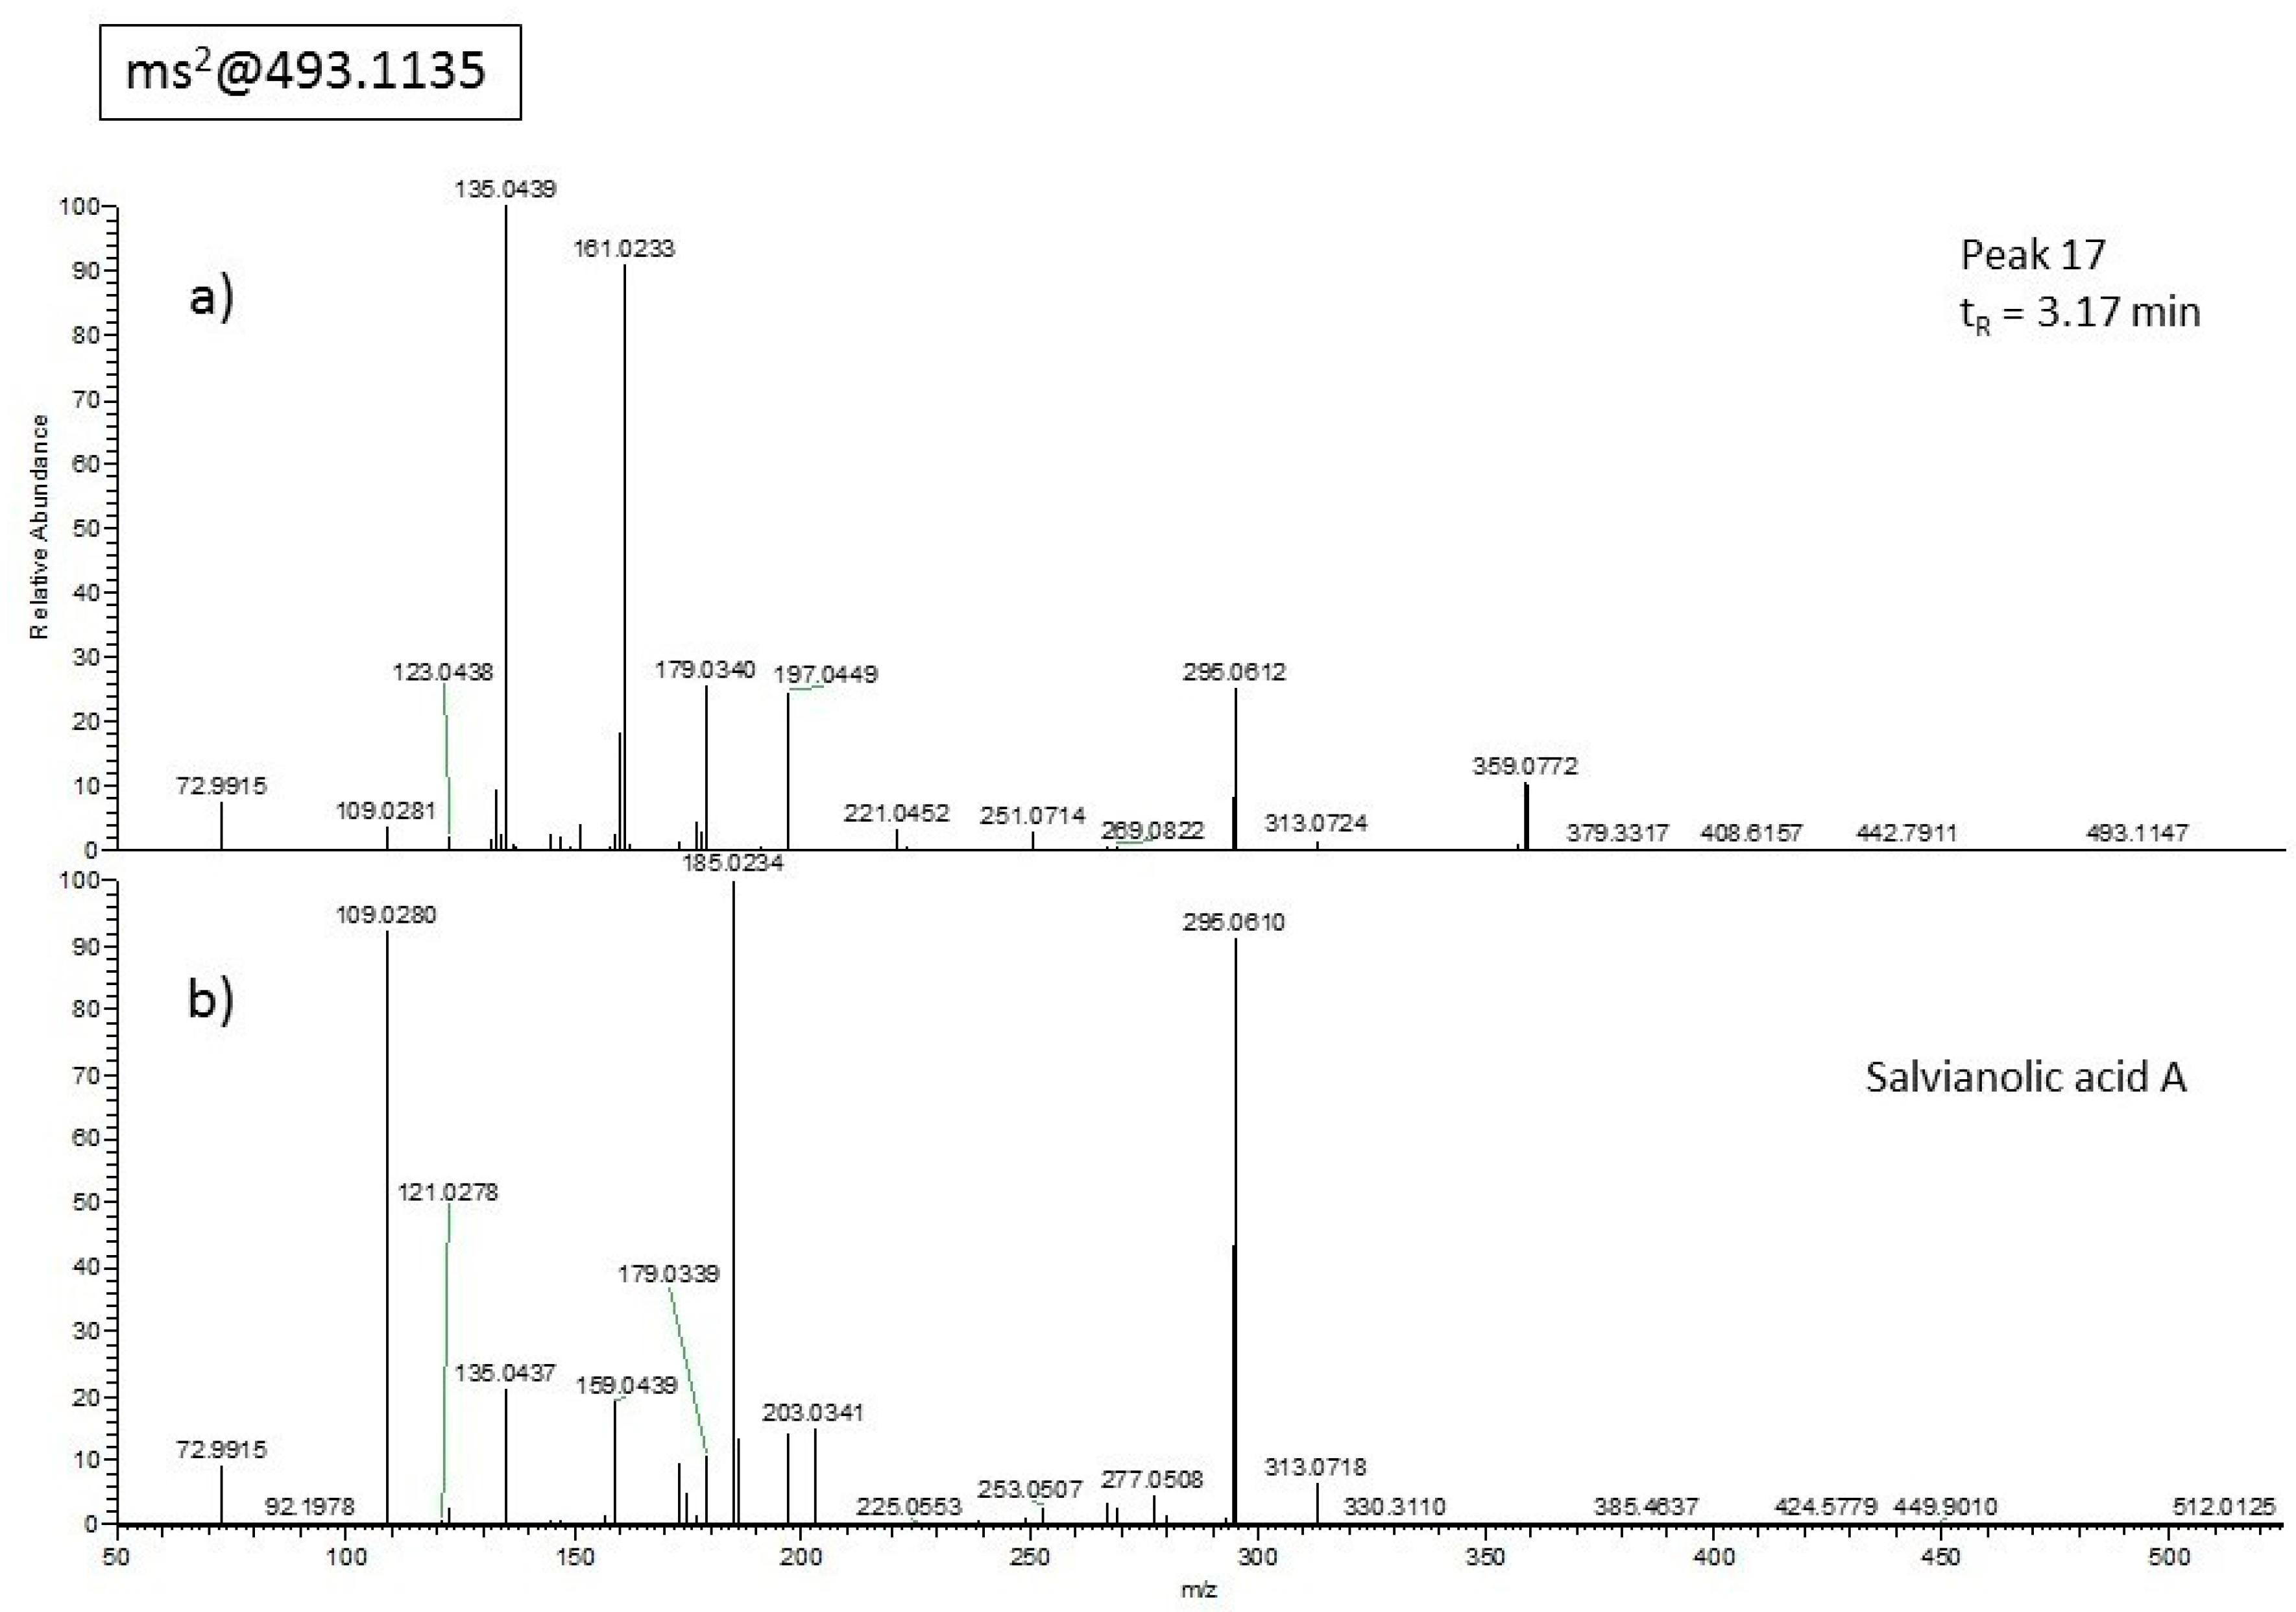
| Salvianolic acid A | 2.86 | 493.11347 | 2.33 | 185.02 | 0.9977 | 0.125–10 | 11.3 | 34.2 | 1 | 11.8 | 14.1 | 86.9 | 89.8 |
| 10 | 7.3 | 14.7 | 103.4 | 105.8 | |||||||||
| 0.250 | 12.2 | 11.0 | 100.1 | 95.2 | |||||||||
| Luteolin | 3.03 | 285.03991 | 1.96 | 133.03 | 0.9966 | 0.250–5 | 47.0 | 142.6 | 1 | 9.6 | 7.5 | 105.1 | 113.9 |
| 5 | 5.9 | 5.9 | 94.4 | 106.6 | |||||||||
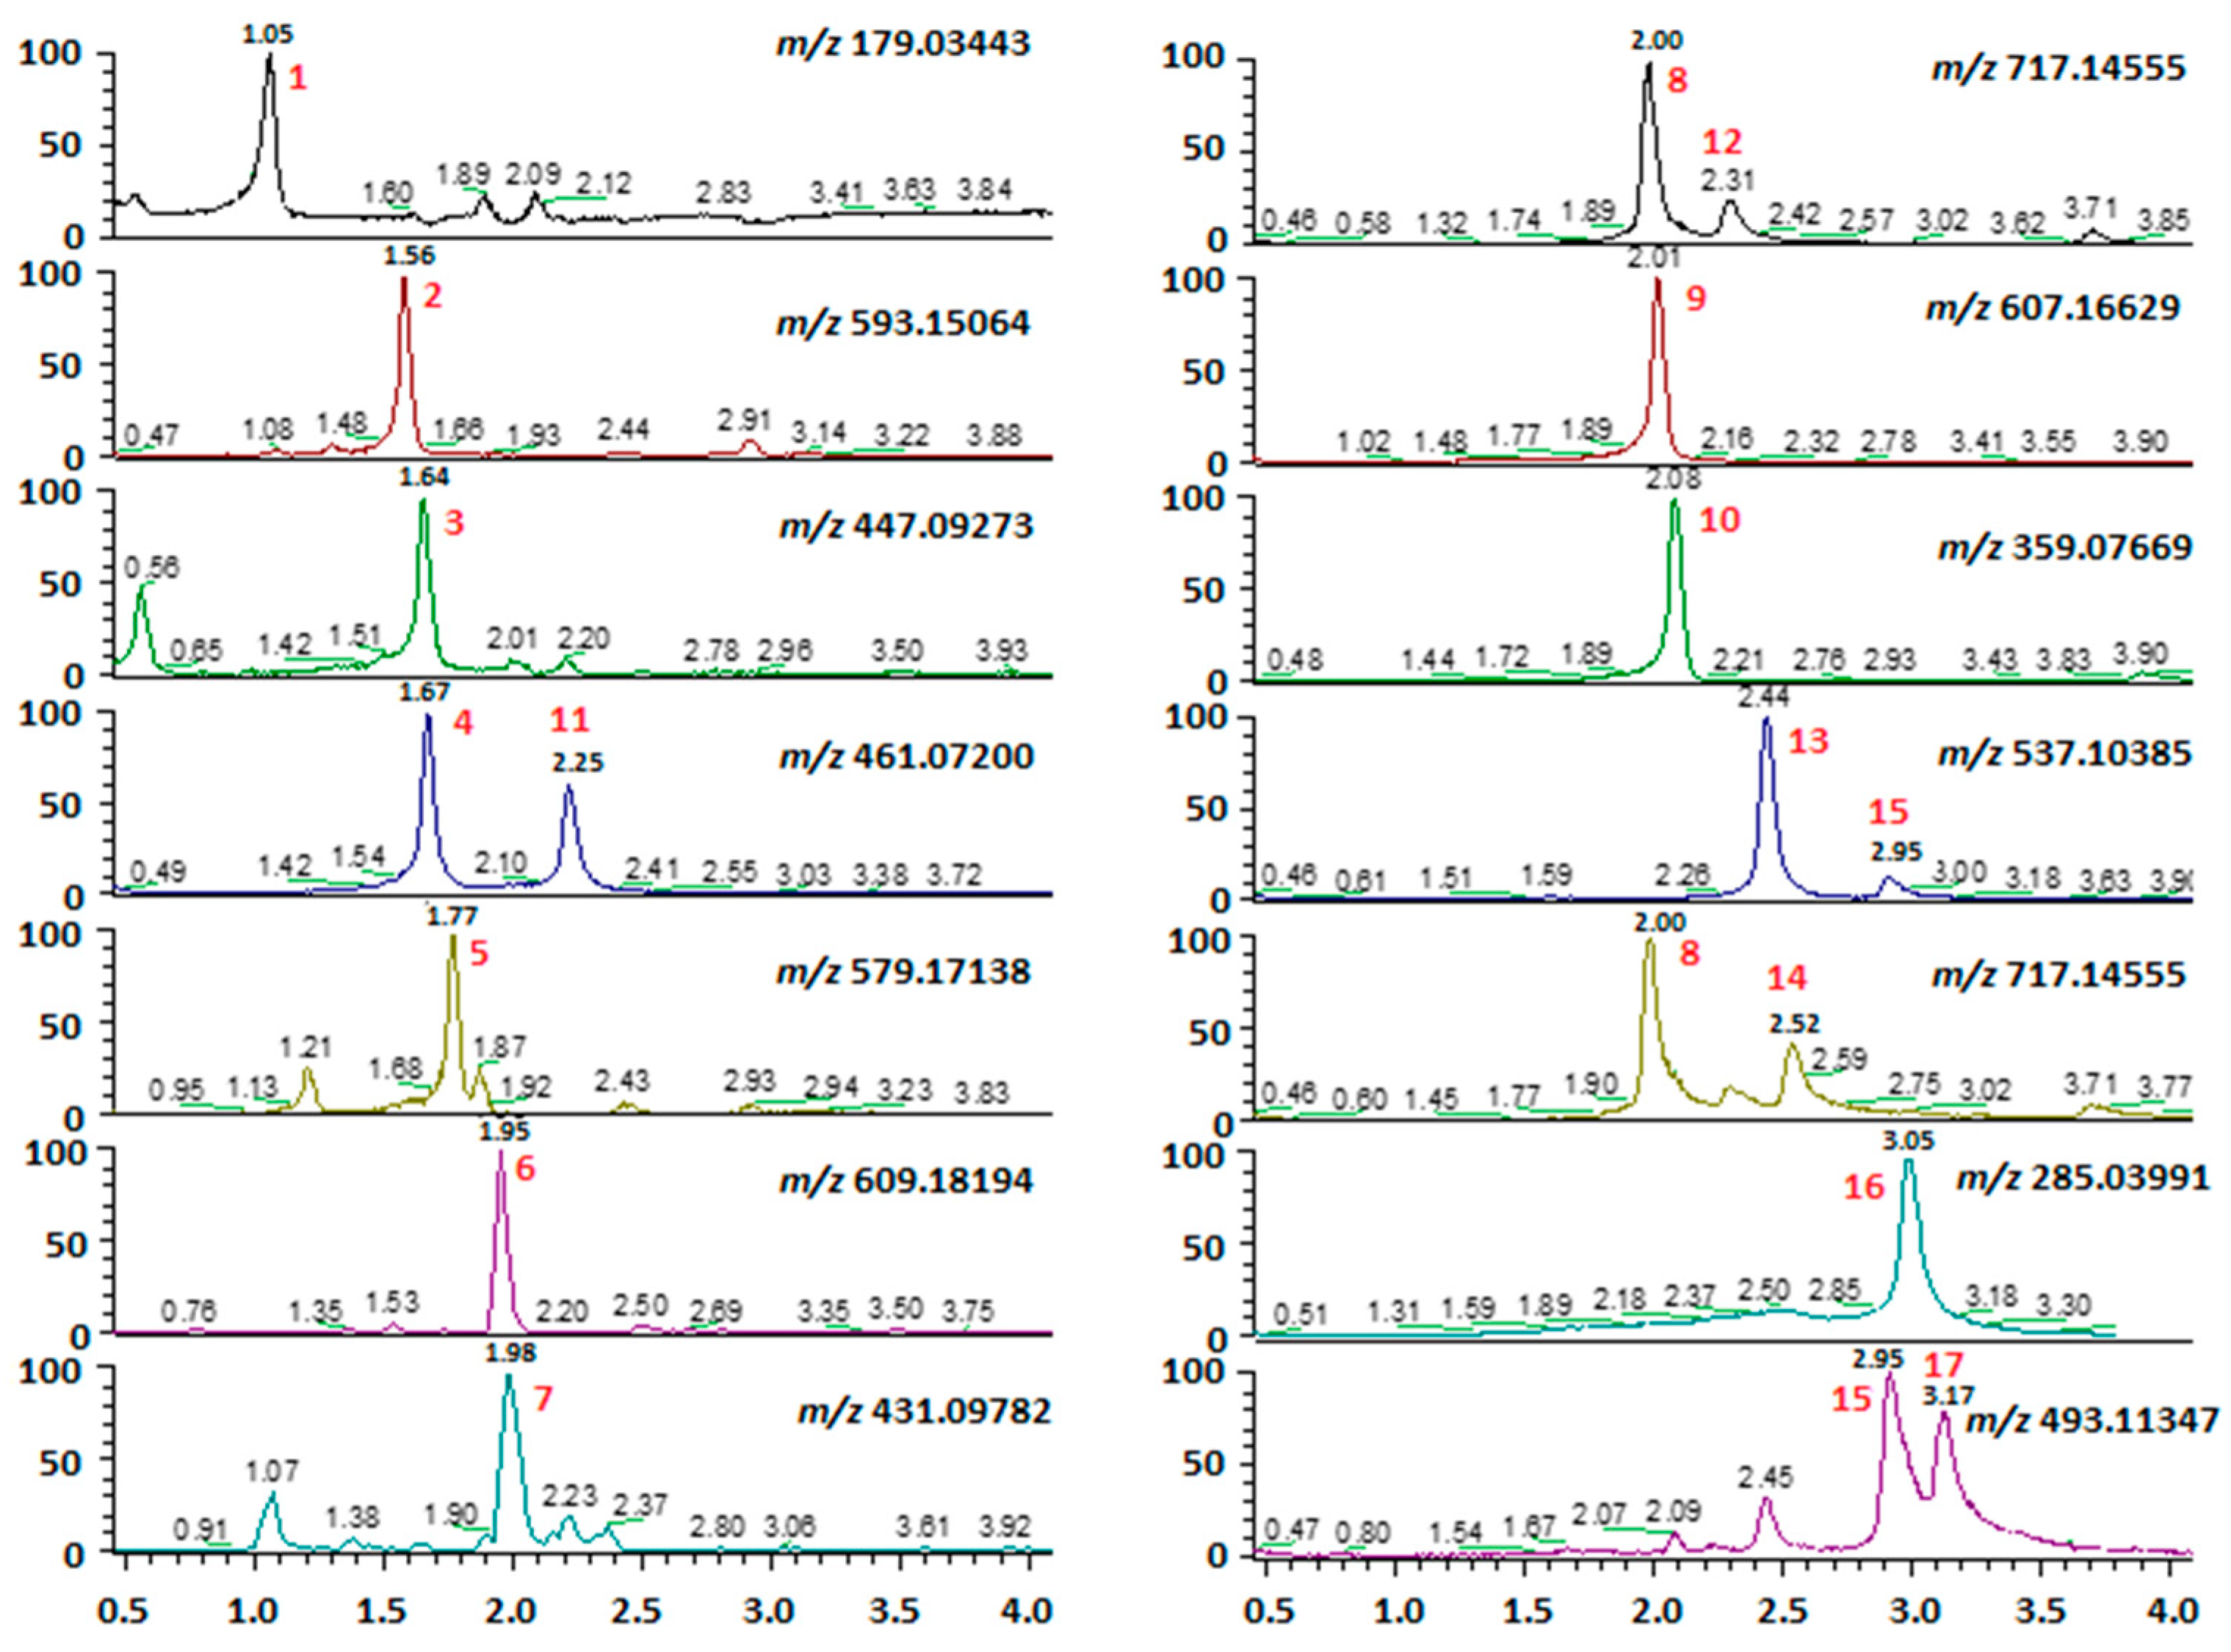
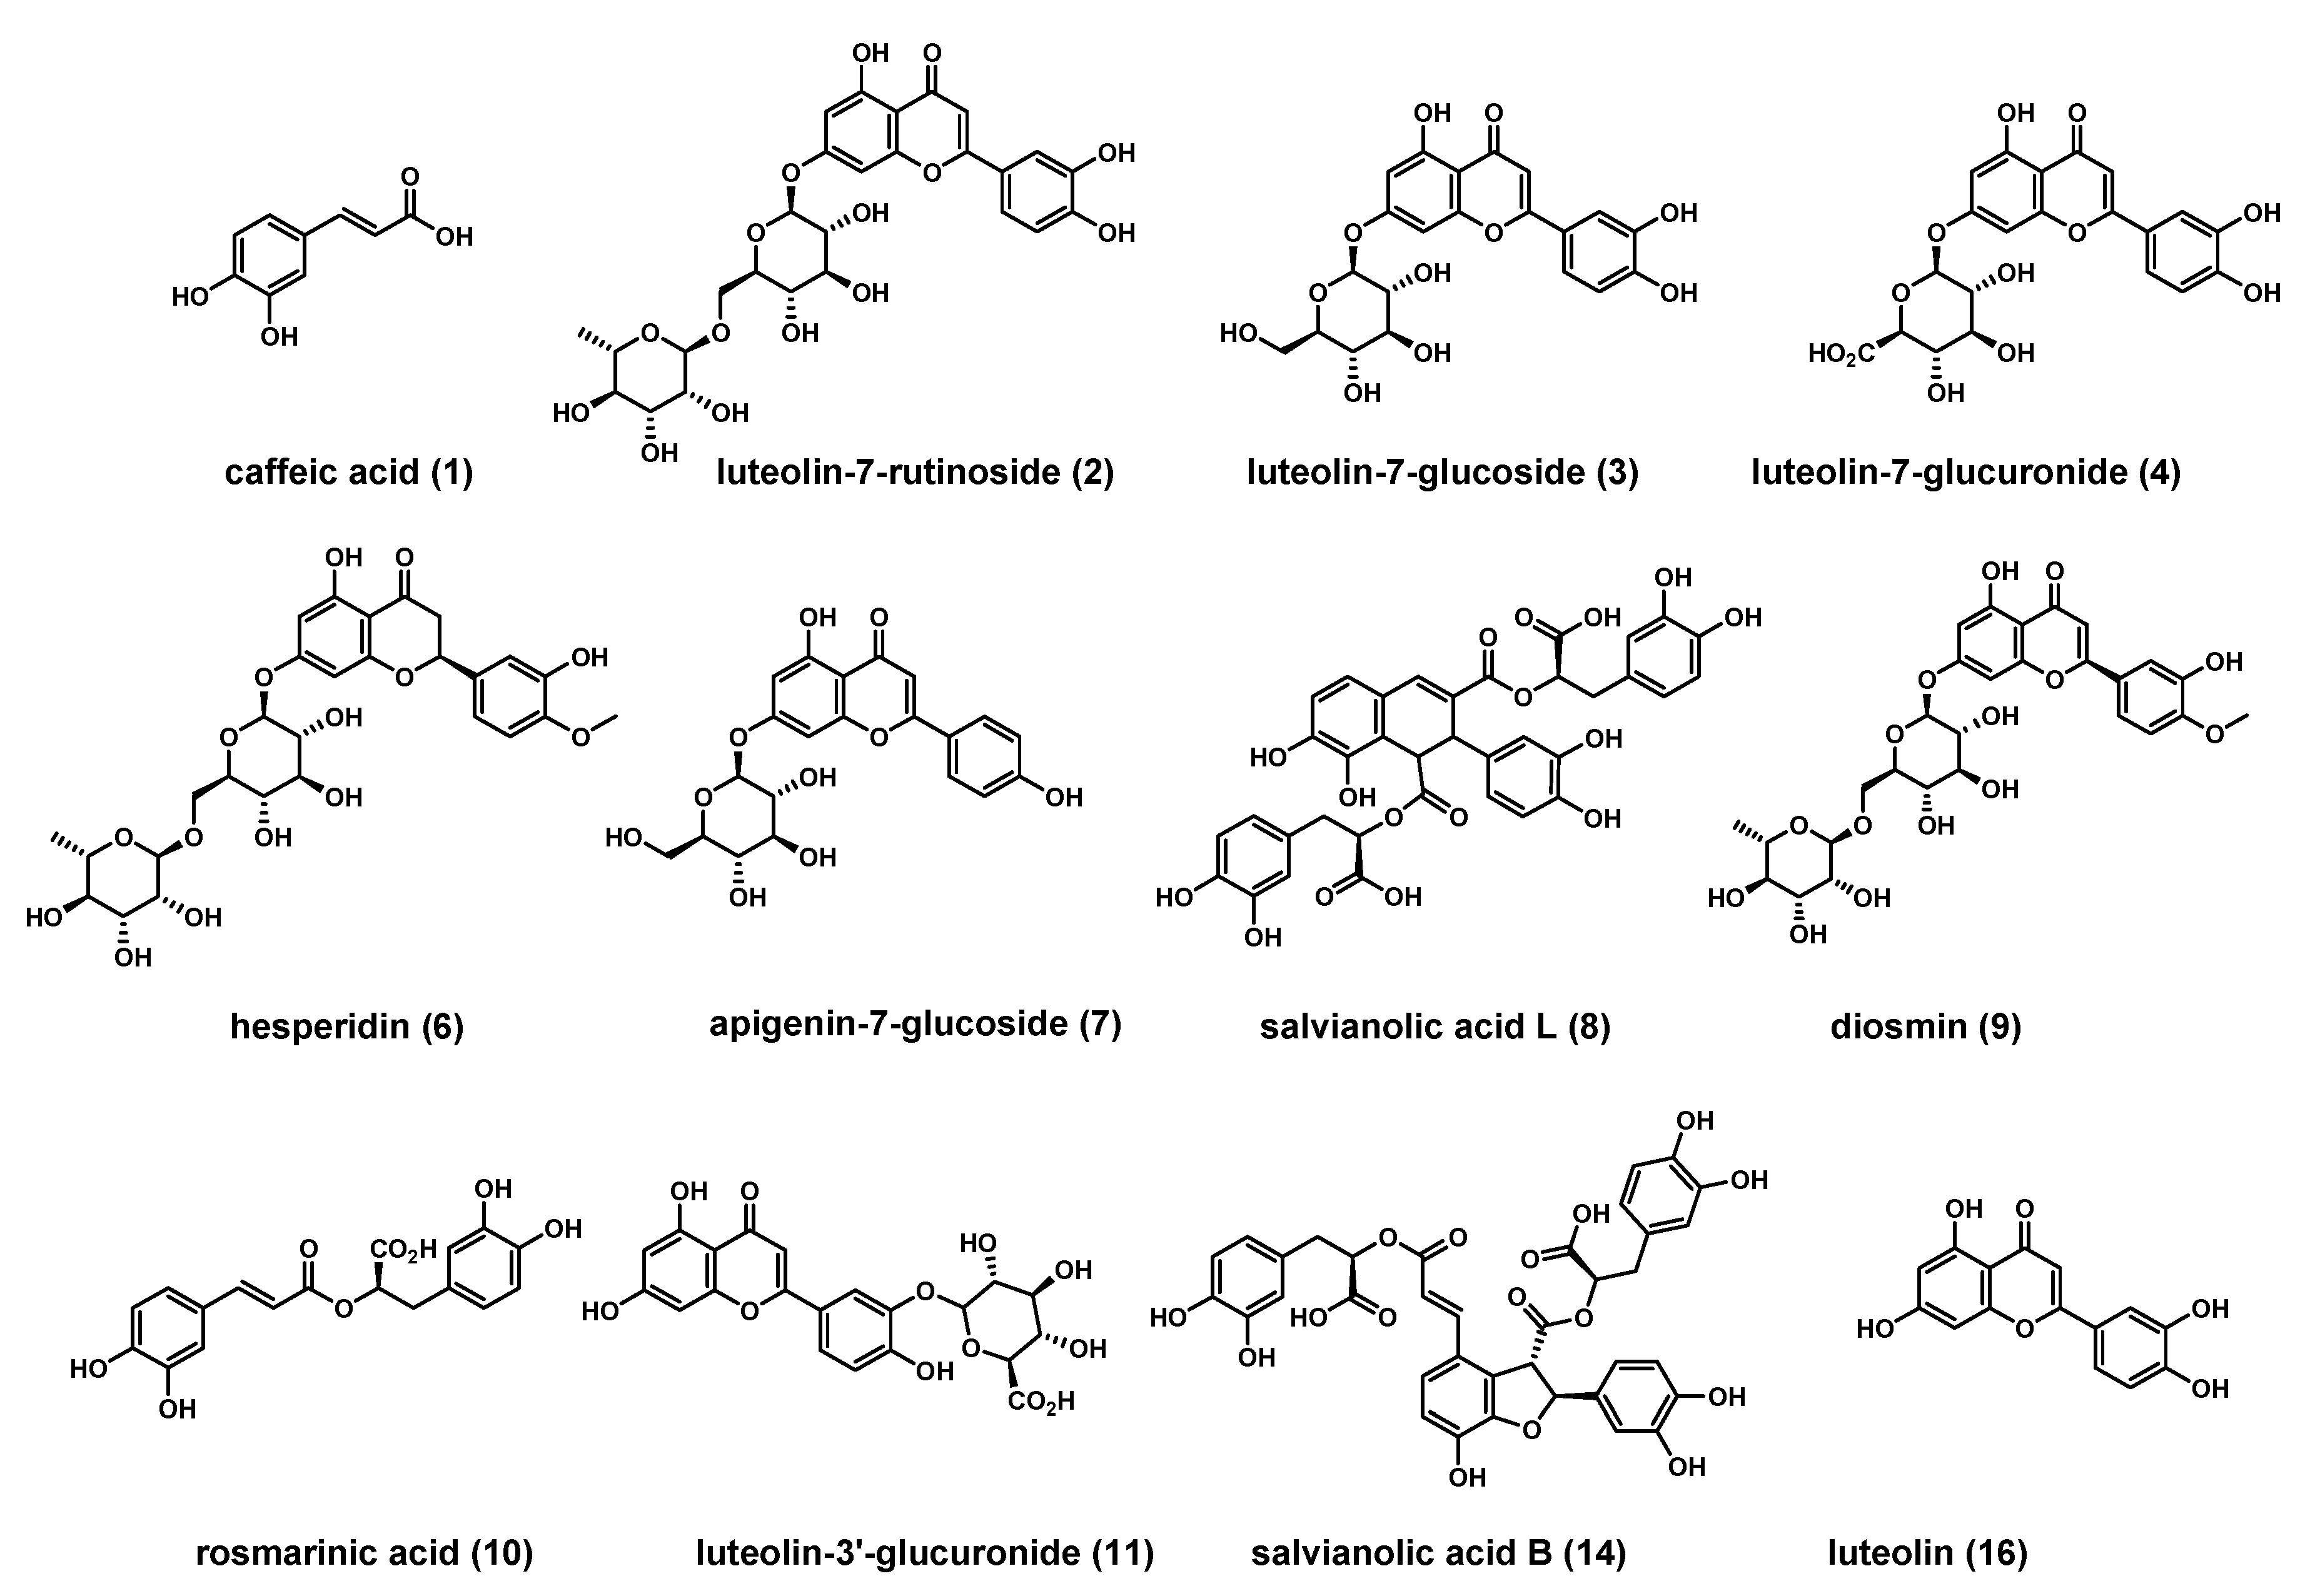
| Peak | Compound | tR | [M − H]− m/z | MS/MS m/z | MROT-1 | MROT-2 | MROT-3 | MROT-4 | MROT-5 | MROT-6 | MROT-7 | MROT-8 | MROT-9 | MROT-10 |
|---|---|---|---|---|---|---|---|---|---|---|---|---|---|---|
| 1 | Caffeic acid | 1.05 | 179.03443 | 135.04 | 1.21 ± 0.01 | 1.16 ± 0.10 | 0.13 ± 0.05 | 0.60 ± 0.09 | 0.96 ± 0.14 | 0.94 ± 0.01 | 1.38 ± 0.16 | 0.85 ± 0.14 | 0.70 ± 0.12 | 0.38 ± 0.02 |
| 2 | Luteolin-7-rutinoside | 1.56 | 593.15064 | 285.04 | 2.67 ± 0.68 | 6.87 ± 0.69 | - | 0.79 ± 0.10 | 1.84 ± 0.15 | 1.86 ± 0.21 | 8.02 ± 0.47 | 2.05 ± 0.03 | 1.62 ± 0.26 | 1.36 ± 0.02 |
| 3 | Luteolin-7-glucoside | 1.64 | 447.09273 | 285.04 | 3.84 ± 0.49 | 4.60 ± 0.24 | - | 0.53 ± 0.06 | 2.39 ± 0.30 | 1.62 ± 0.02 | 3.66 ± 0.78 | 1.23 ± 0.20 | 0.64 ± 0.03 | 0.57 ± 0.01 |
| 4 | Luteolin-7-glucuronide | 1.67 | 461.07200 | 285.04 | 26.34 ± 7.88 | 22.71 ± 2.10 | 1.91 ± 0.63 | 5.16 ± 0.94 | 8.73 ± 0.40 | 15.26 ± 1.91 | 9.71 ± 3.49 | 4.39 ± 0.74 | 1.75 ± 0.17 | 1.81 ± 0.16 |
| 5 | Isonaringin | 1.77 | 579.17138 | 271.06 | 0.25 ± 0.03 | - | - | 0.48 ± 0.14 | - | - | 0.67 ± 0.02 | - | - | - |
| 6 | Hesperidin | 1.95 | 609.18194 | 301.07 | 2.05 ± 0.15 | - | 9.54 ± 2.29 | 10.00 ± 3.46 | 3.58 ± 0.93 | - | - | - | - | - |
| 7 | Apigenin-7-glucoside | 1.98 | 431.09782 | 268.04 | 0.70 ± 0.03 | 0.67 ± 0.03 | - | - | 0.23 ± 0.02 | 0.21 ± 0.01 | - | - | - | - |
| 8 | Salvianolic acid L | 2.00 | 717.14555 | 295.06 | 276.44 ± 91.65 | 103.72 ± 2.17 | 2.02 ± 0.89 | 23.70 ± 4.69 | 66.31 ± 4.06 | 74.05 ± 8.68 | 29.92 ± 5.02 | 14.82 ± 3.44 | 6.27 ± 1.03 | 10.86 ± 0.51 |
| 9 | Diosmin | 2.02 | 607.16629 | 299.06 | - | 1.70 ± 0.68 | 3.95 ± 0.37 | - | - | - | - | - | - | - |
| 10 | Rosmarinic acid | 2.08 | 359.07669 | 161.02 | 116.15 ± 6.57 | 65.65 ± 0.39 | 6.53 ± 1.46 | 29.00 ± 0.99 | 68.99 ± 11.16 | 87.89 ± 8.52 | 54.51 ± 9.72 | 37.68 ± 4.82 | 50.21 ± 6.35 | 23.97 ± 1.15 |
| 11 | Luteolin-3’-glucuronide | 2.25 | 461.07200 | 285.04 | 42.59 ± 15.06 | 37.43 ± 1.05 | 3.50 ± 0.34 | 8.40 ± 1.32 | 15.62 ± 0.82 | 32.44 ± 3.36 | 16.59 ± 5.55 | 7.61 ± 1.28 | 3.61 ± 0.31 | 4.31 ± 0.28 |
| 12 | Isosalvianolic acid B | 2.30 | 717.14555 | 357.06 | 61.10 ± 24.35 | - | - | - | - | 21.75 ± 0.70 | - | - | - | 2.35 ± 0.19 |
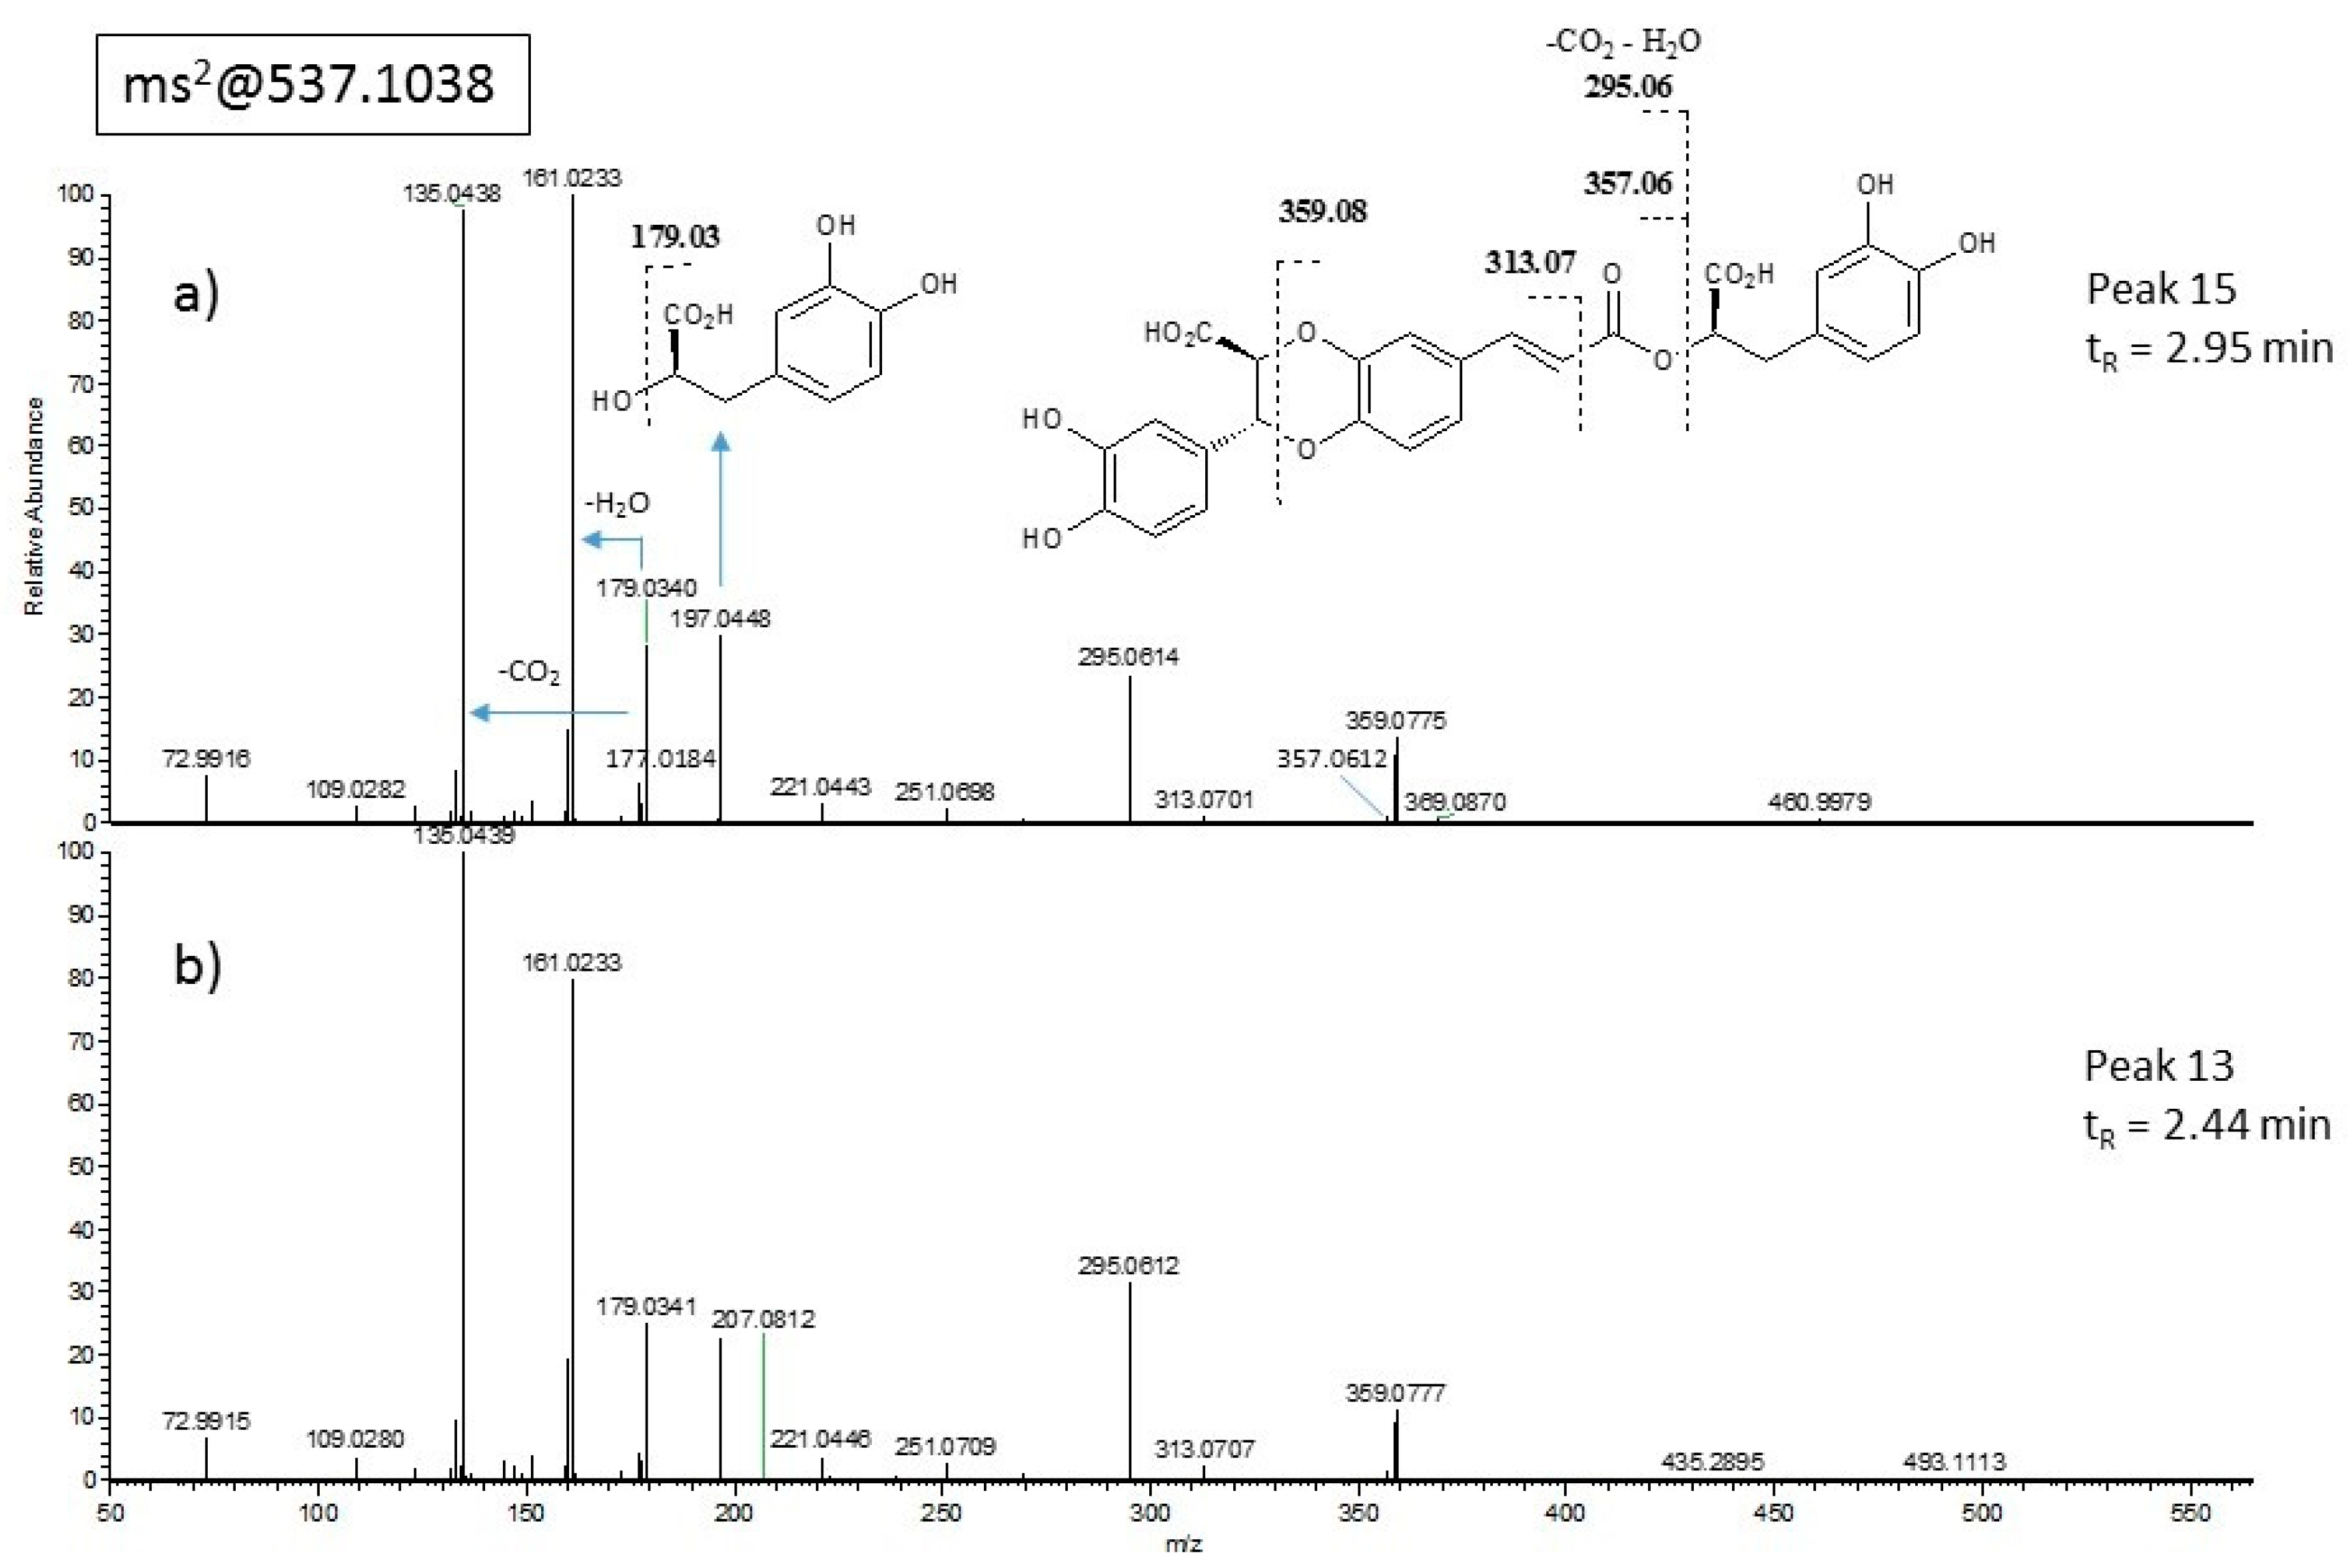
| 13 | Isosalvianolic acid W | 2.44 | 537.10385 | 135.04 | 28.23 ± 8.89 | 3.24 ± 0.01 | - | 2.27 ± 0.53 | 9.95 ± 0.57 | 7.80 ± 0.22 | 5.19 ± 2.25 | 2.68 ± 0.47 | 3.98 ± 0.37 | 3.37 ± 0.0.01 |
| 14 | Salvianolic acid B | 2.52 | 717.14555 | 321.04 | - | 10.07 ± 2.97 | 1.32 ± 0.37 | 2.06 ± 0.08 | 5.22 ± 0.92 | - | 0.27 ± 0.01 | 0.50 ± 0.04 | 1.55 ± 0.01 | - |
| 15 | Salvianolic acid W | 2.95 | 537.10385 | 161.02 | 71.34 ± 15.14 | 10.28 ± 0.97 | 2.05 ± 0.43 | 8.83 ± 0.66 | 25.91 ± 0.38 | 21.89 ± 1.04 | 5.99 ± 1.99 | 1.92 ± 0.22 | 2.57 ± 0.24 | 2.62 ± 0.27 |
| 16 | Luteolin | 3.05 | 285.03991 | 133.03 | 2.25 ± 0.03 | 4.78 ± 0.44 | 4.91 ± 0.19 | 4.01 ± 0.33 | 3.01 ± 0.60 | 0.76 ± 0.25 | 3.68 ± 0.27 | 1.53 ± 0.12 | 0.10 ± 0.02 | 0.36 ± 0.04 |
| 17 | Isosalvianolic acid A | 3.17 | 493.11347 | 135.04 | 18.27 ± 3.30 | 2.96 ± 0.11 | 1.24 ± 0.17 | 2.98 ± 0.09 | 7.12 ± 0.97 | 3.74 ± 0.01 | 2.78 ± 0.90 | 1.31 ± 0.17 | 1.83 ± 0.48 | 0.92 ± 0.04 |
| DPPH | β-carotene | FRAP | AChE | |
|---|---|---|---|---|
| Polyphenols | −0.70 ** | −0.36 * | 0.45 * | −0.21 ns |
| Flavonoids | −0.73 ** | 0.14 ns | 0.34 * | −0.43 * |
| Phenolic acids | ||||
| Caffeic acid | −0.48 * | −0.32 * | 0.14 ns | −0.22 ns |
| Salvianolic acid L | −0.56 ** | −0.49 * | 0.30 * | −0.15 ns |
| Rosmarinic acid | −0.47 * | −0.49 * | 0.07 ns | −0.16 ns |
| Isosalvianolic acid B | −0.41 * | −0.51 ** | 0.31 * | 0.06 ns |
| Isosalvianolic acid W | −0.51 ** | −0.30 * | 0,41 * | −0.03 ns |
| Salvianolic acid B | −0.12 ns | −0.03 ns | −0.30 * | −0.49 ** |
| Salvianolic acid W | −0.58 ** | −0.31 * | 0.34 * | −0.16 ns |
| Isosalvianolic acid A | −0.61 ** | −0.21 ns | 0.41 * | −0.19 ns |
| Flavonoids | ||||
| Luteolin | −0.37 * | 0.29 ns | −0.12 ns | −0.65 ** |
| Luteolin-7-rutinoside | −0.25 ns | −0.26 ns | 0.002 ns | −0.07 ns |
| Luteolin-7-glucoside | −0.45 * | −0.39 * | 0.07 ns | −0.23 ns |
| Luteolin-7-glucuronide | −0.51 ** | −0.61 ** | 0.05 ns | −0.24 ns |
| Luteolin-3’-glucuronide | −0.45 * | −0.65 ** | −0.02 ns | −0.20 ns |
| Apigenin-7-glucoside | −0.40 * | −0.58 ** | 0.03 ns | −0.23 ns |
| Diosmin | 0.26 ns | 0.11 ns | −0.54 ** | −0.36 * |
| Isonaringin | −0.65 ** | 0.30 * | 0.53 ** | −0.09 ns |
| Hesperidin | −0.25 ns | 0.56 ** | −0.004 ns | −0.48 * |
© 2019 by the authors. Licensee MDPI, Basel, Switzerland. This article is an open access article distributed under the terms and conditions of the Creative Commons Attribution (CC BY) license (http://creativecommons.org/licenses/by/4.0/).
Share and Cite
Ben Haj Yahia, I.; Zaouali, Y.; Ciavatta, M.L.; Ligresti, A.; Jaouadi, R.; Boussaid, M.; Cutignano, A. Polyphenolic Profiling, Quantitative Assessment and Biological Activities of Tunisian Native Mentha rotundifolia (L.) Huds. Molecules 2019, 24, 2351. https://doi.org/10.3390/molecules24132351
Ben Haj Yahia I, Zaouali Y, Ciavatta ML, Ligresti A, Jaouadi R, Boussaid M, Cutignano A. Polyphenolic Profiling, Quantitative Assessment and Biological Activities of Tunisian Native Mentha rotundifolia (L.) Huds. Molecules. 2019; 24(13):2351. https://doi.org/10.3390/molecules24132351
Chicago/Turabian StyleBen Haj Yahia, Imen, Yosr Zaouali, Maria Letizia Ciavatta, Alessia Ligresti, Rym Jaouadi, Mohamed Boussaid, and Adele Cutignano. 2019. "Polyphenolic Profiling, Quantitative Assessment and Biological Activities of Tunisian Native Mentha rotundifolia (L.) Huds." Molecules 24, no. 13: 2351. https://doi.org/10.3390/molecules24132351