
Attenuated Total Reflection-Fourier Transform Infrared Spectroscopy (ATR-FTIR) Combined with Chemometrics Methods for the Classification of Lingzhi Species


Abstract
: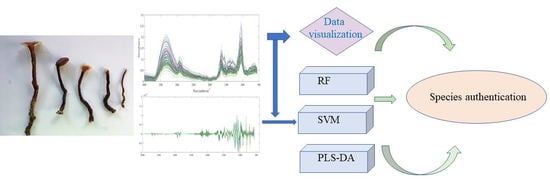
1. Introduction
2. Results and Discussion
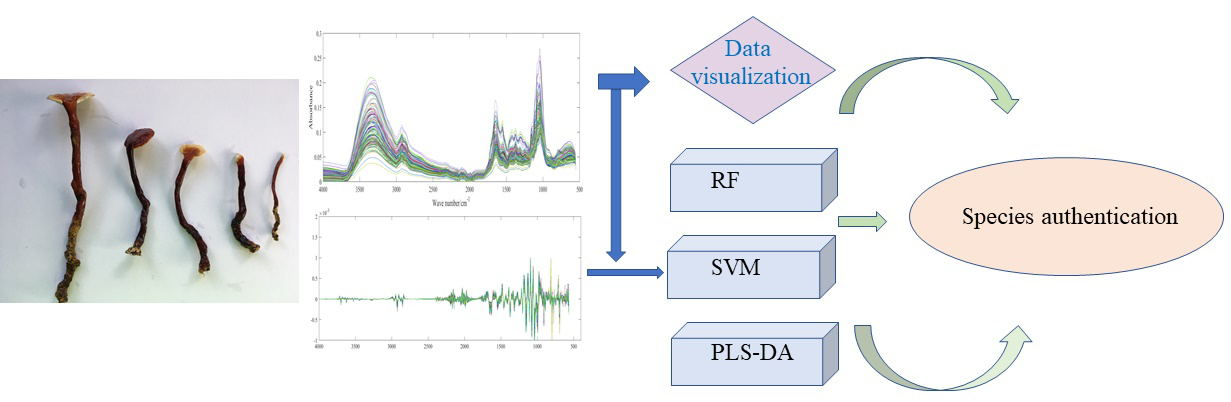
2.1. ATR-FTIR and Pretreatment Spectra Analysis
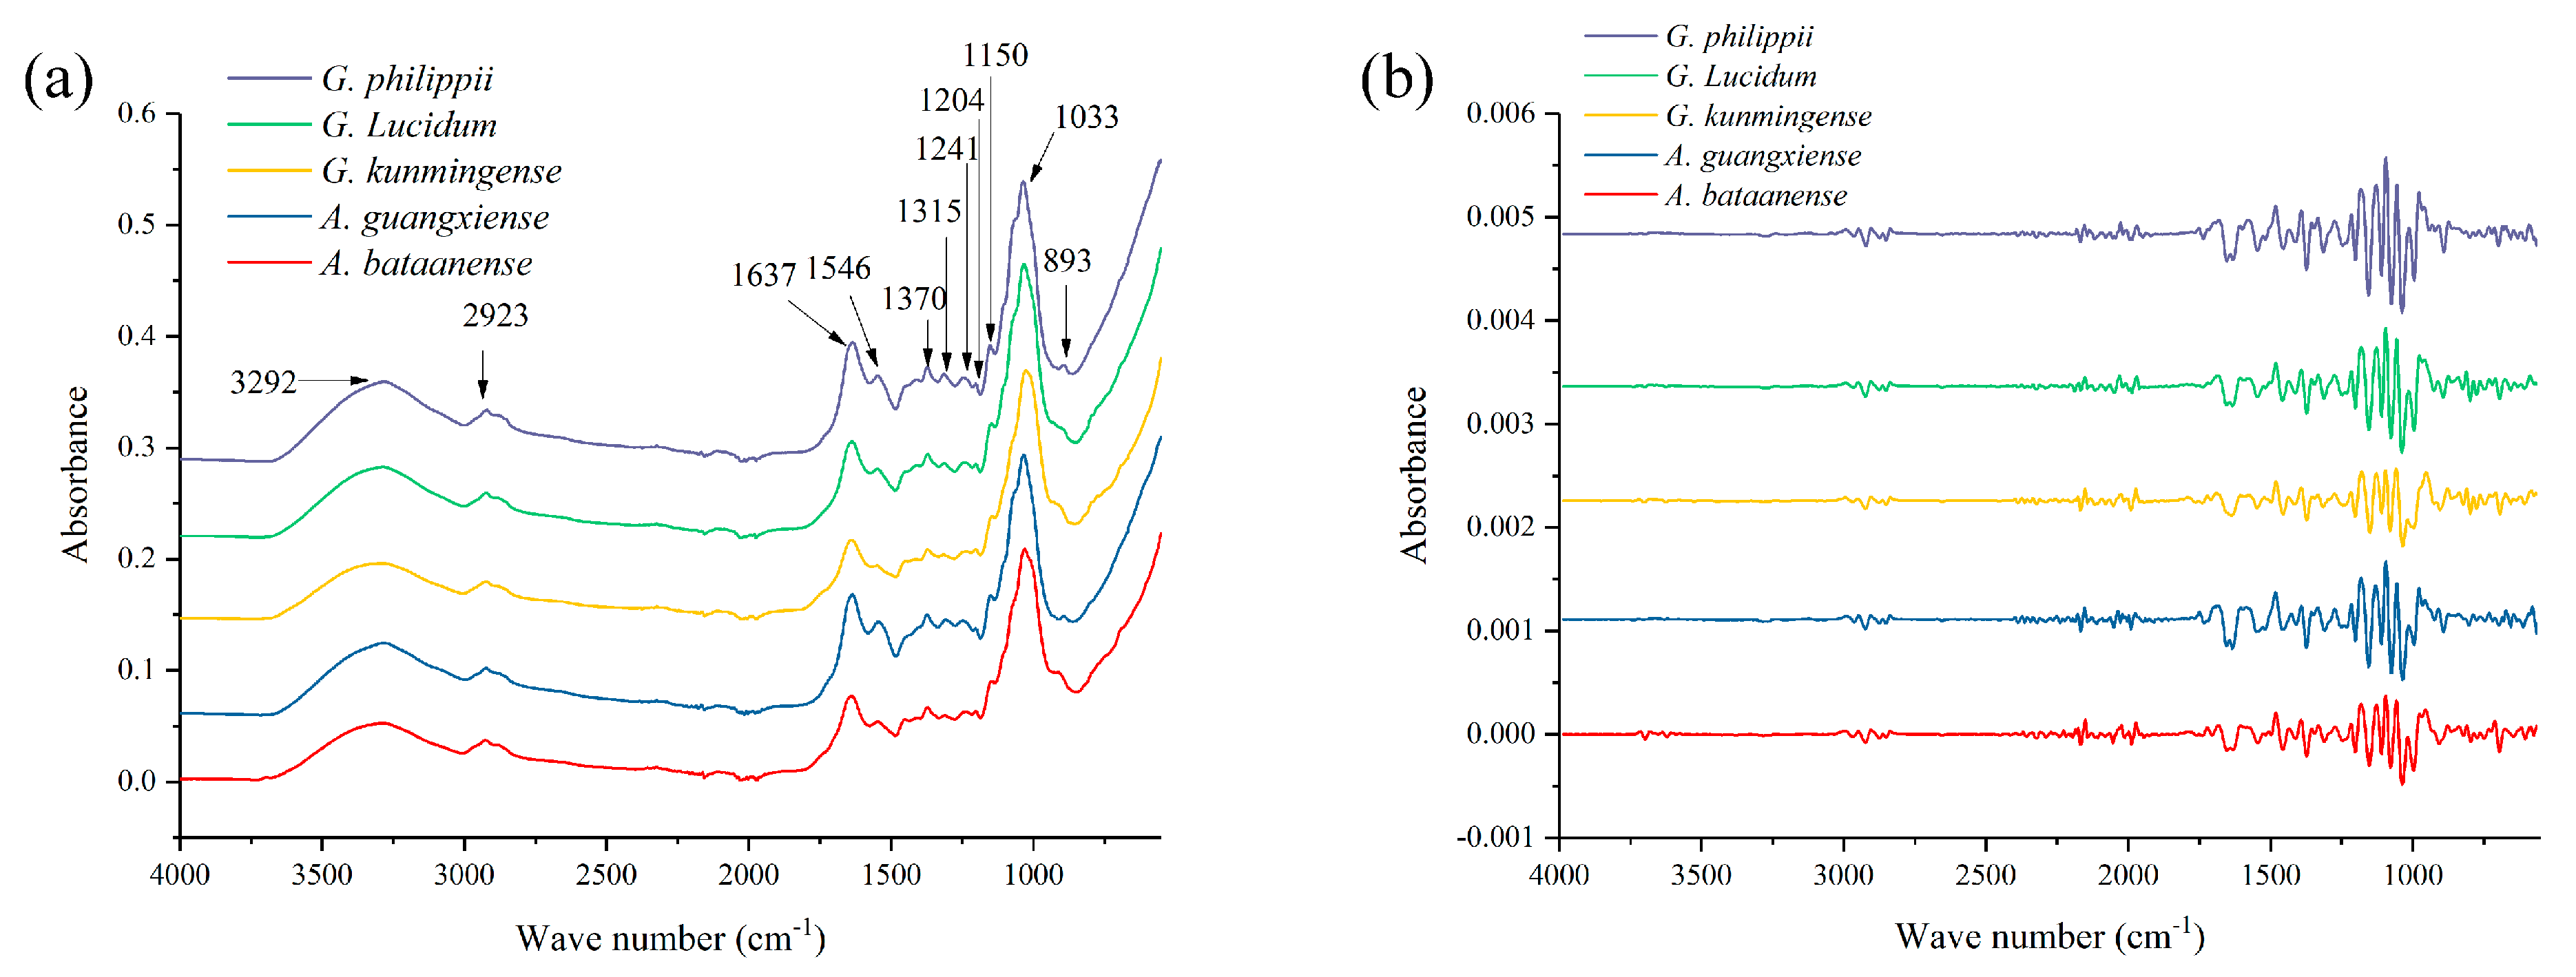
2.2. Data Visualization
2.3. Different Models Established Using ATR-FTIR Spectra
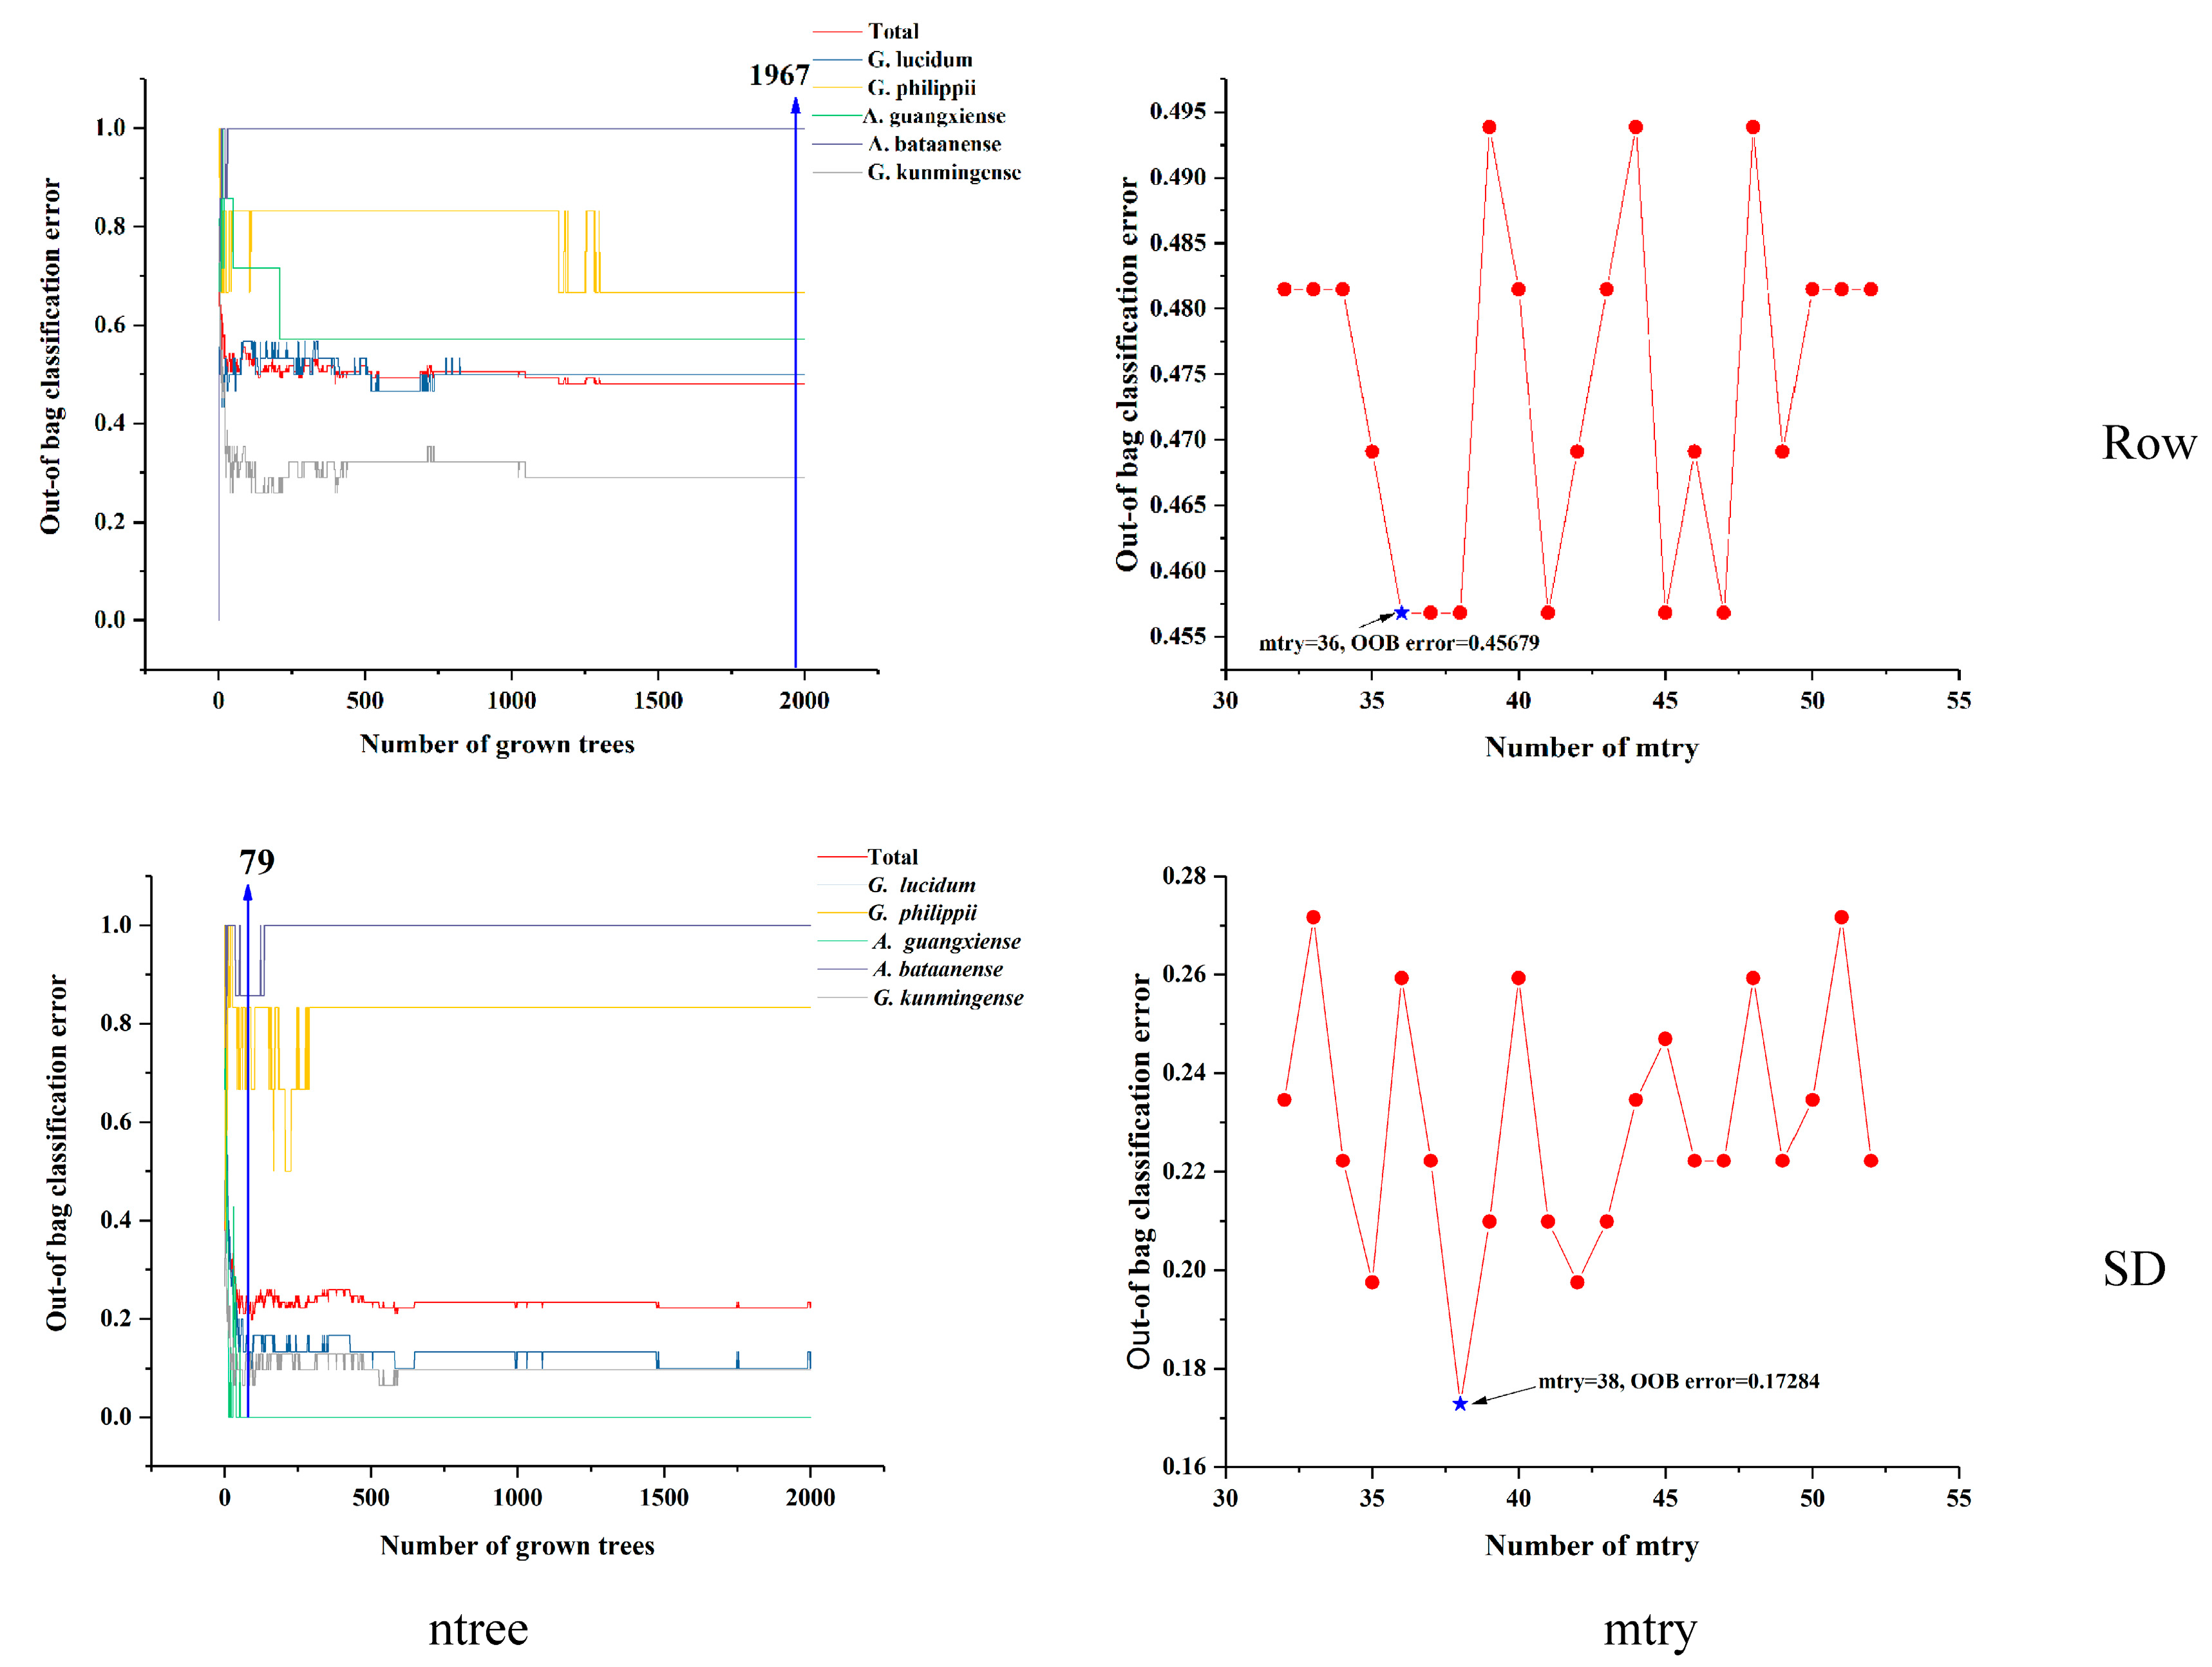
2.3.1. RF Model Established Using ATR-FTIR Spectra
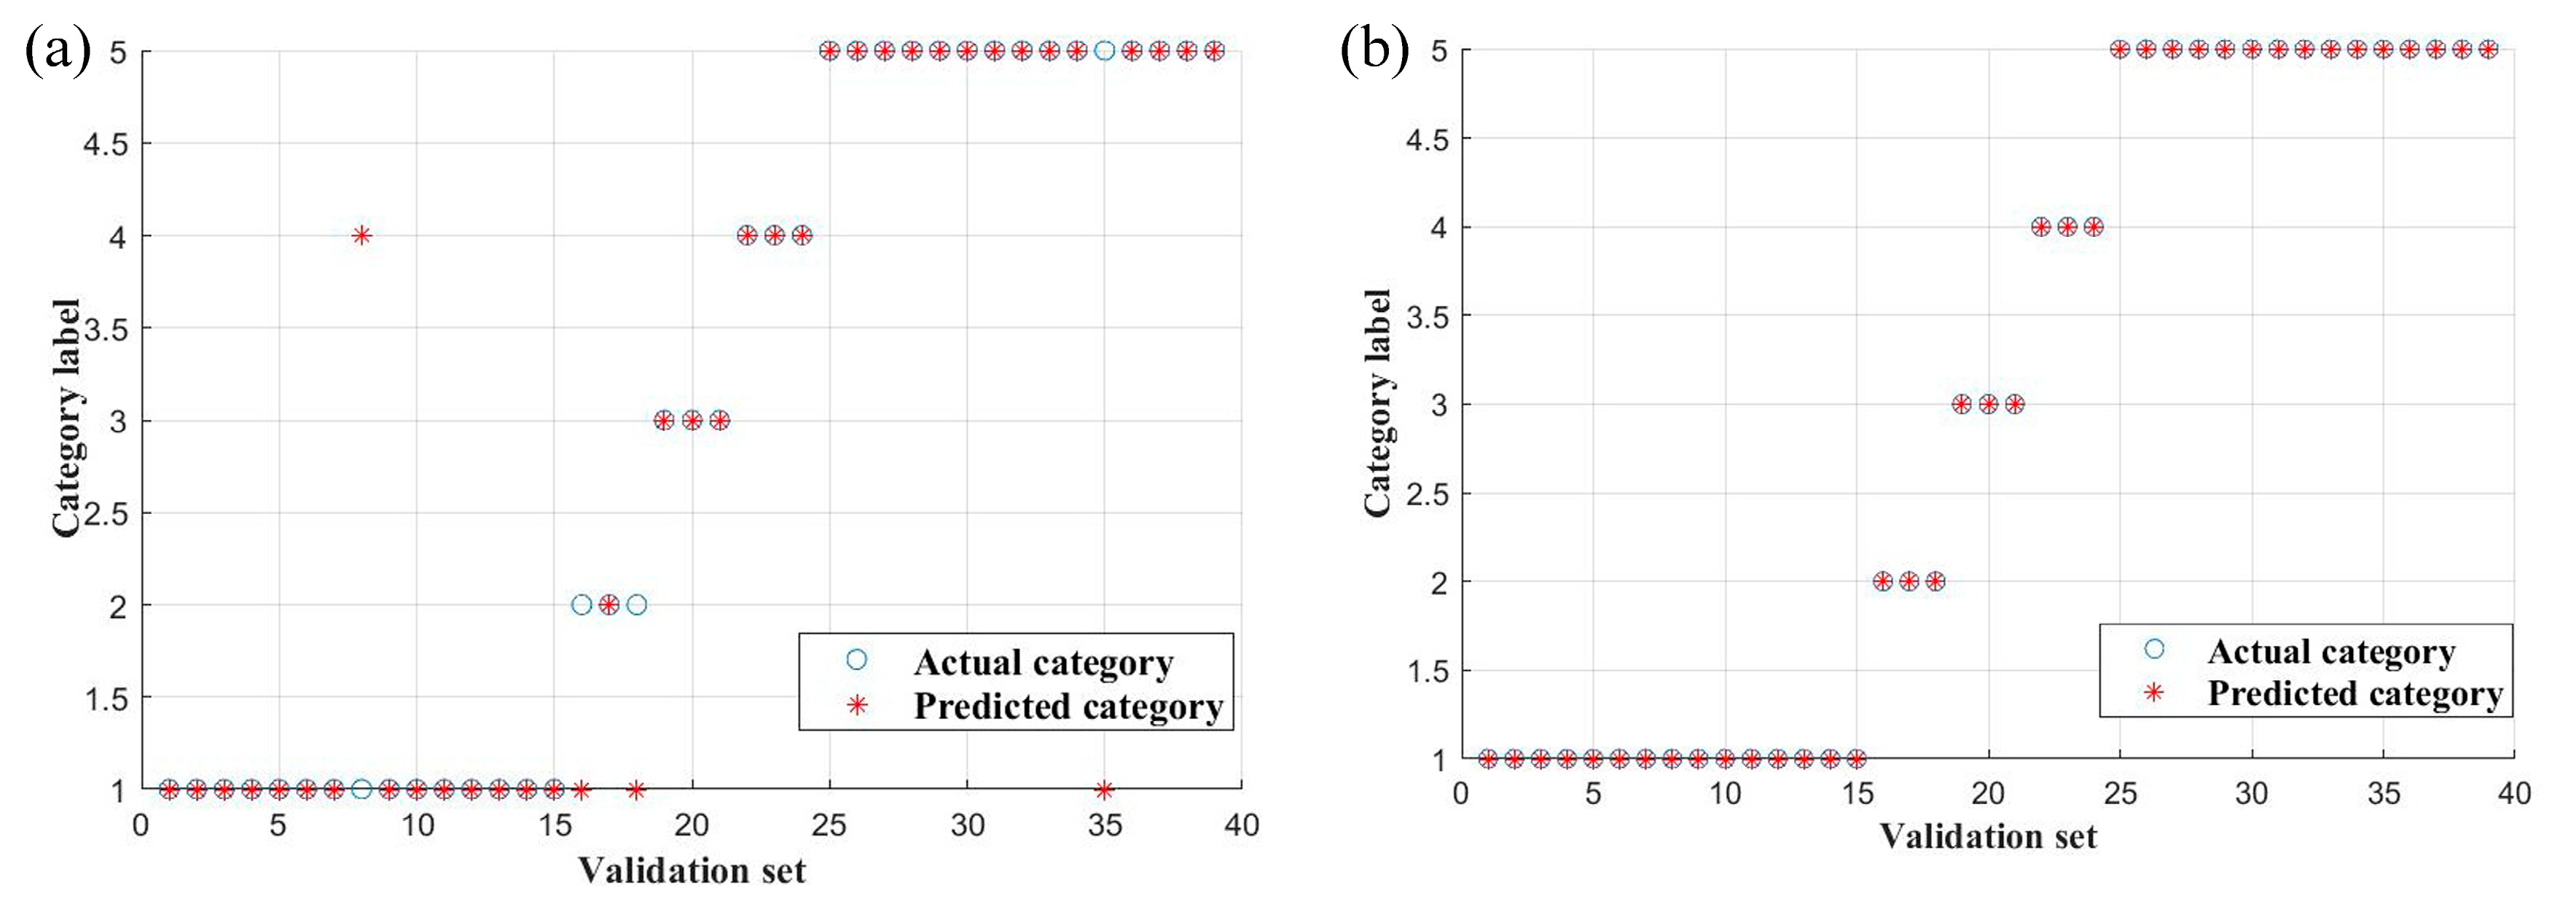
2.3.2. SVM Model Established Using ATR-FTIR Spectra
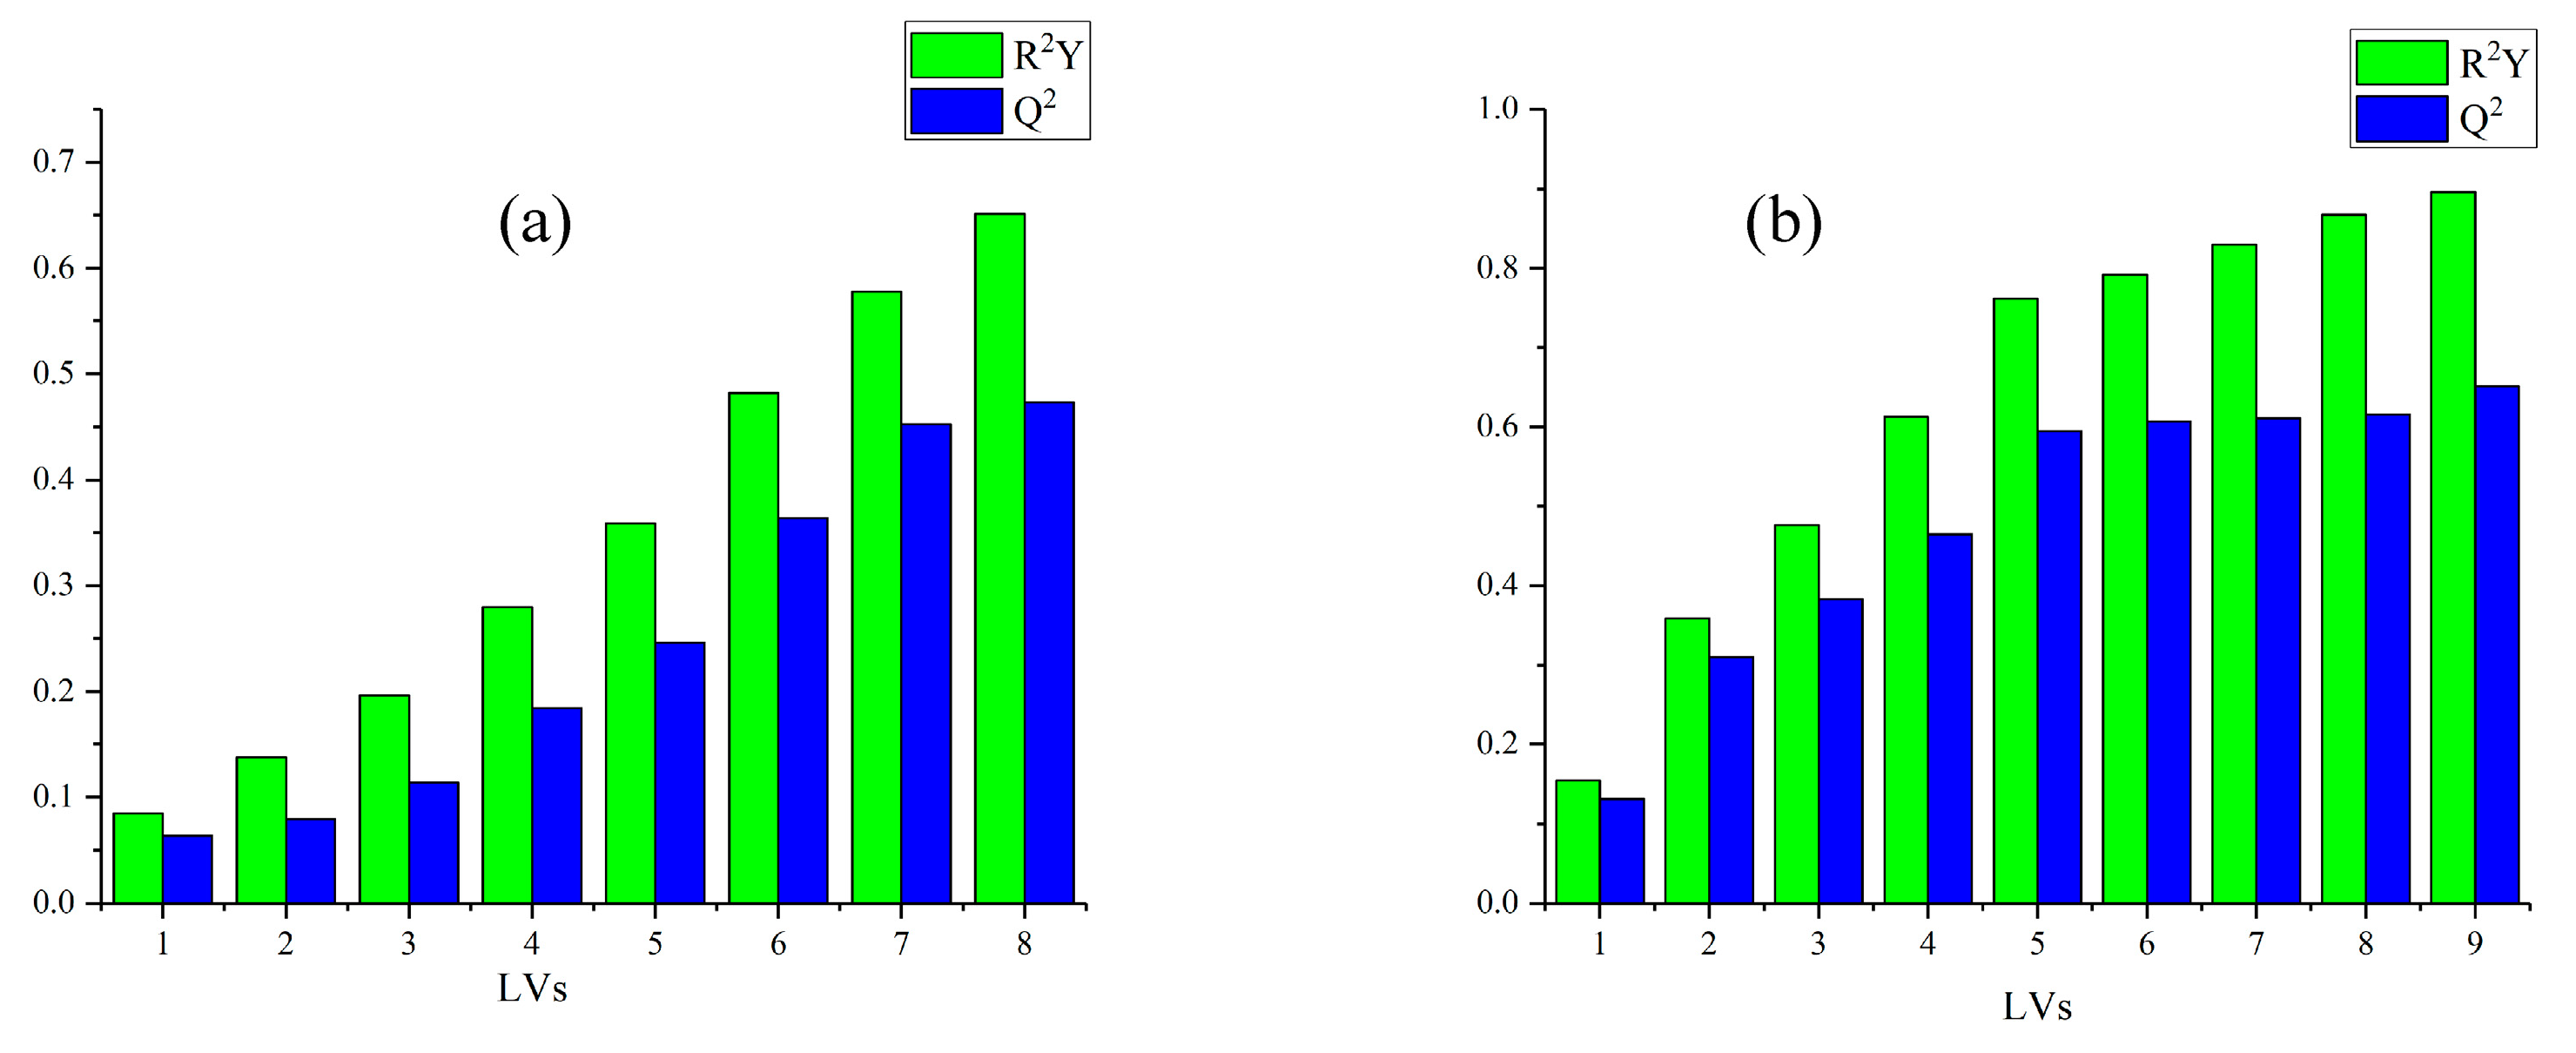
2.3.3. PLS-DA Model Established Using ATR-FTIR Spectra
3. Materials and Methods
3.1. Sample Preparation
3.2. Spectra Acquisition
3.3. Data Visualization
3.4. Data Pretreatment
3.5. Data Analysis
4. Conclusions
Supplementary Materials
Author Contributions
Funding
Conflicts of Interest
References
- Aida, F.M.N.A.; Shuhaimi, M.; Yazid, M.; Maaruf, A.G. Mushroom as a potential source of prebiotics: A review. Trends Food Sci. Technol. 2009, 20, 567–575. [Google Scholar] [CrossRef]
- Rathore, H.; Prasad, S.; Sharma, S. Mushroom nutraceuticals for improved nutrition and better human health: A review. PharmaNutrition 2017, 5, 35–46. [Google Scholar] [CrossRef]
- Wang, X.; Zhang, J.; Wu, L.; Zhao, Y.; Li, T.; Li, J.; Wang, Y.; Liu, H. A mini-review of chemical composition and nutritional value of edible wild-grown mushroom from China. Food Chem. 2014, 151, 279–285. [Google Scholar] [CrossRef] [PubMed]
- Kim, M.; Seguin, P.; Ahn, J.; Kim, J.; Chun, S.; Kim, E.; Seo, S.; Kang, E.; Kim, S.; Park, Y.; et al. Phenolic Compound Concentration and Antioxidant Activities of Edible and Medicinal Mushrooms from Korea. J. Agric. Food Chem. 2008, 56, 7265–7270. [Google Scholar] [CrossRef] [PubMed]
- Zaidman, B.; Yassin, M.; Mahajna, J.; Wasser, S.P. Medicinal mushroom modulators of molecular targets as cancer therapeutics. Appl. Microbiol. Biol. 2005, 67, 453–468. [Google Scholar] [CrossRef]
- Cao, Y.; Wu, S.; Dai, Y. Species clarification of the prize medicinal Ganoderma mushroom “Lingzhi”. Fungal Divers. 2012, 56, 49–62. [Google Scholar] [CrossRef]
- Yang, Z.L.; Feng, B. What is the Chinese “Lingzhi”?—A taxonomic mini-review. Mycology 2013, 4, 1–4. [Google Scholar]
- Bao, X.F.; Wang, X.S.; Dong, Q.; Fang, J.N.; Li, X.Y. Structural features of immunologically active polysaccharides from Ganoderma lucidum. Phytochemistry 2002, 59, 175–181. [Google Scholar] [CrossRef]
- Zheng, Y.; Limin, H.; Liming, Z.; Caicai, K.; Tianjiao, M.; Yan, C. Comparison of Main Chemical Constituents in Ganoderma lucidum Collected from Three Producing Districts. Food Sci. 2019, 40, 240–246. [Google Scholar]
- Jong, S.C.; Birmingham, J.M. Medicinal benefits of the mushroom Ganoderma. Adv. Appl. Microbiol. 1992, 37, 101. [Google Scholar] [PubMed]
- Jin, M.L.; Zhang, H.; Wang, J.J.; Shao, D.; Yang, H.; Huang, Q.; Shi, J.; Xu, C.; Zhao, K. Response of intestinal metabolome to polysaccharides from mycelia of Ganoderma lucidum. Int. J. Biol. Macromol. 2019, 122, 723–731. [Google Scholar] [CrossRef] [PubMed]
- Kubota, T.; Asaka, Y.; Miura, I.; Mori, H. Structures of Ganoderic Acid A and B, Two New Lanostane Type Bitter Triterpenes from Ganoderma lucidum (FR.). Helv. Chim. Acta 1982, 65, 611–619. [Google Scholar] [CrossRef]
- Boh, B.; Berovic, M.; Zhang, J.; Zhi-Bin, L. Ganoderma lucidum and its pharmaceutically active compounds. Biotechnol. Annu. Rev. 2007, 13, 265–301. [Google Scholar]
- Holmes, D. Medicinal mushroom reduces obesity by modulating microbiota. Nat. Rev. Endocrinol. 2015, 11, 504. [Google Scholar] [CrossRef] [PubMed]
- Cör, D.; Knez, Ž.; Knez Hrnčič, M. Antitumour, Antimicrobial, Antioxidant and Antiacetylcholinesterase Effect of Ganoderma Lucidum Terpenoids and Polysaccharides: A Review. Molecules 2018, 23, 649. [Google Scholar] [CrossRef]
- Wachtel-Galor, S.; Yuen, J.; Buswell, J.A.; Benzie, I.F.F. Ganoderma lucidum (Lingzhi or Reishi). Herb. Med. 2011, 175–199. [Google Scholar]
- Babu, P.D.; Subhasree, R.S. The Sacred Mushroom “Reishi”—A Review. J. Bot. 2008, 1, 107–110. [Google Scholar]
- Richter, C.; Wittstein, K.; Kirk, P.M.; Stadler, M. An assessment of the taxonomy and chemotaxonomy of Ganoderma. Fungal Divers. 2015, 71, 1–15. [Google Scholar] [CrossRef]
- Chinese Pharmacopoeia Commission. Chinese Pharmacopoeia; China Medical Science Press: Beijing, China, 2015. [Google Scholar]
- Shao, P.; Wang, J.; Zhang, T.; Sun, P. Determination of starch adulteration in Ganoderma lucidum polysaccharide by near infrared reflectance spectroscopy with partial least squares algorithm. Curr. Top. Nutraceut. Res. 2015, 13, 181. [Google Scholar]
- Fu, H.; Yin, Q.; Xu, L.; Wang, W.; Chen, F.; Yang, T. A comprehensive quality evaluation method by FT-NIR. Spectrochim. Acta A 2017, 182, 17–25. [Google Scholar] [CrossRef] [PubMed]
- Han, J.; Pang, X.; Liao, B.; Yao, H.; Song, J.; Chen, S. An authenticity survey of herbal medicines from markets in China using DNA barcoding. Sci. Rep. 2016, 6, 18723. [Google Scholar]
- Gautam, C.S.; Utreja, A.; Singal, G.L. Spurious and counterfeit drugs: A growing industry in the developing world. Postgrad. Med. J. 2009, 85, 251–256. [Google Scholar] [PubMed]
- Marini, R.D.; Rozet, E.; Montes, M.L.; Rohrbasser, C.; Roht, S.; Rheme, D.; Bonnabry, P.; Schappler, J.; Veuthey, J.L.; Hubert, P.; et al. Reliable low-cost capillary electrophoresis device for drug quality control and counterfeit medicines. J. Pharm. Biomed. Anal. 2010, 53, 1278–1287. [Google Scholar] [CrossRef]
- Su, C.H.; Yang, Y.Z.; Ho, H.O.; Hu, C.H.; Sheu, M.T. High-performance liquid chromatographic analysis for the characterization of triterpenoids from Ganoderma. J. Chromatogr. Sci. 2001, 39, 93–100. [Google Scholar] [CrossRef] [PubMed]
- Chen, Y.; Bicker, W.; Wu, J.; Xie, M.Y.; Lindner, W. Ganoderma species discrimination by dual-mode chromatographic fingerprinting: A study on stationary phase effects in hydrophilic interaction chromatography and reduction of sample misclassification rate by additional use of reversed-phase chromatography. J. Chromatogr. A 2010, 1217, 1255–1265. [Google Scholar] [CrossRef]
- Liao, B.; Chen, X.; Han, J.; Dan, Y.; Wang, L.; Jiao, W.; Song, J.; Chen, S. Identification of commercial Ganoderma (Lingzhi) species by ITS2 sequences. Chin. Med. 2015, 10. [Google Scholar] [CrossRef] [PubMed]
- Pei, Y.; Wu, L.; Zhang, Q.; Wang, Y. Geographical traceability of cultivatedParis polyphylla var.yunnanensis using ATR-FTMIR spectroscopy with three mathematical algorithms. Anal. Methods 2019, 11, 113–122. [Google Scholar] [CrossRef]
- Wang, Y.; Huang, H.; Zuo, Z.; Wang, Y. Comprehensive quality assessment of Dendrubium officinale using ATR-FTIR spectroscopy combined with random forest and support vector machine regression. Spectrochim. Acta A 2018, 205, 637–648. [Google Scholar] [CrossRef]
- de Oliveira Magalhães, L.; Arantes, L.C.; Willian, J.; Braga, B. Identification of NBOMe and NBOH in blotter papers using a handheld NIR spectrometer and chemometric methods. Microchem. J. 2019, 144, 151–158. [Google Scholar] [CrossRef]
- Cebi, N.; Dogan, C.E.; Mese, A.E.; Ozdemir, D.; Arıcı, M.; Sagdic, O. A rapid ATR-FTIR spectroscopic method for classification of gelatin gummy candies in relation to the gelatin source. Food Chem. 2019, 277, 373–381. [Google Scholar] [CrossRef]
- Yancheva, D.; Tapanov, S.; Velcheva, E.; Stamboliyska, B.; Glavcheva, Z.; Stoyanov, S.; Haralampiev, N.; Fischer, D.; Lederer, A. Characterization of Zahari Zograph’s nave wall paintings in the church “The nativity of the virgin” of Rila Monastery (Bulgaria) by vibrational spectroscopy and SEM–EDX analysis. Sci. Tech. Arch. Res. 2017, 3, 437–449. [Google Scholar] [CrossRef]
- Cai, S.; Singh, B.R. Identification of β-turn and random coil amide III infrared bands for secondary structure estimation of proteins. Biophys. Chem. 1999, 80, 7–20. [Google Scholar] [CrossRef]
- Faris, H.; Hassonah, M.A.; Al-Zoubi, A.M.; Mirjalili, S.; Aljarah, I. A multi-verse optimizer approach for feature selection and optimizing SVM parameters based on a robust system architecture. Neural Comp. Appl. 2018, 30, 2355–2369. [Google Scholar] [CrossRef]
- van der Maaten, L.; Hinton, G. Visualizing data using t-SNE. Mach. Learn. Res. 2008, 9, 2579–2605. [Google Scholar]
- Gorban, A.N.; Kégl, B.; Wunsch, D.C.; Zinovyev, A.Y. Principal Manifolds for Data Visualization and Dimension Reduction; Springer: Berlin, Germany, 2008. [Google Scholar]
- Shen, F.; Yang, D.; Ying, Y.; Li, B.; Zheng, Y.; Jiang, T. Discrimination Between Shaoxing Wines and Other Chinese Rice Wines by Near-Infrared Spectroscopy and Chemometrics. Food Bioprocess Technol. 2012, 5, 786–795. [Google Scholar] [CrossRef]
- Li, Y.; Zhang, J.; Li, T.; Liu, H.; Li, J.; Wang, Y. Geographical traceability of wild Boletus edulis based on data fusion of FT-MIR and ICP-AES coupled with data mining methods (SVM). Spectrochim. Acta A 2017, 177, 20–27. [Google Scholar] [CrossRef]
- Zhang, J.; Yan, Y. Probing conformational changes of proteins by quantitative second-derivative infrared spectroscopy. Anal. Biochem. 2005, 340, 89–98. [Google Scholar] [CrossRef]
- Genkawa, T.; Ahamed, T.; Noguchi, R.; Takigawa, T.; Ozaki, Y. Simple and rapid determination of free fatty acids in brown rice by FTIR spectroscopy in conjunction with a second-derivative treatment. Food Chem. 2016, 191, 7–11. [Google Scholar] [CrossRef]
- Cielecka-Piontek, J. Derivative Spectrophotometry for the Determination of Faropenem in the Presence of Degradation Products: An Application for Kinetic Studies. Appl. Spectrosc. 2013, 67, 703–708. [Google Scholar] [CrossRef]
- Mathian, M.; Hebert, B.; Baron, F.; Petit, S.; Lescuyer, J.L.; Furic, R.; Beaufort, D. Identifying the phyllosilicate minerals of hypogene ore deposits in lateritic saprolites using the near-IR spectroscopy second derivative methodology. J. Geochem. Explor. 2018, 186, 298–314. [Google Scholar] [CrossRef]
- Barreca, S.; Mazzola, A.; Orecchio, S.; Tuzzolino, N. Polychlorinated Biphenyls in Sediments from Sicilian Coastal Area (Scoglitti) using Automated Soxhlet, GC-MS, and Principal Component Analysis. Polycycl. Aromat. Comp. 2014, 34, 237–262. [Google Scholar] [CrossRef]
- Amorello, D.; Orecchio, S.; Pace, A.; Barreca, S. Discrimination of almonds (Prunus dulcis) geographical origin by minerals and fatty acids profiling. Nat. Prod. Res. 2016, 30, 2107–2110. [Google Scholar] [CrossRef] [PubMed]
- Li, D.; Jin, Z.; Zhou, Q.; Chen, J.; Lei, Y.; Sun, S. Discrimination of five species of Fritillaria and its extracts by FT-IR and 2D-IR. J. Mol. Struct. 2010, 974, 68–72. [Google Scholar] [CrossRef]
- Czarnecki, M.A. Resolution Enhancement in Second-Derivative Spectra. Appl. Spectrosc. 2015, 69, 67–74. [Google Scholar] [CrossRef] [PubMed]
- Kosmas, C.S.; Curi, N.; Bryant, R.B.; Franzmeier, D.P. Characterization of Iron Oxide Minerals by Second-Derivative Visible Spectroscopy1. Soil Sci. Soc. Am. J. 1984, 48, 401–405. [Google Scholar] [CrossRef]
- Berrueta, L.A.; Alonso-Salces, R.M.; Héberger, K. Supervised pattern recognition in food analysis. J Chromatogr. A 2007, 1158, 196–214. [Google Scholar] [CrossRef]
- Li, Y.; Zhang, J.; Wang, Y. FT-MIR and NIR spectral data fusion: A synergetic strategy for the geographical traceability of Panax notoginseng. Anal. Bioanal. Chem. 2018, 410, 91–103. [Google Scholar] [CrossRef]
- Villa, J.E.L.; Quiñones, N.R.; Fantinatti-Garboggini, F.; Poppi, R.J. Fast discrimination of bacteria using a filter paper–based SERS platform and PLS-DA with uncertainty estimation. Anal. Bioanal. Chem. 2019, 411, 705–713. [Google Scholar] [CrossRef]
- Devos, O.; Downey, G.; Duponchel, L. Simultaneous data pre-processing and SVM classification model selection based on a parallel genetic algorithm applied to spectroscopic data of olive oils. Food Chem. 2014, 148, 124–130. [Google Scholar] [CrossRef]
- Paiva, J.S.; Cardoso, J.; Pereira, T.A. Supervised Learning Methods for Pathological Arterial Pulse Wave. Int J. Med. Inform. 2018, 109, 30–38. [Google Scholar] [CrossRef]
- Barker, M.; Rayens, W. Partial least squares for discrimination. J. Chemometr. 2003, 17, 166–173. [Google Scholar] [CrossRef]
- Rajer-Kanduč, K.; Zupan, J.; Majcen, N. Separation of data on the training and test set for modelling: A case study for modelling of five colour properties of a white pigment. Chemometr. Intell. Lab. 2003, 65, 221–229. [Google Scholar] [CrossRef]
- Belgiu, M.; Drăguţ, L. Random forest in remote sensing: A review of applications and future directions. ISPRS J. Photogramm. 2016, 114, 24–31. [Google Scholar] [CrossRef]
- Breiman, L. Random forests. Mach. Learn. 2001, 45, 5–32. [Google Scholar] [CrossRef]
- Genuer, R.; Poggi, J.; Tuleau-Malot, C.; Villa-Vialaneix, N. Random Forests for Big Data. Big Data Res. 2017, 9, 28–46. [Google Scholar] [CrossRef]
- Liaw, A.; Wiener, M. Classification and Regression by RandomForest. R News 2002, 2, 18–22. [Google Scholar]
- Li, Y.; Wang, Y. Synergistic strategy for the geographical traceability of wild Boletus tomentipes by means of data fusion analysis. Microchem. J. 2018, 140, 38–46. [Google Scholar] [CrossRef]
- Kotsiantis, S.B. Supervised machine learning: A review of classification techniques. Emerg. Artif. Intell. Appl. Comp. Eng. 2007, 160, 3–24. [Google Scholar]
- Ballabio, D.; Consonnia, V. Classification tools in chemistry. Part 1: Linear models. PLS-DA. Anal. Methods 2013, 5, 3790–3798. [Google Scholar] [CrossRef]
- Górski, Ł.; Sordoń, W.; Ciepiela, F.; Kubiak, W.W.; Jakubowska, M. Voltammetric classification of ciders with PLS-DA. Talanta 2016, 146, 231–236. [Google Scholar] [CrossRef]
- de Almeida, M.R.; Correa, D.N.; Rocha, W.F.C.; Scafi, F.J.O.; Poppi, R.J. Discrimination between authentic and counterfeit banknotes using Raman spectroscopy and PLS-DA with uncertainty estimation. Microchem. J. 2013, 109, 170–177. [Google Scholar] [CrossRef]
- Luna, A.S.; Da Silva, A.P.; Da Silva, C.S.; Lima, I.C.A.; de Gois, J.S. Chemometric methods for classification of clonal varieties of green coffee using Raman spectroscopy and direct sample analysis. J Food Compos. Anal. 2019, 76, 44–50. [Google Scholar] [CrossRef]
- Oliveri, P.; Downey, G. Multivariate class modeling for the verification of food-authenticity claims. TrAC Trends Anal. Chem. 2012, 35, 74–86. [Google Scholar] [CrossRef]
- Brereton, R.G. Chemometrics for Pattern Recognition; John Wiley & Sons: London, UK, 2009. [Google Scholar]
Sample Availability: Not available. |


| Data Matrices | Best c | Best g | Accuracy of Training Set (%) | Accuracy of Test Set (%) |
|---|---|---|---|---|
| Raw | 5.24288 × 10⁵ | 9.5367 × 10⁻⁷ | 82.72 | 89.74 |
| SD | 8 | 6.9053 × 10⁻⁴ | 93.83 | 100 |
| Data Matrices | Rmsee | Rmsecv | Rmsep | Q2 | R2Y | Accuracy of Training Set (%) | Accuracy of Test Set (%) |
|---|---|---|---|---|---|---|---|
| Raw | 0.217228 | 0.25516 | 0.210544 | 0.474 | 0.651 | 92.59 | 89.74 |
| SD | 0.12055 | 0.22003 | 0.120649 | 0.651 | 0.896 | 100 | 100 |
| Methods | Predicted | Raw | SD | ||||||||
|---|---|---|---|---|---|---|---|---|---|---|---|
| A | B | C | D | E | A | B | C | D | E | ||
| RF | A | 11 | 0 | 0 | 0 | 4 | 15 | 0 | 0 | 0 | 0 |
| B | 1 | 2 | 0 | 0 | 0 | 0 | 3 | 0 | 0 | 0 | |
| C | 2 | 0 | 1 | 0 | 0 | 0 | 0 | 3 | 0 | 0 | |
| D | 0 | 0 | 0 | 0 | 3 | 2 | 0 | 0 | 1 | 0 | |
| E | 1 | 0 | 0 | 0 | 14 | 0 | 0 | 0 | 0 | 15 | |
| SVM | A | 14 | 0 | 0 | 1 | 0 | 15 | 0 | 0 | 0 | 0 |
| B | 2 | 1 | 0 | 0 | 0 | 0 | 3 | 0 | 0 | 0 | |
| C | 0 | 0 | 3 | 0 | 0 | 0 | 0 | 3 | 0 | 0 | |
| D | 0 | 0 | 0 | 3 | 0 | 0 | 0 | 0 | 3 | 0 | |
| E | 1 | 0 | 0 | 0 | 14 | 0 | 0 | 0 | 0 | 15 | |
| PLS-DA | A | 15 | 0 | 0 | 0 | 0 | 15 | 0 | 0 | 0 | 0 |
| B | 1 | 2 | 0 | 0 | 0 | 0 | 3 | 0 | 0 | 0 | |
| C | 0 | 0 | 3 | 0 | 0 | 0 | 0 | 3 | 0 | 0 | |
| D | 0 | 0 | 0 | 1 | 2 | 0 | 0 | 0 | 3 | 0 | |
| E | 1 | 0 | 0 | 0 | 14 | 0 | 0 | 0 | 0 | 15 | |
| Methods | Parameter | Raw | SD | ||||||||
|---|---|---|---|---|---|---|---|---|---|---|---|
| A | B | C | D | E | A | B | C | D | E | ||
| RF | Sensitivity | 0.733 | 0.667 | 0.333 | 0.000 | 0.933 | 1.000 | 1.000 | 1.000 | 0.333 | 1.000 |
| Specificity | 0.833 | 1.000 | 1.000 | 1.000 | 0.708 | 0.917 | 1.000 | 1.000 | 1.000 | 1.000 | |
| Precision | 0.733 | 1.000 | 1.000 | 0.000 | 0.667 | 0.882 | 1.000 | 1.000 | 1.000 | 1.000 | |
| SVM | Sensitivity | 0.933 | 0.333 | 1.000 | 1.000 | 0.933 | 1.000 | 1.000 | 1.000 | 1.000 | 1.000 |
| Specificity | 0.875 | 1.000 | 1.000 | 0.972 | 1.000 | 1.000 | 1.000 | 1.000 | 1.000 | 1.000 | |
| Precision | 0.824 | 1.000 | 1.000 | 0.75 | 1.000 | 1.000 | 1.000 | 1.000 | 1.000 | 1.000 | |
| PLS-DA | Sensitivity | 1.000 | 0.667 | 1.000 | 0.333 | 0.933 | 1.000 | 1.000 | 1.000 | 1.000 | 1.000 |
| Specificity | 0.917 | 1.000 | 1.000 | 1.000 | 0.917 | 1.000 | 1.000 | 1.000 | 1.000 | 1.000 | |
| Precision | 0.882 | 1.000 | 1.000 | 1.000 | 0.875 | 1.000 | 1.000 | 1.000 | 1.000 | 1.000 | |
| Code | Quantity | NO. | Latin Name |
|---|---|---|---|
| A | 45 | 1–45 | G. lucidum |
| B | 9 | 46–54 | G. philippii |
| C | 10 | 55–64 | A. guangxiense |
| D | 10 | 65–74 | A. bataanense |
| E | 46 | 75–120 | G. kunmingense |
© 2019 by the authors. Licensee MDPI, Basel, Switzerland. This article is an open access article distributed under the terms and conditions of the Creative Commons Attribution (CC BY) license (http://creativecommons.org/licenses/by/4.0/).
Share and Cite
Wang, Y.-Y.; Li, J.-Q.; Liu, H.-G.; Wang, Y.-Z. Attenuated Total Reflection-Fourier Transform Infrared Spectroscopy (ATR-FTIR) Combined with Chemometrics Methods for the Classification of Lingzhi Species. Molecules 2019, 24, 2210. https://doi.org/10.3390/molecules24122210
Wang Y-Y, Li J-Q, Liu H-G, Wang Y-Z. Attenuated Total Reflection-Fourier Transform Infrared Spectroscopy (ATR-FTIR) Combined with Chemometrics Methods for the Classification of Lingzhi Species. Molecules. 2019; 24(12):2210. https://doi.org/10.3390/molecules24122210
Chicago/Turabian StyleWang, Yuan-Yuan, Jie-Qing Li, Hong-Gao Liu, and Yuan-Zhong Wang. 2019. "Attenuated Total Reflection-Fourier Transform Infrared Spectroscopy (ATR-FTIR) Combined with Chemometrics Methods for the Classification of Lingzhi Species" Molecules 24, no. 12: 2210. https://doi.org/10.3390/molecules24122210