Comparison of the Phytochemical Composition of Serenoa repens Extracts by a Multiplexed Metabolomic Approach

 ,
,
Abstract
:
1. Introduction
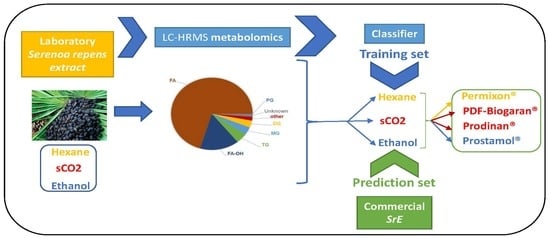
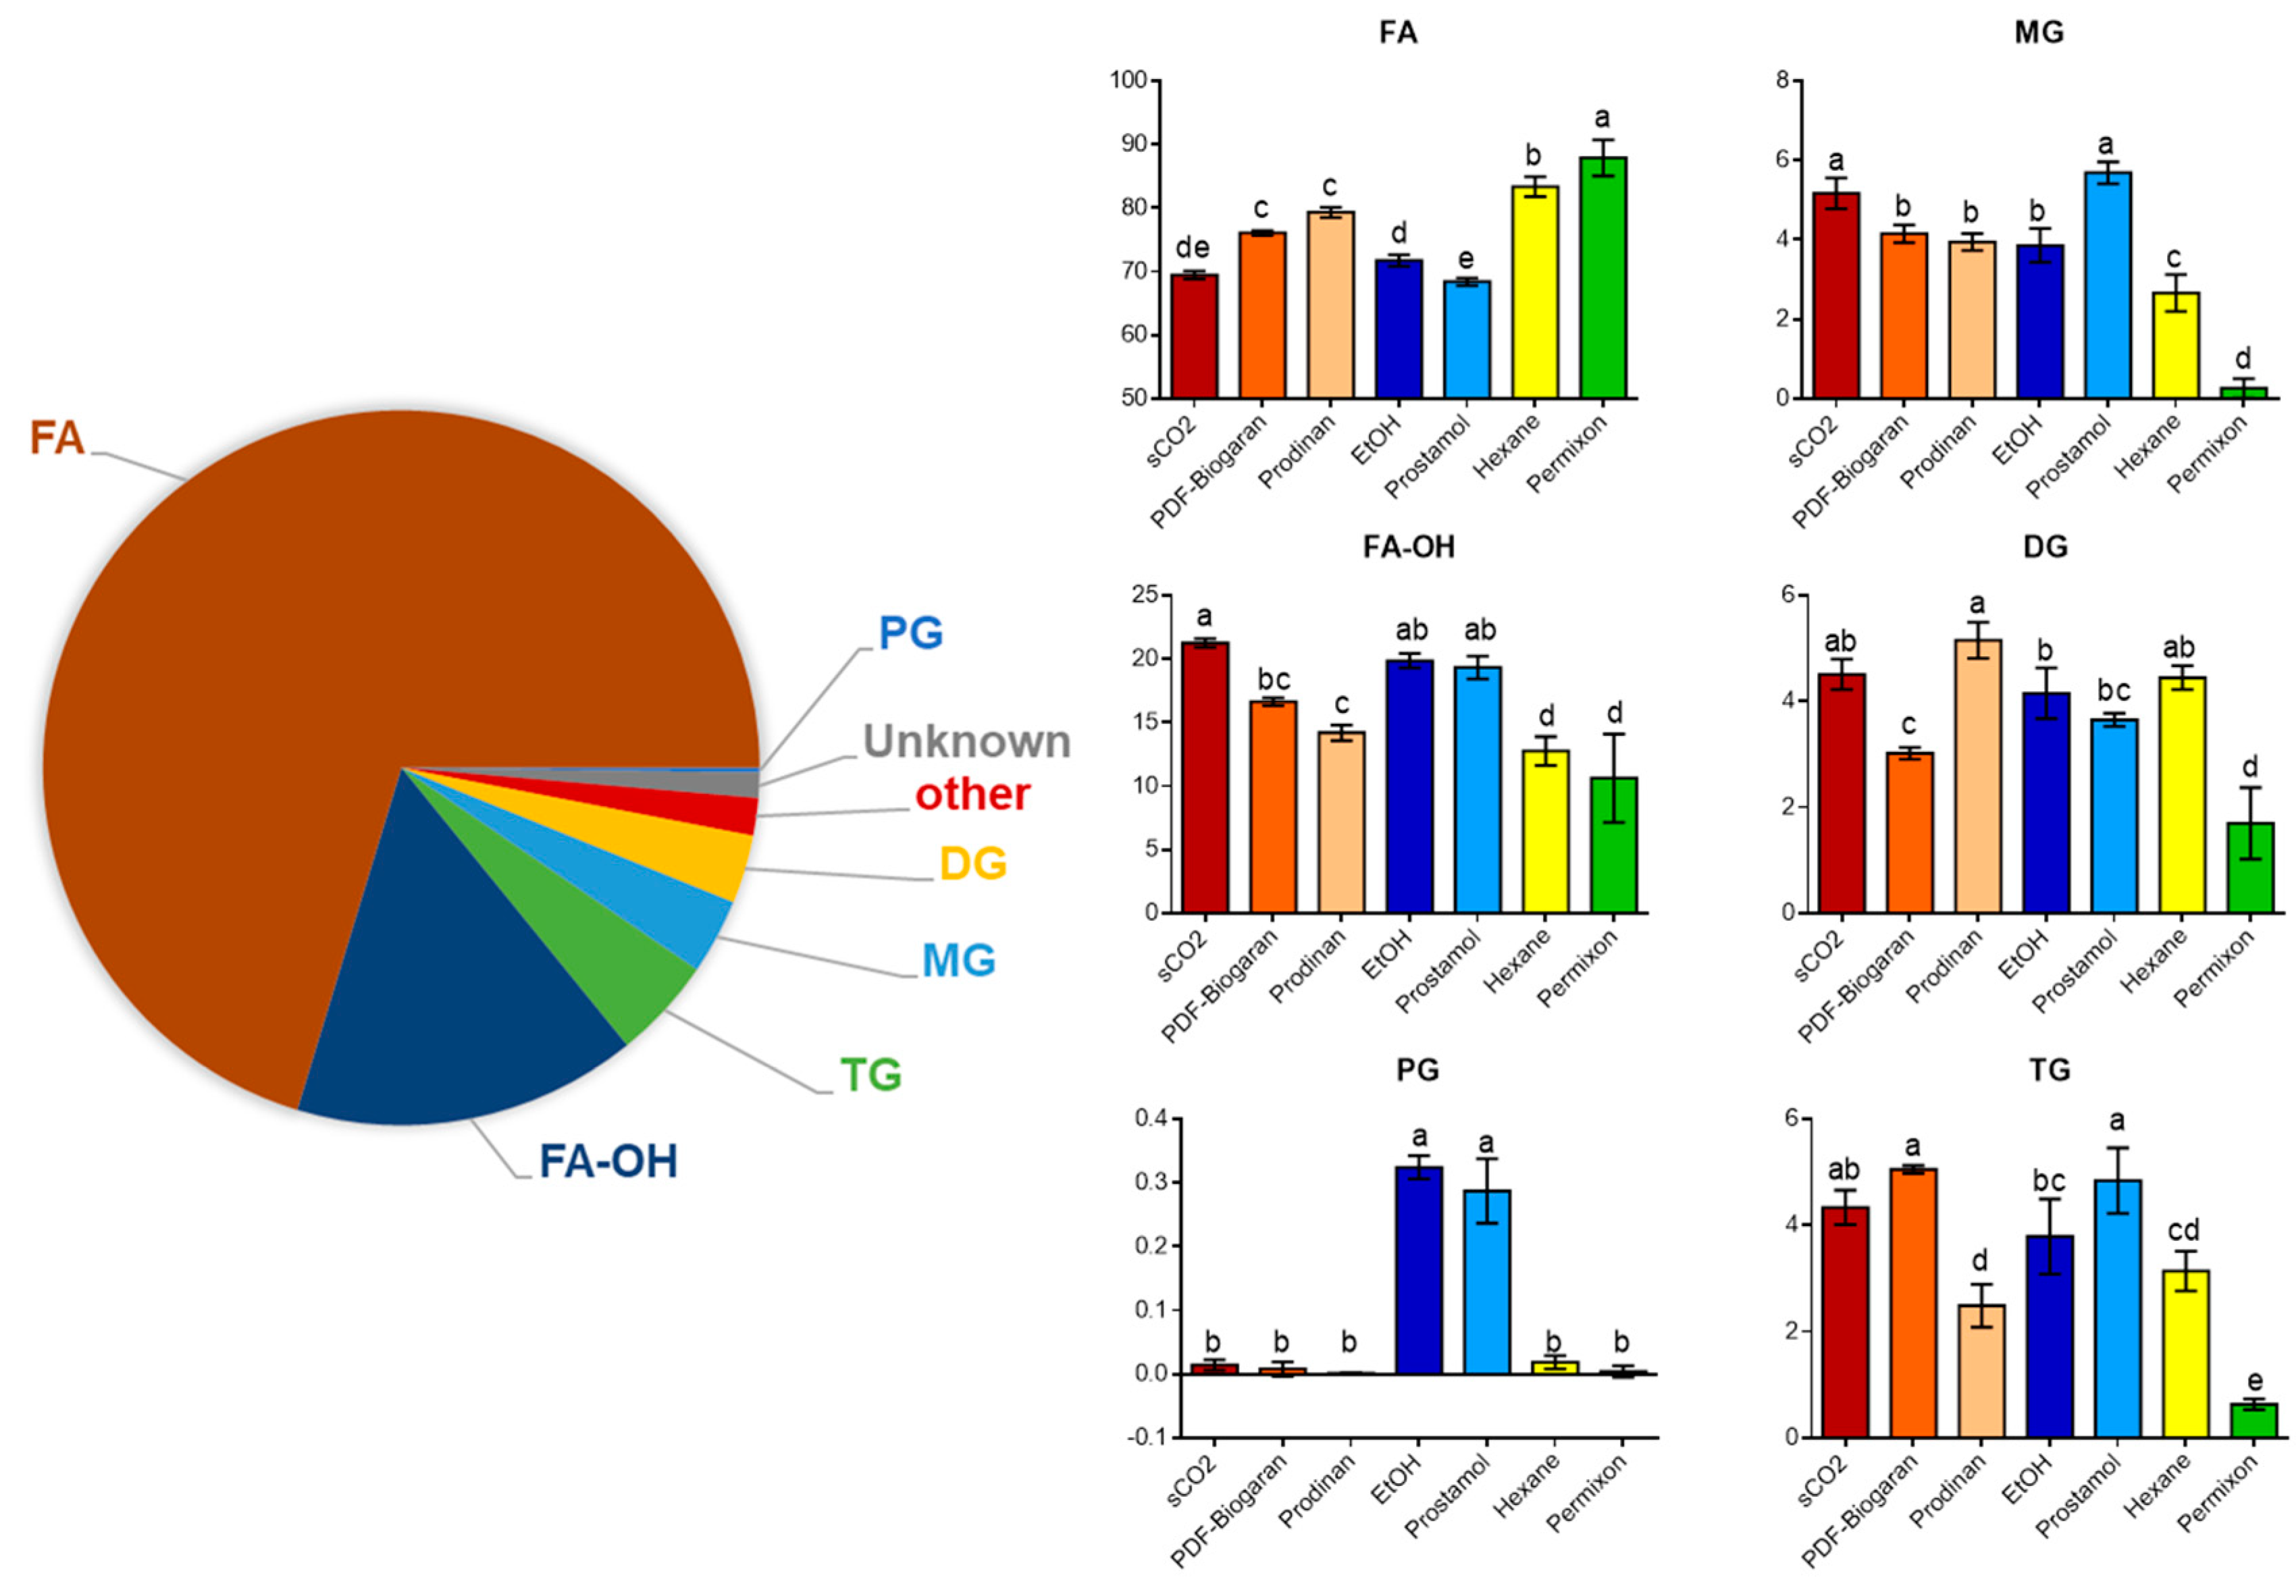
2. Results
2.1. Univariate Data Analysis
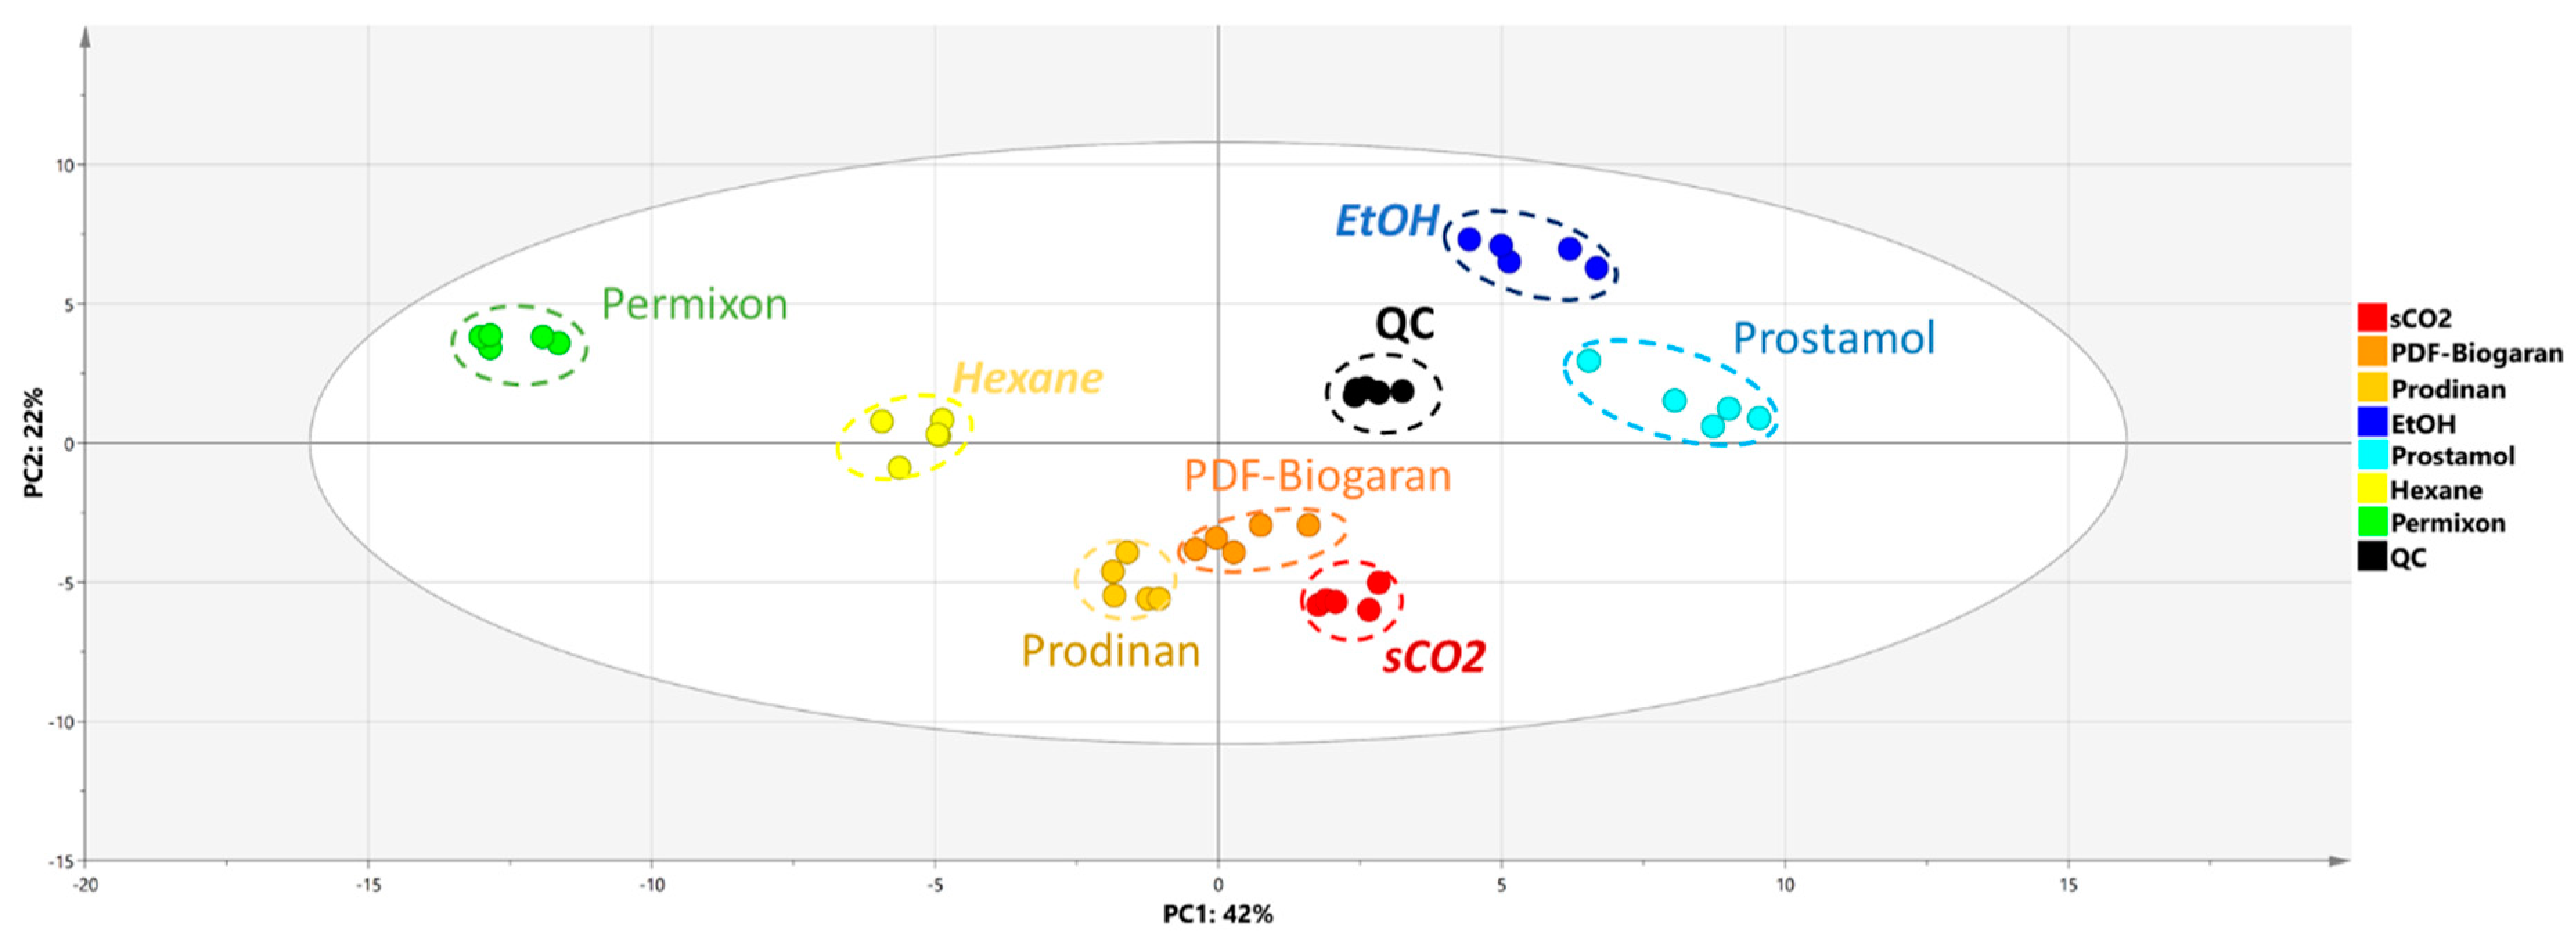
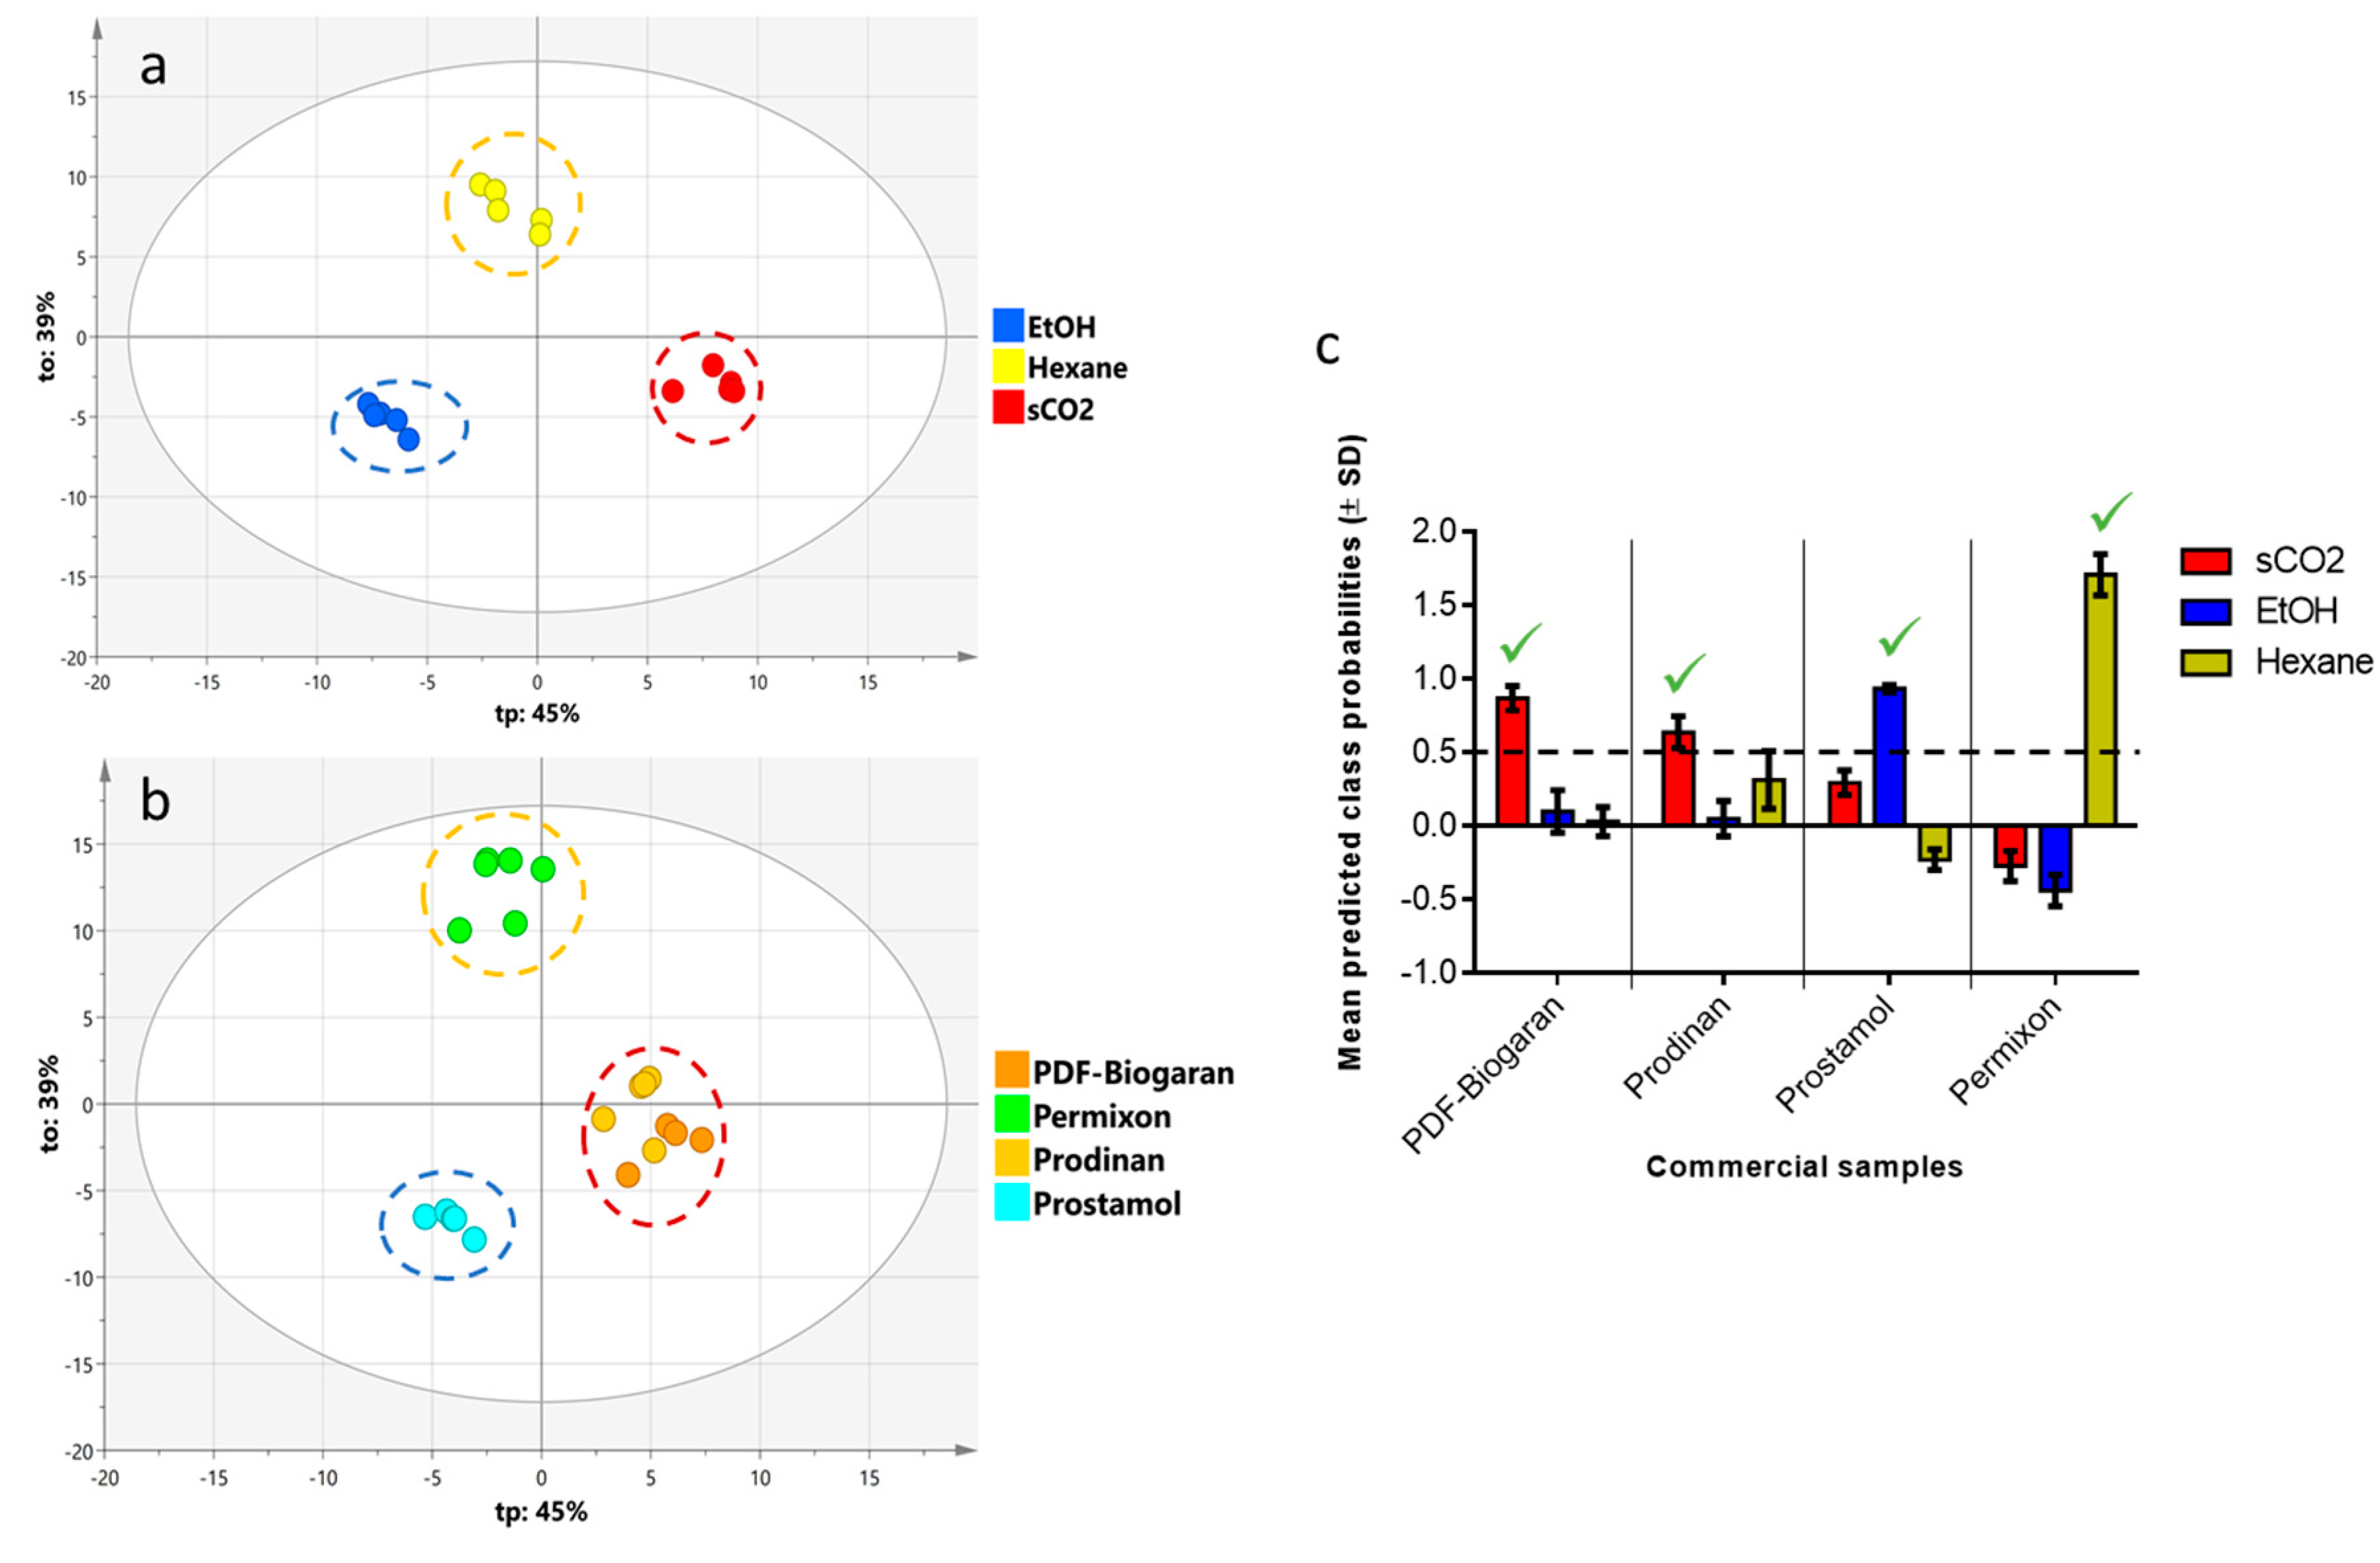
2.2. Multivariate Data Analysis
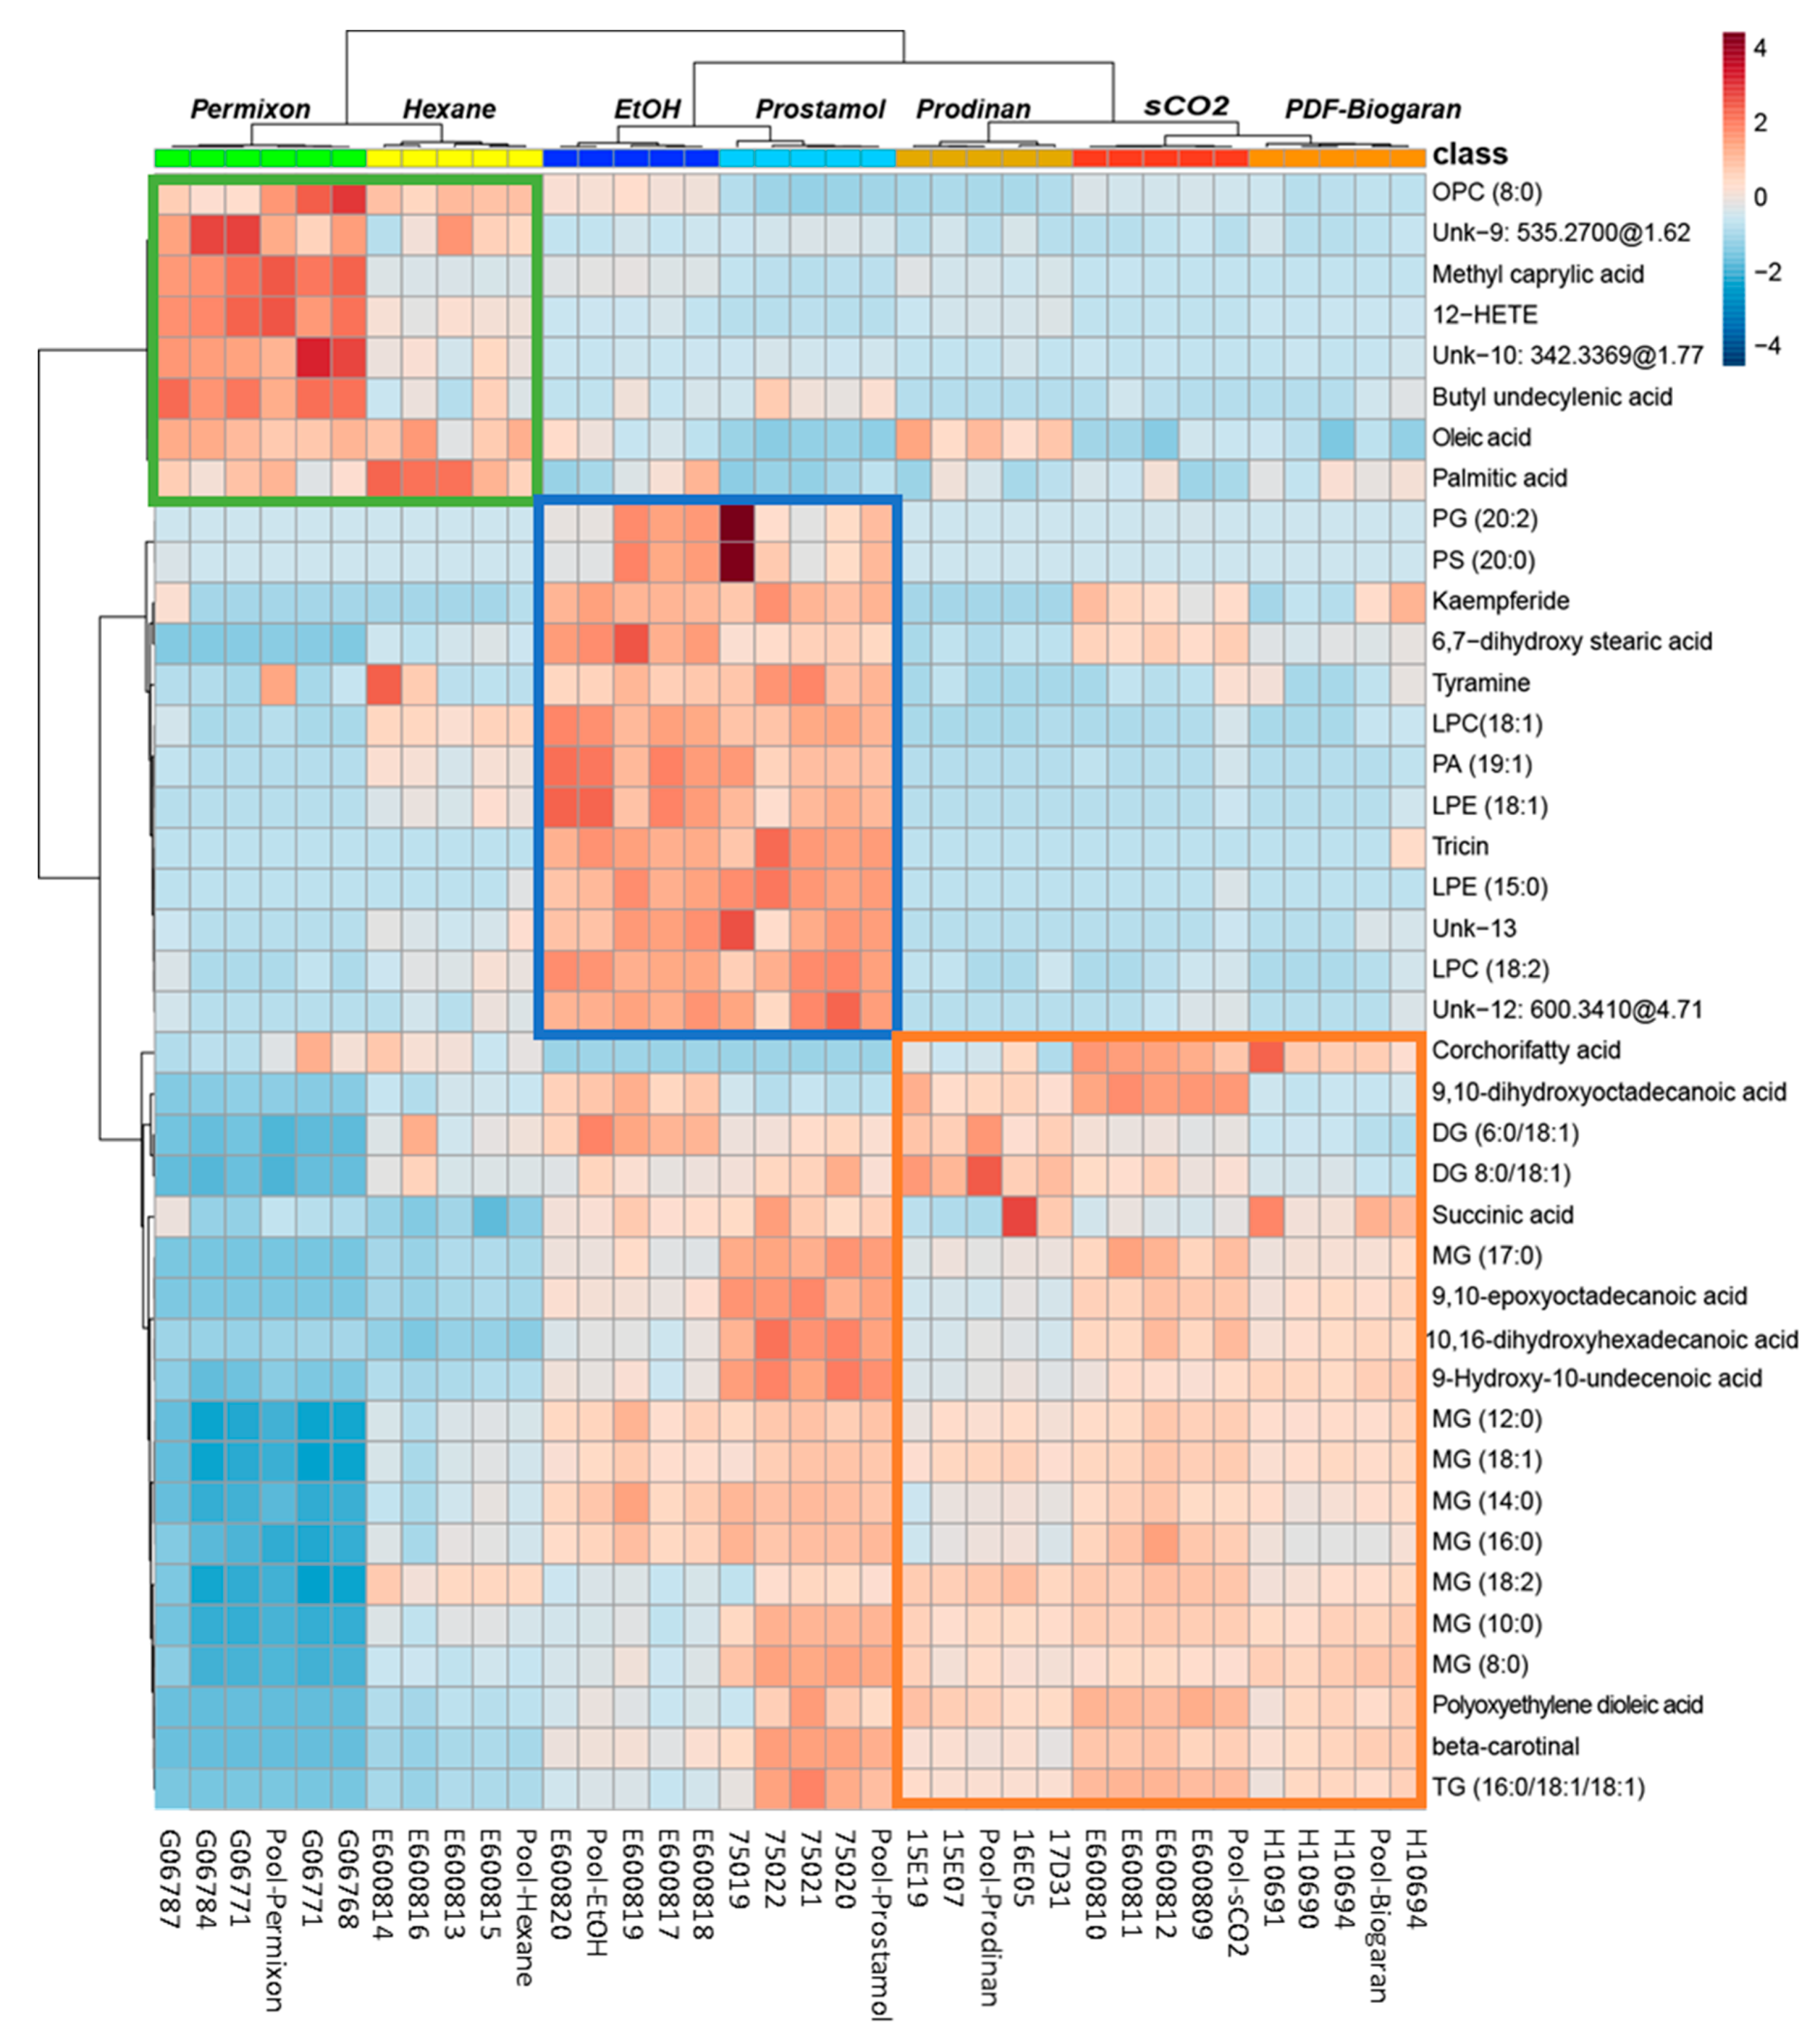
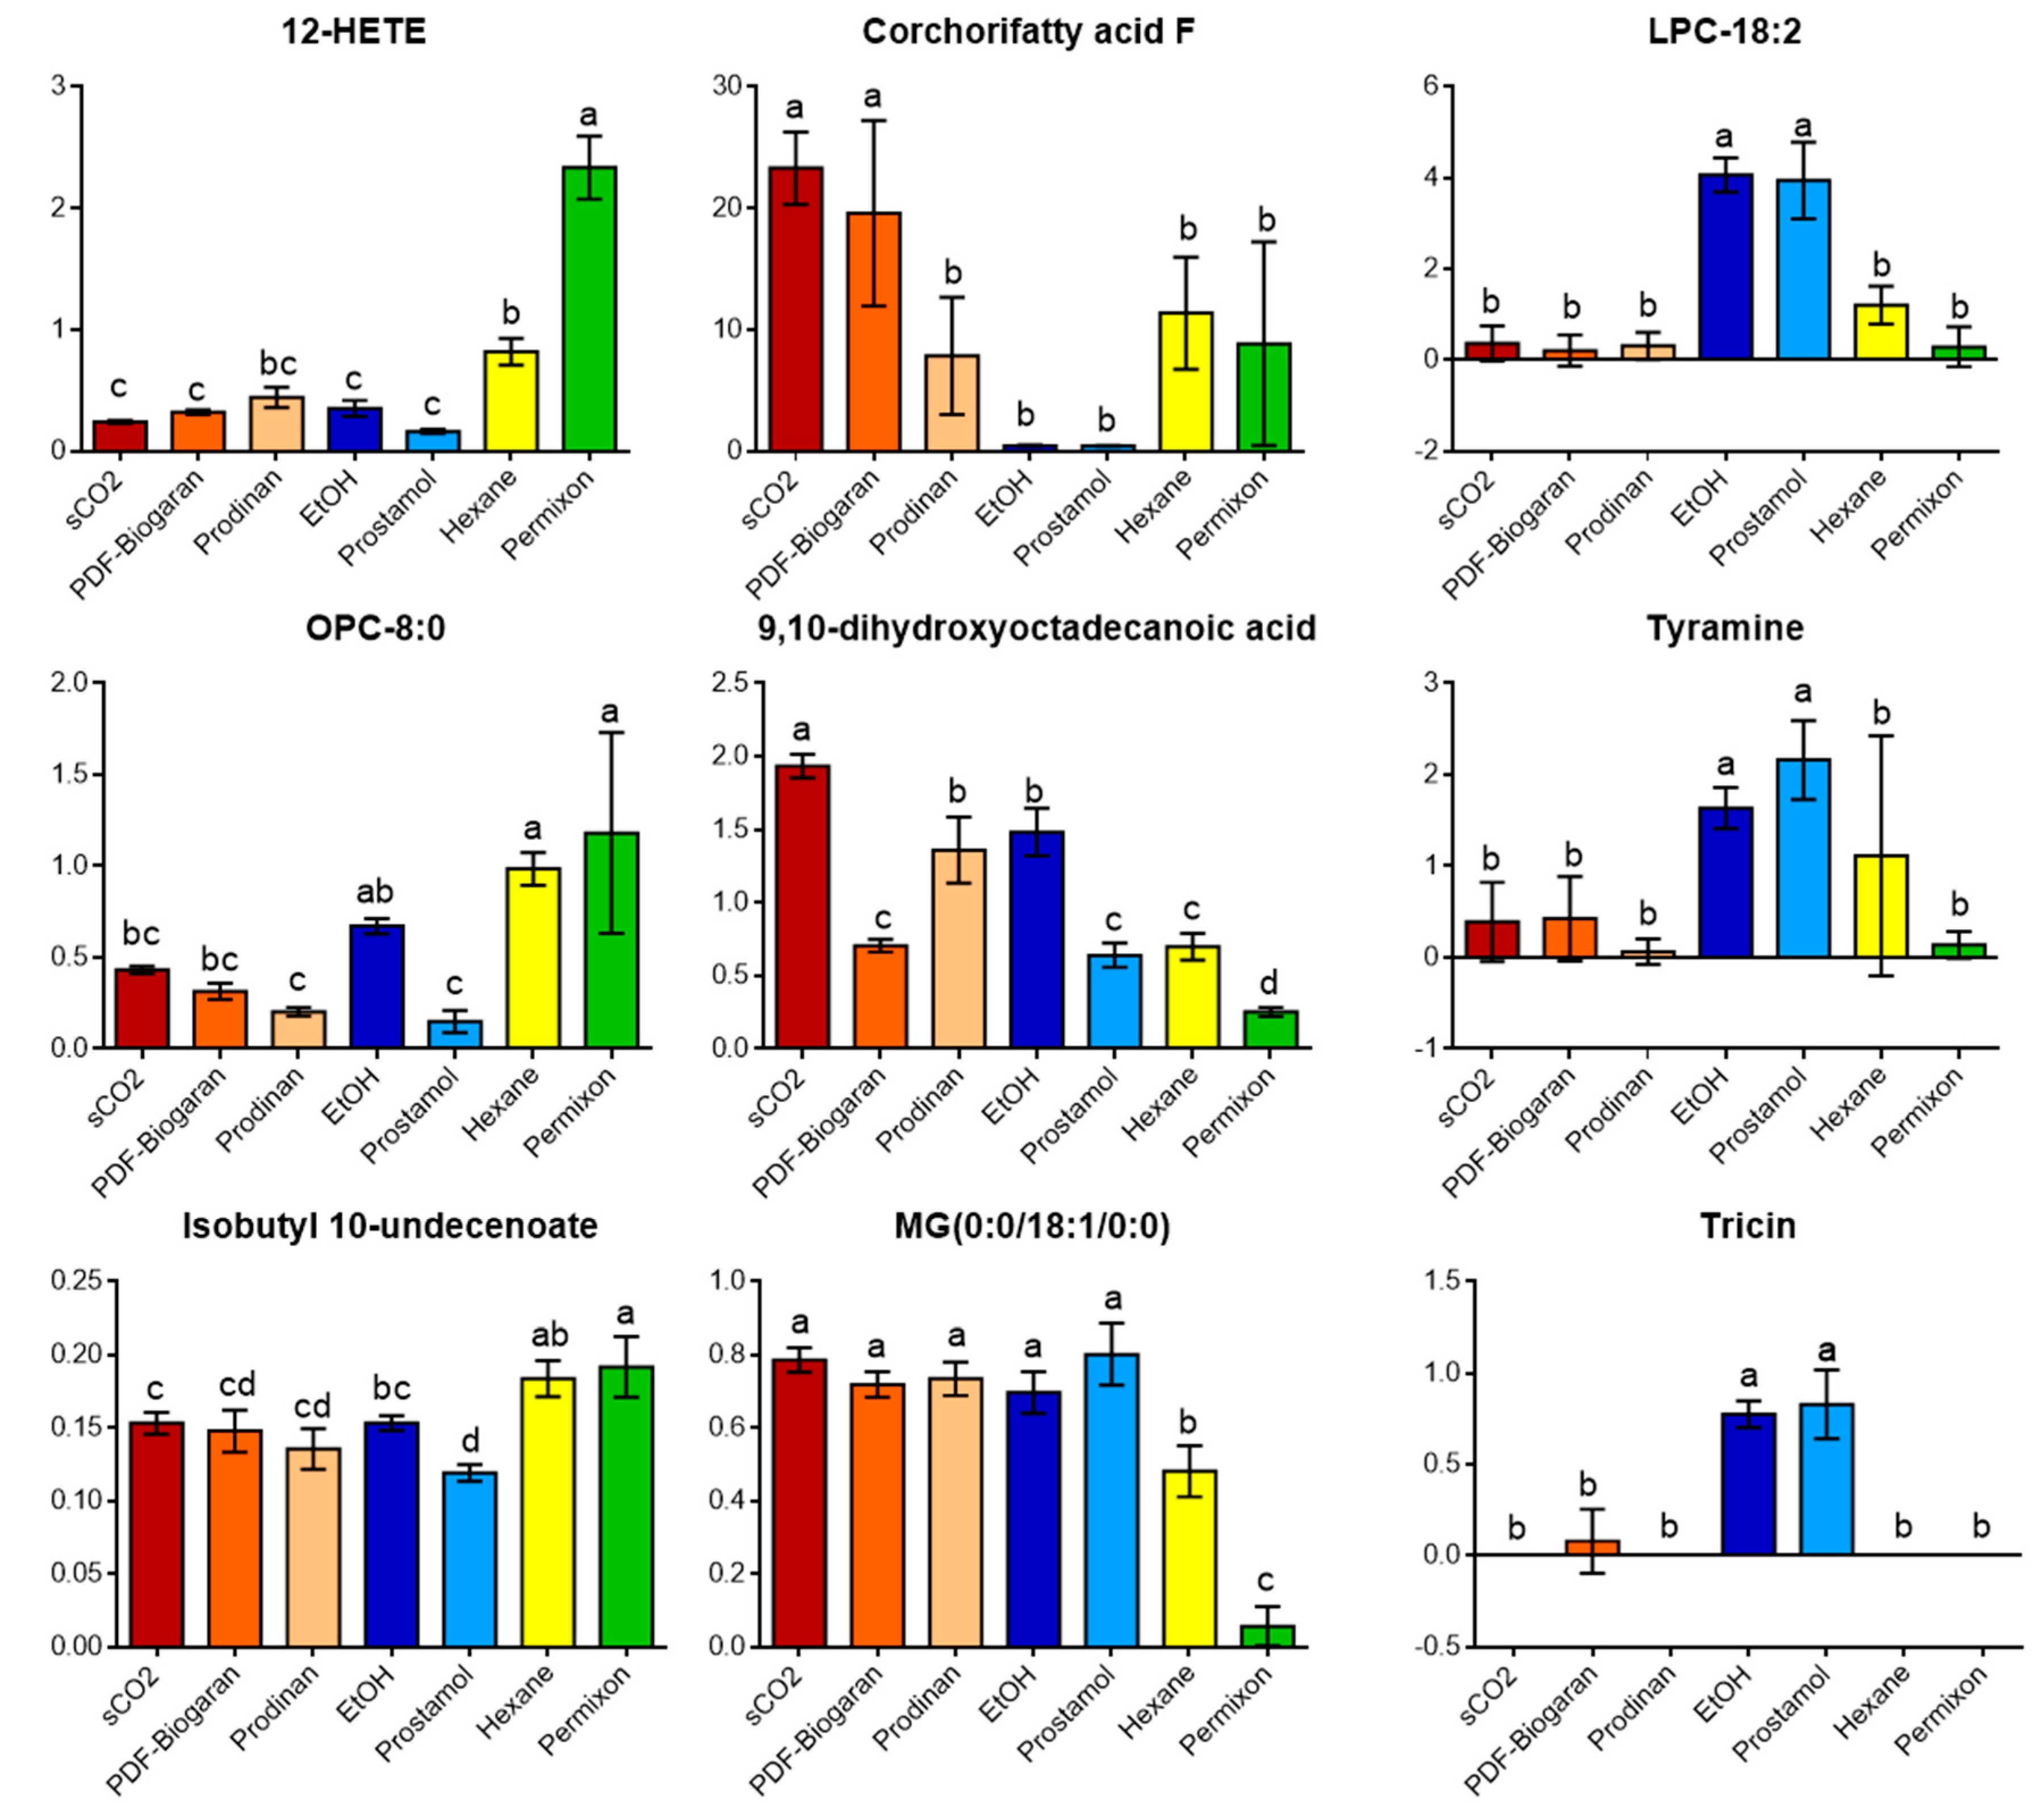
2.3. Annotated Biomarkers of SrE Samples
3. Discussion
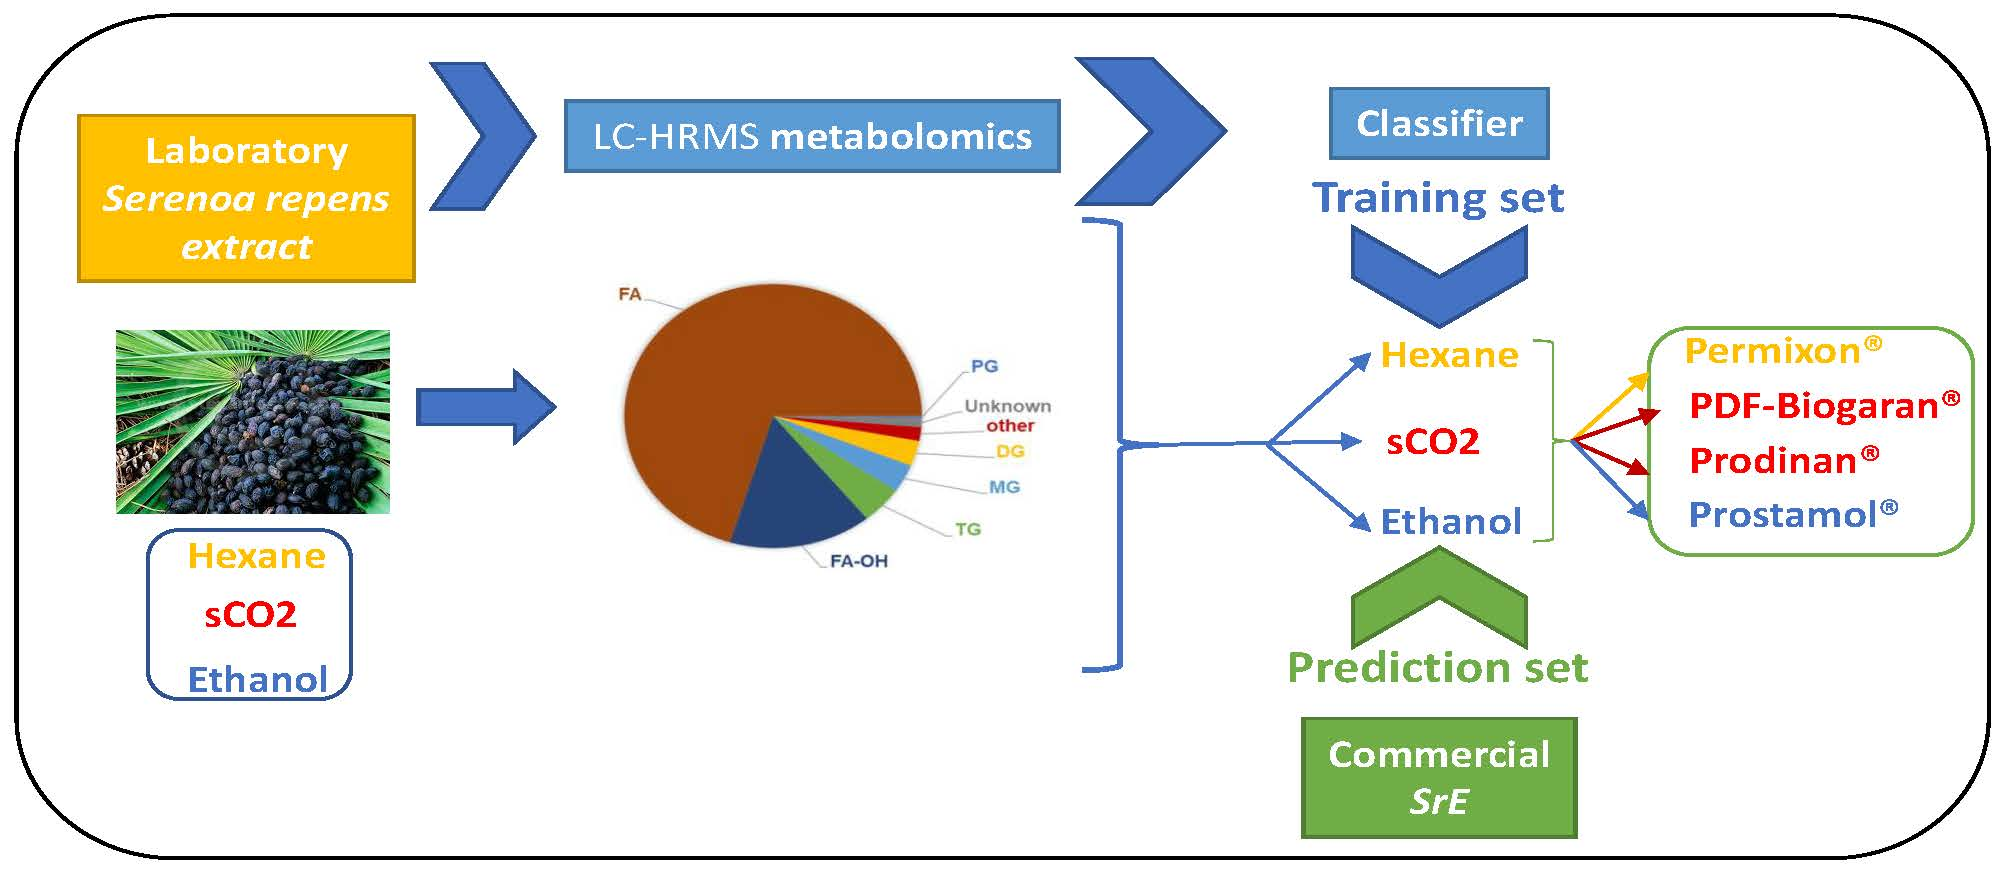
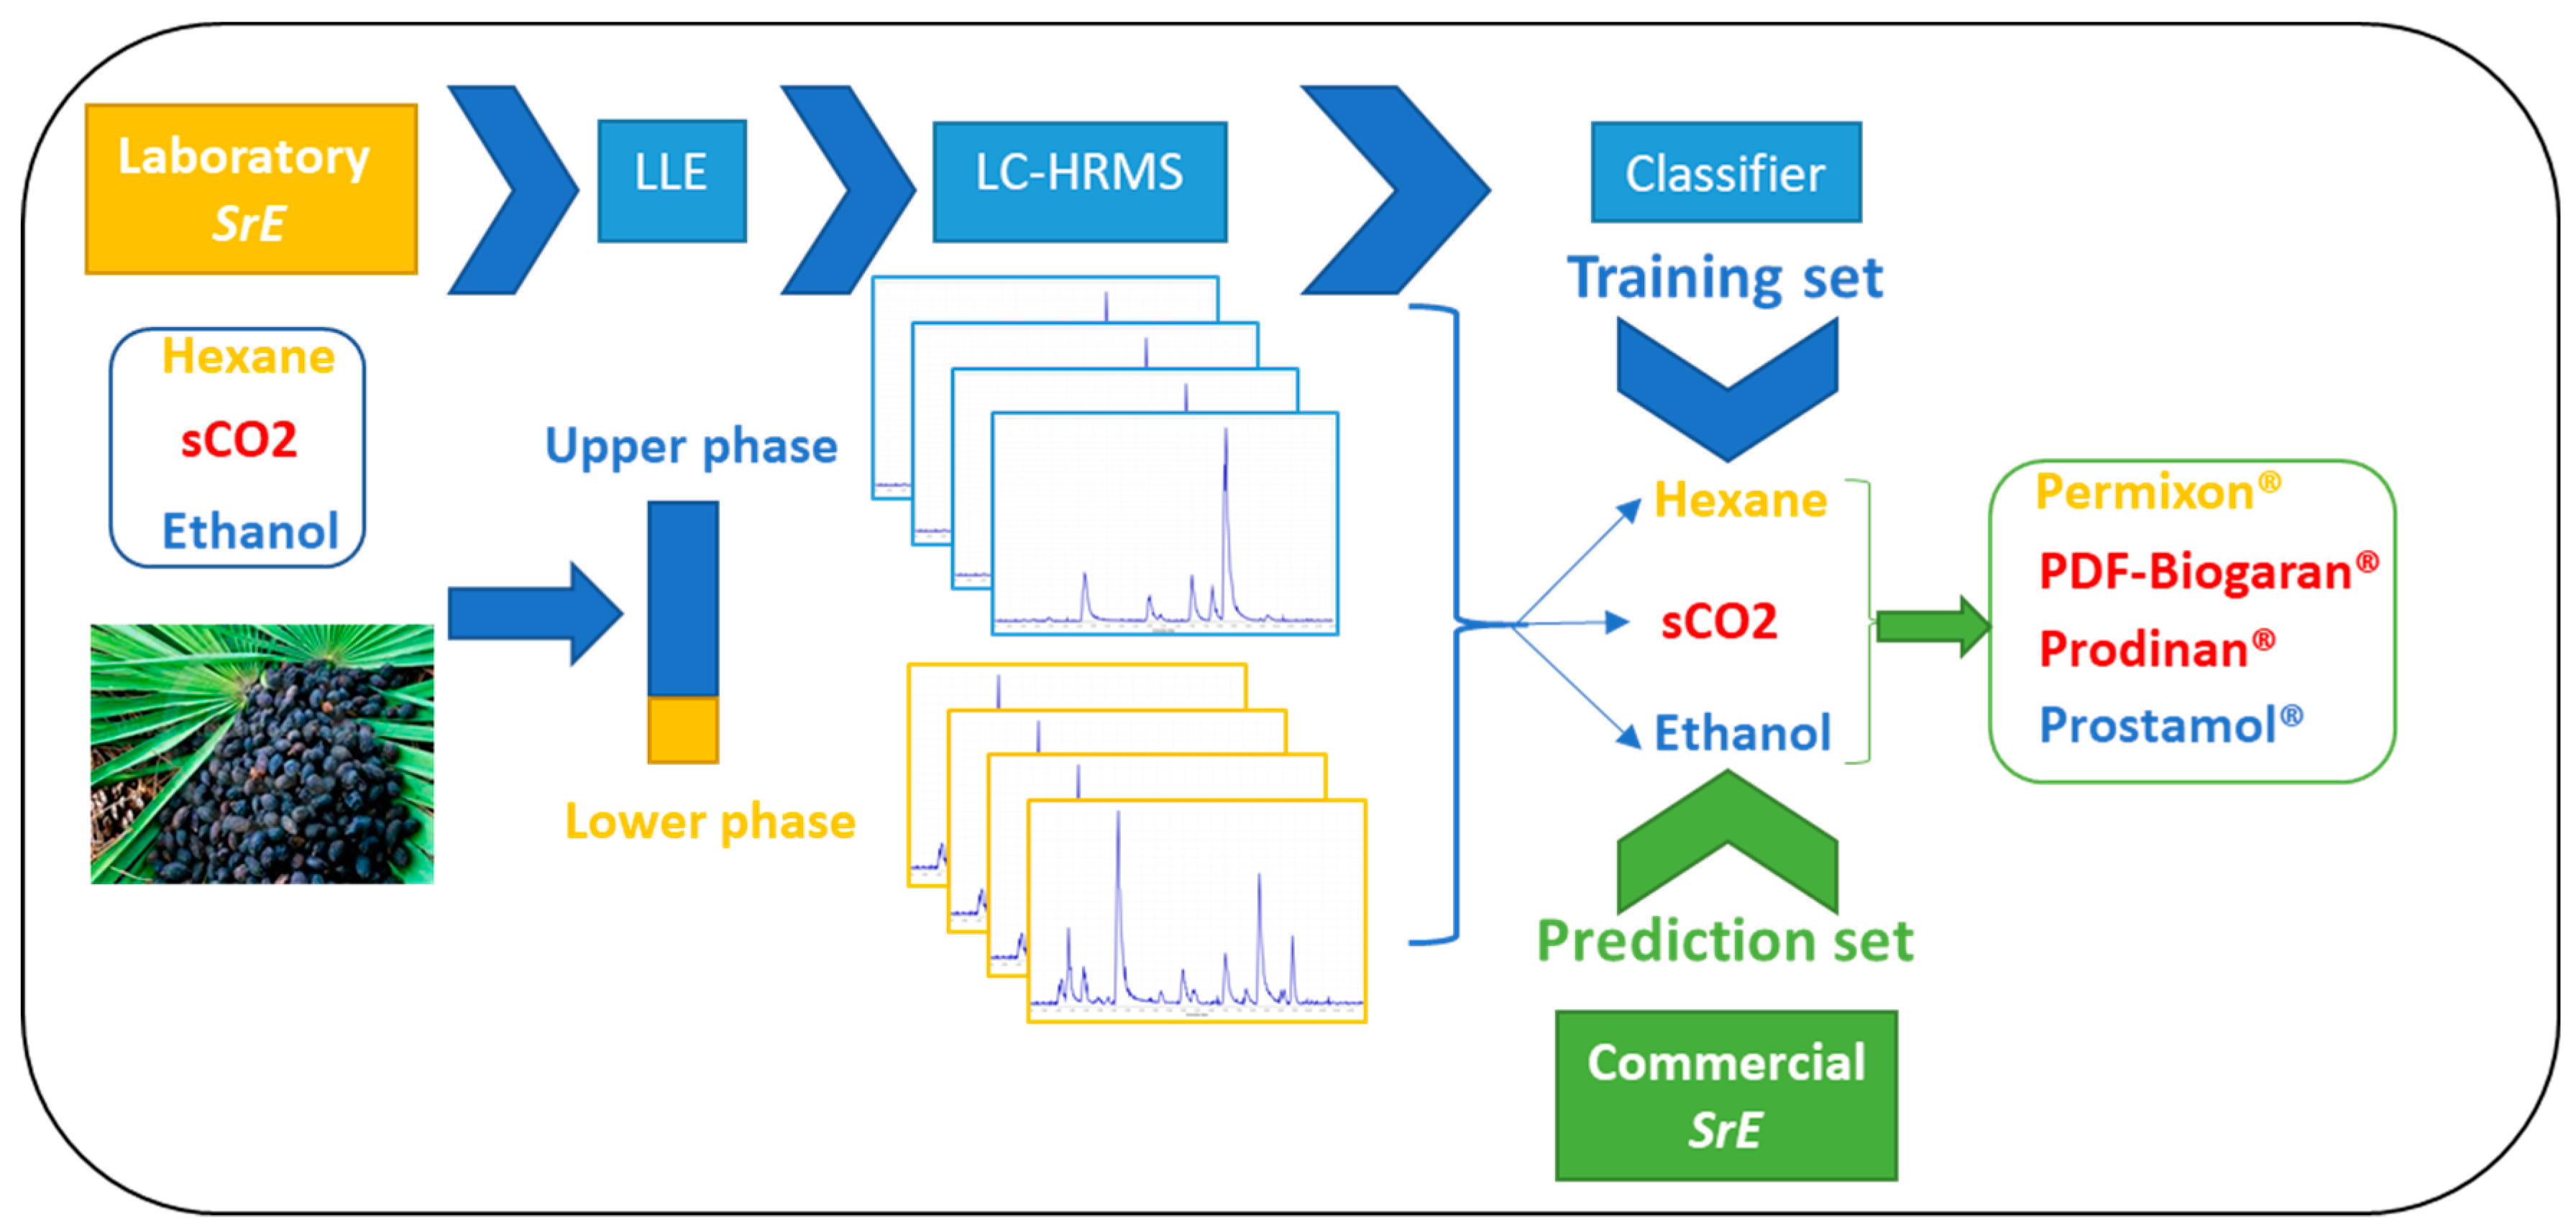
4. Materials and Methods
4.1. Sample Preparation
4.2. Ultra-High-Performance Liquid Chromatography-Orbitrap Analysis
4.3. Data Processing
4.4. Statistical Analysis
5. Conclusions
Supplementary Materials
Author Contributions
Funding
Acknowledgments
Conflicts of Interest
References
- Bijttebier, S.; Van der Auwera, A.; Foubert, K.; Voorspoels, S.; Pieters, L.; Apers, S. Bridging the gap between comprehensive extraction protocols in plant metabolomics studies and method validation. Anal. Chim. Acta 2016, 935, 136–150. [Google Scholar] [CrossRef] [PubMed]
- Guldbrandsen, N.; Kostidis, S.; Schäfer, H.; De Mieri, M.; Spraul, M.; Skaltsounis, A.-L.; Mikros, E.; Hamburger, M. NMR-Based metabolomic study on Isatis tinctoria: Comparison of different accessions, harvesting dates, and the effect of repeated harvesting. J. Nat. Prod. 2015, 78, 977–986. [Google Scholar] [CrossRef] [PubMed]
- Dhami, N.; Mishra, A.D. Phytochemical variation: How to resolve the quality controversies of herbal medicinal products? J. Herb. Med. 2015, 5, 118–127. [Google Scholar] [CrossRef]
- Anonymous. European Pharmacopoeia, 19th ed.; EDQM Council of Europe Editions: Strasbourg, France, 2019. [Google Scholar]
- World Health Organization (WHO). General guidelines for methodologies on research and Evaluation of traditional medicine. Available online: http://apps.who.int/medicinedocs/en/d/Jwhozip42e/ (accessed on 18 December 2018).
- Anonymous; FDA. Botanical Drug Development Guidance for Industry, Revision 1; Food and Drug Administration (FDA) Editions: Silver Spring, MD, USA, 2016; p. 34.
- Anonymous; European Medicines Agency (EMA). Guideline on Quality of Herbal Medicinal Products/Traditional Herbal Medicinal Products. 2011, p. 13. Available online: https://www.google.com/url?sa=t&rct=j&q=&esrc=s&source=web&cd=1&cad=rja&uact=8&ved=2ahUKEwjviuXbo-XiAhUnGaYKHXSWDGIQFjAAegQIARAC&url=https%3A%2F%2Fwww.ema.europa.eu%2Fen%2Fdocuments%2Fscientific-guideline%2Fguideline-quality-herbal-medicinal-products-traditional-herbal-medicinal-products_en.pdf&usg=AOvVaw394utajG77hTPkPhRWTH3H (accessed on 13 June 2019).
- Lee, E.-J.; Shaykhutdinov, R.; Weljie, A.M.; Vogel, H.J.; Facchini, P.J.; Park, S.-U.; Kim, Y.-K.; Yang, T.-J. Quality Assessment of Ginseng by 1H NMR metabolite fingerprinting and profiling analysis. J. Agric. Food Chem. 2009, 57, 7513–7522. [Google Scholar] [CrossRef] [PubMed]
- Chen, J.; Sun, S.; Zhou, Q. Infrared microspectroscopic identification of marker ingredients in the finished herbal products based on the inherent heterogeneity of natural medicines. Anal. Bioanal. Chem. 2014, 406, 4513–4525. [Google Scholar] [CrossRef] [PubMed]
- Chen, Y.; Zhu, S.-B.; Xie, M.-Y.; Nie, S.-P.; Liu, W.; Li, C.; Gong, X.-F.; Wang, Y.-X. Quality control and original discrimination of Ganoderma lucidum based on high-performance liquid chromatographic fingerprints and combined chemometrics methods. Anal. Chim. Acta 2008, 623, 146–156. [Google Scholar] [CrossRef] [PubMed]
- Mais, E.; Alolga, R.N.; Wang, S.-L.; Linus, L.O.; Yin, X.; Qi, L.-W. A Comparative UPLC-Q/TOF-MS-based Metabolomics approach for distinguishing Zingiber officinale Roscoe of two geographical origins. Food Chem. 2017, 240, 239–244. [Google Scholar] [CrossRef] [PubMed]
- Lee, G.J.; Lee, J.H.; Park, J.H.; Kwon, S.W.; Lim, J.; Lee, S.; Lee, J. Assessment of chemical equivalence in herbal materials using chromatographic fingerprints by combination of three similarity indices and three-dimensional kernel density estimation. Anal. Chim. Acta 2018, 1037, 220–229. [Google Scholar] [CrossRef]
- Wolfender, J.-L.; Marti, G.; Thomas, A.; Bertrand, S. Current approaches and challenges for the metabolite profiling of complex natural extracts. J. Chromatogr. A 2015, 1382, 136–164. [Google Scholar] [CrossRef]
- Mehl, F.; Marti, G.; Boccard, J.; Debrus, B.; Merle, P.; Delort, E.; Baroux, L.; Raymo, V.; Velazco, M.I.; Sommer, H.; et al. Differentiation of lemon essential oil based on volatile and non-volatile fractions with various analytical techniques: A metabolomic approach. Food Chem. 2014, 143, 325–335. [Google Scholar] [CrossRef]
- Booker, A.; Suter, A.; Krnjic, A.; Strassel, B.; Zloh, M.; Said, M.; Heinrich, M. A phytochemical comparison of Saw palmetto products using gas chromatography and 1H nuclear magnetic resonance spectroscopy metabolomic profiling: Saw palmetto—Metabolomic profiling. J. Pharm. Pharmacol. 2014, 811–822. [Google Scholar]
- de Combarieu, E.; Martinelli, E.M.; Pace, R.; Sardone, N. Metabolomics study of Saw palmetto extracts based on 1H NMR spectroscopy. Fitoterapia 2015, 102, 56–60. [Google Scholar] [CrossRef] [PubMed]
- Cristoni, A.; Morazzoni, P.; Bombardelli, E. Chemical and pharmacological study on hypercritical CO2 extracts of Serenoa repens fruits. Fitoterapia 1997, 68, 355–358. [Google Scholar]
- Geavlete, P.; Multescu, R.; Geavlete, B. Serenoa repens extract in the treatment of benign prostatic hyperplasia. Ther. Adv. Urol. 2011, 3, 193–198. [Google Scholar] [CrossRef] [PubMed]
- Anonymous; WHO. Monographs on Selected Medicinal Plants—Volume 2: Fructus Serenoae repentis. Available online: http://apps.who.int/medicinedocs/en/d/Js4927e/28.html (accessed on 22 December 2018).
- Abe, M.; Ito, Y.; Suzuki, A.; Onoue, S.; Noguchi, H.; Yamada, S. Isolation and pharmacological characterization of fatty acids from Saw palmetto extract. Anal. Sci. 2009, 25, 553–557. [Google Scholar] [CrossRef] [PubMed]
- Bedner, M.; Schantz, M.M.; Sander, L.C.; Sharpless, K.E. Development of liquid chromatographic methods for the determination of phytosterols in standard reference materials containing Saw palmetto. J. Chromatogr. A 2008, 1192, 74–80. [Google Scholar] [CrossRef] [PubMed]
- Hatinguais, P.; Belle, R.; Basso, Y.; Ribet, J.-P.; Bauer, M.; Pousset, J. Composition of the hexane extract from Serenoa repens fruit. Trav. Soc. Pharm. Montpellier 1981, 41, 253–262. [Google Scholar]
- Rösler, T.; Matusch, R.; Weber, B.; Schwarze, B. Analysis of the hydrodistillate from the fruits of Serenoa repens. Planta Med. 2009, 75, 184–186. [Google Scholar] [CrossRef]
- Schantz, M.M.; Bedner, M.; Long, S.E.; Molloy, J.L.; Murphy, K.E.; Porter, B.J.; Putzbach, K.; Rimmer, C.A.; Sander, L.C.; Sharpless, K.E.; et al. Development of saw palmetto (Serenoa repens) fruit and extract standard reference materials. Anal. Bioanal. Chem. 2008, 392, 427–438. [Google Scholar] [CrossRef]
- Anonymous; WHO. WHO Monographs on Selected Medicinal Plants; World Health Organization publications: Geneva, Switzerland, 2004; Volume 2, p. 285. [Google Scholar]
- Anonymous; Committee on Herbal Medicinal Products (HMBPC). European Union Herbal Monograph on Serenoa repens (W. Bartram) Small, Fructus; 280079/2013; European Medicines Agency (EMA) Editions: London, UK, 2014. [Google Scholar]
- Wolfender, J.-L.; Nuzillard, J.-M.; van der Hooft, J.J.J.; Renault, J.-H.; Bertrand, S. Accelerating metabolite identification in natural product research: Toward an ideal combination of liquid chromatography—High-resolution tandem mass spectrometry and NMR profiling, in silico Databases, and Chemometrics. Anal. Chem. 2018, 91, 704–742. [Google Scholar] [CrossRef]
- Creek, D.J.; Dunn, W.B.; Fiehn, O.; Griffin, J.L.; Hall, R.D.; Lei, Z.; Mistrik, R.; Neumann, S.; Schymanski, E.L.; Sumner, L.W.; et al. Metabolite identification: Are you sure? And how do your peers gauge your confidence? Metabolomics 2014, 10, 350–353. [Google Scholar] [CrossRef]
- Bombardelli, E.; Morazzoni, P. Serenoa repens (Bartram) JK Small. Fitoterapia 1997, 68, 99–113. [Google Scholar]
- Scaglione, F.; Lucini, V.; Pannacci, M.; Caronno, A.; Leone, C. Comparison of the potency of different brands of Serenoa repens extract on 5-alpha-reductase types I and II in prostatic co-cultured epithelial and fibroblast cells. Pharmacology 2008, 82, 270–275. [Google Scholar] [CrossRef] [PubMed]
- Habib, F.K.; Wyllie, M.G. Not all brands are created equal: A comparison of selected components of different brands of Serenoa repens extract. Prostate Cancer Prostatic Dis. 2004, 7, 195–200. [Google Scholar] [CrossRef] [PubMed]
- Chua, T.; Simpson, J.S.; Ventura, S. Ethanol extracts of Saw palmetto contain the indirectly acting sympathomimetic: Tyramine. Prostate 2011, 71, 71–80. [Google Scholar] [CrossRef] [PubMed]
- Bubrick, P.; Johnson, P.; Stonebrook, K. Saw palmetto: Critical review, chemistry, and application. In Phytochemicals as Bioactive Agents; Technomic Publishing Company: Lancaster, PA, USA, 2000; Chapter 11; pp. 189–197. [Google Scholar]
- Tsugawa, H.; Cajka, T.; Kind, T.; Ma, Y.; Higgins, B.; Ikeda, K.; Kanazawa, M.; VanderGheynst, J.; Fiehn, O.; Arita, M. MS-DIAL: Data-independent MS/MS deconvolution for comprehensive metabolome analysis. Nat. Methods 2015, 12, 523–526. [Google Scholar] [CrossRef]
- Tsugawa, H.; Kind, T.; Nakabayashi, R.; Yukihira, D.; Tanaka, W.; Cajka, T.; Saito, K.; Fiehn, O.; Arita, M. Hydrogen rearrangement rules: Computational MS/MS fragmentation and structure elucidation using MS-FINDER software. Anal. Chem. 2016, 88, 7946–7958. [Google Scholar] [CrossRef] [PubMed]
- Tsugawa, H.; Nakabayashi, R.; Mori, T.; Yamada, Y.; Takahashi, M.; Rai, A.; Sugiyama, R.; Yamamoto, H.; Nakaya, T.; Yamazaki, M.; et al. A cheminformatics approach to characterize metabolomes in stable-isotope-labeled organisms. Nat. Methods 2019, 16, 295–298. [Google Scholar] [CrossRef]
- Calderón-Santiago, M.; Fernández-Peralbo, M.A.; Priego-Capote, F.; Luque de Castro, M.D. MSCombine: A tool for merging untargeted metabolomic data from high-resolution mass spectrometry in the positive and negative ionization modes. Metabolomics 2016, 12, 43. [Google Scholar] [CrossRef]
- Demsar, J.; Curk, T.; Erjavec, A.; Demsar, J.; Curk, T.; Erjave, A.; Gorup, C.; Hocevar, T.; Milutinovic, M.; Mozina, M.; et al. Orange: Data mining toolbox in Python. J. Mach. Learn. Res. 2013, 14, 2349–2353. [Google Scholar]
- Chong, J.; Soufan, O.; Li, C.; Caraus, I.; Li, S.; Bourque, G.; Wishart, D.S.; Xia, J. MetaboAnalyst 4.0: Towards more transparent and integrative metabolomics analysis. Nucleic Acids Res. 2018, 46, W486–W494. [Google Scholar] [CrossRef] [PubMed]
Sample Availability: Raw data files were deposited in the MassIVE data repository and are available for reviewer at the following address: ftp://[email protected], login: MSV000083467_reviewer; password: serenoa. |


© 2019 by the authors. Licensee MDPI, Basel, Switzerland. This article is an open access article distributed under the terms and conditions of the Creative Commons Attribution (CC BY) license (http://creativecommons.org/licenses/by/4.0/).
Share and Cite
Marti, G.; Joulia, P.; Amiel, A.; Fabre, B.; David, B.; Fabre, N.; Fiorini-Puybaret, C. Comparison of the Phytochemical Composition of Serenoa repens Extracts by a Multiplexed Metabolomic Approach. Molecules 2019, 24, 2208. https://doi.org/10.3390/molecules24122208
Marti G, Joulia P, Amiel A, Fabre B, David B, Fabre N, Fiorini-Puybaret C. Comparison of the Phytochemical Composition of Serenoa repens Extracts by a Multiplexed Metabolomic Approach. Molecules. 2019; 24(12):2208. https://doi.org/10.3390/molecules24122208
Chicago/Turabian StyleMarti, Guillaume, Philippe Joulia, Aurélien Amiel, Bernard Fabre, Bruno David, Nicolas Fabre, and Christel Fiorini-Puybaret. 2019. "Comparison of the Phytochemical Composition of Serenoa repens Extracts by a Multiplexed Metabolomic Approach" Molecules 24, no. 12: 2208. https://doi.org/10.3390/molecules24122208