Tissue Distribution and Anti-Lung Cancer Effect of 10-Hydroxycamptothecin Combined with Platycodonis Radix and Glycyrrhizae Radix ET Rhizoma

 , and
, and
Abstract
: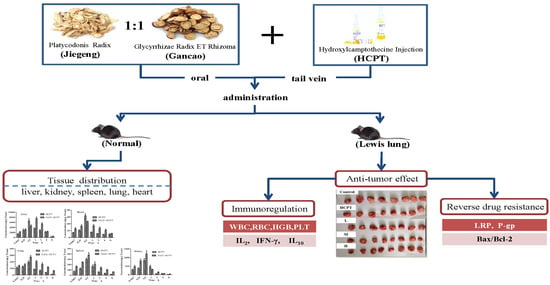
1. Introduction
2. Results and Discussions
2.1. UHPLC-ESI MS/MS Method Validation
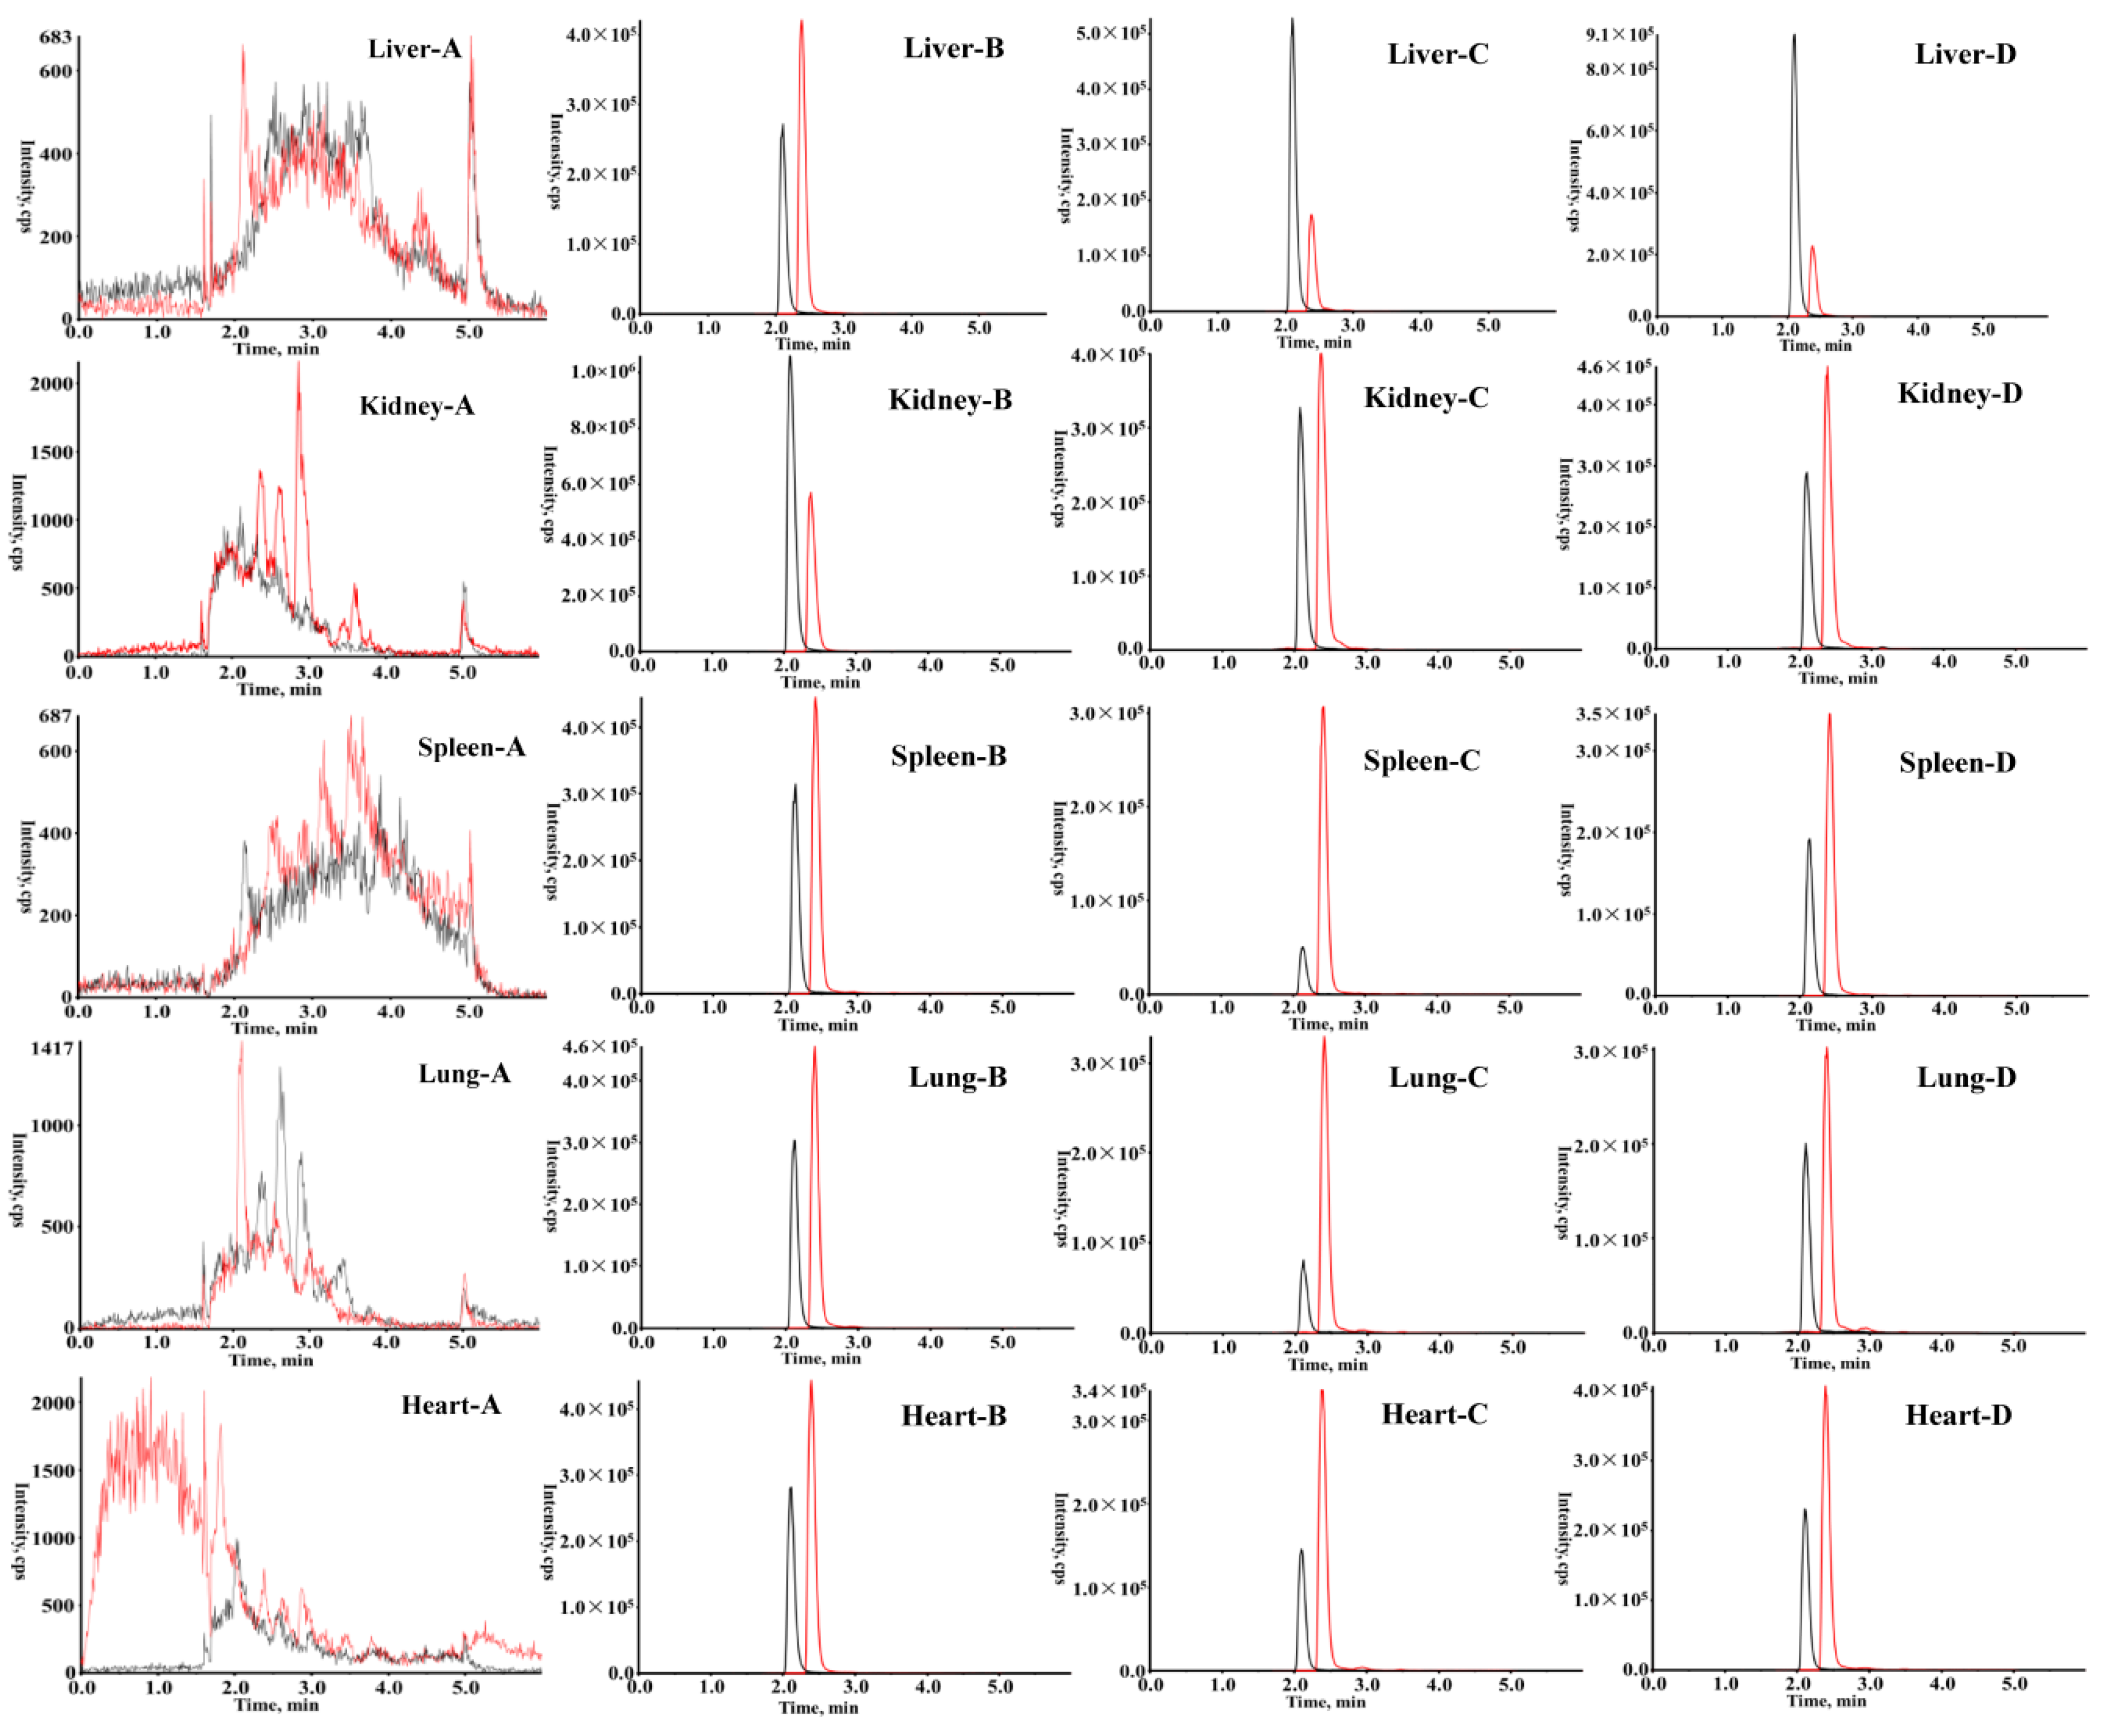
2.2. Tissue Distribution Study
2.3. Effect of JGGC and HCPT on the Growth of Tumors in a Lewis Lung Carcinoma Mouse Model.
2.4. JGGC Enhanced the Chemotoxicity of HCPT Through Inhibition of Protein Expression of LRP and P-gp
2.5. JGGC Enhanced the Chemotoxicity of HCPT Through promotion of Apoptosis
2.6. Effect of the Combination of JGGC and HCPT on Blood Parameters in Lewis Lung Carcinoma Mice
2.7. Effect of Combination of JGGC and HCPT on IL-2, IL-10, and IFN-γ Levels in Lewis Lung Carcinoma Mice
3. Materials and Methods
3.1. Chemicals and Reagents
3.2. Preparation of JGGC Extract
3.3. In Vivo Tissue Distribution
3.4. In Vivo Analysis of HCPT Using UHPLC-ESI MS/MS
3.5. Preparation of Standard Solutions and Quality Control (QC) Samples
3.6. Establishing Transplanted Lewis Lung Carcinoma Mouse Model.
3.7. Antitumor Effect of Combination of HCPT and JGGC Treatment
3.8. Immunoregulation Effect of JGGC on HCPT Therapy
3.9. Western Blotting
3.10. Statistical Analysis
4. Conclusions
Author Contributions
Funding
Conflicts of Interest
References
- Walls, M.E.; Wani, M.C.; Cook, C.E. Plant antitumor agent. 1. The isolation and structure of camptothecin, a novel alkaloidal leukemia and tumor inhibitor from camptothecaacumianta. J. Am. Chem. Soc. 1966, 88, 3888–3890. [Google Scholar] [CrossRef]
- Hsiang, Y.H.; Hertzberg, R.; Hecht, S.; Liu, L.F. Camptothecin induces protein linked DNA breaks via mammalian DNA topoisomerase-I. J. Biol. Chem. 1985, 260, 14873–14878. [Google Scholar] [PubMed]
- Hong, M.; Zhu, S.; Jiang, Y.; Tang, G.; Pei, Y. Efficient tumor targeting ofhydroxycamptothecin loaded PEGylatedniosomes modified with transferrin. J. Control. Release 2009, 133, 96–102. [Google Scholar] [CrossRef] [PubMed]
- Xu, H.W.; Cong, Y.Q.; Wang, W.Z.; Jiang, J.M.; Qin, C.K.; Qin, C.Y. Expressions of P-glycoprotein and multidrug resistance-associated protein correlate with chemosensitivity in vitro in gastric cancer. J. Shandong Univ. 2005, 43, 594–601. [Google Scholar]
- Pu, X.H.; Sun, J.; Qin, Y.M.; Zhang, X.; Zhang, P.; Zhong, G. Pharmaceutical evaluation of hydroxycamptothecin nanosuspensions with the action of inhibiting P-gp. Acta. Pharm. Sin. 2011, 46, 834–838. [Google Scholar]
- Jin, X.; Asghar, S.; Zhu, X.; Chen, Z.; Tian, C.; Yin, L.; Ping, Q.; Xiao, Y. In vitro and in vivoevaluation of 10-hydroxycamptothecin-loaded poly (n-butyl cyanoacrylate) nanoparticles prepared by miniemulsion polymerization. Colloids Surf. B Biointerfaces 2018, 162, 25–34. [Google Scholar] [CrossRef]
- Liu, Y.; Li, J.; Li, Z.; Tang, X.; Zhang, Z.Z. Pharmacokinetics of a ternary conjugate based pH-responsive 10-HCPT prodrug nano-micelle delivery system. Asian. J. Pharm. Sci. 2017, 12, 542–549. [Google Scholar] [CrossRef]
- Zhang, Y.F.; Wu, X.W.; Mi, Y.W.; Li, H.P.; Hou, W.G. Engineering of (10-hydroxycamptothecin intercalated layered double hydroxide) @liposome nanocomposites with excellent water dispersity. J. Phys. Chem. Solids 2017, 108, 125–132. [Google Scholar] [CrossRef]
- Lu, B.; Zhang, Z.Q. Novel colon-specific microspheres with highly dispersedhydroxycamptothecin cores: their preparation, release behavior, and therapeutic efficiency against colonic cancer. J. Pharm. Sci. 2006, 95, 2619–2630. [Google Scholar] [CrossRef]
- Shukla, S.K.; Shukla, S.K.; Govender, P.P.; Giri, N.G. Biodegradable polymeric nanostructures in therapeutic applications: opportunities and challenges. RSC Adv. 2016, 6, 94325–94351. [Google Scholar] [CrossRef]
- Liu, Z.; Li, H.; Fan, Y.; Liu, Y.; Man, S.; Yu, P.; Gao, W. Combination treatment with RhizomaParidis and Rhizoma Curcumalonga extracts and 10-hydroxycamptothecin enhances the antitumoreffect in H22 tumor model by increasing the plasma concentration. Biomed. Pharmacother. 2016, 83, 627–634. [Google Scholar] [CrossRef] [PubMed]
- Wu, J.N.; Han, X.H.; Ye, Y.Y.; Huang, M.; Liu, S. Effect of platycodon in combination with different active ingredients of Chinese herbs on lung metastasis of breast cancer. Oncol. Prog. 2013, 11, 159–167. [Google Scholar]
- Han, X.H.; Ye, Y.Y.; Guo, B.F.; Liu, S. Effects of platycodin D in combination with different active ingredients of Chinese herbs on proliferation and invasion of 4T1 and MDA-MB-231breast cancer cell lines. J. Chin. Integr. Med. 2012, 10, 67–75. [Google Scholar] [CrossRef]
- Shen, H.S.; Wen, S.H. Effect of early use of Chinese herbal products on mortality rate in patients with lung cancer. J. Ethnopharmacol. 2018, 211, 1–8. [Google Scholar] [CrossRef]
- Luo, Y.Q.; Li, Q. The curative effect of Modified ShenlingBaizhu Decoction in thetreatment of bone metastases from lung cancer and its mechanism. World Chin. Med. 2016, 11, 1261–1264. [Google Scholar]
- Huang, W.; Xiong, W.; Tang, C.; Mao, X.H.; Zhang, X.D. Influence of Platycodonis Radix and Achyranthis Bidentatae Radix in XuefuZhuyu Tang on tissue distribution of Paeoniflorin. Chin. J. Exp. Tradit. Med. Form. 2015, 21, 85–88. [Google Scholar]
- Xu, C.H.; Wang, P.; Wang, Y.; Yang, Y.; Li, D.H.; Li, H.F.; Sun, S.Q.; Wu, X.Z. Pharmacokinetic comparisons of two different combinations of Shaoyao-Glycyrrhizae Radix ET Rhizoma Decoction in rats: Competing mechanisms between paeoniflorin and glycyrrhetinic acid. J. Ethnopharmacol. 2013, 149, 443–452. [Google Scholar] [CrossRef]
- Amiri-Kordestani, L.; Basseville, A.; Kurdziel, K.; Fojo, A.T.; Bates, S.E. Targeting MDR in breast and lung cancer: Discriminating its potential importance from the failure of drug resistance reversal studies. Drug Resist. Update 2012, 15, 50–61. [Google Scholar] [CrossRef] [PubMed] [Green Version]
- De Vera, A.A.; Gupta, P.; Lei, Z.N.; Liao, D.; Narayanan, S.; Teng, Q.X.; Reznik, S.E.; Chen, Z.S. Immuno-oncology agent IPI-549 is a modulator of P-glycoprotein (P-gp, MDR1, ABCB1)-mediated multidrug resistance (MDR) in cancer: In vitro and in vivo. Cancer Lett. 2019, 442, 91–103. [Google Scholar] [CrossRef]
- Zhang, Y.; Yang, S.H.; Guo, X.L. New insights into Vinca alkaloids resistance mechanism and circumvention in lung cancer. Biomed.Pharmacother. 2017, 96, 659–666. [Google Scholar] [CrossRef]
- Li, Y.; Xia, Q.; Zhao, R.Z.; Deng, S.G. Effects of platycodon grandiflorum on the distribution of cisplatinin orthotopic lung cancer transplantation of nude mice. Pharmacol. Clin. Chin. Mater. Clin. Med. 2018, 34, 71–75. [Google Scholar]
- Satoh, T.; Watanabe, Y.; Ikarashi, N.; Ito, K.; Sugiyama, K. Effects of Kampomedicines on P-glycoprotein. Biol. Pharm. Bull. 2009, 32, 2018–2021. [Google Scholar] [CrossRef]
- Yang, Y.; Zhang, Z.; Li, S.; Ye, X.; Li, X.; He, K. Synergy effects of herb extracts: Pharmacokinetics and pharmacodynamic basis. Fitoterapia 2014, 92, 133–147. [Google Scholar] [CrossRef]
- Flavell, R.A.; Sanjabi, S.; Wrzesinski, S.H.; Licona-Limón, P. The polarization of immune cells in the tumour environment by TGF. Nat. Rev. Immunol. 2010, 10, 554–567. [Google Scholar] [CrossRef]
- Mateu-Jimenez, M.; Curull, V.; Pijuan, L.; Sánchez-Font, A.; Rivera-Ramos, H.; Rodríguez-Fuster, A.; Aguiló, R.; Gea, J.; Barreiro, E. Systemic and Tumor Th1 and Th2 Inflammatory Profile and Macrophages in Lung Cancer: Influence of Underlying Chronic Respiratory Disease. J. Thorac. Oncol. 2016, 12, 235–248. [Google Scholar] [CrossRef]
- Zhou, X.; Liu, Z.J.; Long, T.T.; Zhou, L.J.; Bao, Y.X. Immunomodulatory effects of herbal formula of astragaluspolysaccharide (APS) and polysaccharopeptide (PSP) in mice with lung cancer. Int. J. Biol. Macromol. 2018, 106, 596–601. [Google Scholar] [CrossRef] [PubMed]
Sample Availability: Samples of the compounds are available from the authors. |


| Linear Regression Equation | R | Linear Range (ng/mL) | |
|---|---|---|---|
| Heart | y = 0.00664x + 0.0017 | 0.9980 | 1–500 |
| Liver | y = 0.00519x + 0.0232 | 0.9983 | 5–2000 |
| Spleen | y = 0.00681x + 0.00263 | 0.9995 | 1–500 |
| Lung | y = 0.00653x + 0.0131 | 0.9978 | 1–500 |
| Kidney | y = 0.00375x + 0.00666 | 0.9965 | 1–1000 |
| Type of Matrics | Concentration (ng/mL) | Precision | Extraction Recovery (RSD, %) | |||
|---|---|---|---|---|---|---|
| Intraday (RSD, %) | (RE, %) | Interday (RSD, %) | (RE, %) | |||
| Heart | 5 | 8.85 | 9.6 | 8.21 | 10.0 | 78.75 ± 5.39 |
| 100 | 3.63 | 2.88 | 6.08 | 7.3 | 81.24 ± 3.38 | |
| 500 | 6.73 | −1.00 | 4.58 | 5.90 | 86.05 ± 5.76 | |
| Liver | 10 | 9.58 | −6.3 | 7.79 | 1.3 | 77.44 ± 5.08 |
| 100 | 5.7 | 8.76 | 4.63 | 4.03 | 83.21 ± 0.79 | |
| 1000 | 3.32 | 7.68 | 3.04 | 8.29 | 98.62 ± 2.04 | |
| Spleen | 5 | 2.08 | 3.6 | 2.28 | 4.00 | 80.15 ± 4.92 |
| 100 | 1.28 | −3.45 | 1.07 | 9.68 | 81.34 ± 6.54 | |
| 500 | 4.73 | 1.02 | 4.78 | −0.59 | 91.83 ± 4.33 | |
| Lung | 5 | 4.32 | 11.2 | 7.04 | 9.6 | 83.31 ± 4.11 |
| 100 | 6.65 | 7.16 | 6.72 | 4.79 | 97.99 ± 6.46 | |
| 500 | 6.78 | 5.27 | 5.06 | 7.32 | 101.44 ± 6.87 | |
| Kidney | 5 | 3.34 | −13.4 | 2.59 | −6.00 | 84.62 ± 4.59 |
| 100 | 5.87 | 7.79 | 6.86 | 10.43 | 92.08 ± 2.28 | |
| 500 | 4.38 | −4.64 | 7.83 | 11.45 | 90.75 ± 2.80 | |
| Type of Matric | Concentration (ng/mL) | Room Temperature for 8 h | Three Freeze-Thaw Cycles | −20 °C for 30 Days | |||
|---|---|---|---|---|---|---|---|
| RE (%) | RSD (%) | RE (%) | RSD (%) | RE (%) | RSD (%) | ||
| Heart | 5 | 4.54 | 1.62 | 7.85 | 5.61 | 14.23 | −6.07 |
| 100 | 4.86 | −12.32 | 5.69 | 3.99 | 5.21 | −7.57 | |
| 500 | 0.47 | −2.13 | 1.20 | −0.98 | 13.67 | −7.71 | |
| Liver | 10 | 12.56 | 3.59 | 8.77 | −1.31 | 4.92 | 8.33 |
| 100 | 3.05 | −3.16 | 0.56 | −9.82 | 7.08 | −7.12 | |
| 1000 | 3.50 | −12.90 | 2.82 | −10.84 | 6.31 | 0.76 | |
| Spleen | 5 | 9.45 | 5.31 | 2.28 | 9.43 | 5.35 | −3.63 |
| 100 | 10.43 | −2.44 | 7.78 | −3.04 | 1.09 | −13.70 | |
| 500 | 0.99 | −13.55 | 6.66 | −6.81 | 4.63 | −1.47 | |
| Lung | 5 | 6.30 | −3.30 | 2.19 | −0.87 | 3.84 | −3.19 |
| 100 | 8.01 | 5.48 | 2.06 | −6.26 | 14.78 | 2.70 | |
| 500 | 9.10 | 9.85 | 11.76 | −5.26 | 1.28 | −13.45 | |
| Kidney | 5 | 3.36 | 12.63 | 3.47 | 11.58 | 2.90 | 6.56 |
| 100 | 11.77 | 5.88 | 10.81 | 1.79 | 2.29 | 0.75 | |
| 500 | 7.22 | −1.64 | 3.30 | 10.09 | 0.06 | 6.94 | |
| Parameter | Heart | Liver | Spleen | Lung | Kidney | |||||
|---|---|---|---|---|---|---|---|---|---|---|
| HCPT | JGGC-HCPT | HCPT | JGGC-HCPT | HCPT | JGGC-HCPT | HCPT | JGGC-HCPT | HCPT | JGGC-HCPT | |
| AUC(0–t) (ug/L·h) | 34.31 ± 2.07 | 60.32 ± 10.97 * | 5728.64 ± 988.35 | 8140.07 ± 899.51 | 167.50 ± 20.57 | 334.21 ± 39.85 ** | 143.29 ± 9.47 | 346.07 ± 56.31 | 398.35 ± 79.36 | 497.01 ± 54.23 |
| Cmax (µg/L) | 21.32 ± 3.81 | 15.32 ± 1.28 * | 2243.29 ± 567.07 | 2508.75 ± 460.75 | 99.66 ± 19.86 | 136.27 ± 18.06 * | 66.48 ± 16.72 | 93.45 ± 16.22 * | 280.30 ± 94.01 | 405.78 ± 133.80 |
| T1/2 (h) | 4.04 ± 1.37 | 3.65 ± 1.31 | 1.71 ± 0.19 | 1.73 ± 0.24 | 2.53 ± 0.55 | 3.95 ± 1.6 | 2.87 ± 0.75 | 2.97 ± 0.56 | 2.083 ± 0.74 | 2.073 ± 1.069 |
| Tmax (h) | 0.5 | 0.5 | 0.5 | 1 | 0.5 | 0.6 ± 0.22 | 0.45 ± 0.11 | 0.6 ± 0.22 | 0.6 ± 0.224 | 0.45 ± 0.11 |
| CLz (L/h/kg) | 92.42 ± 12.57 | 53.18 ± 17.53 ** | 0.67 ± 0.11 | 0.46 ± 0.06 | 21.64 ± 3.20 | 9.07 ± 1.61 ** | 23.93 ± 2.57 | 9.85 ± 2.20 ** | 9.59 ± 1.79 | 7.39 ± 1.06 |
| MRT(0–t) (h) | 3.04 ± 0.2 | 3.05 ± 0.17 | 2.48 ± 0.15 | 2.42 ± 0.10 | 2.12 ± 0.21 | 2.85 ± 0.08 * | 2.34 ± 0.21 | 3.03 ± 0.19 ** | 2.18 ± 0.29 | 2.63 ± 1.03 |
| Group | Heart | Liver | Spleen | Lung | Kidney |
|---|---|---|---|---|---|
| Normal | 0.53 ± 0.05 | 3.96 ± 0.23 | 0.32 ± 0.04 | 0.70 ± 0.06 | 1.44 ± 0.06 |
| Control | 0.47 ± 0.07 | 4.38 ± 0.74 ## | 0.68 ± 0.11 ## | 0.68 ± 0.19 | 1.33 ± 0.12 |
| HCPT | 0.46 ± 0.04 | 4.37 ± 0.41 ## | 0.83 ± 0.21 ## | 0.63 ± 0.12 | 1.24 ± 0.07 |
| L | 0.46 ± 0.08 | 3.85 ± 0.36 ** | 0.83 ± 0.18 ## | 0.61 ± 0.07 | 1.25 ± 0.09 |
| M | 0.46 ± 0.07 | 3.91 ± 0.33 ** | 0.81 ± 0.09 ## | 0.59 ± 0.06 | 1.31 ± 0.08 |
| H | 0.45 ± 0.06 | 3.96 ± 0.37 ** | 0.79 ± 0.18 ## | 0.63 ± 0.12 | 1.31 ± 0.11 |
© 2019 by the authors. Licensee MDPI, Basel, Switzerland. This article is an open access article distributed under the terms and conditions of the Creative Commons Attribution (CC BY) license (http://creativecommons.org/licenses/by/4.0/).
Share and Cite
Zhang, W.; Li, M.; Du, W.; Yang, W.; Li, G.; Zhang, C.; Liang, X.; Chen, H. Tissue Distribution and Anti-Lung Cancer Effect of 10-Hydroxycamptothecin Combined with Platycodonis Radix and Glycyrrhizae Radix ET Rhizoma. Molecules 2019, 24, 2068. https://doi.org/10.3390/molecules24112068
Zhang W, Li M, Du W, Yang W, Li G, Zhang C, Liang X, Chen H. Tissue Distribution and Anti-Lung Cancer Effect of 10-Hydroxycamptothecin Combined with Platycodonis Radix and Glycyrrhizae Radix ET Rhizoma. Molecules. 2019; 24(11):2068. https://doi.org/10.3390/molecules24112068
Chicago/Turabian StyleZhang, Wugang, Mulan Li, Wendi Du, Wuliang Yang, Guofeng Li, Chen Zhang, Xinli Liang, and Haifang Chen. 2019. "Tissue Distribution and Anti-Lung Cancer Effect of 10-Hydroxycamptothecin Combined with Platycodonis Radix and Glycyrrhizae Radix ET Rhizoma" Molecules 24, no. 11: 2068. https://doi.org/10.3390/molecules24112068