Application of GC/MS-Based Metabonomic Profiling in Studying the Therapeutic Effects of Aconitum carmichaeli with Ampelopsis japonica Extract on Collagen-Induced Arthritis in Rats


Abstract
:
1. Introduction
2. Results
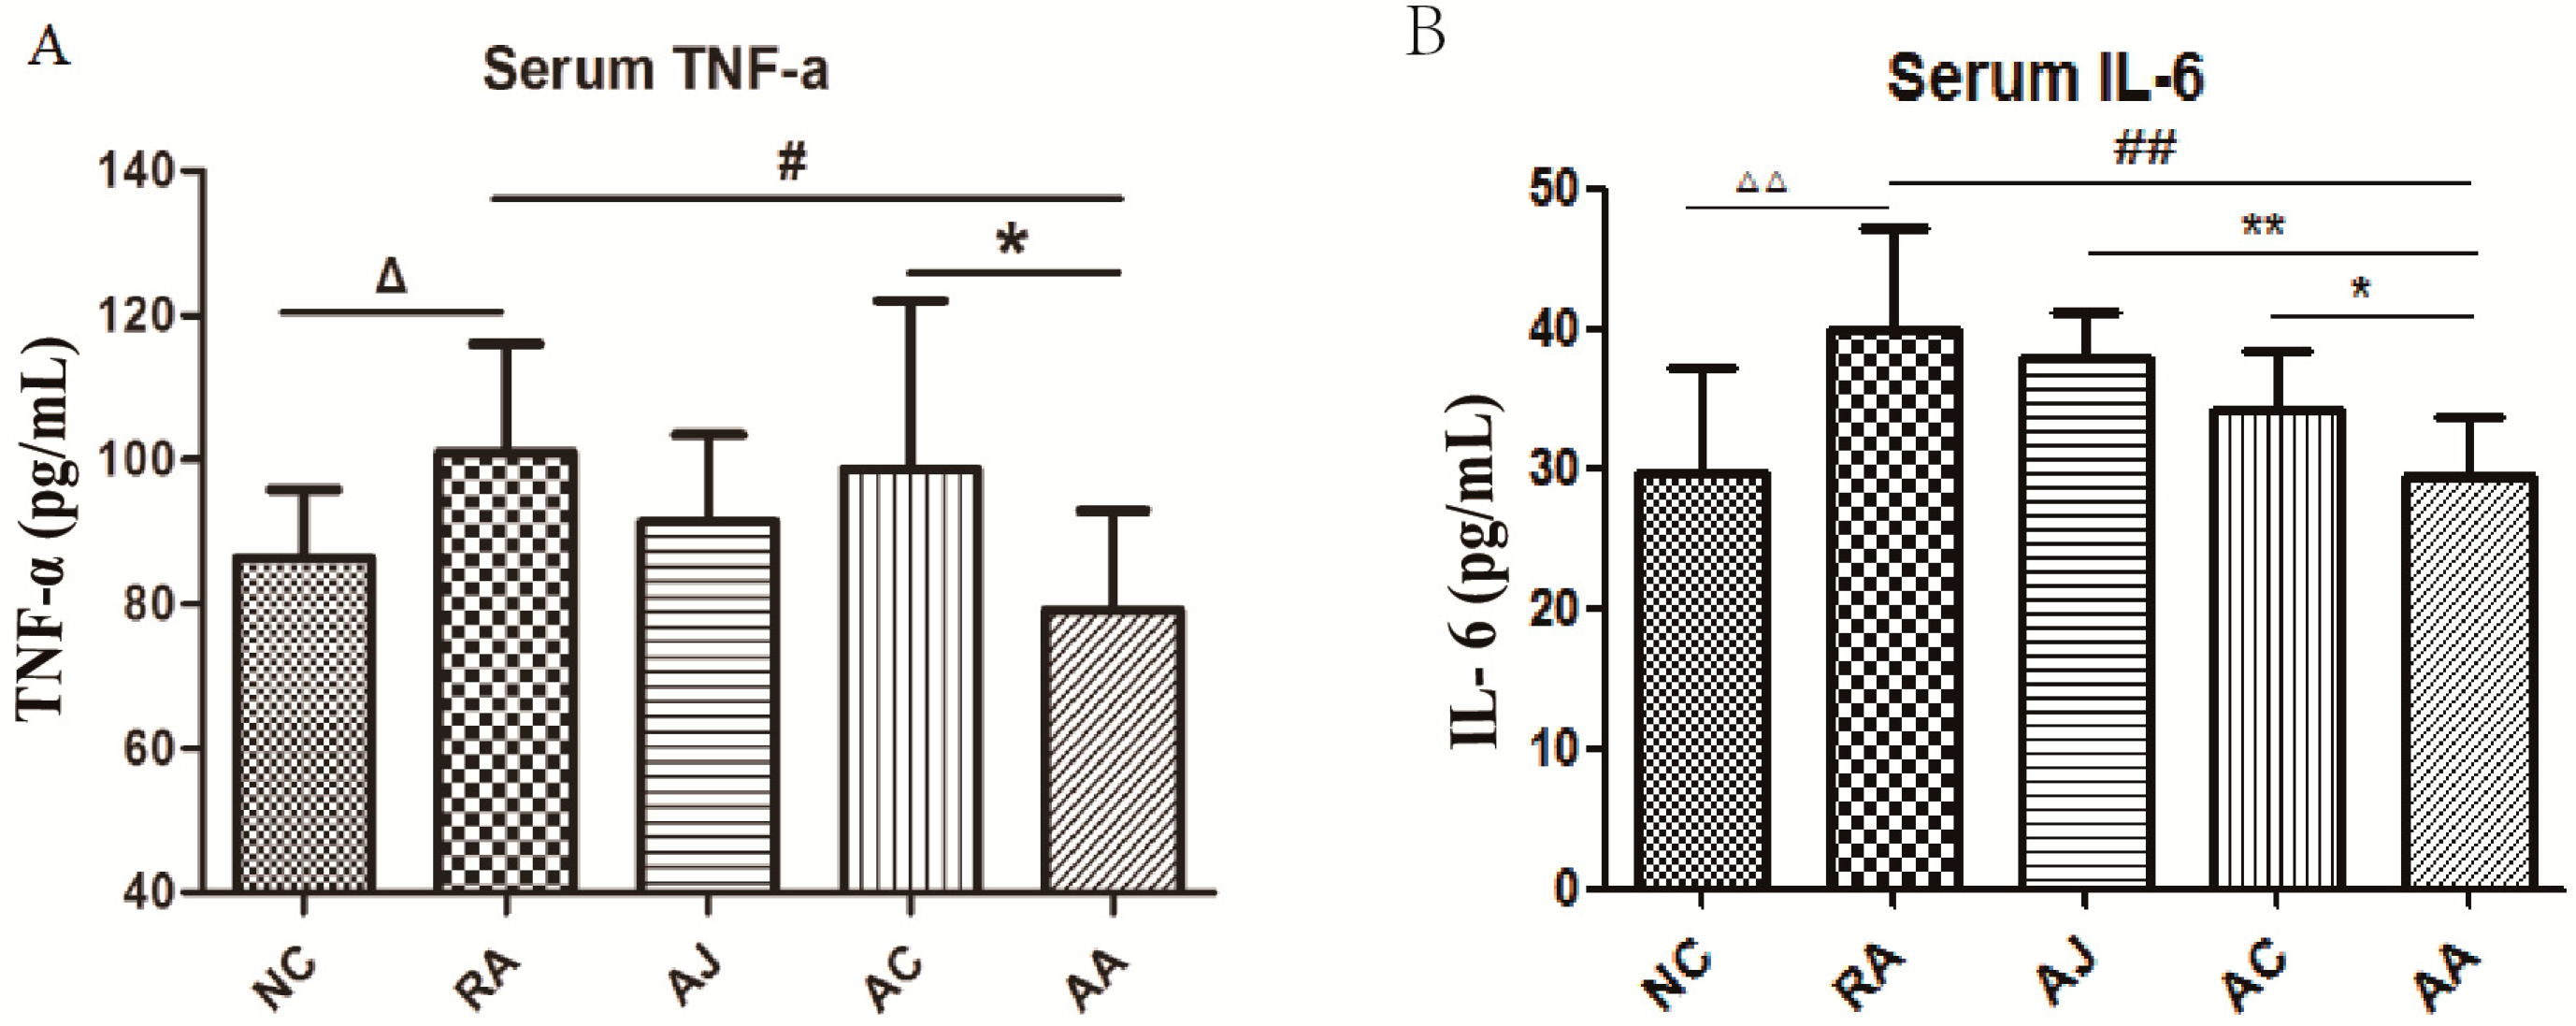
2.1. Results of Hind Paw Volume and Biochemical Parameters
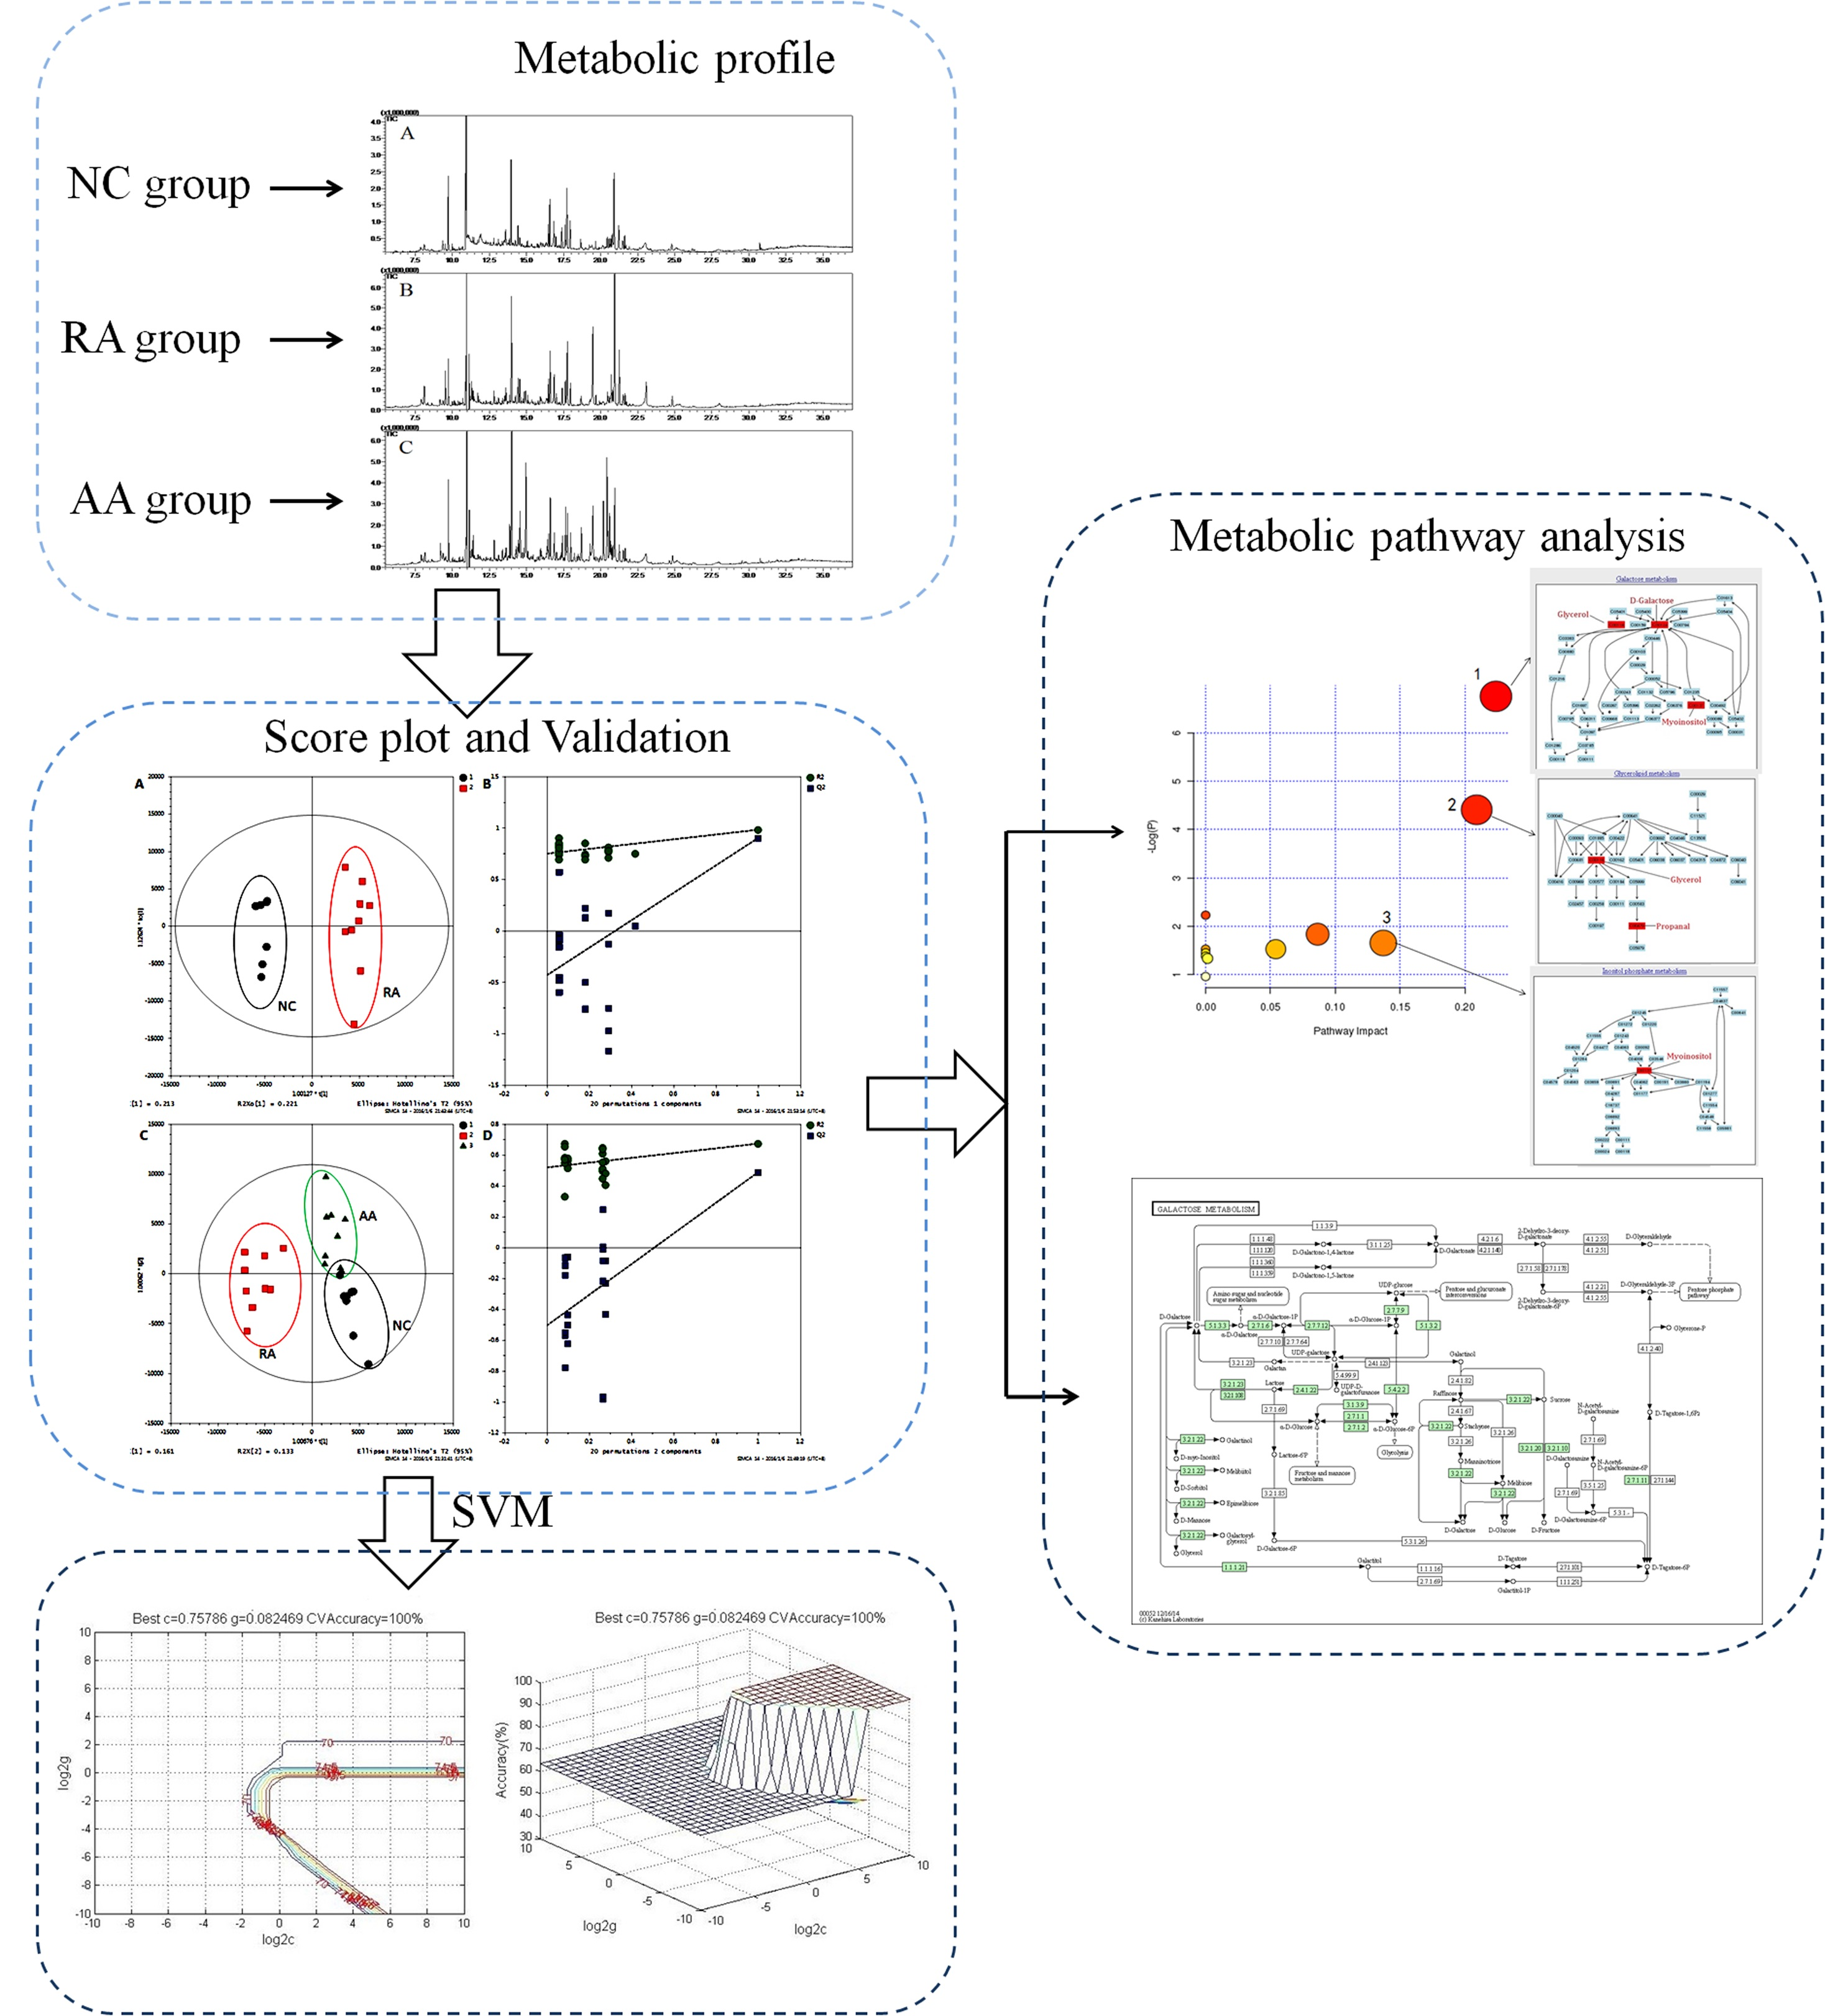
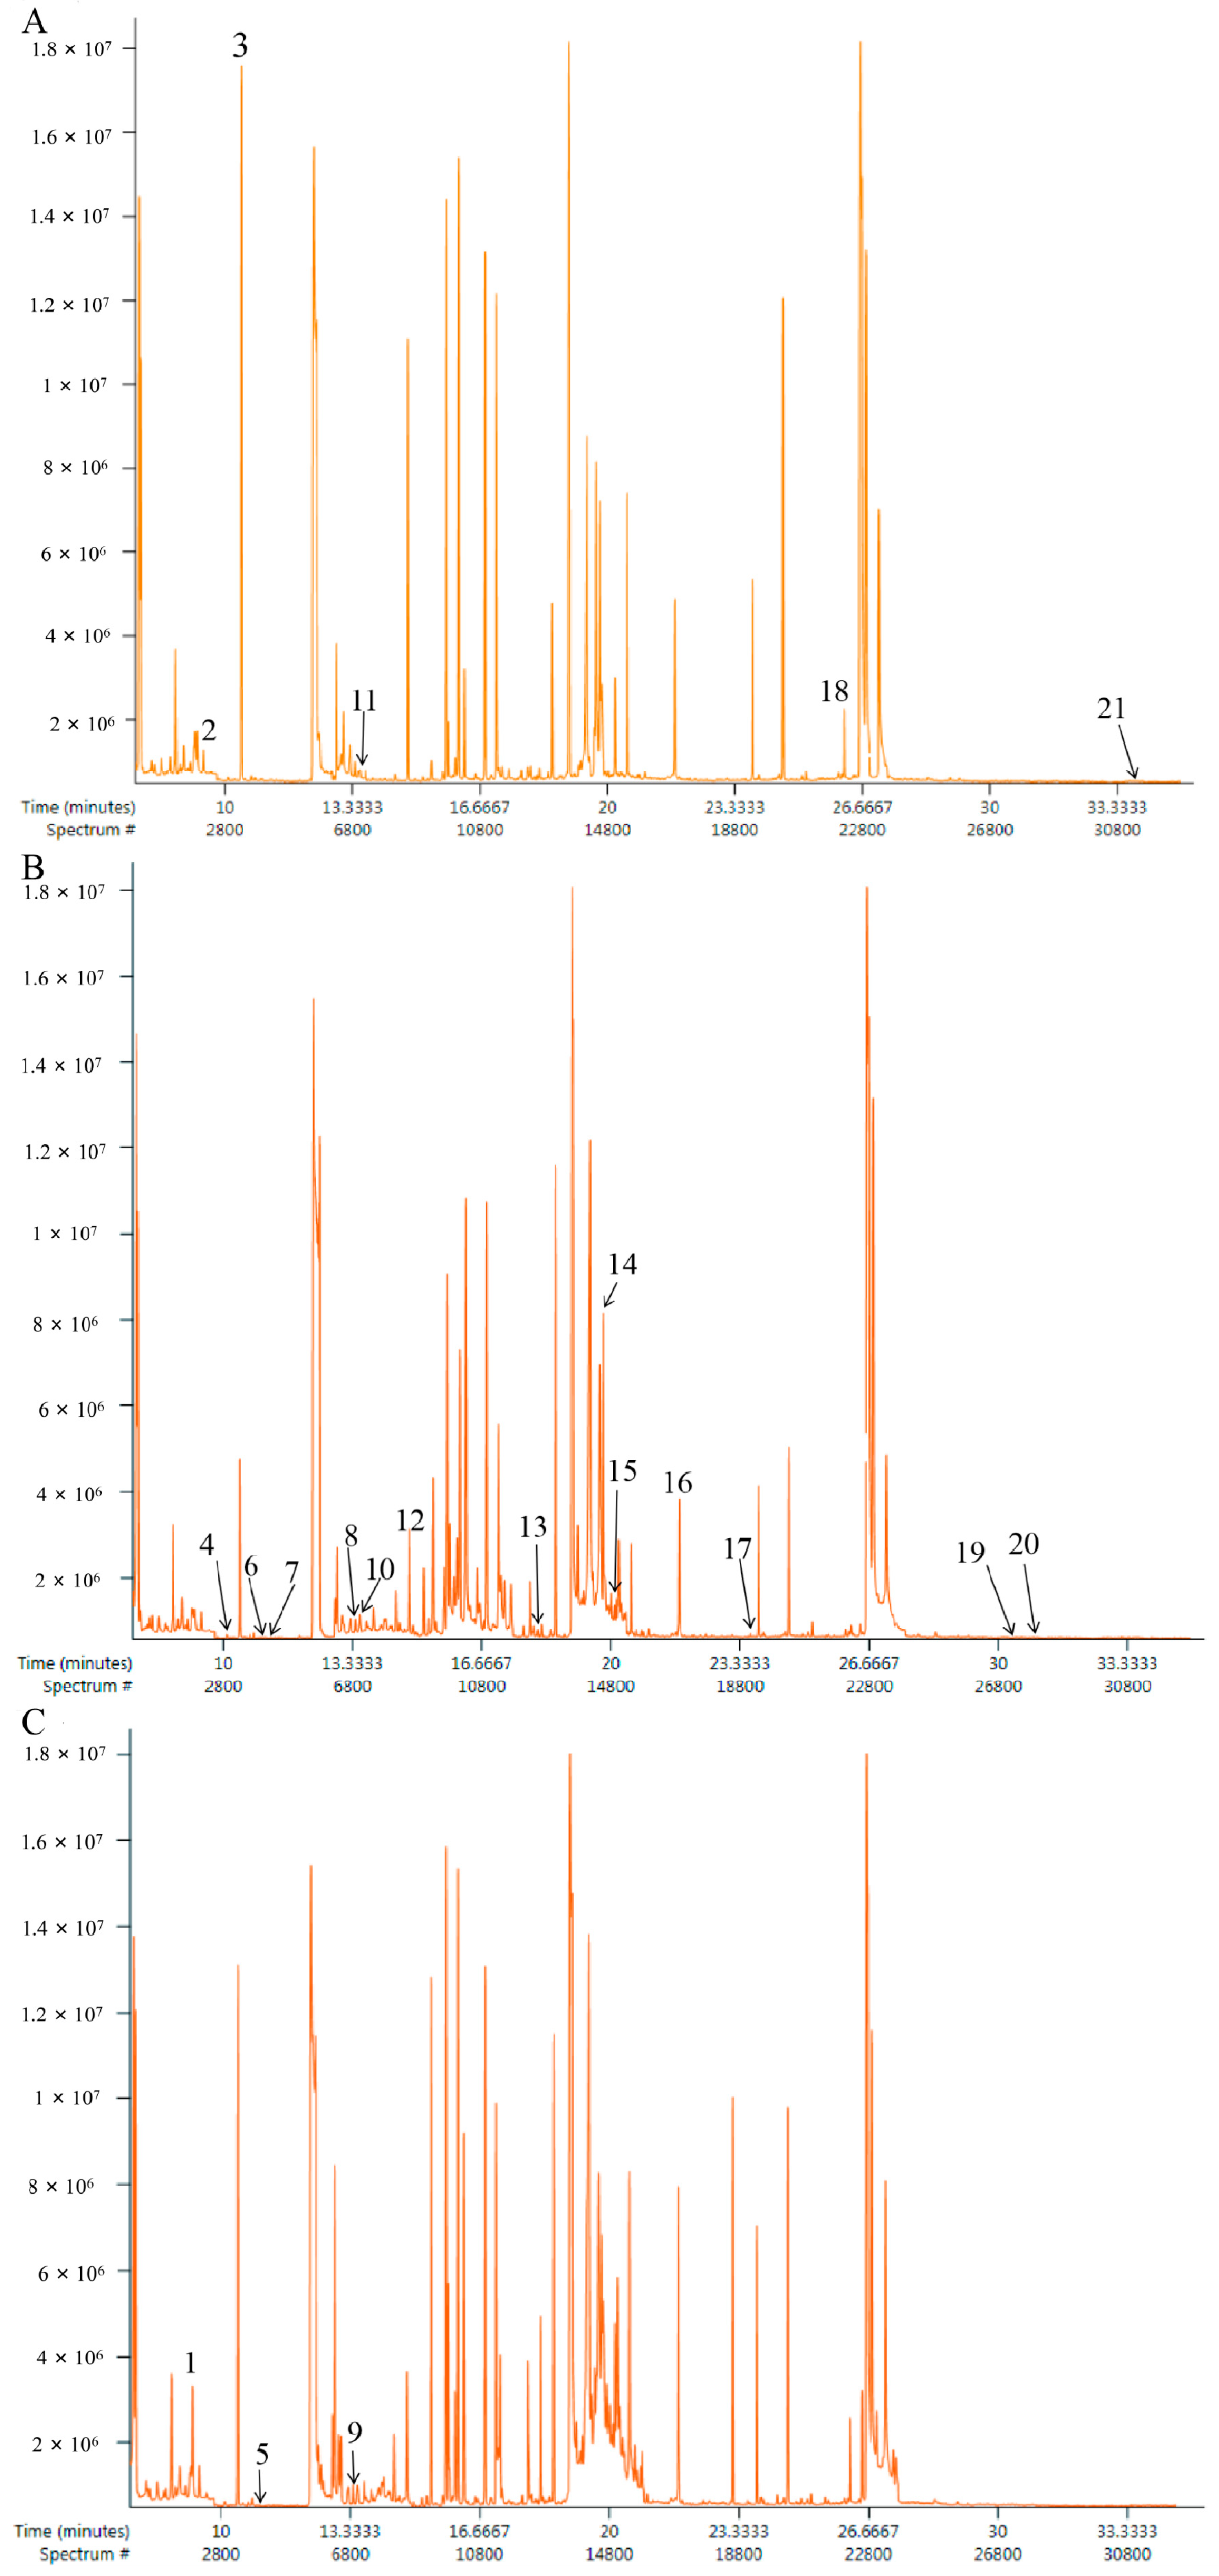
2.2. Analysis Results of GS-MS
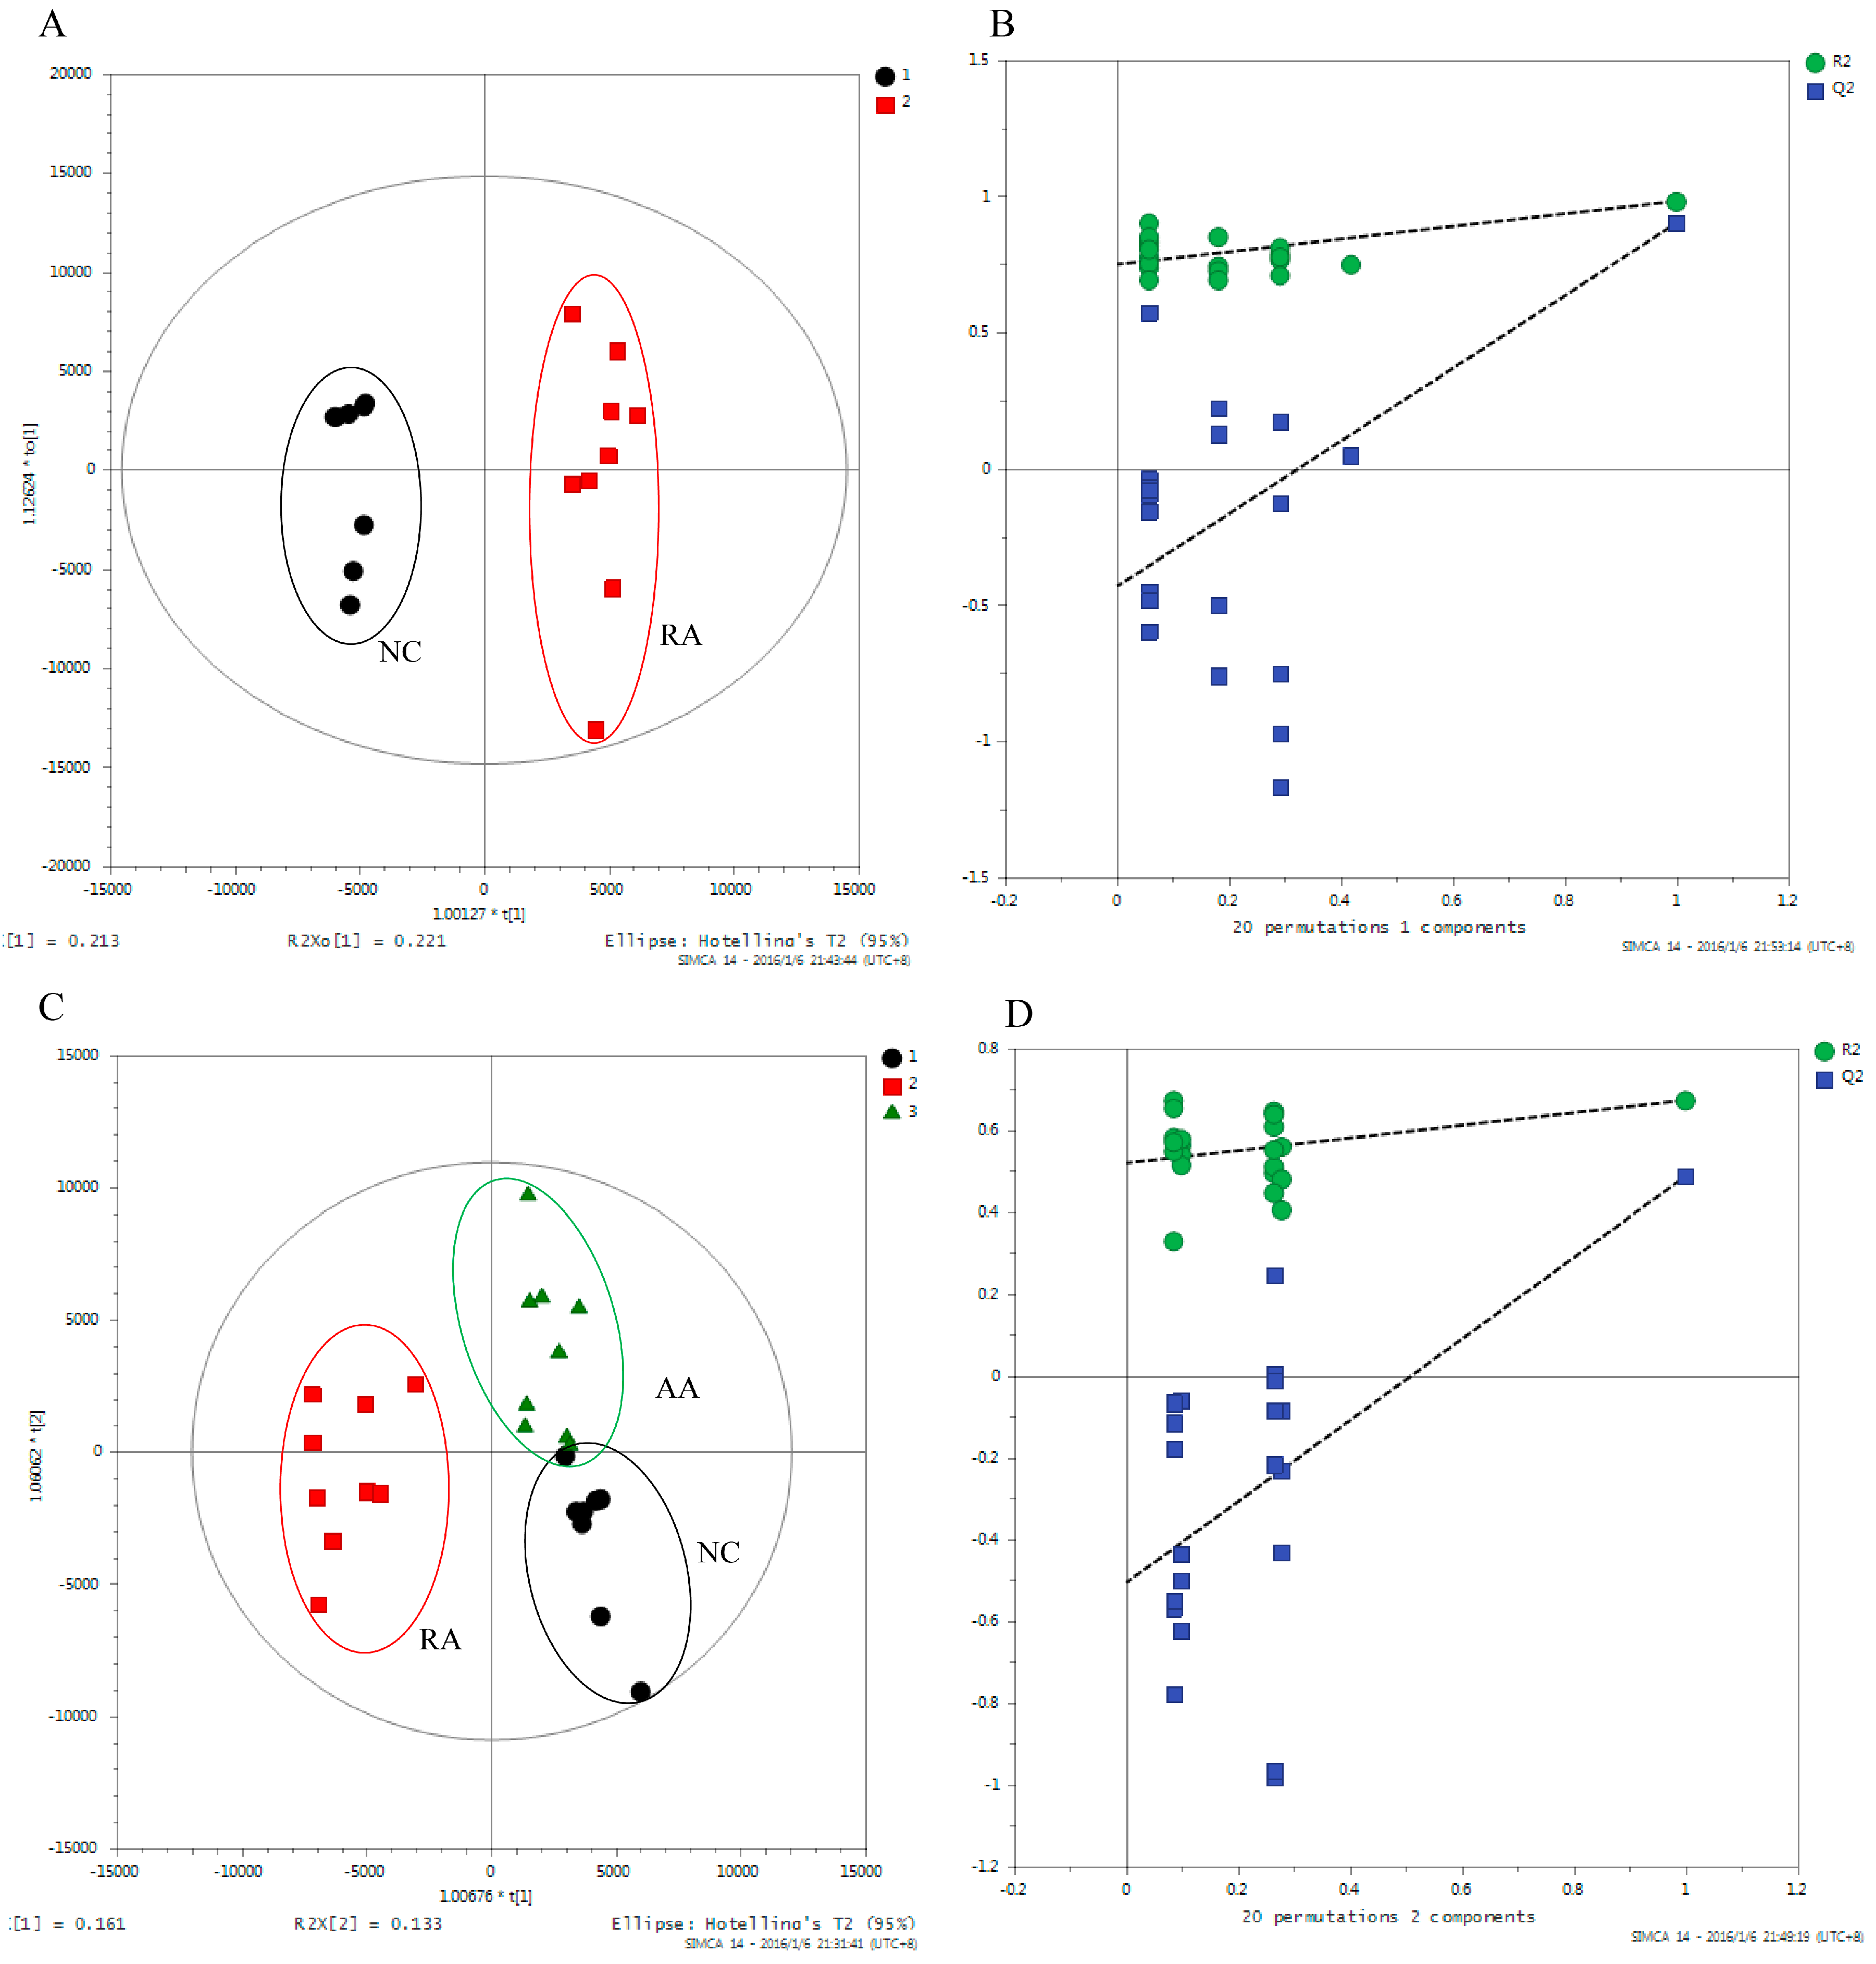
2.3. Metabolic Profiling for RA Rats
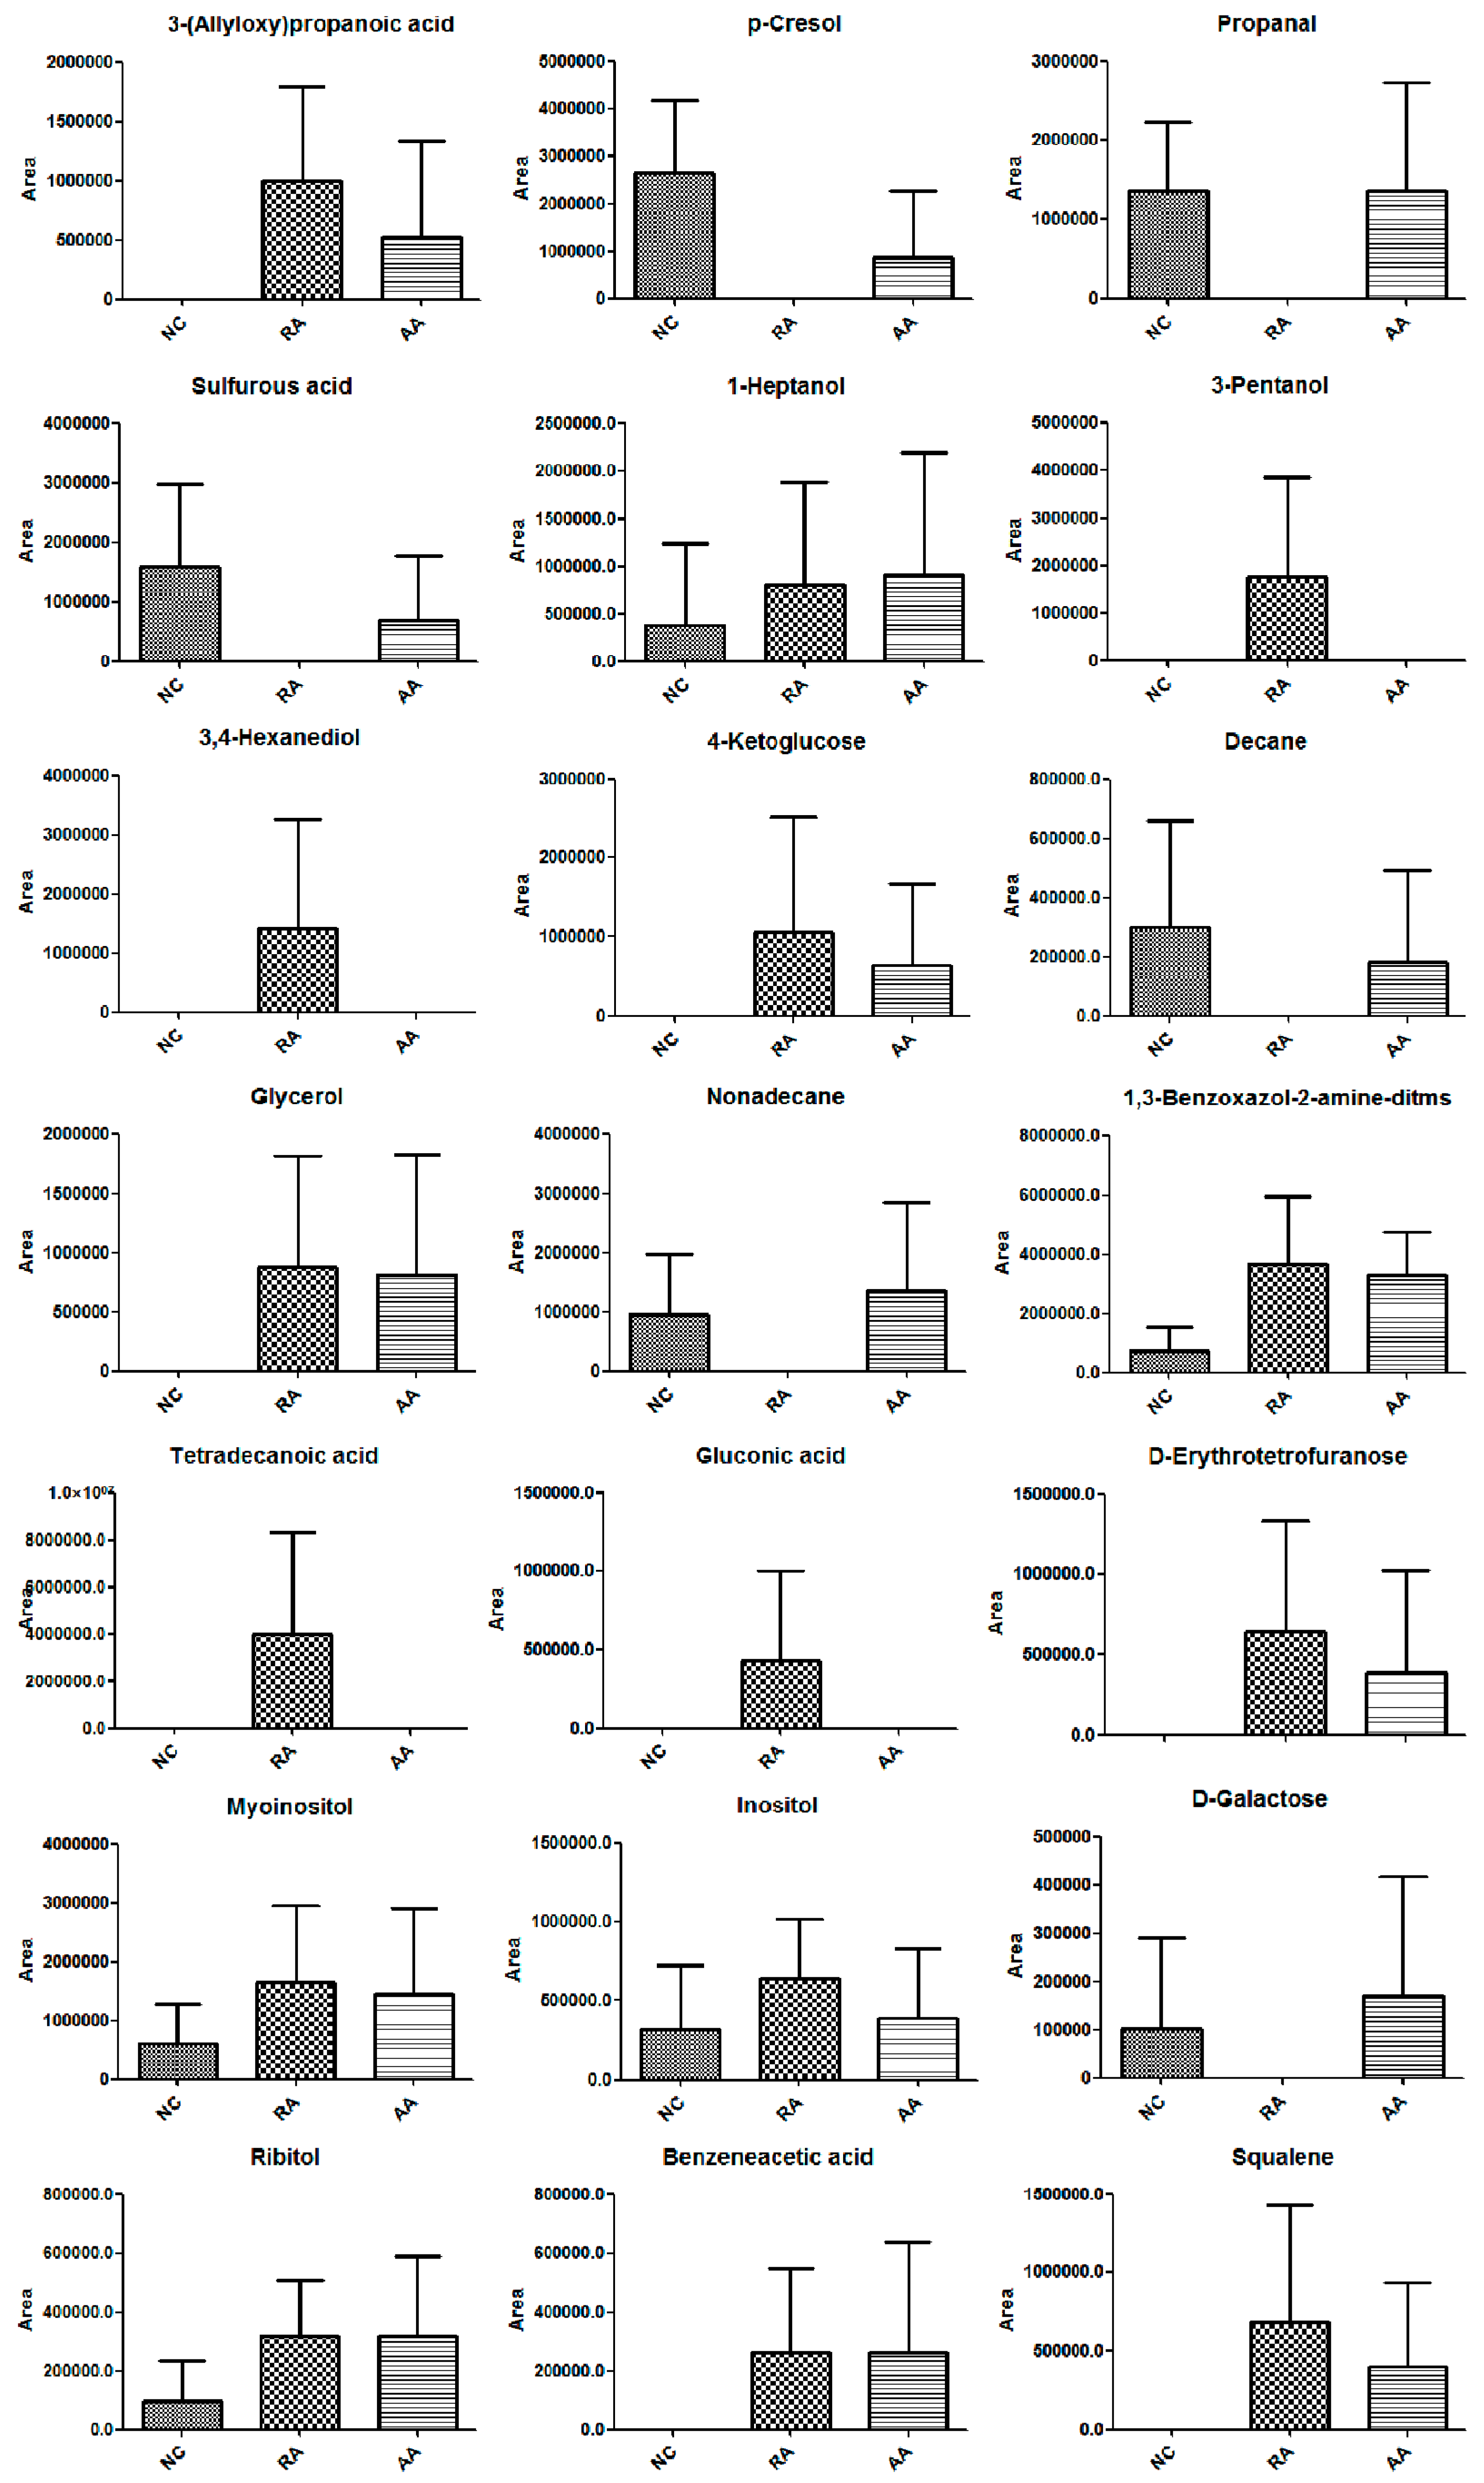
2.3.1. Biomarker Identification
2.3.2. Target Analyses of Highlighted Metabolites of AA Treatment
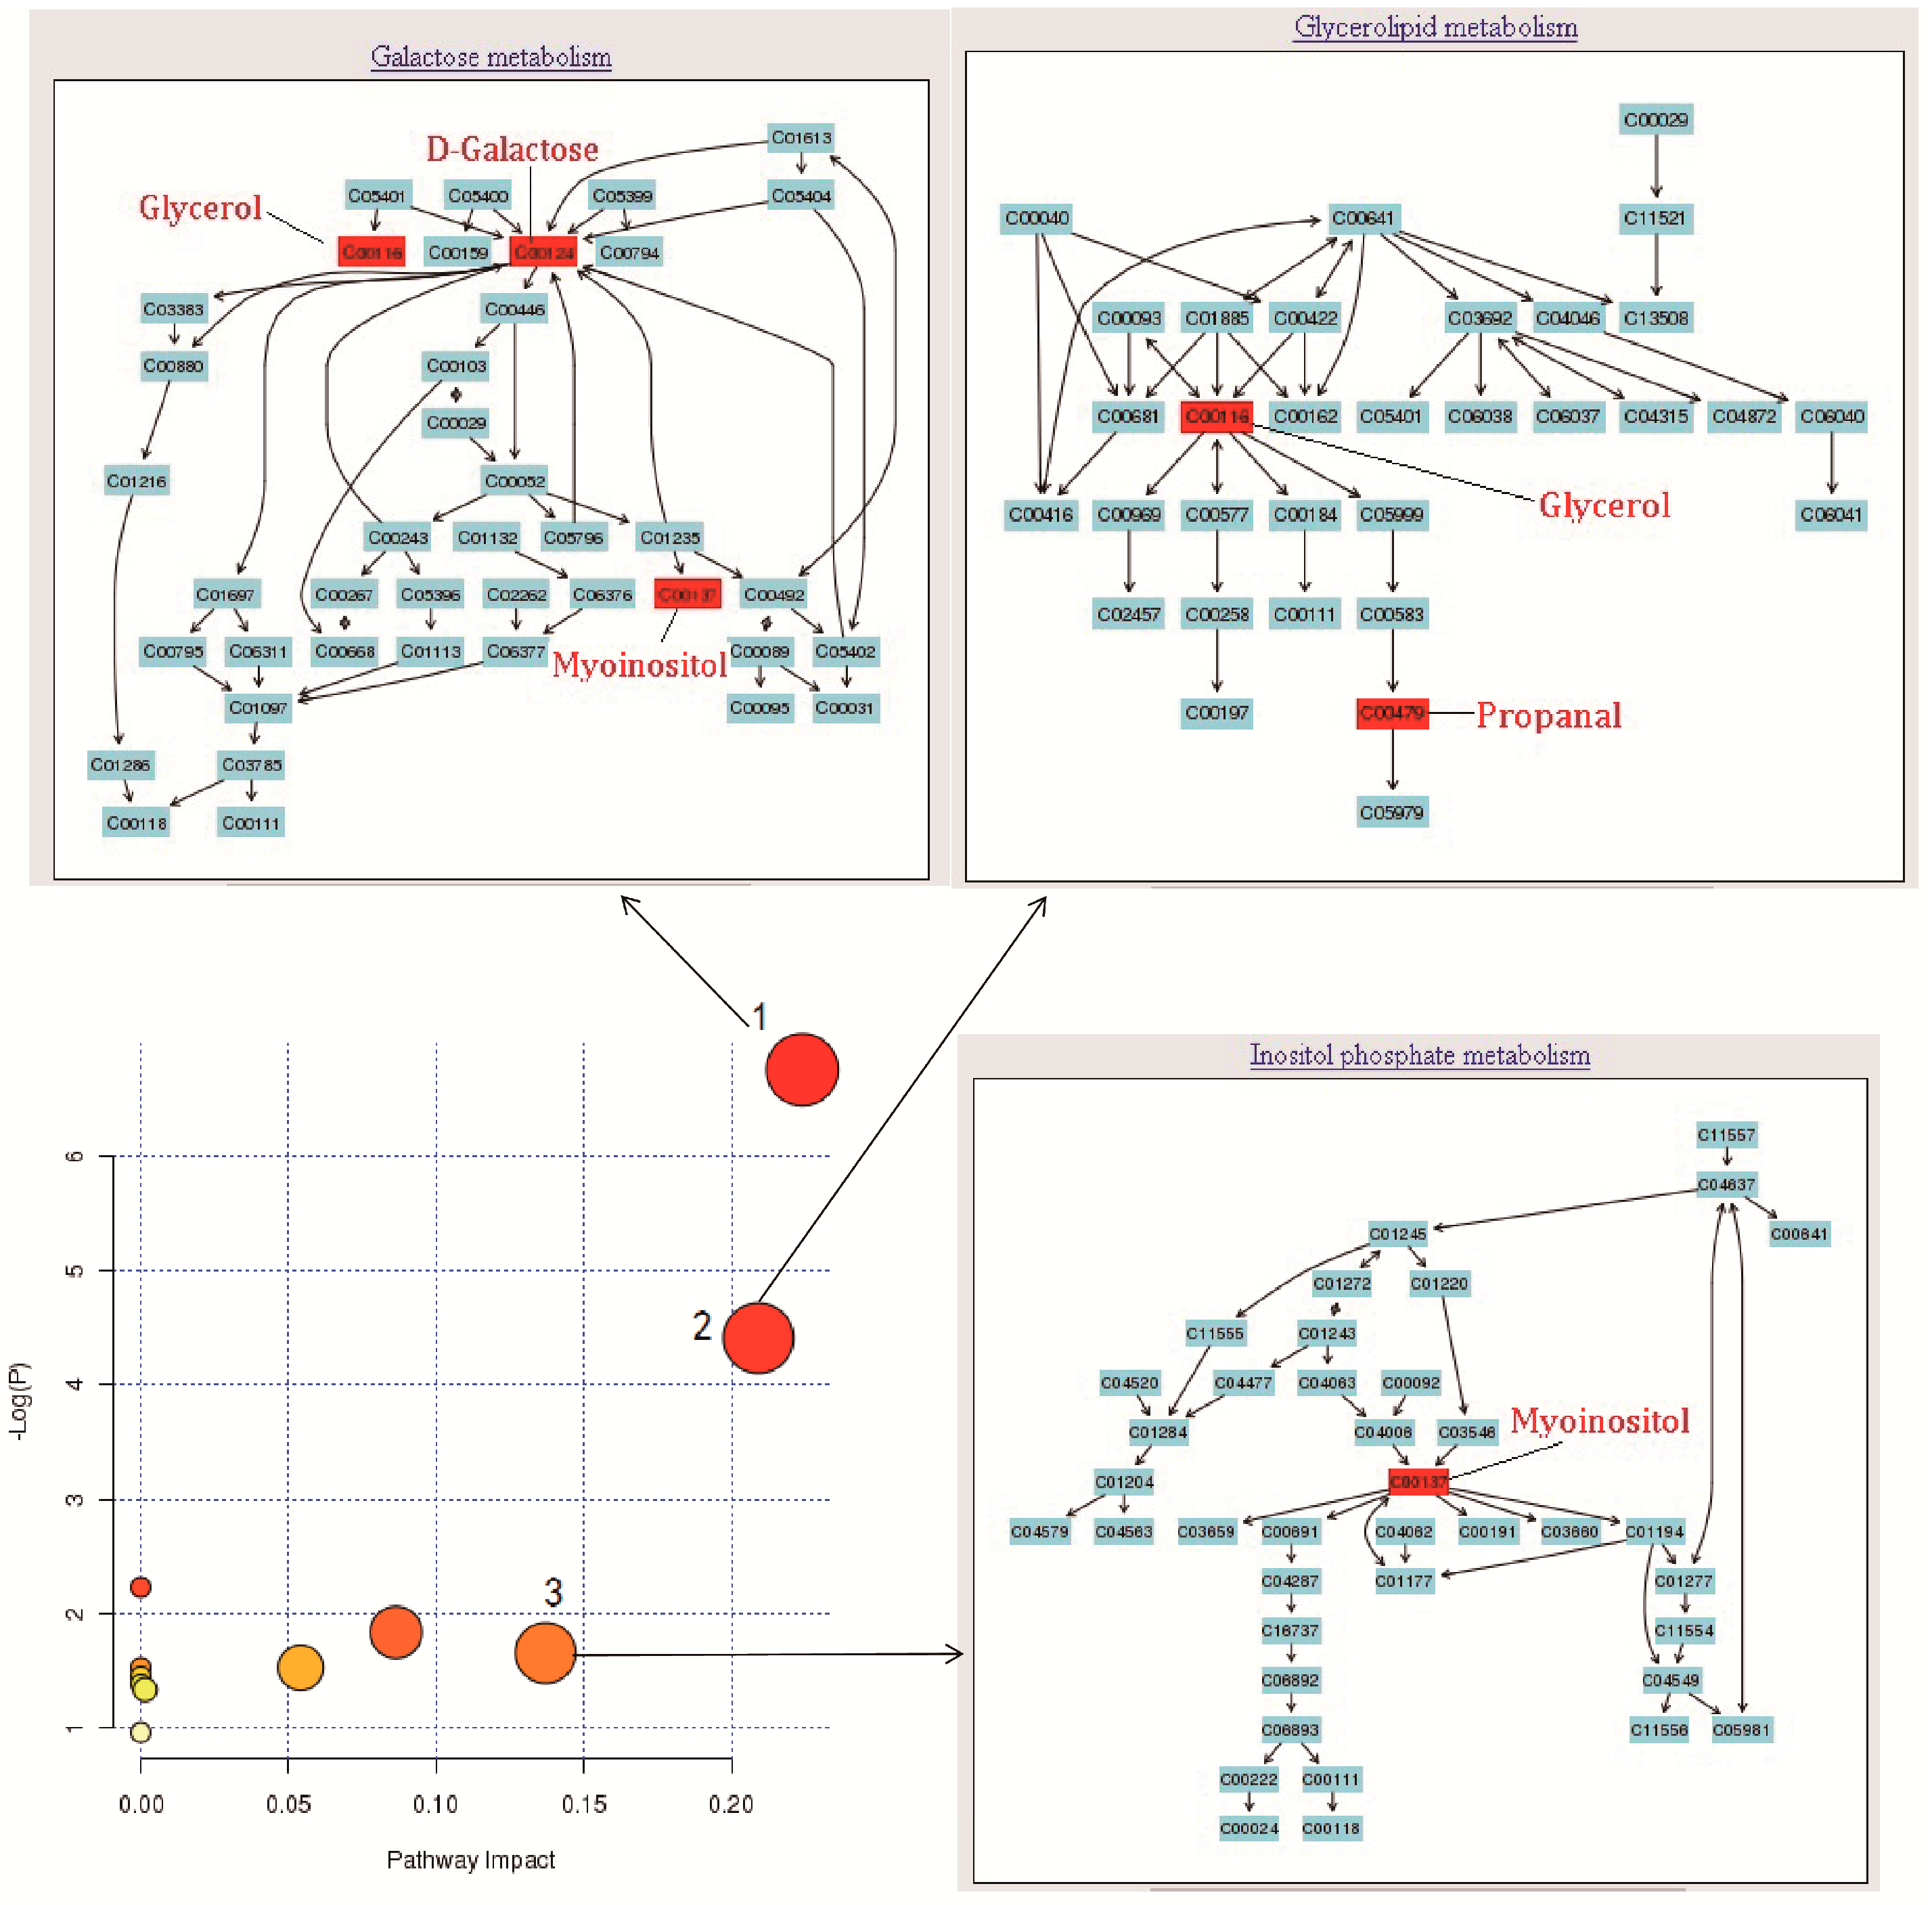
2.4. Mechanism Analysis of AA Treatment RA Rats
3. Discussion
4. Materials and Methods
4.1. Materials
4.2. Animals and Sample Preparation
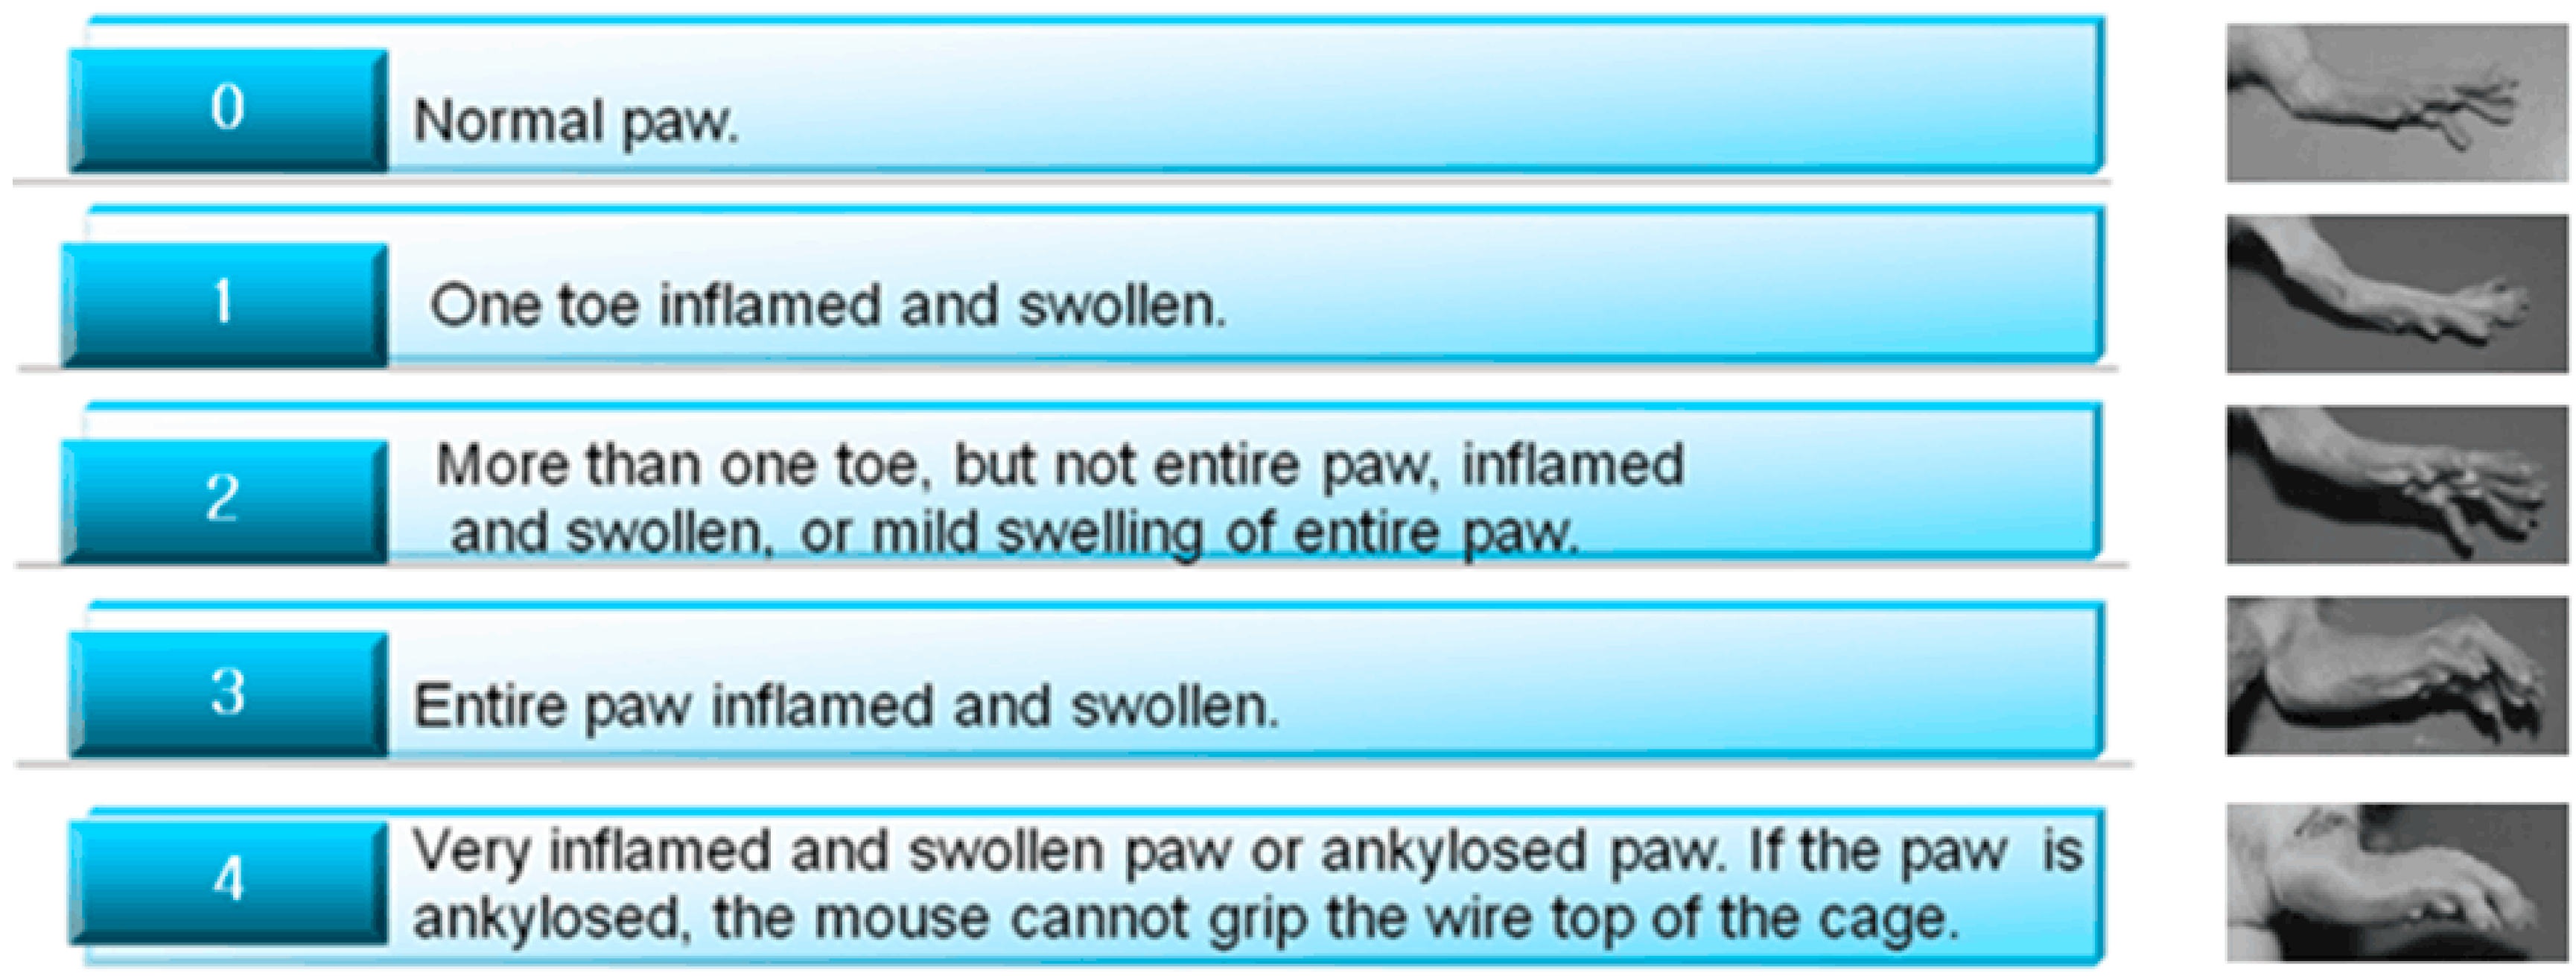
4.3. Physical Parameters
4.4. Measurements of Serum TNF-α, IL-6 Levels
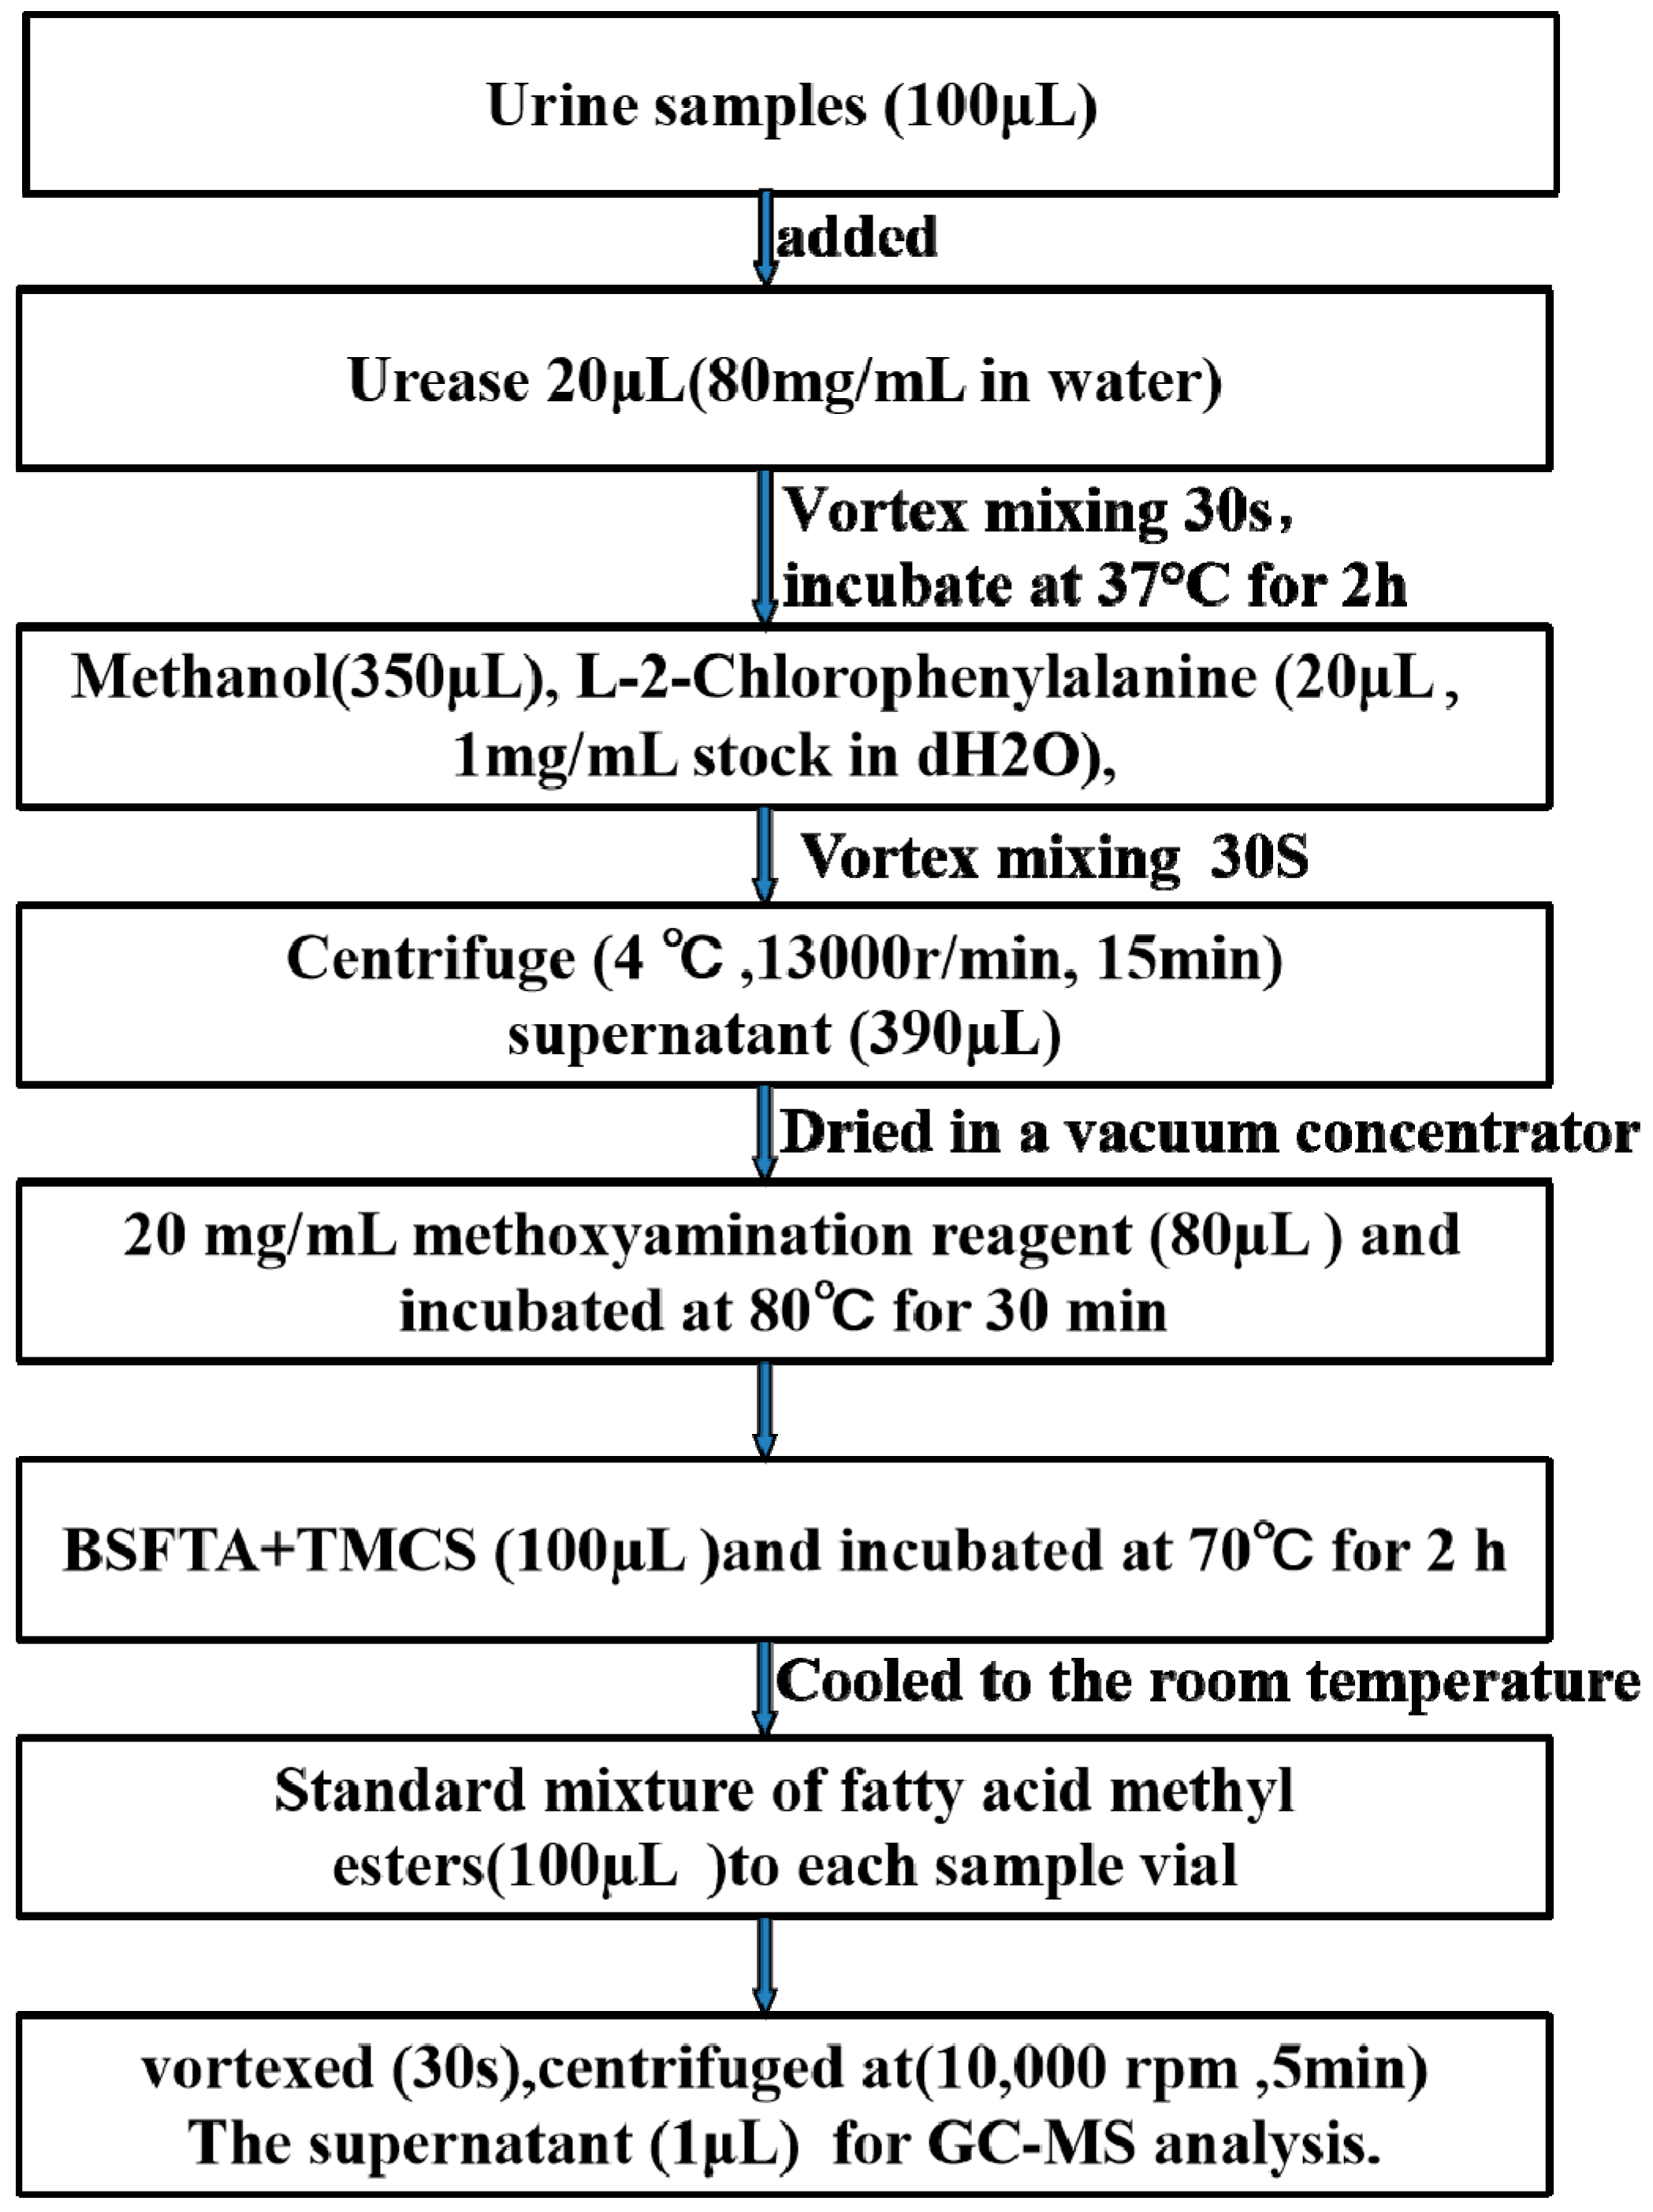
4.5. Urine Sample Preparation
4.6. GC-MS Analysis Conditions
4.7. Date Analysis
5. Conclusions
6. Limitations
Author Contributions
Funding
Conflicts of Interest
References
- Kvien, T.K. Epidemiology and burden of illness of rheumatoid arthritis. Pharmacoeconomics 2004, 22, 1–12. [Google Scholar] [CrossRef]
- Scott, D.L.; Wolfe, F.; Huizinga, T.W. Rheumatoid arthritis. Lancet 2010, 376, 1094–1108. [Google Scholar] [CrossRef]
- Song, X.; Lin, Q. Genomics, transcriptomics and proteomics to elucidate the pathogenesis of rheumatoid arthritis. Rheumatol. Int. 2017, 37, 1257–1265. [Google Scholar] [CrossRef] [PubMed]
- Assayag, D.; Lee, J.S.; King, T.E., Jr. Rheumatoid arthritis associated interstitial lung disease: A review. Medicinal 2014, 74, 158–165. [Google Scholar]
- DeQuattro, K.; Imboden, J.B. Neurologic Manifestations of Rheumatoid Arthritis. Rheum. Dis. Clin. N. Am. 2017, 43, 561–571. [Google Scholar] [CrossRef]
- Kumar, L.D.; Karthik, R.; Gayathri, N.; Sivasudha, T. Advancement in contemporary diagnostic and therapeutic approaches for rheumatoid arthritis. Biomed. Pharmacother. 2016, 79, 52–61. [Google Scholar] [CrossRef] [PubMed]
- Yamanaka, H.; Seto, Y.; Tanaka, E.; Furuya, T.; Nakajima, A.; Ikari, K.; Taniguchi, A.; Momohara, S. Management of rheumatoid arthritis: The 2012 perspective. Mod. Rheumatol. 2013, 23, 1–7. [Google Scholar] [CrossRef] [PubMed]
- Yue, S.; Liu, J.; Wan, L.; Wang, F.; Zhang, X.; Qi, Y. Improving Effects of Astragalus Polysaccharides on Cardiac Function via Keap1/Nrf2-ARE Signal Pathway in Adjuvant Arthritis Rats. Chin. Herb. Med. 2016, 8, 143–153. [Google Scholar]
- Demoruelle, M.K.; Deane, K.D. Treatment Strategies in Early Rheumatoid Arthritis and Prevention of Rheumatoid Arthritis. Curr. Rheumatol. Rep. 2012, 14, 472–480. [Google Scholar] [CrossRef] [PubMed] [Green Version]
- Chinese Pharmacopoeia Commission. Pharmacopoeia of People’s Republic of China; China Medical Science Press: Beijing, China, 2015. [Google Scholar]
- Li, M.; He, J.; Jiang, L.; Ng, E.S.; Wang, H.; Lam, F.F.; Tan, N.H.; Shaw, P.C. The anti-arthritic effects of Aconitum vilmorinianum, a folk herbal medicine in Southwestern China. J. Ethnopharmacol. 2013, 1, 122–127. [Google Scholar] [CrossRef]
- Lee, K.; Lee, B.; Lee, M.H.; Kim, B.; Chinannai, K.S.; Ham, I.; Choi, H.Y. Effect of Ampelopsis Radix on wound healing in scalded rats. BMC Complement. Altern. Med. 2015, 15, 213. [Google Scholar] [CrossRef] [PubMed]
- Liu, J.; Zhong, G.; Wang, X.; Ou, L.; Chen, S. Chinese Patent Medicines Containing Eighteen Incompatible Herbs or Nineteen Mutual Antagonistic Herbs in Pharmacopoeia of People’s Republic of China (volume I, 2010). Chinese J. Exp. Traditional Med. Formulae 2011, 17, 213–217. [Google Scholar]
- Cheng, J.; Jin, H. Treatment of knee osteoarthritis with fumigation and washing of traditional Chinese medicine and sodium hyaluronate injection. J. Sichuan Tradit. Chin. Medicine 2008, 26, 97–98. [Google Scholar]
- Li, H. Treatment of 87 cases of knee joint osteoarthritis with integrated traditional Chinese and Western medicine. J. Emerg. Tradit. Chin. Medicine 2004, 13, 250–251. [Google Scholar]
- Liu, X.; Locasale, J.W. Metabolomics: A Primer. Trends Biochem. Sci. 2017, 42, 274–284. [Google Scholar] [CrossRef] [PubMed]
- Chetwynd, A.J.; Dunn, W.B.; Rodriguez-Blanco, G. Collection and Preparation of Clinical Samples for Metabolomics. Adv. Exp. Med. Biol. 2017, 965, 19–44. [Google Scholar] [PubMed]
- Yin, H.; Wang, L.; Li, Q.; Zhang, J.; Zhang, L.; Wang, X. Metabolomic analysis of biochemical changes in urine of osteoarthritis rat and interventional effects of Bushen-Huoxue herb couple. Chin. Herb. Med. 2017, 9, 369–375. [Google Scholar] [CrossRef]
- Wang, X.; Wang, D.; Wu, J.; Yu, X.; Lv, J.; Kong, J.; Zhu, G.; Su, R. Metabolic Characterization of Myocardial Infarction Using GC-MS-Based Tissue Metabolomics. Int. Heart. J. 2017, 58, 441–446. [Google Scholar] [CrossRef]
- Yoshida, M.; Hatano, N.; Nishiumi, S.; Irino, Y.; Izumi, Y.; Takenawa, T.; Azuma, T. Diagnosis of gastroenterological diseases by metabolome analysis using gas chromatography-mass spectrometry. J. Gastroenterol. 2012, 47, 9–20. [Google Scholar] [CrossRef]
- Ranjbar, M.R.N.; Luo, Y.; Di Poto, C.; Varghese, R.S.; Ferrarini, A.; Zhang, C.; Sarhan, N.I.; Soliman, H.; Tadesse, M.G.; Ziada, D.H.; et al. GC-MS Based Plasma Metabolomics for Identification of Candidate Biomarkers for Hepatocellular Carcinoma in Egyptian Cohort. PLoS ONE 2015, 10, e0127299. [Google Scholar] [CrossRef]
- Polat, H.; Danaei Mehr, H.; Cetin, A. Diagnosis of Chronic Kidney Disease Based on Support Vector Machine by Feature Selection Methods. J. Med. Syst. 2017, 41, 55. [Google Scholar] [CrossRef]
- Xiang, Q.; Liao, B.; Li, X.; Xu, H.; Chen, J.; Shi, Z.; Dai, Q.; Yao, Y. Subcellular localization prediction of apoptosis proteins based on evolutionary information and support vector machine. Artif. Intell. Med. 2017, 78, 41–46. [Google Scholar] [CrossRef]
- Li, Y.; Ju, L.; Hou, Z.; Deng, H.; Zhang, Z.; Wang, L.; Yang, Z.; Yin, J.; Zhang, Y. Screening, verification, and optimization of biomarkers for early prediction of cardiotoxicity based on metabolomics. J. Proteome Res. 2015, 14, 2437–2445. [Google Scholar] [CrossRef]
- Johnston, B.A.; Mwangi, B.; Matthews, K.; Coghill, D.; Konrad, K.; Steele, J.D. Brainstem abnormalities in attention deficit hyperactivity disorder support high accuracy individual diagnostic classification. Hum. Brain Mapp. 2014, 35, 5179–5189. [Google Scholar] [CrossRef]
- Wheelock, Å.M.; Wheelock, C.E. Trials and tribulations of ‘omics data analysis: Assessing quality of SIMCA-based multivariate models using examples from pulmonary medicine. Mol. Biosyst. 2013, 9, 2589–2596. [Google Scholar] [CrossRef]
- Aboulwafa, M.M.; Youssef, F.S.; Gad, H.A.; Sarker, S.D.; Nahar, L.; Al-Azizi, M.M.; Ashour, M.L. Authentication and discrimination of green tea samples using UV-vis, FTIR and HPLC techniques coupled with chemometrics analysis. J. Pharm. Biomed. Anal. 2019, 5, 653–658. [Google Scholar] [CrossRef]
- Naccarato, A.; Furia, E.; Sindona, G.; Tagarelli, A. Multivariate class modeling techniquesapplied to multielement analysis for the verification of the geographical origin of chili pepper. Food Chem. 2016, 1, 217–222. [Google Scholar] [CrossRef]
- Wei, J.; Gao, J.; Ding, X. Exploring the mechanism of Jieduquyuziyin prescription on systemic lupus erythematosus by GC-MS-based urine metabolomics. Biomed. Chromatogr. 2018, 32. [Google Scholar] [CrossRef]
- Zhong, X.; Zhong, Y.; Yan, K.; Xiao, X.; Duan, L.; Wang, R.; Wang, L. Metabolomics approach based on ultra-high-performance liquid chromatography coupled with quadrupole-time-of-flight mass spectrometry to identify the chemical constituents of the Traditional Chinese Er-Zhi-Pill. J. Sep. Sci. 2017, 40, 2713–2721. [Google Scholar] [CrossRef]
- Luo, K.; Shi, Q.; Feng, F. Characterization of global metabolic profile of Zhi-Zi-Hou-Po decoction in rat bile, urine and feces after oral administration based on a strategy combining LC-MS and chemometrics. J. Chromatogr. B Anal. Technol. Biomed. Life Sci. 2017, 1040, 260–272. [Google Scholar] [CrossRef] [PubMed]
- Yang, X.; Li, X.; Zhang, S. Metabolomics analysis of oral mucosa reveals profile perturbation in reticular oral lichen planus. Clin. Chim. Acta 2018, 487, 28–32. [Google Scholar] [CrossRef]
- Demir, O.; Aksan Kurnaz, I. An integrated model of glucose and galactose metabolism regulated by the GAL genetic switch. Comput. Biol. Chem. 2006, 30, 179–192. [Google Scholar] [CrossRef] [Green Version]
- Bissett, D.L.; Anderson, R.L. Lactose and D-galactose metabolism in group N streptococci: Presence of enzymes for both the D-galactose 1-phosphate and D-tagatose 6-phosphate pathways. J. Bacteriol. 1974, 117, 318–320. [Google Scholar] [PubMed]
- Nam, M.; Choi, M.S.; Choi, J.Y.; Kim, N.; Kim, M.S.; Jung, S.; Kim, J.; Ryu, D.H.; Hwang, G.S. Effect of green tea on hepatic lipid metabolism in mice fed a high-fat diet. J. Nutr. Biochem. 2018, 51, 1–7. [Google Scholar] [CrossRef]
- Bugáňová, M.; Pelantová, H.; Holubová, M.; Šedivá, B.; Maletínská, L.; Železná, B.; Kuneš, J.; Kačer, P.; Kuzma, M.; Haluzík, M. The effects of liraglutide in mice with diet-induced obesity studied by metabolomics. J. Endocrinol. 2017, 233, 93–104. [Google Scholar] [CrossRef]
- Nie, Q.; Chen, H.; Hu, J.; Gao, H.; Fan, L.; Long, Z.; Nie, S. Arabinoxylan Attenuates Type 2 Diabetes by Improvement of Carbohydrate, Lipid, and Amino Acid Metabolism. Mol. Nutr. Food Res. 2018, 62, e1800222. [Google Scholar] [CrossRef] [PubMed]
- Ralston, J.C.; Lyons, C.L.; Kennedy, E.B.; Kirwan, A.M.; Roche, H.M. Fatty Acids and NLRP3 Inflammasome-Mediated Inflammation in Metabolic Tissues. Annu. Rev. Nutr. 2017, 37, 77–102. [Google Scholar] [CrossRef]
- Possik, E.; Madiraju, S.R.M.; Prentki, M. Glycerol-3-phosphate phosphatase/PGP: Role in intermediary metabolism and target for cardiometabolic diseases. Biochimie 2017, 143, 18–28. [Google Scholar] [CrossRef] [PubMed]
- A-González, N.; Castrillo, A. Liver X receptors as regulators of macrophage inflammatory and metabolic pathways. Biochim. Biophys. Acta 2011, 1812, 982–994. [Google Scholar] [CrossRef] [Green Version]
- Green, C.D.; Jump, D.B.; Olson, L.K. Elevated insulin secretion from liver X receptor-activated pancreatic beta-cells involves increased de novo lipid synthesis and triacylglyceride turnover. Endocrinology 2009, 150, 2637–2645. [Google Scholar] [CrossRef]
- Milewska, E.M.; Czyzyk, A.; Meczekalski, B.; Genazzani, A.D. Inositol and human reproduction. From cellular metabolism to clinical use. Gynecol. Endocrinol. 2016, 32, 690–695. [Google Scholar] [CrossRef] [PubMed]
- Chaudhuri, A.G.; Ganguly, U. Evidence for stimulation of the inositol triphosphate-Ca2+ signalling system in rat enterocytes by heat stable enterotoxin of Escherichia coli. Biochim. Biophys. Acta 1995, 1267, 131–133. [Google Scholar] [CrossRef]
- Tintinger, G.; Steel, H.C.; Anderson, R. Taming the neutrophil: Calcium clearance and influx mechanisms as novel targets for pharmacological control. Clin. Exp. Immunol. 2005, 141, 191–200. [Google Scholar] [CrossRef]
- Hauser, C.J.; Fekete, Z.; Adams, J.M.; Garced, M.; Livingston, D.H.; Deitch, E.A. PAF-mediated Ca2+ influx in human neutrophils occurs via store-operated mechanisms. J. Leukoc. Biol. 2001, 69, 63–68. [Google Scholar] [PubMed]
- Zhang, P.; Han, D.; Tang, T.; Zhang, X.; Dai, K. Inhibition of the development of collagen-induced arthritis in Wistar rats through vagus nerve suspension: A 3-month observation. Inflamm. Res. 2008, 57, 322–328. [Google Scholar] [CrossRef]
- Song, L.; Liu, H.; Wang, Y.; Wang, Y.; Liu, J.; Zhou, Z.; Chu, H.; Zhuang, P.; Zhang, Y. Application of GC/MS-based metabonomic profiling in studying the therapeutic effects of Huangbai-Zhimu herb-pair (HZ) extract on streptozotocin-induced type 2 diabetes in mice. J. Chromatogr. B 2015, 997, 96–104. [Google Scholar] [CrossRef]
- Luts, J.; Ojeda, F.; Van de Plas, R.; De Moor, B.; Van Huffel, S.; Suykens, J.A. A tutorial on support vector machine-based methods for classification problems in chemometrics. Anal. Chim. Acta. 2010, 665, 129–145. [Google Scholar] [CrossRef]
- Zavar, M.; Rahati, S.; Akbarzadeh-T, M.-R.; Ghasemifard, H. Evolutionary model selection in a wavelet-based support vector machine for automated seizure detection. Expert. Syst. Appl. 2011, 38, 10751–10758. [Google Scholar] [CrossRef]
- Ahn, J.K.; Kim, J.; Hwang, J.; Song, J.; Kim, K.H.; Cha, H.S. Urinary Metabolomic Profiling to Identify Potential Biomarkers for the Diagnosis of Behcet’s Disease by Gas Chromatography/Time-of-Flight-Mass Spectrometry. Int. J. Mol. Sci. 2017, 18, 2309. [Google Scholar] [CrossRef]
Sample Availability: Not available. |


| No. | R.T. (min) | Metabolite | Match Percent/% | Related Pathway | Trend | |
|---|---|---|---|---|---|---|
| RA Group a | AA Group b | |||||
| 1 | 8.647 | 3-(Allyloxy)propanoic acid | 68 | ↑ | ↓ | |
| 2 | 9.385 | p-Cresol | 87 | ↓ | ↑ | |
| 3 | 10.301 | Propanal | 75 | Glycerolipid metabolism | ↓ | ↑ |
| 4 | 10.705 | Sulfurous acid | 76 | ↓ | ↑ | |
| 5 | 11.194 | 1-Heptanol | 88 | ↑ | ↑ | |
| 6 | 11.402 | 3-Pentanol | 82 | ↑ | ↓ | |
| 7 | 11.721 | 3,4-Hexanediol | 62 | ↑ | ↓ | |
| 8 | 13.401 | 4-Ketoglucose | 85 | ↑ | ↓ | |
| 9 | 13.507 | Decane | 94 | ↓ | ↑ | |
| 10 | 13.554 | Glycerol | 80 | Glycerolipid metabolism | ↑ | ↓ |
| 11 | 13.601 | Nonadecane | 94 | ↓ | ↑ | |
| 12 | 14.421 | 1,3-Benzoxazol-2-amine-ditms | 80 | ↑ | ↓ | |
| 13 | 18.162 | Tetradecanoic acid | 94 | ↑ | ↓ | |
| 14 | 19.803 | Gluconic acid | 78 | ↑ | ↓ | |
| 15 | 19.916 | d-Erythrotetrofuranose | 82 | ↑ | ↓ | |
| 16 | 21.916 | Myoinositol | 82 | Inositol phosphate metabolism | ↑ | ↓ |
| 17 | 23.369 | Inositol | 79 | Inositol phosphate metabolism | ↑ | ↓ |
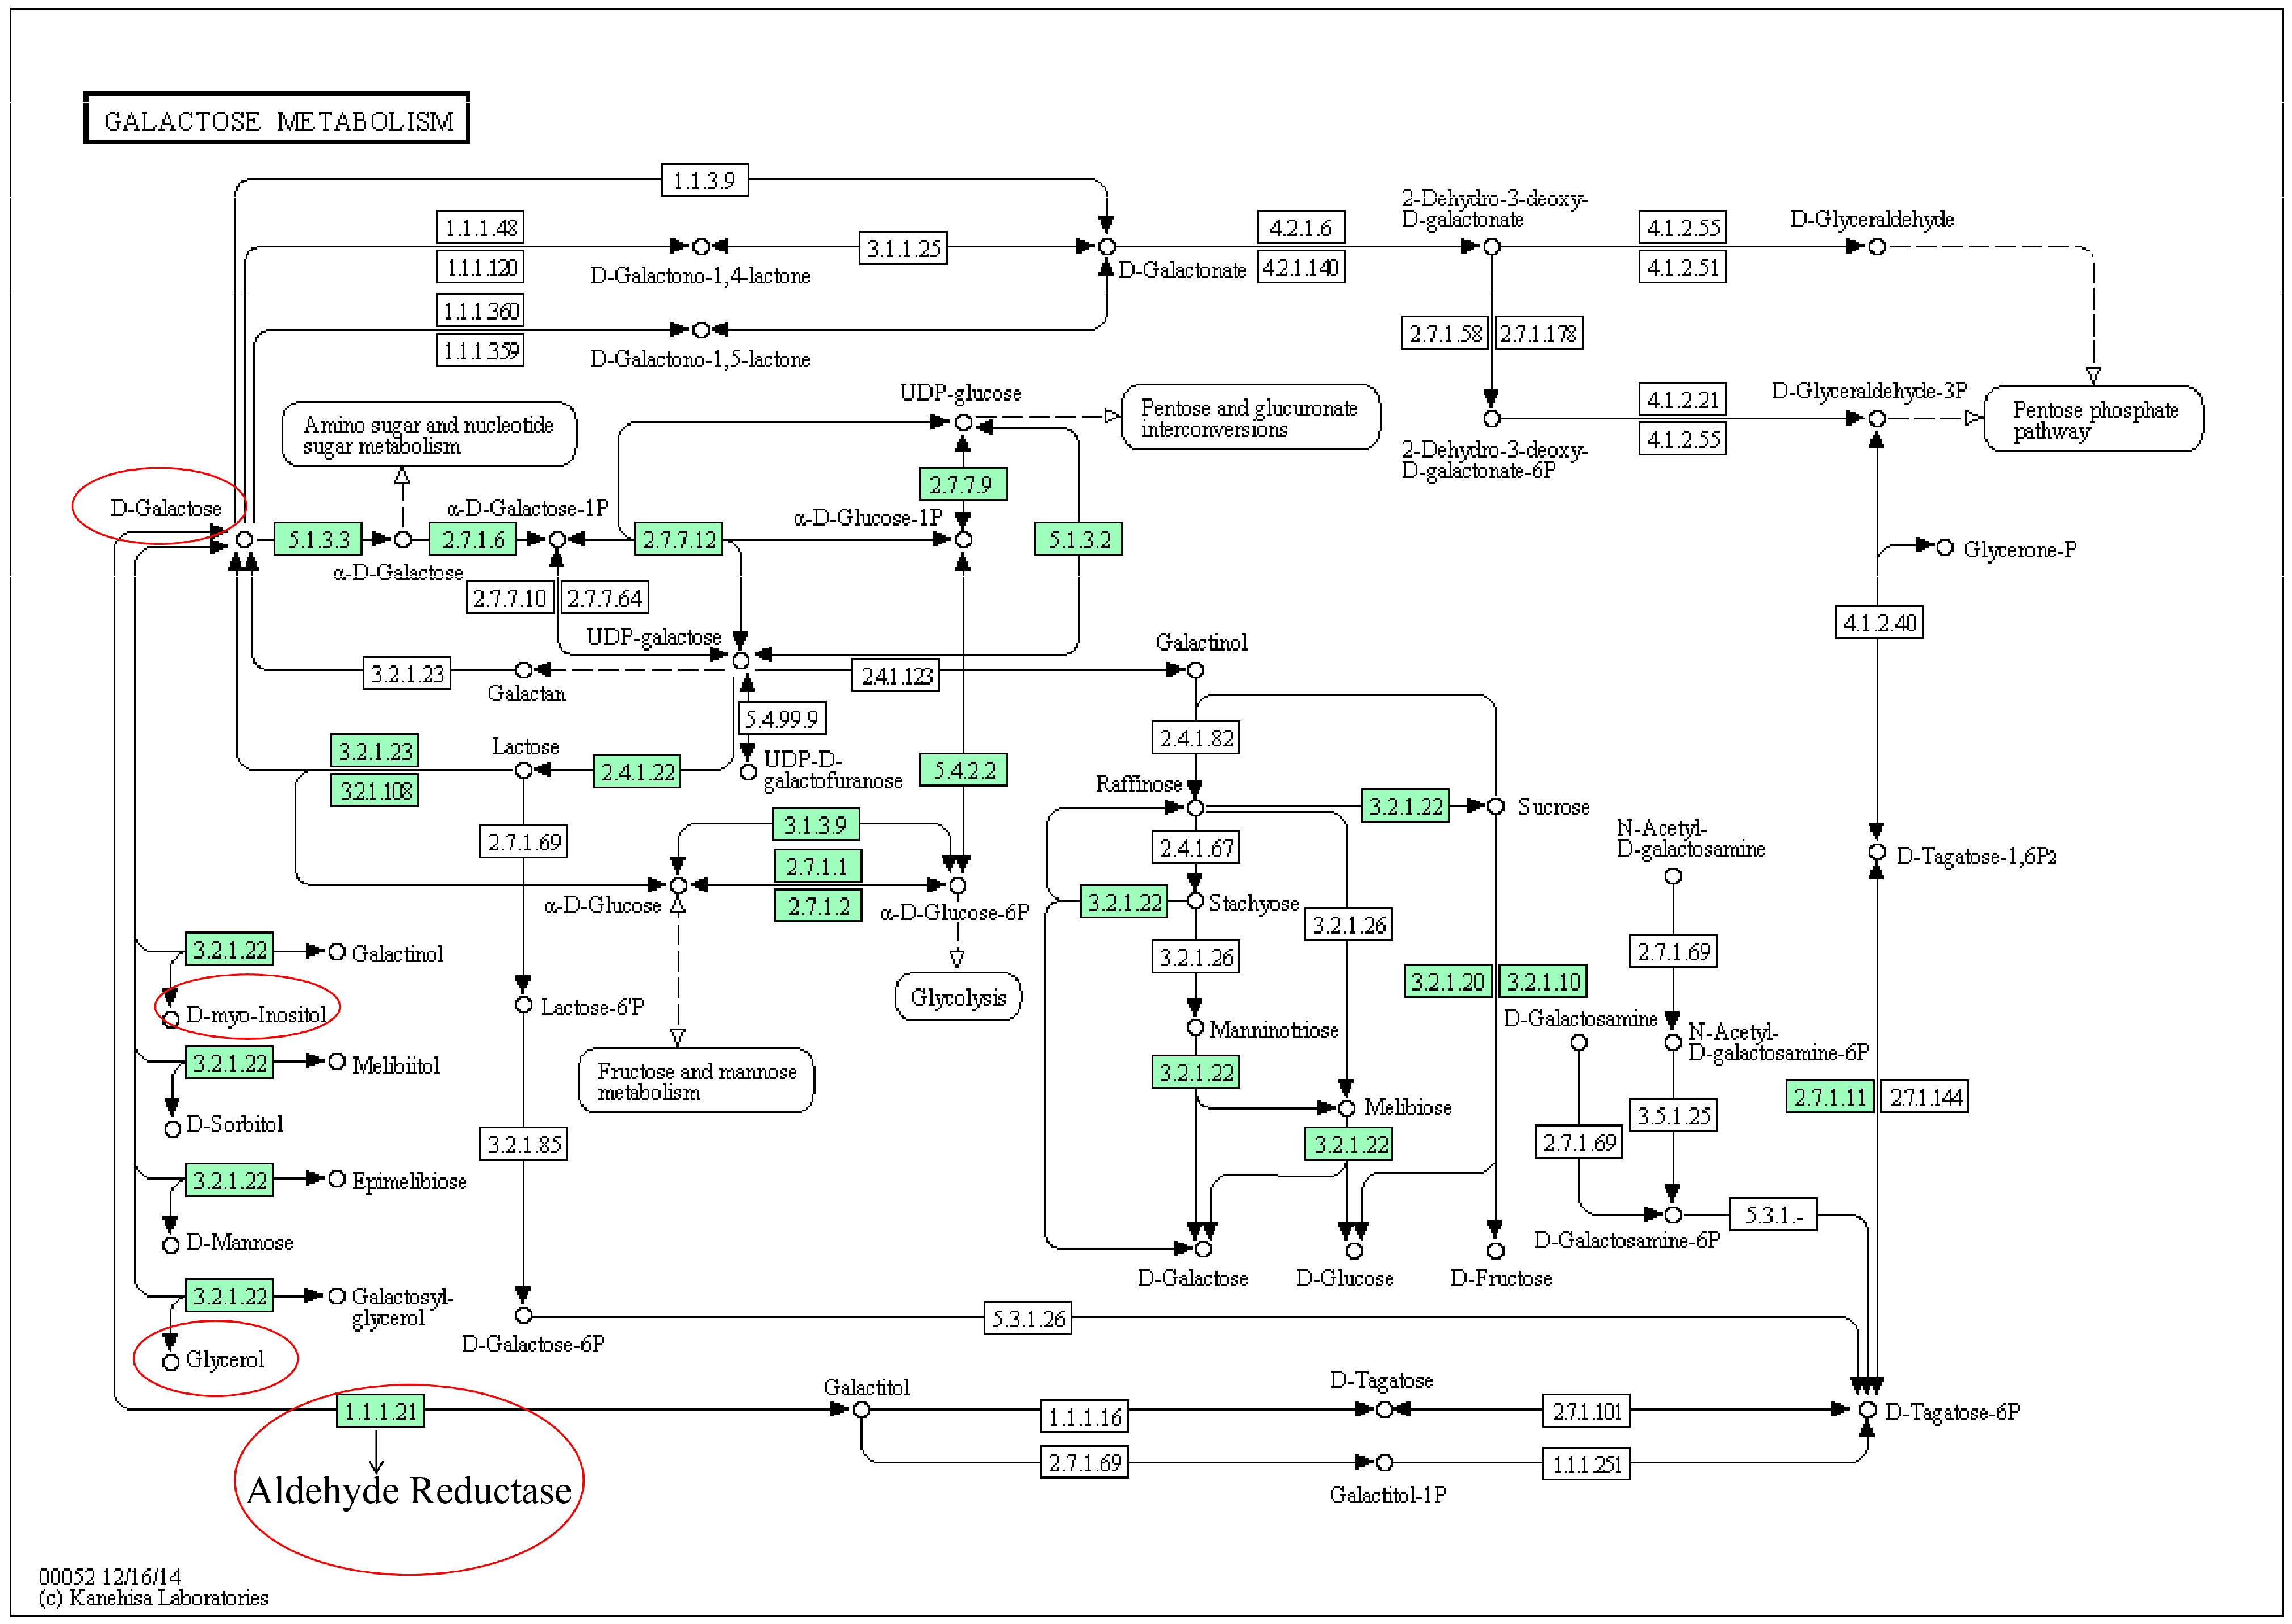
| 18 | 26.353 | d-Galactose | 77 | Galactose metabolism | ↓ | ↑ |
| 19 | 30.818 | Ribitol | 78 | ↑ | ↓ | |
| 20 | 31.326 | Benzeneacetic acid | 66 | ↑ | ↓ | |
| 21 | 33.779 | Squalene | 86 | ↑ | ↓ | |
| No. | Pathway Name | Total | Expected | Hits | Raw p | Holm p | FDR p | Impact |
|---|---|---|---|---|---|---|---|---|
| 1 | Galactose metabolism | 41 | 0.22 | 3 | 1.17 × 10⁻⁶ | 9.33 × 10⁻² | 9.33 × 10⁻² | 0.22 |
| 2 | Glycerolipid metabolism | 32 | 0.17 | 2 | 1.22 × 10⁻² | 9.63 × 10⁻¹ | 4.88 × 10⁻¹ | 0.21 |
| 3 | Riboavin metabolism | 21 | 0.11 | 1 | 1.08 × 10⁻¹ | 1.00 | 1.00 | 0.00 |
| 4 | Pentose phosphate pathway | 32 | 0.17 | 1 | 1.60 × 10⁻¹ | 1.00 | 1.00 | 0.09 |
| 5 | Inositol phosphate metabolism | 39 | 0.21 | 1 | 1.92 × 10⁻¹ | 1.00 | 1.00 | 0.14 |
| 6 | Ascorbate and aldarate metabolism | 45 | 0.24 | 1 | 2.18 × 10⁻¹ | 1.00 | 1.00 | 0.00 |
| 7 | Phenylalanine metabolism | 45 | 0.24 | 1 | 2.18 × 10⁻¹ | 1.00 | 1.00 | 0.05 |
| 8 | Fatty acid biosynthesis | 49 | 0.26 | 1 | 2.35 × 10⁻¹ | 1.00 | 1.00 | 0.00 |
| 9 | Pentose and glucuronate interconversions | 53 | 0.29 | 1 | 2.52 × 10⁻¹ | 1.00 | 1.00 | 0.00 |
| 10 | Cysteine and methionine metabolism | 56 | 0.30 | 1 | 2.64 × 10⁻¹ | 1.00 | 1.00 | 0.01 |
| 11 | Amino sugar and nucleotide sugar metabolism | 88 | 0.48 | 1 | 3.85 × 10⁻¹ | 1.00 | 1.00 | 0.02 |
© 2019 by the authors. Licensee MDPI, Basel, Switzerland. This article is an open access article distributed under the terms and conditions of the Creative Commons Attribution (CC BY) license (http://creativecommons.org/licenses/by/4.0/).
Share and Cite
Jin, H.; Ma, N.; Li, X.; Kang, M.; Guo, M.; Song, L. Application of GC/MS-Based Metabonomic Profiling in Studying the Therapeutic Effects of Aconitum carmichaeli with Ampelopsis japonica Extract on Collagen-Induced Arthritis in Rats. Molecules 2019, 24, 1934. https://doi.org/10.3390/molecules24101934
Jin H, Ma N, Li X, Kang M, Guo M, Song L. Application of GC/MS-Based Metabonomic Profiling in Studying the Therapeutic Effects of Aconitum carmichaeli with Ampelopsis japonica Extract on Collagen-Induced Arthritis in Rats. Molecules. 2019; 24(10):1934. https://doi.org/10.3390/molecules24101934
Chicago/Turabian StyleJin, Hua, Ningning Ma, Xin Li, Mingqin Kang, Maojuan Guo, and Lili Song. 2019. "Application of GC/MS-Based Metabonomic Profiling in Studying the Therapeutic Effects of Aconitum carmichaeli with Ampelopsis japonica Extract on Collagen-Induced Arthritis in Rats" Molecules 24, no. 10: 1934. https://doi.org/10.3390/molecules24101934