QSAR Study of N-Myristoyltransferase Inhibitors of Antimalarial Agents


 ,
,  ,
,  and
and
Abstract
:
1. Introduction
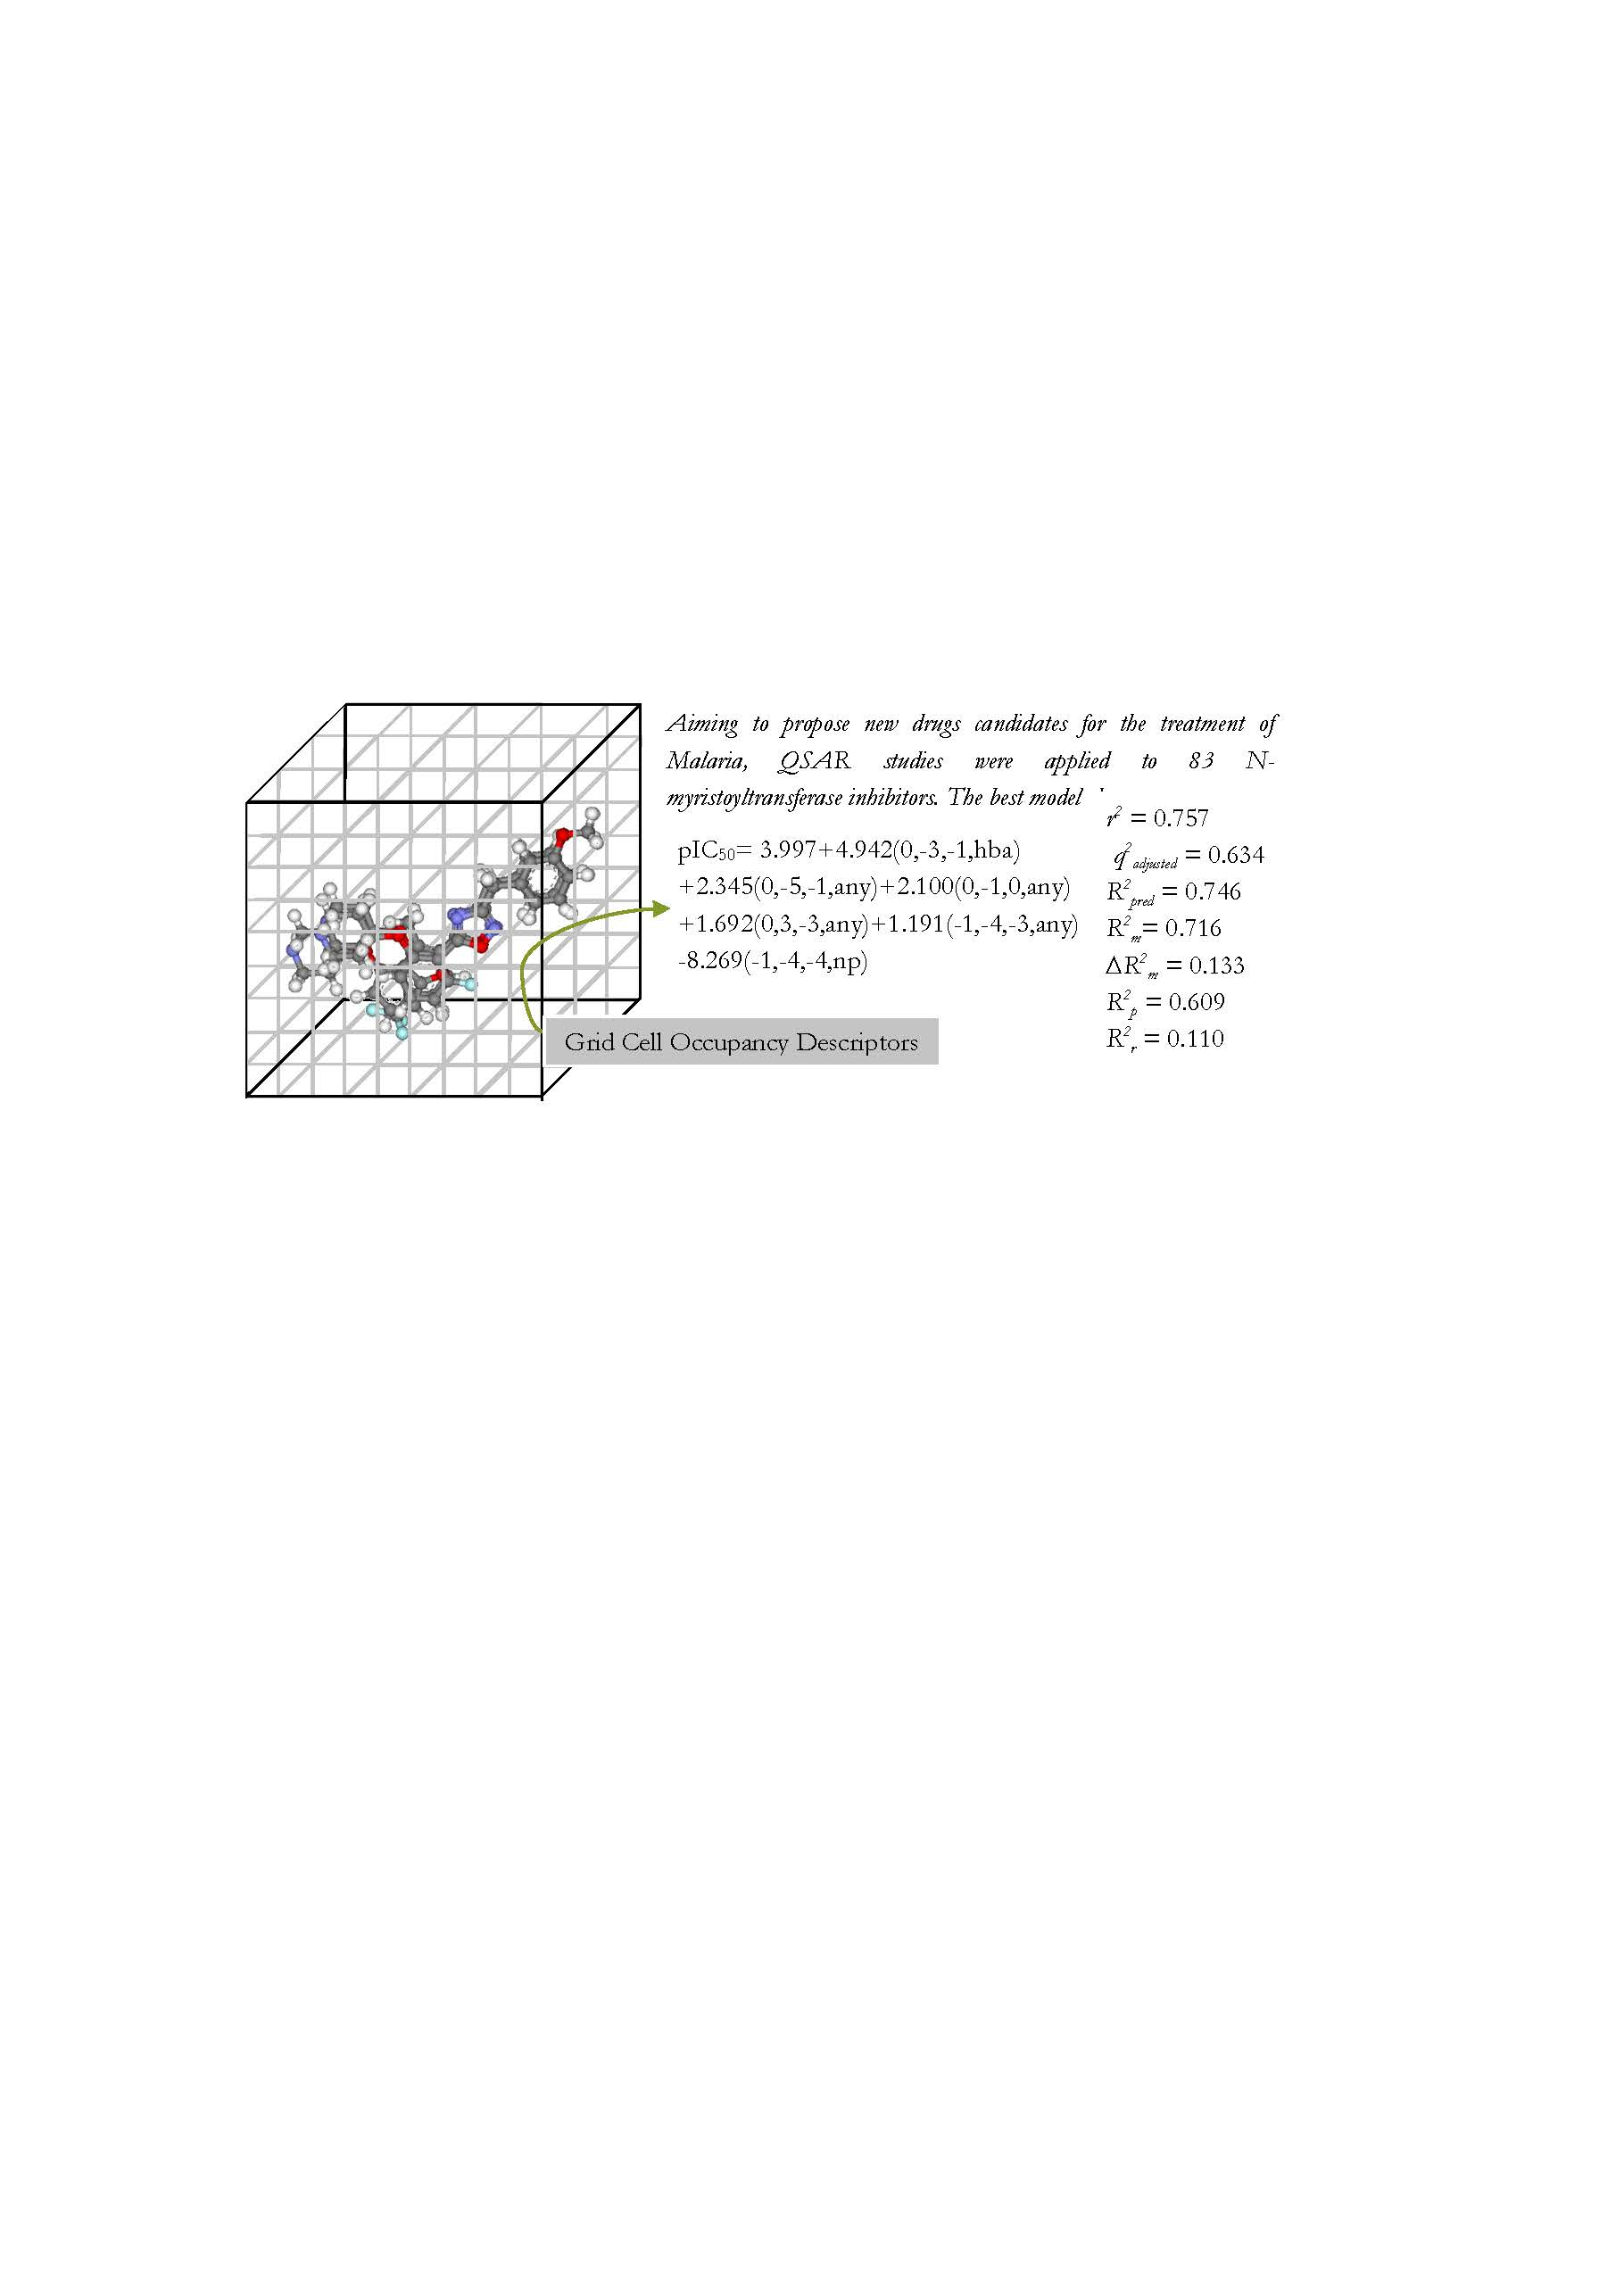
2. Results
Model B3
3. Discussion
4. Materials and Methods
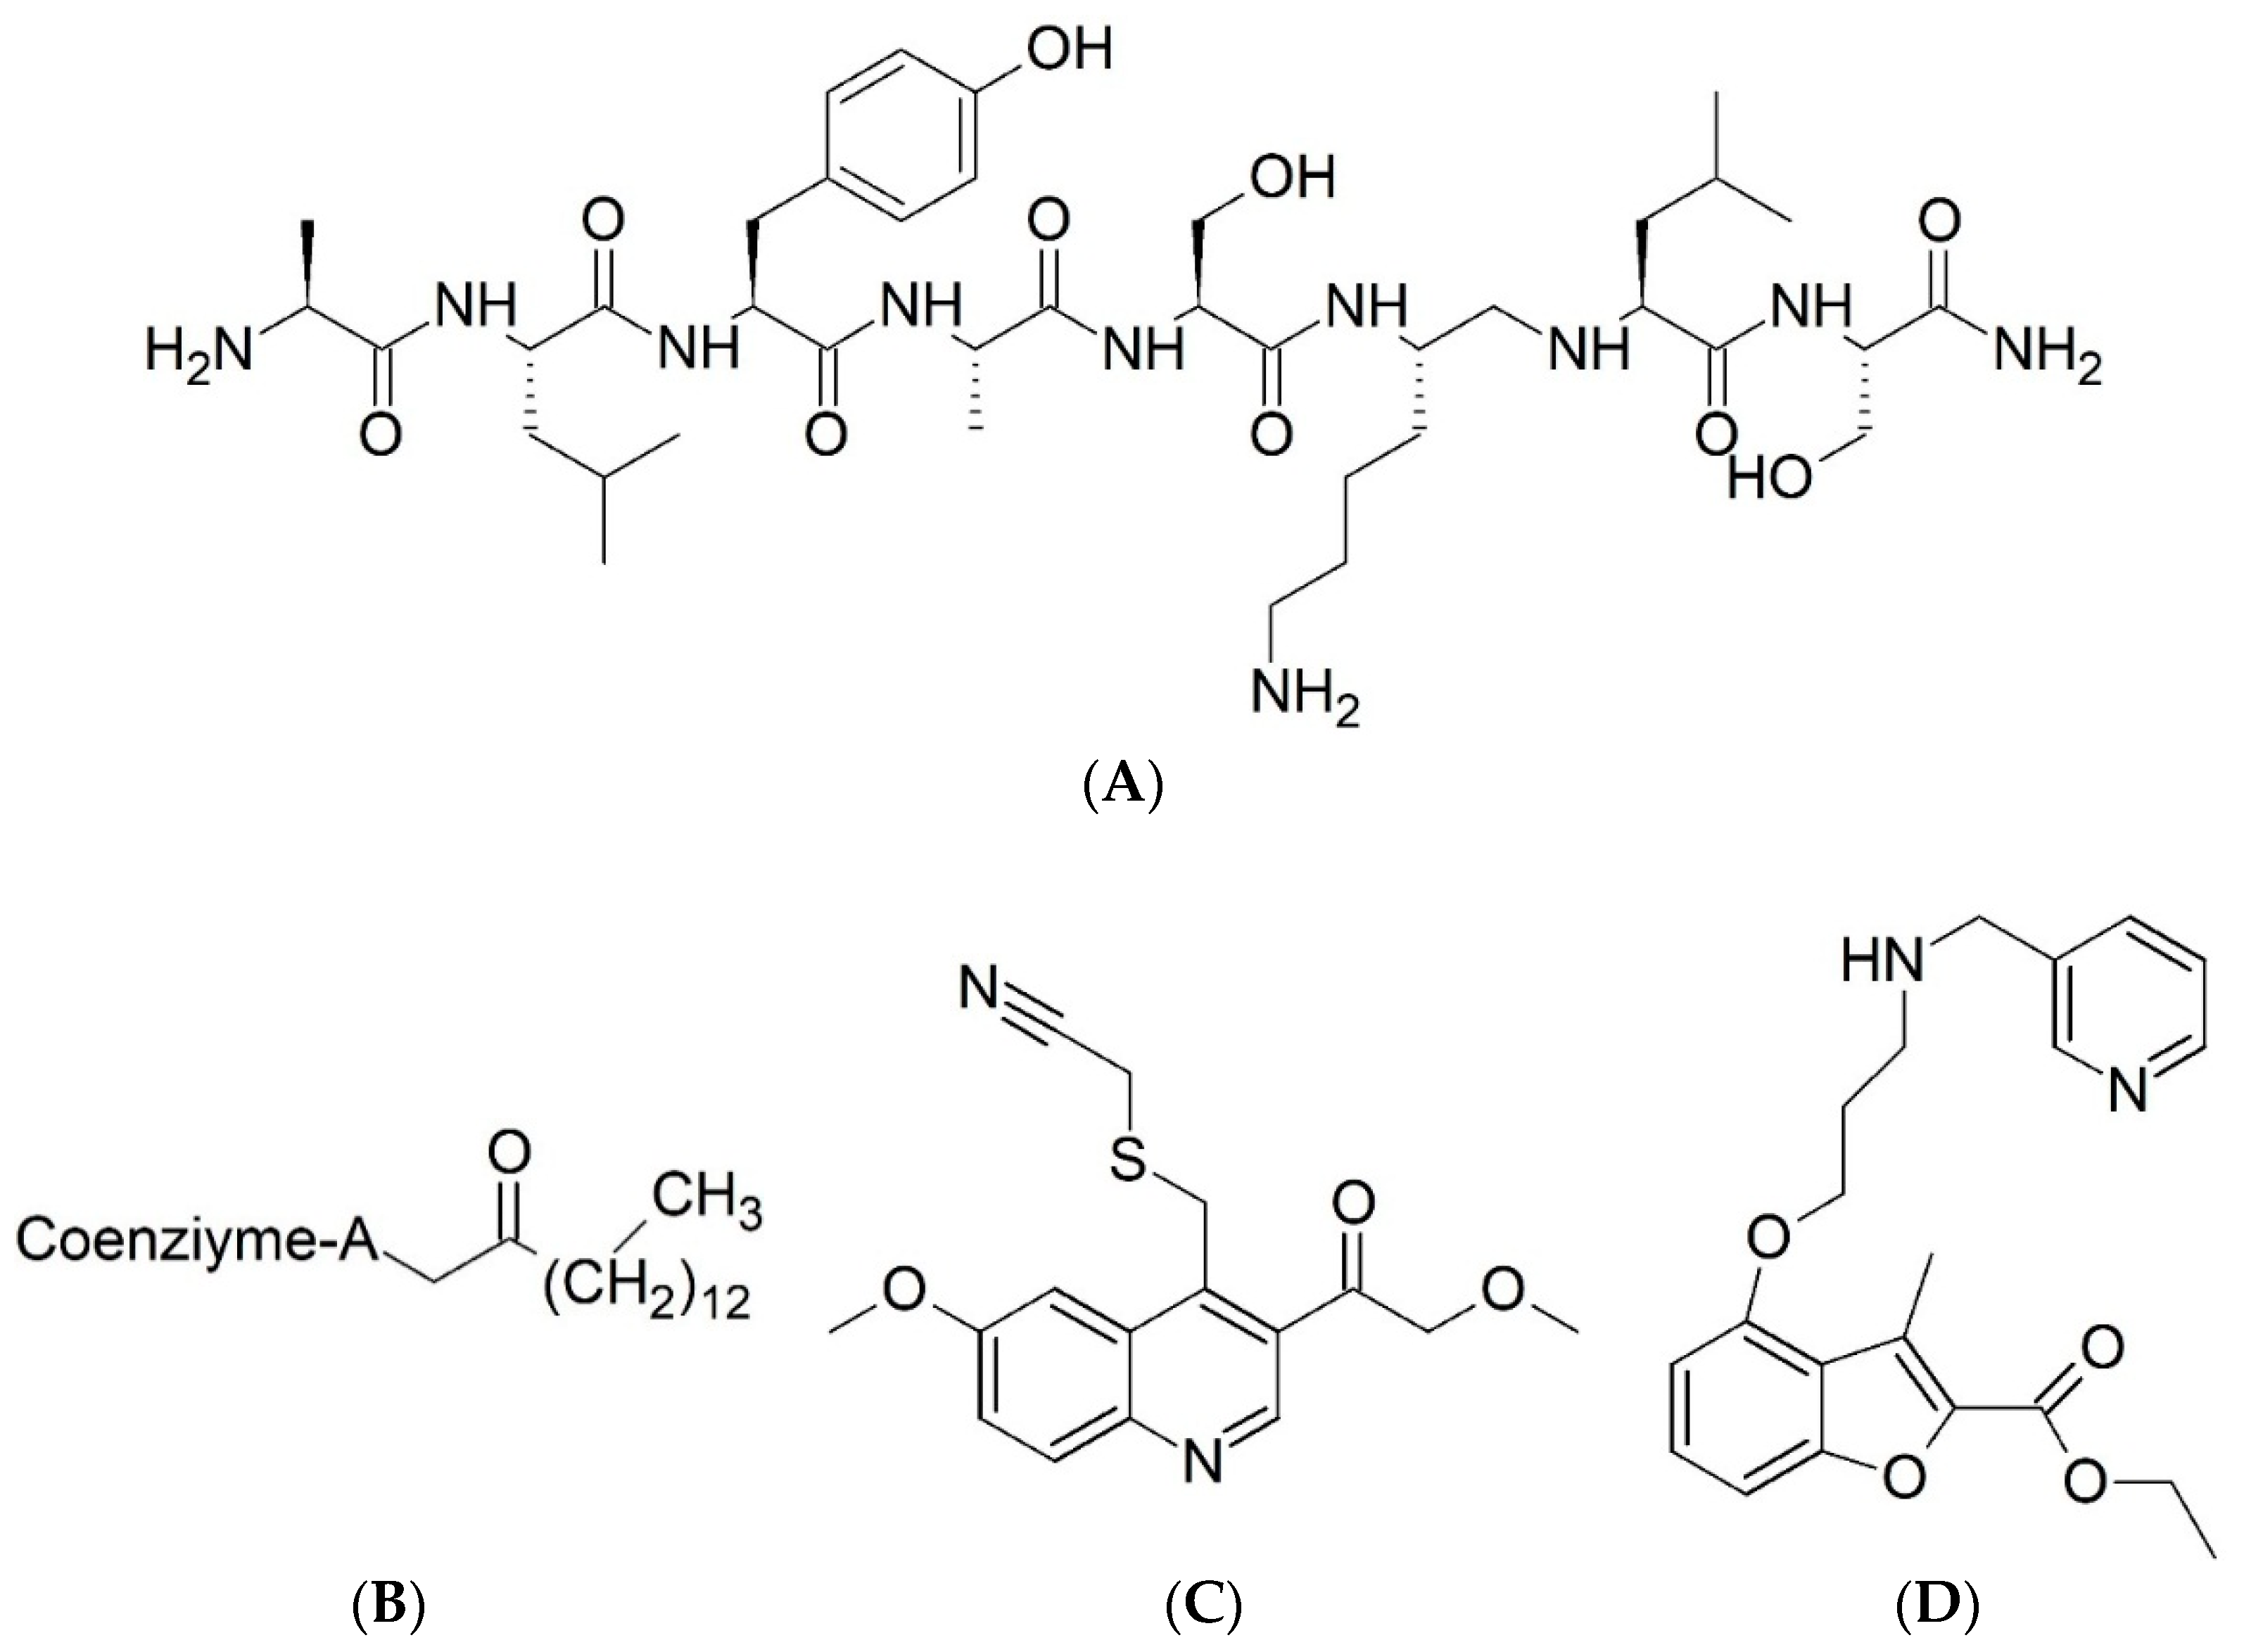
4.1. Biological Data
4.2. Molecular Dynamic Simulation (MDS)
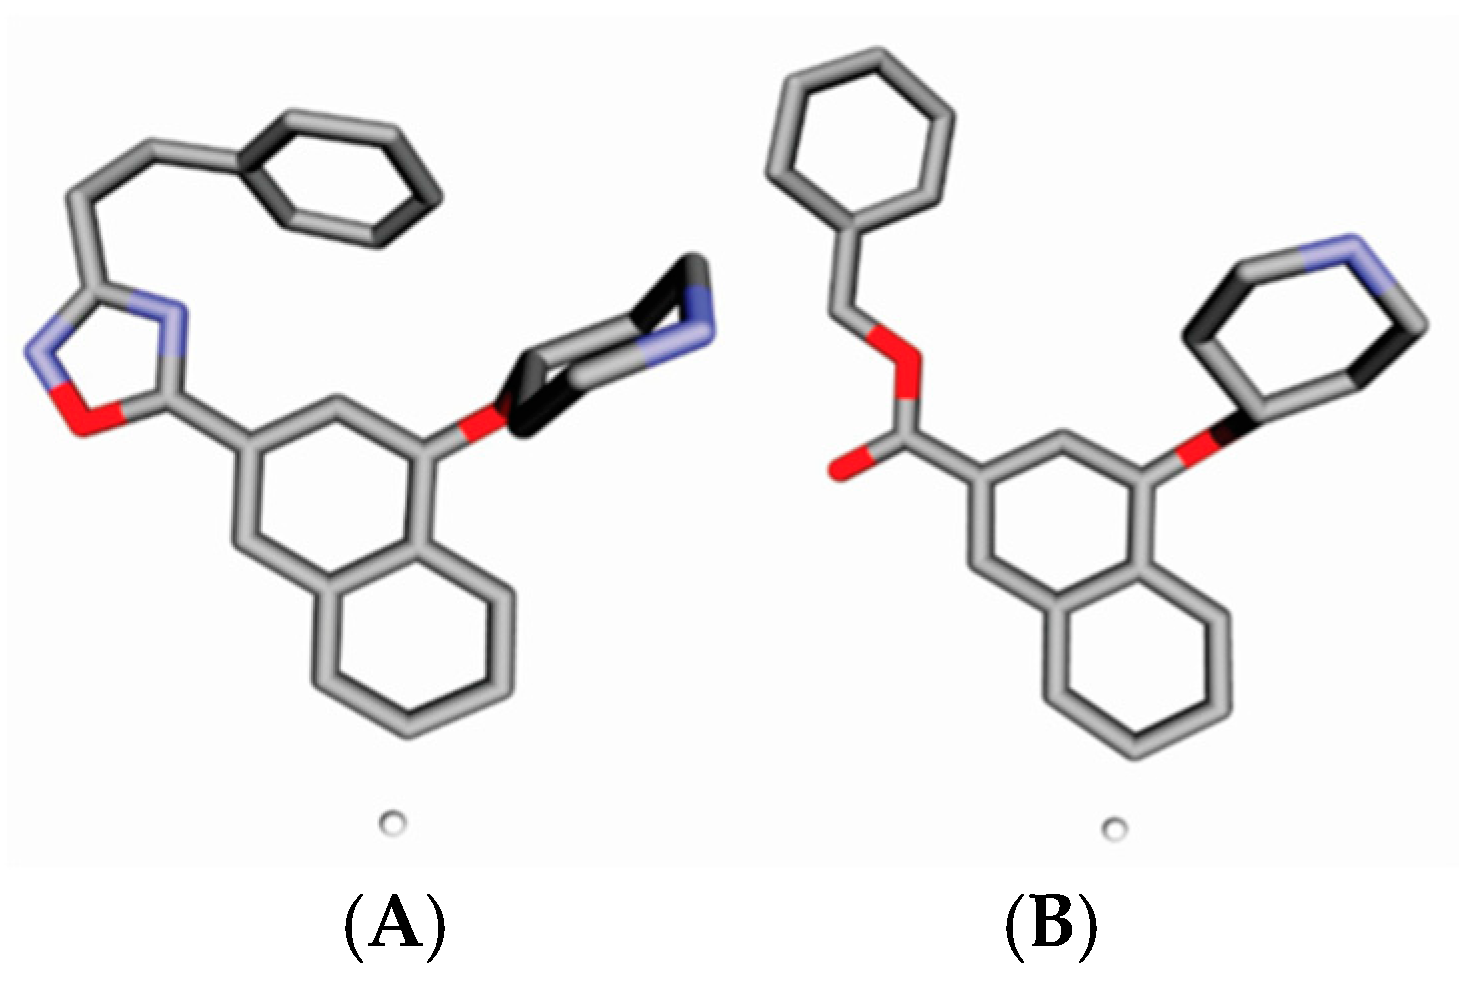
4.3. Alignment Definition
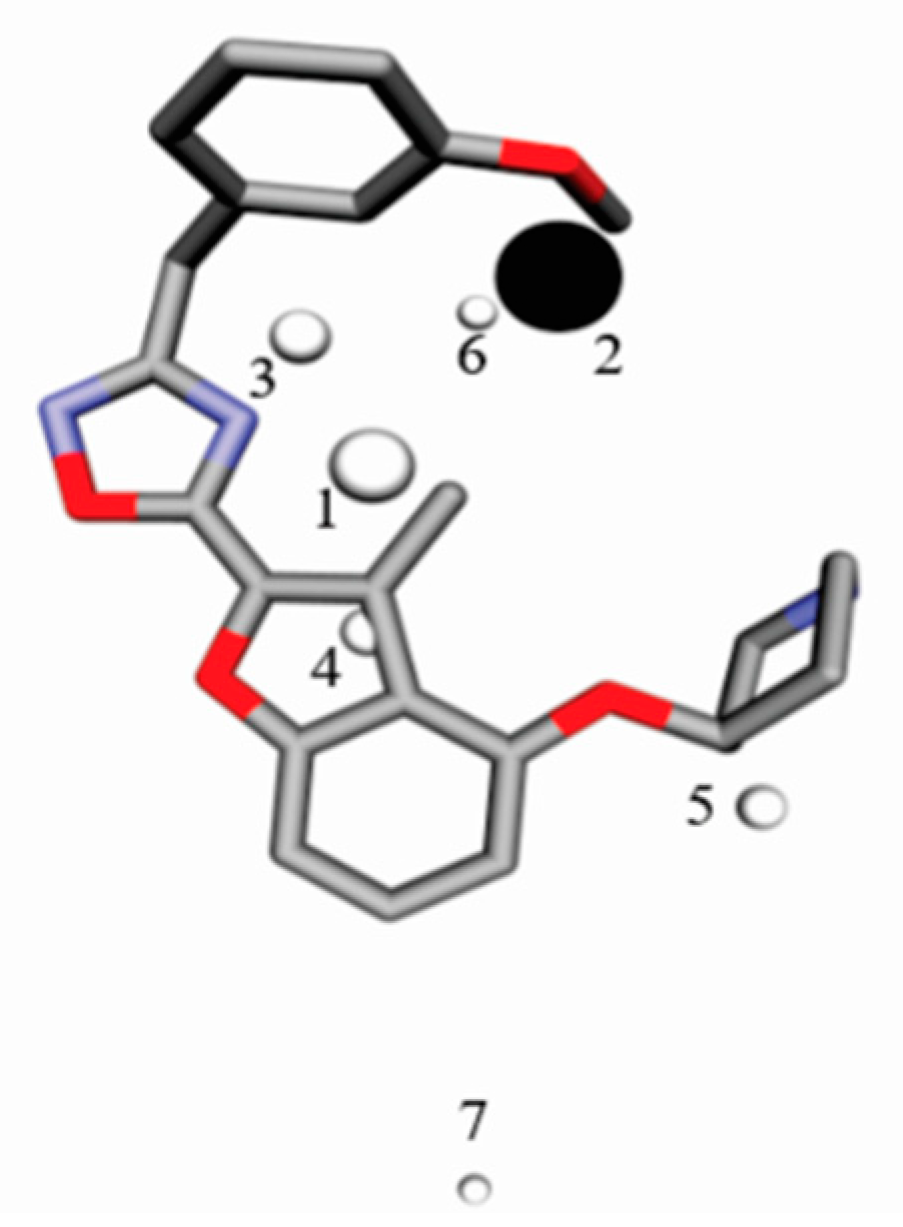
4.4. Interaction Pharmacophore Elements
- (1)
- Coefficient of determination (r2): is a measure of how well the regression line represents the data.
- (2)
- Adjusted cross-validated squared correlation coefficient (q2adj): allows the comparison between models with different number of variables.
- (3)
- Correlation coefficient of external validation set (R2pred): reflects the degree of correlation between the observed (YExp(test))and predicted (YPred(test)) activity data of the test set:where is average value for the dependent variable for the training set.
- (4)
- Modified r2 (r2m(test)) equation determining the proximity between the observed and predicted values with the zero axis intersection:
- (5)
- Y-randomization (R2r) consists of the random exchange of the independent variable values. Thus, the R2r value must be less than the correlation coefficient of the non-randomized models.
- (6)
- R2p penalizes the model R2 for the difference between the squared mean correlation coefficient (R2r) of randomized models and the square correlation coefficient (r2) of the non-randomized model:
4.5. Conformational Selection
5. Conclusions
Author Contributions
Funding
Acknowledgments
Conflicts of Interest
References
- Njoroge, M.; Njuguna, N.M.; Mutai, P.; Ongarora, D.S.B.; Smith, P.W.; Chibale, K. Recent Approaches to Chemical Discovery and Development against Malaria and the Neglected Tropical Diseases Human African Trypanosomiasis and Schistosomiasis. Chem. Rev. 2014, 114, 11138–11163. [Google Scholar] [CrossRef] [PubMed]
- Liu, W.; Li, Y.; Learn, G.H.; Rudicell, R.S. Origin of the human malaria parasite Plasmodium falciparum in gorillas. Nature 2010, 467, 420–467. [Google Scholar] [CrossRef] [PubMed]
- Krungkrai, S.R.; Krungkrai, J. Insights into the pyrimidine biosynthetic pathway of human malaria parasite Plasmodium falciparum as chemotherapeutic target. Asian Pac. J. Trop. Med. 2016, 9, 525–534. [Google Scholar] [CrossRef] [PubMed]
- Ridley, R.G. Medical need, scientific opportunity and the drive for antimalarial drugs. Nature 2002, 415, 686–693. [Google Scholar] [CrossRef] [PubMed]
- Tate, E.W.; Bell, A.S.; Rackham, M.D.; Wright, A.H. N-yristoyltransferase as a potential drug target in malaria and leishmaniasis. Parasitology 2014, 141, 37–49. [Google Scholar] [CrossRef] [PubMed]
- Fidock, D.A.; Nomura, T.; Talley, A.K.; Cooper, R.A.; Dzekunov, S.M.; Ferdig, M.T.; Ursos, L.M.B.; Sidhu, A.B.S.; Naude, B.; Deitsch, K.W. Mutations in the P-falciparum digestive vacuole transmembrane protein PfCRT and evidence for their role in chloroquine resistance. Mol. Cell. 2000, 6, 861–871. [Google Scholar] [CrossRef]
- Dondorp, A.M.; Nosten, F.; Yi, P.; Das, D.; Phyo, A.P.; Tarning, J.; Lwin, K.M.; Ariey, F.; Hanpithakpong, W.; Lee, S.J. Artemisinin Resistance in Plasmodium falciparum Malaria. N. Engl. J. Med. 2009, 361, 455–467. [Google Scholar] [CrossRef] [PubMed]
- Okombo, J.; Chibale, K. Antiplasmodial drug targets: A patent review (2000–2013). Expert.Opin. Ther. Pat. 2016, 26, 107–130. [Google Scholar] [CrossRef] [PubMed]
- Goldston, A.M.; Sharma, A.I.; Paul, K.S.; Engman, D.M. Acylation in trypanosomatids: An essential process and potential drug target. Trends Parasitol. 2014, 30, 350–360. [Google Scholar] [CrossRef] [PubMed]
- Wright, M.H.; Heal, W.P.; Mann, D.J.; Tate, E.W. Protein myristoylation in health and disease. J. Chem. Biol. 2010, 3, 19–35. [Google Scholar] [CrossRef] [PubMed]
- Gunaratne, R.S.; Sajid, M.; Ling, I.T.; Tripathi, R.; Pachebat, J.A.; Holder, A.A. Characterization of N-myristoyltransferase from Plasmodium falciparum. Biochem. J. 2000, 348, 459–463. [Google Scholar] [CrossRef] [PubMed]
- Devadas, B.; ZUpec, M.E.; Freeman, S.K.; Brown, D.L.; Nagarajan, S.; Sikorski, J.A.; McWherter, C.A.; Getman, D.P.; Gordon, J.I. Design and Syntheses of Potent and Selective Dipeptide Inhibitors of Candida albicans Myristoyl-CoA: Protein N-Myristoyltransferase. Med. Chem. 1995, 38, 1837–1840. [Google Scholar] [CrossRef]
- Paige, L.A.; Zheng, G.; DeFrees, S.A.; Cassady, J.M.; Geahlen, R.L. S-(2-Oxopentadecyl)-CoA, a Nonhydrolyzable Analogue of Myristoyl-CoA, Is a Potent Inhibitor of Myristoyl-CoA: Protein N-Myristoyltransferase. J. Med. Chem. 1989, 32, 1665–1667. [Google Scholar] [CrossRef] [PubMed]
- Gonçalves, V.; Brannigan, J.A.; Laporte, A.; Bell, A.S.; Robert, S.M.; Wilkinson, A.J.; Leatherbarrow, R.J.; Tate, E.W. Structure-guided optimization of quinoline inhibitors of Plasmodium N-myristoyltransferase. Med. Chem. Comm. 2016, 8, 191–197. [Google Scholar] [CrossRef] [PubMed]
- Leatherbarrow, R.; Tate, E.; Yu, Z.; Racklam, M. Novel Compounds and Their Use in Therapy. London Patent WO 2013/083991, 13 June 2013. [Google Scholar]
- Hopfinger, A.J.; Wang, S.; Tokarski, J.S.; Jin, B.Q.; Albuquerque, M.G.; Madhav, P.J.; Duraiswami, C. Construction of 3D-QSAR models using the 4D-QSAR analysis formalism. J. Am. Chem. Soc. 1997, 119, 10509–10524. [Google Scholar] [CrossRef]
- Roy, P.P.; Paul, S.; Mitra, I.; Roy, K. On Two Novel Parameters for Validation of Predictive QSAR Models. Molecules 2009, 14, 1660–1701. [Google Scholar] [CrossRef] [Green Version]
- Roy, K.; Chakraborty, P.; Mitra, I.; Ojha, P.K.; Kar, S.; Das, R.N. Some case studies on application of “rm2” metrics for judging quality of quantitative structure-activity relationship predictions: Emphasis on scaling of response data. J. Comput. Chem. 2013, 34, 1071–1082. [Google Scholar] [CrossRef] [PubMed]
- Pan, D.H.; Liu, J.Z.; Senese, C.; Hopfinger, A.J.; Tseng, Y. Characterization of a ligand-receptor binding event using receptor-dependent four-dimensional quantitative structure-activity relationship analysis. J. Med. Chem. 2004, 47, 3075–3088. [Google Scholar] [CrossRef] [PubMed]
- Patel, H.M.; Sing, B.; Bhardwaj, V.; Palkar, M.; Shaikh, M.S.; Rane, R.; Alwan, W.S.; Gadad, A.K.; Noolvi, M.N.; Karpoormath, R. Design, synthesis and evaluation of small molecule imidazo [2,1-b][1,3,4] thiadiazoles as inhibitors of transforming growth factor-beta type-I receptor kinase (ALK5). Eur. J. Med. Chem. 2015, 93, 599–613. [Google Scholar] [CrossRef] [PubMed]
- Molinspiration Cheminformatics (Nova ulica, Slovensky Grob, Slovak Republic). Available online: http://www.molinspiration.com/ (accessed on 13 September 2018).
- Rocha, G.B.; Freire, R.O.; Simas, A.M.; Stewart, J.J.P. RM1: A reparameterization of AM1 for H, C, N, O, P, S, F, Cl, Br, and I. J. Comput. Chem. 2006, 27, 1101–1111. [Google Scholar] [CrossRef] [PubMed]
- Páll, S.; Abraham, M.J.; Kutzner, C.; Hess, B.; Lindahl, E. Tackling Exascale Software Challenges in Molecular Dynamics Simulations with GROMACS. In International Conference on Exascale Applications and Software; Springer International Publishing: Cham, Switzerland, 2015; pp. 3–27. [Google Scholar]
- Oliveira, A.A.; Ramalho, T.C.; da Cunha, E.F.F. QSAR Study of Androstenedione Analogs as Aromatase Inhibitors. Lett. Drug Des. Discov. 2009, 6, 554–562. [Google Scholar] [CrossRef]
- da Cunha, E.F.F.; Albuquerque, M.G.; Antunes, O.A.C.; de Alencastro, R.B. 4D-QSAR models of HOE/BAY-793 analogues as HIV-1 protease inhibitors. QSAR Comb. Sci. 2015, 24, 240–253. [Google Scholar] [CrossRef]
- Caldas, G.B.; Ramalho, T.C.; da Cunha, E.F.F. Application of 4D-QSAR studies to a series of benzothiophene analogs. J. Mol. Mod. 2014, 20, 2420. [Google Scholar] [CrossRef] [PubMed]
- Kiralj, R.; Ferreira, M.M.C. Basic Validation Procedures for Regression Models in QSAR and QSPR Studies: Theory and Application. J. Braz. Chem. Soc. 2009, 20, 770–787. [Google Scholar] [CrossRef]
- Roy, K.; Paul, S. Exploring 2D and 3D QSARs of 2,4-Diphenyl-1,3-oxazolines for Ovicidal Activity against Tetranychus urticae. QSAR Comb. Sci. 2009, 28, 406–425. [Google Scholar] [CrossRef]
- Veerasamy, R.; Rajak, H.; Jain, A.; Sivadasan, S.; Varghese, C.P.; Agrawal, R.K. Validation of QSAR Models—Strategies and Importance. Int. J. Drug Des. Discov. 2011, 3, 511–519. [Google Scholar]
- Cormanich, R.A.; Moreira, M.A.; Freitas, M.P.; Ramalho, T.C.; Anconi, C.P.A.; Rittner, R.; Contreras, R.H.; Tormena, C.F. 1hJFH coupling in 2-fluorophenol revisited: Is intramolecular hydrogen bond responsible for this long-range coupling? Magn. Reson. Chem. 2011, 49, 763–767. [Google Scholar] [CrossRef] [PubMed]
- Caetano, M.S.; Ramalho, T.C.; Botrel, D.F.; da Cunha, E.F.F.; de Mello, W.C. Understanding the inactivation process of organophosphorus herbicides: A DFT study of glyphosate metallic complexes with Zn2+, Ca2+, Mg2+, Cu2+, Co3+, Fe3+, Cr3+, and Al3+. Int. J. Quantum Chem. 2012, 112, 2752–2762. [Google Scholar] [CrossRef]
- De Castro, A.A.; Prandi, I.G.; Kuca, K.; Ramalho, T.C. Organophosphorus degrading enzymes: Molecular basis and perspectives for enzymatic bioremediation of agrochemicals. Cienc. Agrotecnol. 2017, 41, 471–482. [Google Scholar]
Sample Availability: Samples of all compounds are available from the authors. |


| Alignment | r2 | RMSEC | q2adj | RMSECV | R2Pred | RMSEP | r2m | R2r | R2p |
|---|---|---|---|---|---|---|---|---|---|
| A1 | 0.746 | 0.481 | 0.607 | 0.549 | 0.532 | 0.65 | 0.71 | 0.312 | 0.82 |
| A2 | 0.744 | 0.478 | 0.608 | 0.548 | 0.548 | 0.663 | 0.692 | 0.343 | 0.799 |
| A3 | 0.761 | 0.469 | 0.609 | 0.546 | 0.508 | 0.702 | 0.735 | 0.182 | 0.994 |
| A4 | 0.708 | 0.508 | 0.576 | 0.579 | 0.588 | 0.595 | 0.645 | 0.287 | 0.825 |
| A5 | 0.736 | 0.511 | 0.589 | 0.566 | 0.477 | 0.698 | 0.766 | 0.245 | 0.895 |
| A6 | 0.739 | 0.477 | 0.582 | 0.563 | 0.567 | 0.637 | 0.67 | 0.286 | 0.83 |
| A7 | 0.722 | 0.503 | 0.584 | 0.571 | 0.555 | 0.656 | 0.683 | 0.291 | 0.831 |
| A8 | 0.746 | 0.445 | 0.605 | 0.551 | 0.62 | 0.59 | 0.606 | 0.216 | 0.891 |
| A9 | 0.734 | 0.491 | 0.578 | 0.566 | 0.547 | 0.684 | 0.693 | 0.25 | 0.861 |
| A10 | 0.723 | 0.519 | 0.583 | 0.572 | 0.503 | 0.676 | 0.74 | 0.311 | 0.816 |
| Alignment | r2 | RMSEC | q2adj | RMSECV | R2Pred | RMSEP | R2m | R2r | R2p |
|---|---|---|---|---|---|---|---|---|---|
| B1 | 0.728 | 0.504 | 0.617 | 0.544 | 0.728 | 0.532 | 0.688 | 0.301 | 0.476 |
| B2 | 0.728 | 0.515 | 0.607 | 0.553 | 0.763 | 0.496 | 0.749 | 0.289 | 0.482 |
| B3 | 0.757 | 0.472 | 0.634 | 0.527 | 0.746 | 0.515 | 0.716 | 0.11 | 0.609 |
| B4 | 0.704 | 0.549 | 0.585 | 0.573 | 0.782 | 0.476 | 0.765 | 0.253 | 0.473 |
| B5 | 0.725 | 0.5 | 0.601 | 0.55 | 0.706 | 0.553 | 0.692 | 0.198 | 0.526 |
| B6 | 0.692 | 0.559 | 0.576 | 0.581 | 0.771 | 0.489 | 0.755 | 0.272 | 0.448 |
| B7 | 0.69 | 0.556 | 0.581 | 0.577 | 0.751 | 0.509 | 0.735 | 0.289 | 0.437 |
| B8 | 0.73 | 0.514 | 0.6 | 0.55 | 0.77 | 0.489 | 0.75 | 0.209 | 0.527 |
| B9 | 0.723 | 0.528 | 0.605 | 0.555 | 0.786 | 0.472 | 0.773 | 0.229 | 0.508 |
| B10 | 0.744 | 0.501 | 0.619 | 0.542 | 0.779 | 0.48 | 0.744 | 0.289 | 0.502 |
| No. | Structure | pIC50 | No. | Structure | pIC50 |
|---|---|---|---|---|---|
| A | 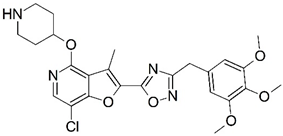 | 7.014 | B | 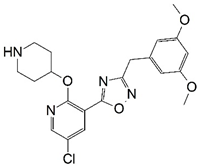 | 7.171 |
| C | 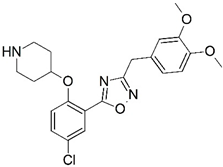 | 7.622 | D | 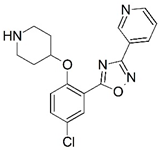 | 8.161 |
| E |  | 7.894 |
| Molecule | miLogP | MW | nON | nOHNH | n | nviolations |
|---|---|---|---|---|---|---|
| A | 3.13 | 514.97 | 10 | 1 | 8 | 1 |
| B | 2.74 | 430.89 | 8 | 1 | 7 | 0 |
| C | 3.13 | 415.88 | 7 | 1 | 6 | 0 |
| D | 2.41 | 356.81 | 6 | 1 | 4 | 0 |
| E | 3.52 | 415.88 | 7 | 1 | 6 | 0 |
| No. | Structure | pIC50 | No. | Structure | pIC50 |
|---|---|---|---|---|---|
| 1 * | 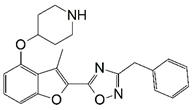 | 6.155 | 2 | 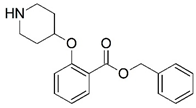 | 4.000 |
| 3 * | 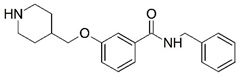 | 4.000 | 4 | 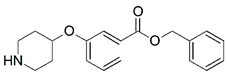 | 4.000 |
| 5 * | 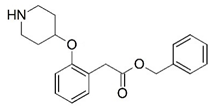 | 4.000 | 6 * |  | 4.000 |
| 7 | 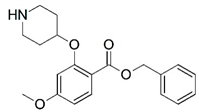 | 4.000 | 8 | 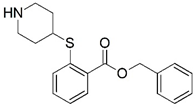 | 4.000 |
| 9 |  | 4.000 | 10 | 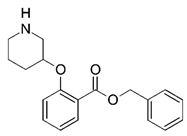 | 4.000 |
| 11 | 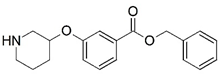 | 4.000 | 12 * |  | 5.721 |
| 13 |  | 4.785 | 14 |  | 5.113 |
| 15 | 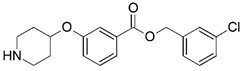 | 4.000 | 16 * | 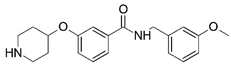 | 4.000 |
| 17 | 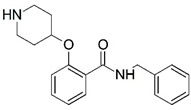 | 4.000 | 18 |  | 4.745 |
| 19 |  | 5.215 | 20 * |  | 4.366 |
| 21 |  | 4.000 | 22 |  | 4.000 |
| 23 |  | 4.000 | 24 | 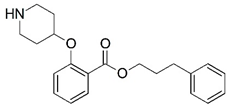 | 4.000 |
| 25 | 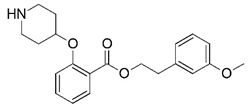 | 4.000 | 26 |  | 5.699 |
| 27 | 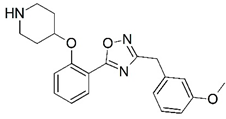 | 6.400 | 28 |  | 6.102 |
| 29 |  | 5.780 | 30 * | 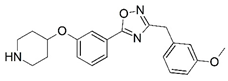 | 6.398 |
| 31 |  | 5.796 | 32 | 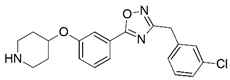 | 5.420 |
| 33 * |  | 5.292 | 34 |  | 6.456 |
| 35 | 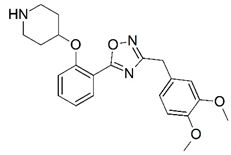 | 6.678 | 36 |  | 6.468 |
| 37 |  | 5.131 | 38 | 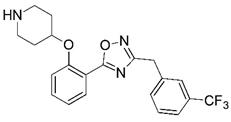 | 5.585 |
| 39 * |  | 4.730 | 40 * |  | 5.585 |
| 41 | 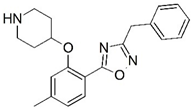 | 5.886 | 42 |  | 5.284 |
| 43 | 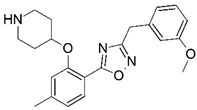 | 6.000 | 44 | 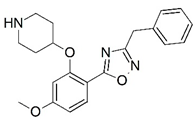 | 5.602 |
| 45 | 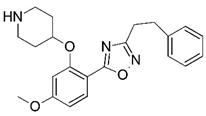 | 4.876 | 46 | 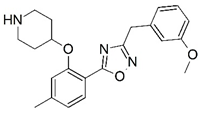 | 6.319 |
| 47 |  | 6.215 | 48 |  | 6.051 |
| 49 | 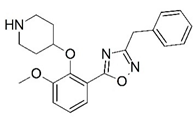 | 4.445 | 50 * | 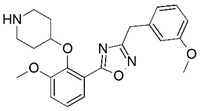 | 4.958 |
| 51 |  | 4.086 | 52 |  | 4.217 |
| 53 |  | 6.398 | 54 | 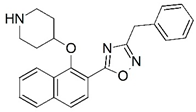 | 5.569 |
| 55 | 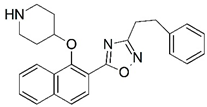 | 4.663 | 56 * | 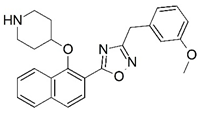 | 6.229 |
| 57 * | 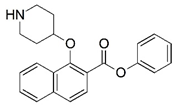 | 4.182 | 58 |  | 5.056 |
| 59 | 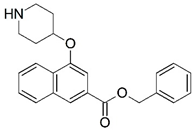 | 5.009 | 60 |  | 5.149 |
| 61 * | 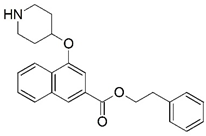 | 5.886 | 62 |  | 5.886 |
| 63 | 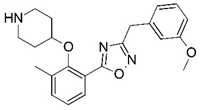 | 4.801 | 64 | 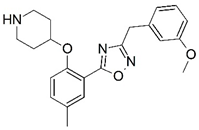 | 5.201 |
| 65 * | 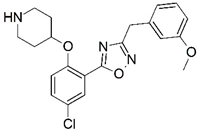 | 6.959 | 66 * | 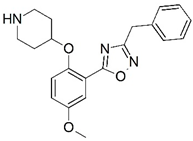 | 5.538 |
| 67 | 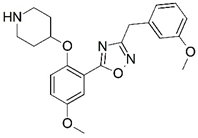 | 6.482 | 68 | 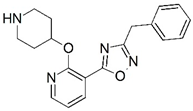 | 5.921 |
| 69* | 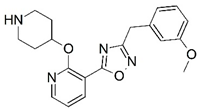 | 6.769 | 70 |  | 5.569 |
| 71 | 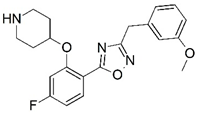 | 6.824 | 72 | 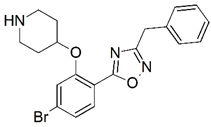 | 6.051 |
| 73 |  | 7.222 | 74 |  | 6.000 |
| 75 | 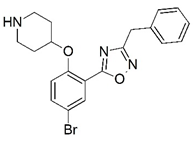 | 6.620 | 76 * | 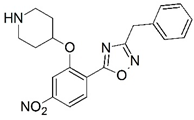 | 6.638 |
| 77 | 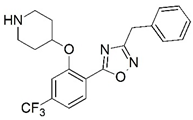 | 5.495 | 78 | 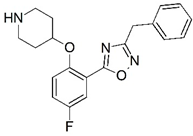 | 5.959 |
| 79 | 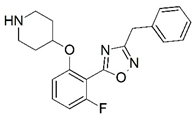 | 6.181 | 80 * | 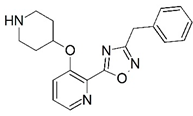 | 5.187 |
| 81 | 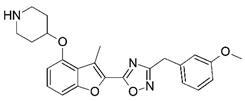 | 7.301 | 82 |  | 6.921 |
| 83 |  | 6.201 |
© 2018 by the authors. Licensee MDPI, Basel, Switzerland. This article is an open access article distributed under the terms and conditions of the Creative Commons Attribution (CC BY) license (http://creativecommons.org/licenses/by/4.0/).
Share and Cite
Santos-Garcia, L.; De Mecenas Filho, M.A.; Musilek, K.; Kuca, K.; Ramalho, T.C.; Da Cunha, E.F.F. QSAR Study of N-Myristoyltransferase Inhibitors of Antimalarial Agents. Molecules 2018, 23, 2348. https://doi.org/10.3390/molecules23092348
Santos-Garcia L, De Mecenas Filho MA, Musilek K, Kuca K, Ramalho TC, Da Cunha EFF. QSAR Study of N-Myristoyltransferase Inhibitors of Antimalarial Agents. Molecules. 2018; 23(9):2348. https://doi.org/10.3390/molecules23092348
Chicago/Turabian StyleSantos-Garcia, Letícia, Marco Antônio De Mecenas Filho, Kamil Musilek, Kamil Kuca, Teodorico Castro Ramalho, and Elaine Fontes Ferreira Da Cunha. 2018. "QSAR Study of N-Myristoyltransferase Inhibitors of Antimalarial Agents" Molecules 23, no. 9: 2348. https://doi.org/10.3390/molecules23092348
APA StyleSantos-Garcia, L., De Mecenas Filho, M. A., Musilek, K., Kuca, K., Ramalho, T. C., & Da Cunha, E. F. F. (2018). QSAR Study of N-Myristoyltransferase Inhibitors of Antimalarial Agents. Molecules, 23(9), 2348. https://doi.org/10.3390/molecules23092348