Development and Validation of a HPLC-MS/MS Method for Simultaneous Determination of Twelve Bioactive Compounds in Epimedium: Application to a Pharmacokinetic Study in Rats

 ,
,
Abstract
:1. Introduction
2. Results and Discussion
2.1. Method Development
2.2. Sample Preparation
2.3. Method Validation
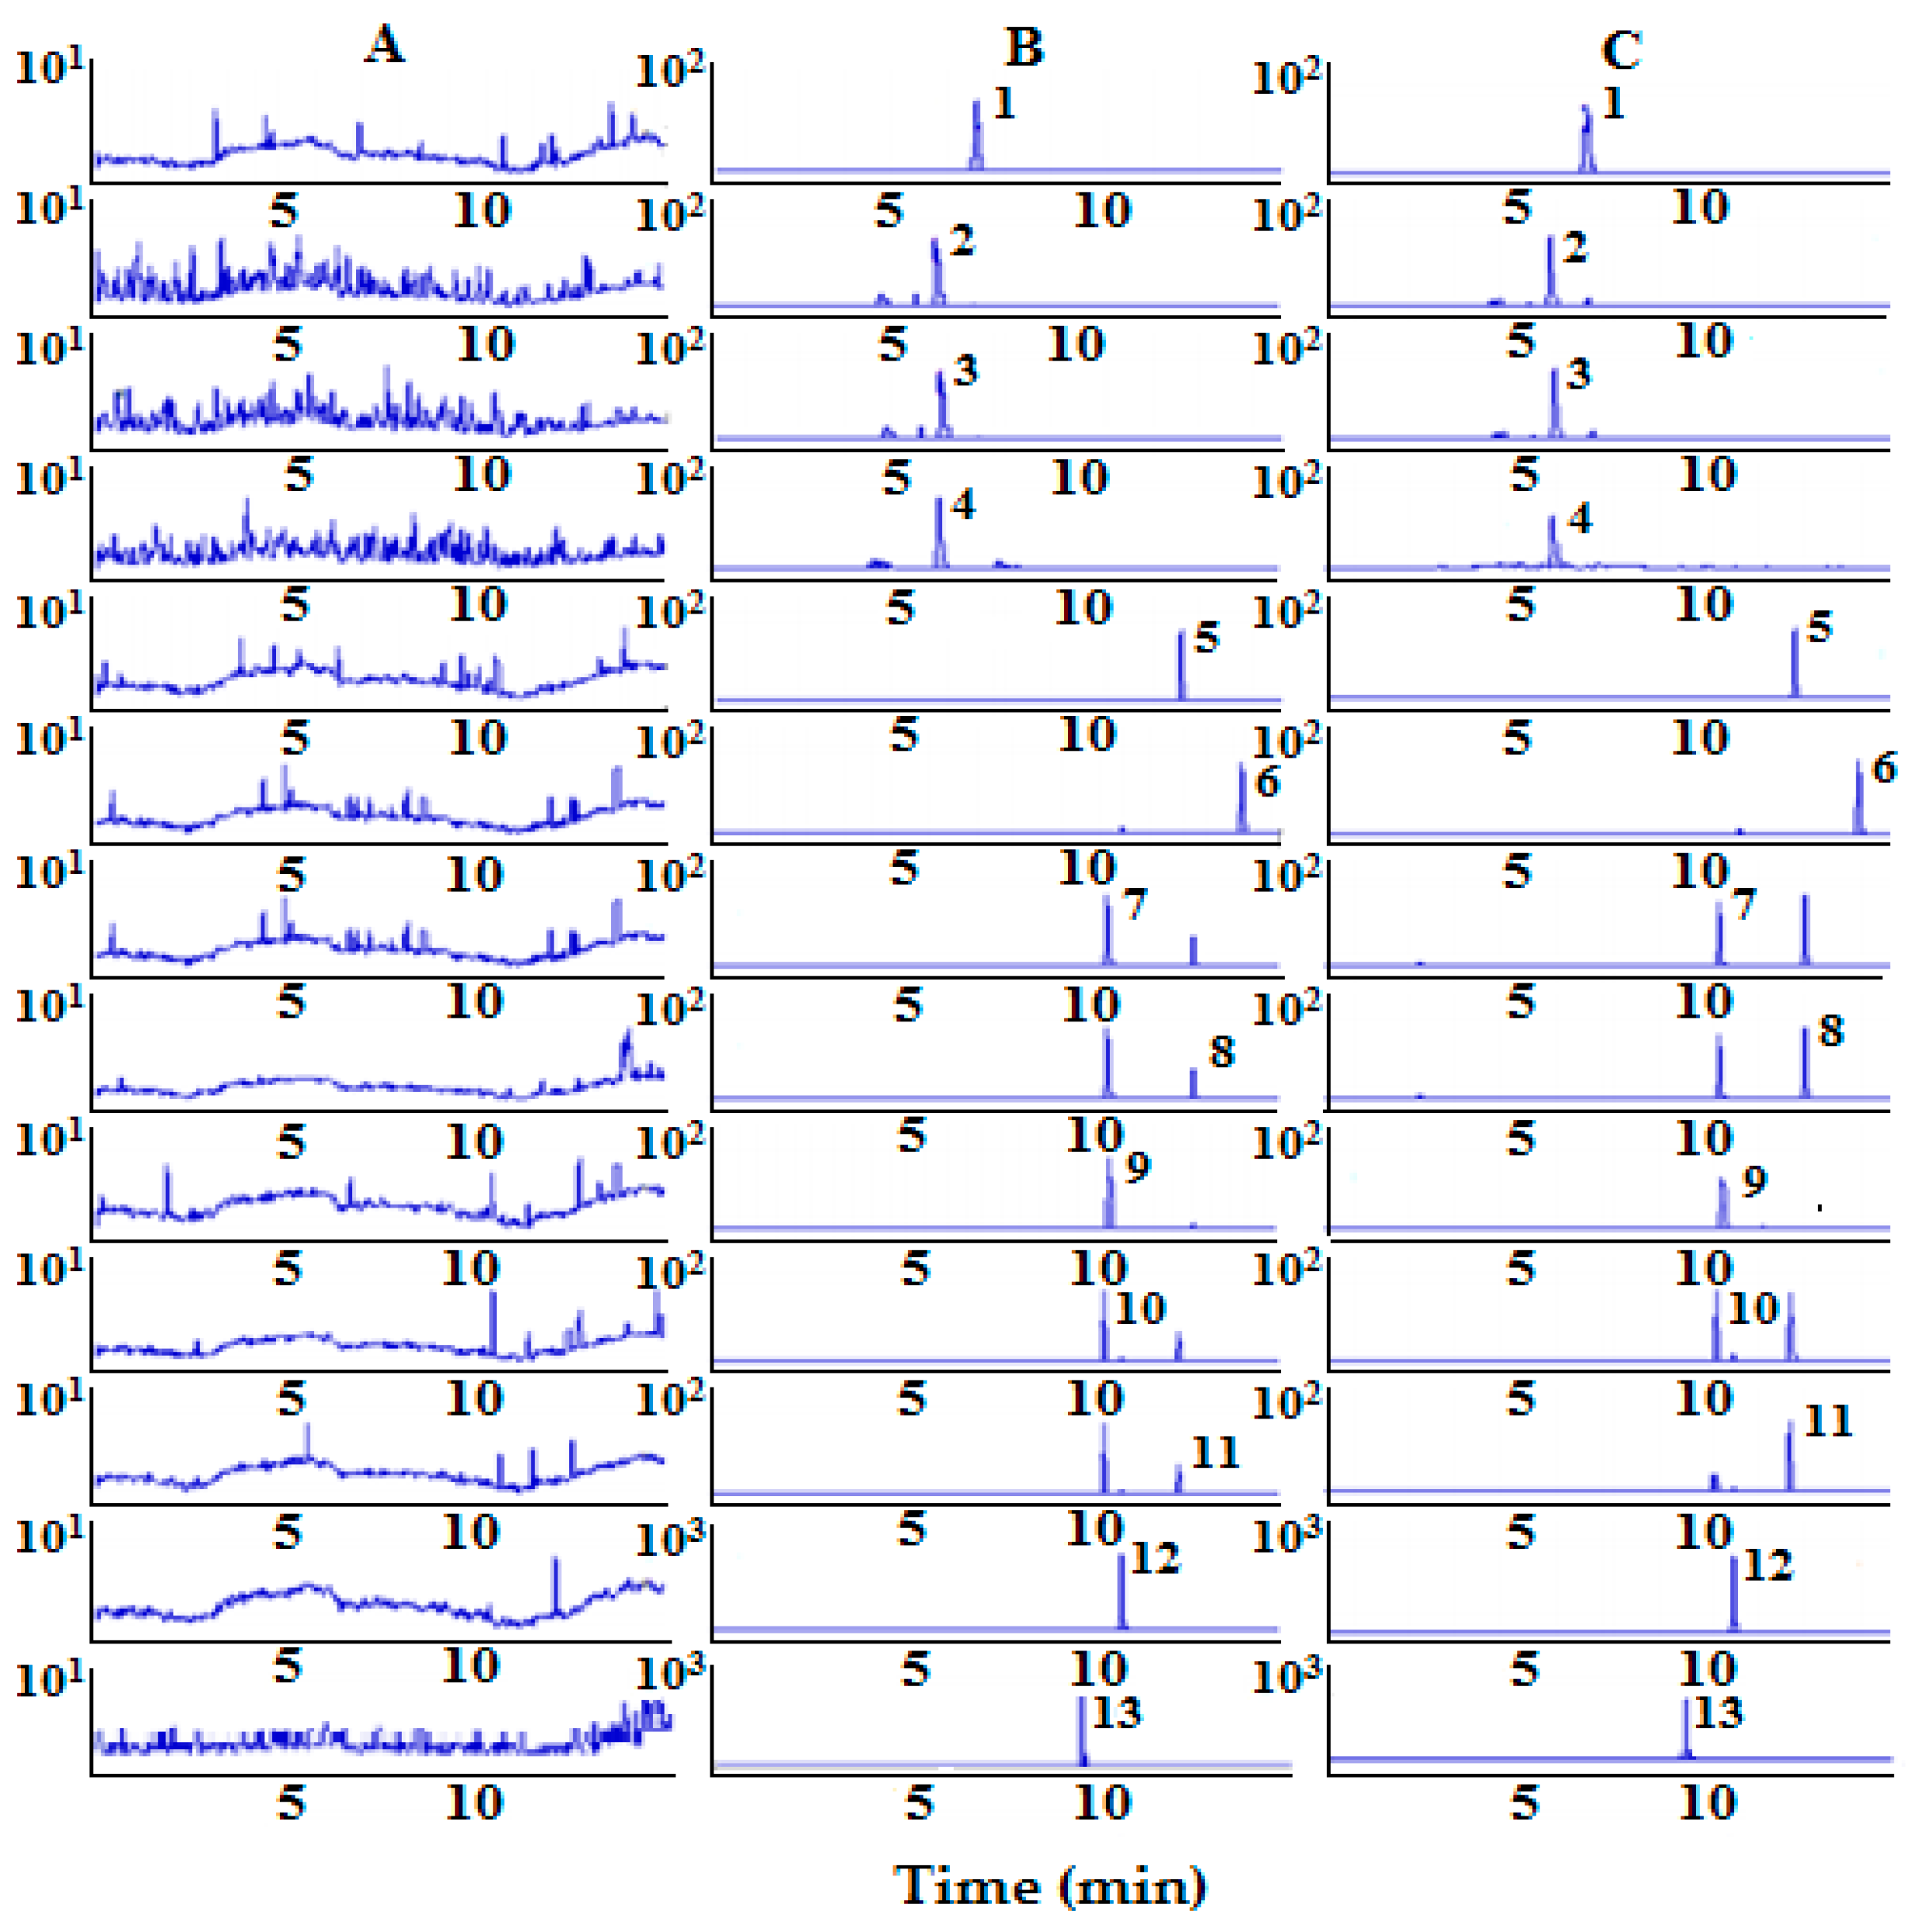
2.3.1. Specificity
2.3.2. Calibration Curves
2.3.3. Precision and Accuracy
2.3.4. Extraction Recovery and Matrix Effect
2.3.5 Stability
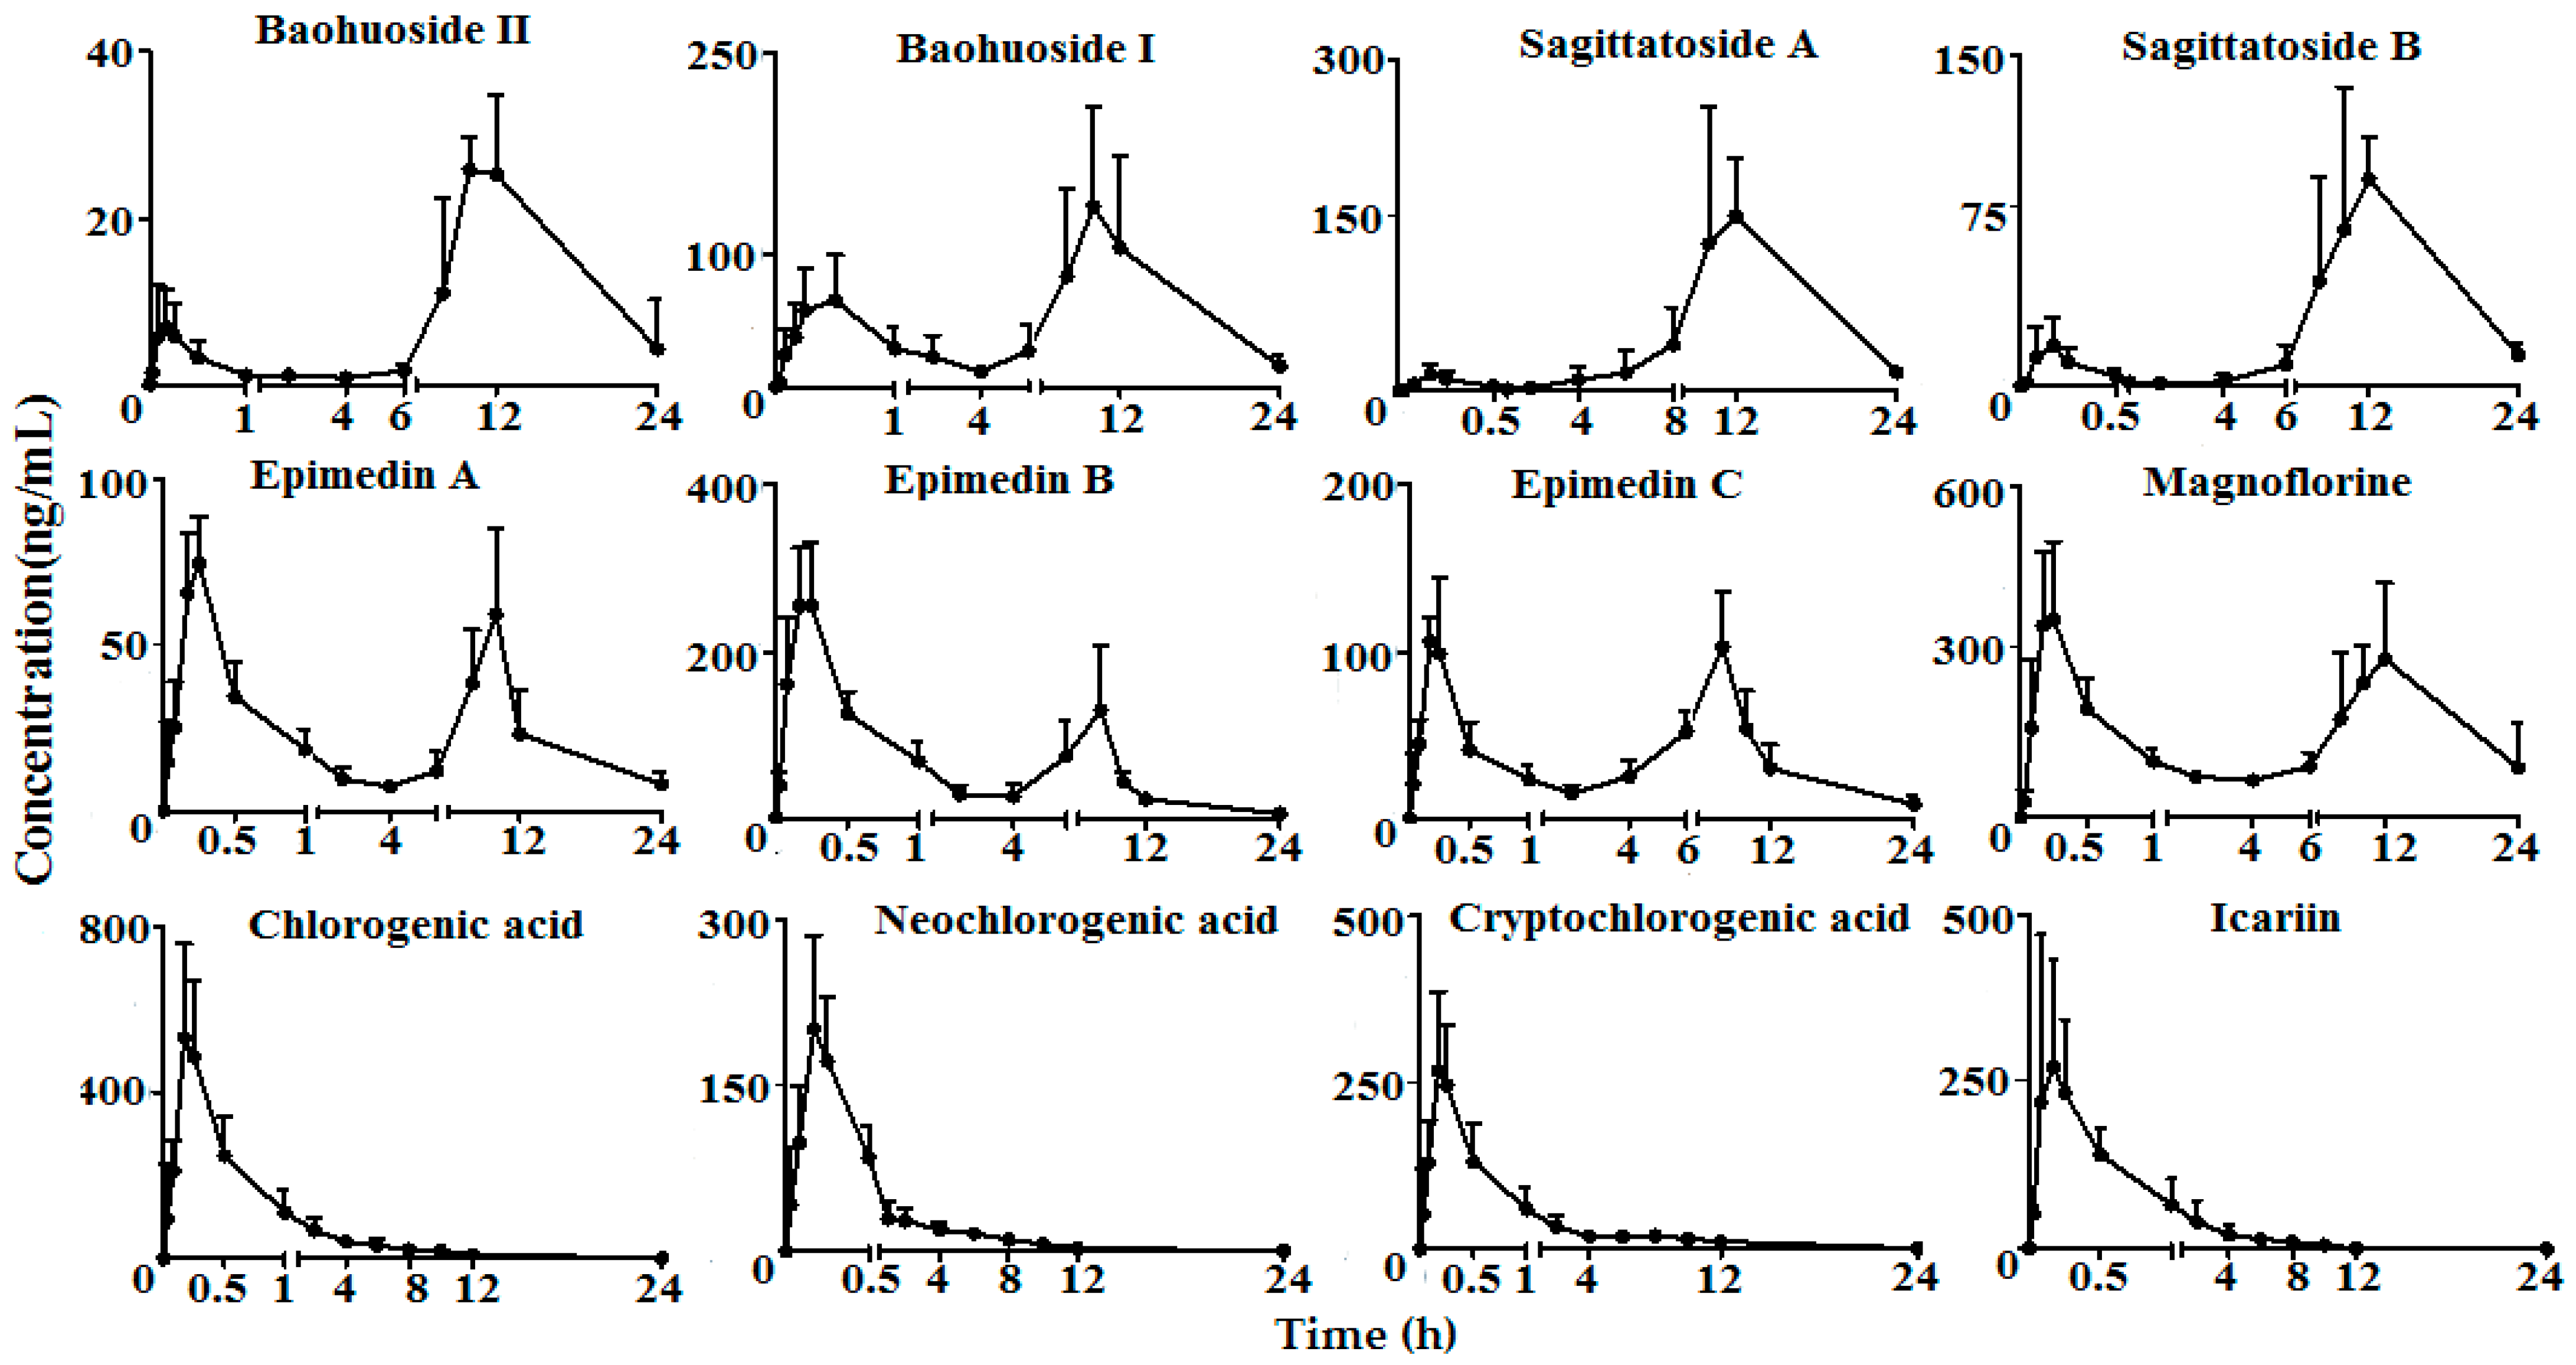
2.4. Application
3. Experimental
3.1. Chemicals and Reagents
3.2. HPLC-MS/MS Analysis
3.3. Preparation of Extract from Epimedium
3.4. Working Solutions
3.5. Sample Preparation
3.6. Method Validation
3.6.1. Selectivity
3.6.2. Calibration Curve
3.6.3. Precision and Accuracy
3.6.4. Extraction Recovery and Matrix Effect
3.6.5. Stability
3.7. Pharmacokinetic Studies
4. Conclusions
Author Contributions
Funding
Conflicts of Interest
References
- Hang, D.X.; Yang, J.; Lu, X.M.; Deng, Y.; Xiong, Z.L.; Li, F.M. An integrated plasma and urinary metabonomic study using UHPL-MS: intervention effects of Epimedium koreanum on ‘Kidney-Yang Deficiency syndrome’ rats. J. Pharm. Biomed. Anal. 2013, 76, 200–206. [Google Scholar] [CrossRef] [PubMed]
- Zhang, H.F.; Zhang, X.; Yang, X.H.; Qiu, N.X.; Wang, Y.; Wang, Z.Z. Microwave assisted extraction of flavonoids from cultivated Epimedium sagittatum: extraction yield and mechanism, antioxidant activity and chemical composition. Ind. Crop. Prod. 2013, 50, 857–865. [Google Scholar] [CrossRef]
- Sze, S.C.; Tong, Y.; Ng, T.B.; Cheng, C.L.; Cheung, H.P. Herba Epimedii: antioxidative properties and its medical implications. Molecules 2010, 15, 7861–7870. [Google Scholar] [CrossRef] [PubMed] [Green Version]
- Jiang, J.; Song, J.; Jia, X.B. Phytochemistry and ethnopharmacology of Epimedium L. species. Chin. Herb. Med. 2015, 7, 204–222. [Google Scholar] [CrossRef]
- Pan, Y.; Kong, L.D.; Xia, X.; Zhang, W.Y.; Xia, Z.H.; Jiang, F.X. Antidepressant-like effect of icariin and its possible mechanism in rats. Pharmacol. Biochem. Behav. 2005, 82, 686–694. [Google Scholar] [CrossRef] [PubMed]
- Wang, Z.Q.; Lou, Y.J. Proliferation-stimulating effects of icaritin and desmethylicaritin in MCF-7 cells. Eur. J. Pharmacol. 2004, 504, 147–153. [Google Scholar] [CrossRef] [PubMed]
- Liu, Y.Q.; Han, X.F.; Liu, T.G.; Cheng, M.C.; Xiao, H.B. A cell-based model of bone remodeling for identifying activity of icarrin in the treatment of osteoporosis. Biotechnol. Lett. 2015, 37, 219–226. [Google Scholar] [CrossRef] [PubMed]
- Ma, H.P.; He, X.R.; Yang, Y.; Li, M.X.; Hao, D.J.; Jia, Z.P. The genus Epimedium: an ethnopharmacological and phytochemical review. J. Ethnopharmacol. 2011, 134, 519–541. [Google Scholar] [CrossRef] [PubMed]
- Wang, Y.A.; Guo, Z.M.; Jin, Y.; Zhang, X.L.; Wang, L.; Xue, X.Y.; Liang, X.M. Identification of prenyl flavonoid glycosides and phenolic acids in Epimedium koreanum Nakai by Q-TOF-MS combined with selective enrichment on click oligo (ethylene glycol) column. J. Pharm. Biomed. Anal. 2010, 51, 606–616. [Google Scholar] [CrossRef] [PubMed]
- Zulfiqar, F.; Khan, S.I.; Ross, S.A.; Ali, Z.; Khan, I.A. Prenylated flavonol glycosides from Epimedium grandiflorum: Cytotoxicity and evaluation against inflammation and metabolic disorder. Phytochemistry 2017, 20, 160–167. [Google Scholar] [CrossRef]
- Zhang, D.W.; Cheng, Y.; Wang, N.L.; Zhang, J.C.; Yang, M.S.; Yao, X.S. Effects of total flavonoids and flavonol glycosides from Epimedium koreanum Nakai on the proliferation and differentiation of primary osteoblasts. Phytomedicine 2008, 15, 55–61. [Google Scholar] [CrossRef] [PubMed]
- Yao, Z.H.; Liu, M.Y.; Dai, Y.; Zhang, Y.; Qin, Z.F.; Tu, F.J.; Yao, X.S. Metabolism of Epimedium-derived flavonoid glycosides in intestinal flora of rabbits and its inhibition by gluconolactone. Chin. J. Nat. Med. 2011, 9, 461–465. [Google Scholar] [CrossRef]
- Krych, J.L. Gebicka. Catalase is inhibited by flavonoids. Int. J. Biol. Macromol. 2013, 58, 148–153. [Google Scholar] [CrossRef] [PubMed]
- Hartmann, T. From waste products to ecochemicals: Fifty years research of plant secondary metabolism. Phytochemistry. 2007, 68, 2831–2846. [Google Scholar] [CrossRef] [PubMed]
- Patel, M.B.; Mishra, S.M. Magnoflorine from Tinospora cordifolia stem inhibits α-glucosidase and is antiglycemic in rats. J. Funct. Foods 2012, 4, 79–86. [Google Scholar] [CrossRef]
- Wang, C.C.; Feng, L.; Su, J.Y.; Cui, L.; Liu, D.J.; Yan, C.L.; Ding, C.L.; Tian, X.B.; Jia, X.B. Polysaccharides from Epimedium koreanum Nakai with immunomodulatory activity and inhibitory effect on tumor growth in LLC-bearing rats. J. Ethnopharmacol. 2017, 207, 8–18. [Google Scholar] [CrossRef] [PubMed]
- Cheng, H.R.; Feng, S.L.; Shen, S.A.; Zhang, L.; Yang, R.W.; Zhou, Y.H.; Ding, C.B. Extraction, antioxidant and antimicrobial activities of Epimedium acuminatum Franch. polysaccharide. Carbohyd. Polym. 2013, 96, 101–108. [Google Scholar] [CrossRef] [PubMed]
- Wong, S.P.; Shen, P.; Lee, L.; Li, J.; Yong, E.L. Pharmacokinetics of prenylflavonoids and correlations with the dynamics of estrogen action in sera following ingestion of a standardized Epimedium extract. J. Pharm. Biomed. Anal. 2009, 50, 216–223. [Google Scholar] [CrossRef] [PubMed]
- Wu, C.S.; Zhang, J.L.; Zhou, T.H.; Guo, B.L.; Wang, Y.L.; Hou, J.F. Simultaneous determination of seven flavonoids in dog plasma by ultra-performance liquid chromatography–tandem mass spectrometry and its application to a bioequivalence study of bioactive components in Herba Epimedii and Er-Xian Decoctio. J. Pharm. Biomed. Anal. 2011, 54, 186–191. [Google Scholar] [CrossRef] [PubMed]
- Tong, L.; Wan, M.X.; Zhang, L.H.; Zhu, Y.H.; Sun, H.; Bi, K.S. Simultaneous determination of baicalin wogonoside, baicalein, wogonin, oroxylin A and chrysin of Radix scutellariae extract in rat plasma by liquid chromatography tandem mass spectrometry. J. Pharm. Biomed. Anal. 2012, 70, 6–12. [Google Scholar] [CrossRef] [PubMed]
- Qi, W.; Zhao, T.; Yang, W.W.; Wang, G.H.; Yu, H.; Zhao, H.X.; Yang, C.; Sun, L.X. Comparative pharmacokinetics of chlorogenic acid after oral administration in rats. J. Pharm. Anal. 2011, 4, 270–274. [Google Scholar] [CrossRef] [PubMed]
- Shen, P.; Wong, S.P.; Li, J.; Yong, E.L. Simple and sensitive liquid chromatography–tandem mass spectrometry assay for simultaneous measurement of five Epimedium prenylflavonoids in rat sera. J. Chromatogr. B 2009, 877, 71–78. [Google Scholar] [CrossRef] [PubMed]
Sample Availability: The extracts of Epimedium are available from the authors. |


| Compounds | Calibration Curve | r | Linear Range (ng/mL) | LLOQ(ng/mL) |
|---|---|---|---|---|
| baohuoside II | Y = 1.3944X + 4.6850 | 0.9930 | 1.0-200.0 | 1.0 |
| baohuoside I | Y = 1.4452X + 0.0129 | 0.9943 | 2.0-400.0 | 2.0 |
| sagittatoside A | Y = 0.5707X + 4.8545 | 0.9918 | 2.0-400.0 | 2.0 |
| sagittatoside B | Y = 0.6968X + 7.8080 | 0.9908 | 2.0-400.0 | 2.0 |
| epimedin A | Y = 0.1564X − 8.1949 | 0.9912 | 2.0-400.0 | 2.0 |
| epimedin B | Y = 0.3559X + 5.3440 | 0.9939 | 2.0-400.0 | 2.0 |
| epimedin C | Y = 0.1016X + 6.8756 | 0.9942 | 2.0-400.0 | 2.0 |
| magnoflorine | Y = 0.0260X + 2.4814 | 0.9928 | 4.0-800.0 | 4.0 |
| chlorogenic acid | Y = 0.1274X + 0.0016 | 0.9922 | 10.0-2000.0 | 10.0 |
| neochlorogenic acid | Y = 1.7722 X + 0.0013 | 0.9956 | 4.0-800.0 | 4.0 |
| cryptochlorogenic acid | Y = 0.0187X + 0.0010 | 0.9904 | 4.0-800.0 | 4.0 |
| icariin | Y = 0.1178X + 0.0053 | 0.9966 | 4.0-800.0 | 4.0 |
| Compounds | Spiked Concentration (ng/mL) | Intra-Day | Inter-Day | ||||
|---|---|---|---|---|---|---|---|
| Measured (ng/mL) | RE (%) | RSD (%) | Measured (ng/mL) | RE (%) | RSD (%) | ||
| baohuoside II | 1 | 1.02 ± 0.08 | 2.0 | 7.8 | 1.01 ± 0.08 | 1.0 | 7.9 |
| 10 | 10.18 ± 0.88 | 1.8 | 8.6 | 10.09 ± 0.87 | 0.9 | 8.6 | |
| 200 | 197.54 ± 1.41 | −1.2 | 0.7 | 196.66 ± 3.62 | −1.7 | 1.8 | |
| baohuoside I | 2 | 2.03 ± 0.07 | 1.5 | 3.4 | 2.03 ± 0.08 | 1.5 | 3.9 |
| 20 | 19.99 ± 0.98 | −0.1 | 4.9 | 19.54 ± 0.92 | −2.3 | 4.7 | |
| 400 | 390.27 ± 6.47 | −2.4 | 1.7 | 391.05 ± 7.15 | −2.2 | 1.8 | |
| sagittatoside A | 2 | 2.06 ± 0.10 | 3.0 | 4.9 | 1.98 ± 0.12 | −1.0 | 6.0 |
| 20 | 20.77 ± 1.01 | 3.9 | 4.9 | 21.00 ± 0.90 | 5.0 | 4.3 | |
| 400 | 399.42 ± 5.65 | −0.1 | 1.4 | 396.13 ± 3.57 | −1.0 | 0.9 | |
| sagittatoside B | 2 | 2.08 ± 0.06 | 4.0 | 2.9 | 2.14 ± 0.07 | 7.0 | 3.3 |
| 20 | 20.50 ± 1.36 | 2.5 | 6.6 | 21.07 ± 0.81 | 5.4 | 3.8 | |
| 400 | 397.48 ± 7.79 | −0.6 | 2.0 | 404.06 ± 7.29 | 1.0 | 1.8 | |
| epimedin A | 2 | 2.13 ± 0.20 | 6.5 | 9.4 | 2.26 ± 0.15 | 13.0 | 6.6 |
| 20 | 19.62 ± 2.14 | −1.9 | 10.9 | 20.92 ± 1.98 | 4.6 | 9.5 | |
| 400 | 397.22 ± 7.08 | −0.7 | 1.8 | 405.26 ± 5.73 | 1.3 | 1.4 | |
| epimedin B | 2 | 1.98 ± 0.08 | −1.0 | 4.0 | 2.00 ± 0.13 | 0.0 | 6.5 |
| 20 | 19.92 ± 1.03 | −0.4 | 5.2 | 20.87 ± 1.02 | 4.4 | 4.9 | |
| 400 | 399.43 ± 3.67 | −0.1 | 0.9 | 399.44 ± 5.76 | −0.1 | 1.4 | |
| epimedin C | 2 | 2.02 ± 0.11 | 1.0 | 5.4 | 2.01 ± 0.07 | 0.5 | 3.5 |
| 20 | 19.90 ± 0.81 | −0.5 | 4.1 | 19.88 ± 0.89 | −0.6 | 4.5 | |
| 400 | 401.44 ± 3.03 | 0.4 | 0.8 | 400.94 ± 2.37 | 0.2 | 0.6 | |
| magnoflorine | 4 | 4.05 ± 0.24 | 1.3 | 5.9 | 4.06 ± 0.18 | 1.5 | 4.4 |
| 40 | 41.67 ± 2.42 | 4.2 | 5.8 | 41.10 ± 1.87 | 2.8 | 4.5 | |
| 800 | 770.53 ± 16.22 | −3.7 | 2.1 | 797.84 ± 33.32 | −0.3 | 4.2 | |
| chlorogenic acid | 10 | 9.86 ± 0.96 | −1.4 | 9.7 | 9.89 ± 0.62 | −1.1 | 6.3 |
| 100 | 94.73 ± 4.35 | −5.3 | 4.6 | 96.39 ± 6.66 | −3.6 | 6.9 | |
| 2000 | 1888.50 ± 52.19 | −5.6 | 2.8 | 1987.74 ± 96.63 | −0.6 | 4.9 | |
| neochlorogenic acid | 4 | 4.16 ± 0.26 | 4.0 | 6.3 | 4.15 ± 0.19 | 3.8 | 4.6 |
| 40 | 39.69 ± 2.63 | −0.8 | 6.6 | 40.31 ± 1.47 | 0.8 | 3.6 | |
| 800 | 804.76 ± 7.42 | 0.6 | 0.9 | 807.99 ± 10.77 | 1.0 | 1.3 | |
| cryptochlorogenic acid | 4 | 3.94 ± 0.12 | −1.5 | 3.0 | 3.92 ± 0.07 | −2.0 | 1.8 |
| 40 | 40.25 ± 1.39 | 0.6 | 3.5 | 40.63 ± 0.96 | 1.6 | 2.4 | |
| 800 | 780.52 ± 16.27 | −2.4 | 2.1 | 774.79 ± 13.82 | −3.2 | 1.8 | |
| icariin | 4 | 4.02 ± 0.15 | 0.5 | 3.7 | 4.02 ± 0.11 | 0.5 | 2.7 |
| 40 | 39.30 ± 1.03 | −1.8 | 2.6 | 39.85 ± 1.13 | −0.4 | 2.8 | |
| 800 | 801.05 ± 3.35 | 0.1 | 0.4 | 802.21 ± 4.66 | 0.3 | 0.6 | |
| Compounds | Spiked Concentration (ng/mL) | Extraction Recovery (%) | RSD (%) | Matrix Effect (%) | RSD (%) |
|---|---|---|---|---|---|
| baohuoside II | 1 | 67.78 ± 1.75 | 2.6 | 119.03 ± 3.54 | 3.0 |
| 10 | 84.44 ± 3.81 | 4.5 | 115.54 ± 6.71 | 5.8 | |
| 200 | 93.58 ± 4.14 | 4.4 | 103.39 ± 7.55 | 7.3 | |
| baohuoside I | 2 | 99.45 ± 6.74 | 6.8 | 93.08 ± 5.89 | 6.3 |
| 20 | 97.78 ± 1.36 | 1.4 | 103.85 ± 6.55 | 6.3 | |
| 400 | 98.50 ± 1.73 | 1.8 | 98.21 ± 3.20 | 3.3 | |
| sagittatoside A | 2 | 74.52 ± 7.02 | 9.4 | 112.96 ± 8.54 | 7.6 |
| 20 | 79.30 ± 3.64 | 4.6 | 118.72 ± 9.92 | 8.4 | |
| 400 | 90.06 ± 3.35 | 3.7 | 107.33 ± 10.01 | 9.3 | |
| sagittatoside B | 2 | 99.77 ± 4.19 | 4.2 | 98.77 ± 3.97 | 4.0 |
| 20 | 82.34 ± 4.82 | 5.9 | 112.35 ± 7.63 | 6.8 | |
| 400 | 86.73 ± 2.69 | 3.1 | 111.49 ± 6.28 | 5.6 | |
| epimedin A | 2 | 60.66 ± 6.63 | 10.9 | 113.02 ± 10.87 | 9.6 |
| 20 | 68.52 ± 0.66 | 1.0 | 119.11 ± 13.22 | 11.1 | |
| 400 | 84.85 ± 3.63 | 4.3 | 112.83 ± 9.14 | 8.1 | |
| epimedin B | 2 | 70.66 ± 4.43 | 6.3 | 119.84 ± 6.79 | 5.7 |
| 20 | 94.72 ± 0.75 | 0.8 | 107.49 ± 8.41 | 7.8 | |
| 400 | 75.30 ± 1.12 | 1.5 | 119.30 ± 3.05 | 2.6 | |
| epimedin C | 2 | 96.35 ± 1.00 | 1.0 | 102.59 ± 3.00 | 2.9 |
| 20 | 70.91 ± 2.30 | 3.2 | 112.31 ± 11.51 | 10.2 | |
| 400 | 81.57 ± 1.92 | 2.4 | 118.74 ± 6.52 | 5.5 | |
| magnoflorine | 4 | 61.95 ± 6.86 | 11.1 | 115.27 ± 15.25 | 13.2 |
| 40 | 70.29 ± 4.68 | 6.7 | 114.36 ± 5.95 | 5.2 | |
| 800 | 81.33 ± 4.59 | 5.6 | 110.84 ± 12.78 | 11.5 | |
| chlorogenic acid | 10 | 97.79 ± 4.36 | 4.5 | 98.55 ± 7.49 | 7.6 |
| 100 | 89.78 ± 8.65 | 9.6 | 98.36 ± 5.32 | 5.4 | |
| 2000 | 78.81 ± 5.22 | 6.6 | 114.50 ± 13.84 | 12.1 | |
| neochlorogenic acid | 4 | 82.92 ± 2.58 | 3.1 | 113.90 ± 5.98 | 5.3 |
| 40 | 78.53 ± 2.88 | 3.7 | 114.36 ± 5.95 | 5.2 | |
| 800 | 84.04 ± 3.36 | 4.0 | 115.44 ± 8.99 | 7.8 | |
| cryptochlorogenic acid | 4 | 91.38 ± 10.31 | 11.3 | 96.33 ± 6.89 | 7.2 |
| 40 | 76.05 ± 6.75 | 8.9 | 118.92 ± 11.70 | 9.8 | |
| 800 | 76.95 ± 3.26 | 4.2 | 116.51 ± 12.06 | 10.4 | |
| icariin | 4 | 96.32 ± 4.65 | 4.8 | 95.68 ± 5.32 | 5.6 |
| 40 | 88.84 ± 9.11 | 10.3 | 111.87 ± 10.96 | 9.8 | |
| 800 | 91.78 ± 4.42 | 4.8 | 105.94 ± 8.98 | 8.5 |
| Compounds | Spiked Concentration (ng/mL) | Room Temperature for 2 h | Three Freeze-Thaw Cycles | Auto-Sampler for 12 h | −70 °C for 7 Days | ||||
|---|---|---|---|---|---|---|---|---|---|
| Measured (ng/mL) | RSD (%) | Measured (ng/mL) | RSD (%) | Measured (ng/mL) | RSD (%) | Measured (ng/mL) | RSD (%) | ||
| baohuoside II | 1 | 0.96 ± 0.09 | 9.4 | 1.09 ± 0.02 | 1.8 | 1.10 ± 0.11 | 10.0 | 1.04 ± 0.12 | 11.5 |
| 10 | 9.99 ± 0.31 | 3.1 | 8.94 ± 0.63 | 7.0 | 10.38 ± 0.60 | 5.8 | 8.84 ± 0.31 | 3.5 | |
| 200 | 193.54 ± 3.74 | 1.9 | 195.26 ± 1.32 | 0.7 | 190.62 ± 5.99 | 3.1 | 188.79 ± 7.35 | 3.9 | |
| baohuoside I | 2 | 1.93 ± 0.03 | 1.6 | 1.97 ± 0.08 | 4.1 | 2.01 ± 0.07 | 3.5 | 2.03 ± 0.09 | 4.4 |
| 20 | 19.56 ± 0.23 | 1.2 | 19.71 ± 0.49 | 2.5 | 19.24 ± 0.96 | 5.0 | 19.48 ± 0.52 | 2.7 | |
| 400 | 389.39 ± 7.29 | 1.9 | 393.71 ± 5.02 | 1.3 | 387.09 ± 9.42 | 2.4 | 391.78 ± 3.49 | 0.9 | |
| sagittatoside A | 2 | 2.08 ± 0.12 | 5.8 | 2.11 ± 0.07 | 3.3 | 1.93 ± 0.09 | 4.7 | 1.98 ± 0.12 | 6.1 |
| 20 | 20.97 ± 0.09 | 0.4 | 19.84 ± 0.81 | 4.1 | 21.29 ± 0.18 | 0.8 | 19.43 ± 0.40 | 2.1 | |
| 400 | 397.27 ± 8.71 | 2.2 | 393.69 ± 3.71 | 0.9 | 397.42 ± 6.71 | 1.7 | 395.24 ± 11.34 | 2.9 | |
| sagittatoside B | 2 | 2.04 ± 0.16 | 7.8 | 2.09 ± 0.05 | 2.4 | 2.07 ± 0.08 | 3.9 | 2.03 ± 0.14 | 6.9 |
| 20 | 21.32 ± 0.59 | 2.8 | 20.07 ± 0.95 | 4.7 | 21.16 ± 0.51 | 2.4 | 18.84 ± 0.52 | 2.8 | |
| 400 | 398.03 ± 9.83 | 2.5 | 394.07 ± 3.55 | 0.9 | 407.64 ± 17.60 | 4.3 | 381.68 ± 5.87 | 1.5 | |
| epimedin A | 2 | 2.10 ± 0.09 | 4.3 | 2.07 ± 0.13 | 6.3 | 2.06 ± 0.04 | 1.9 | 2.03 ± 0.09 | 4.4 |
| 20 | 20.29 ± 0.43 | 2.1 | 19.58 ± 0.94 | 4.8 | 20.35 ± 0.78 | 3.8 | 19.70 ± 1.54 | 7.8 | |
| 400 | 400.51 ± 0.52 | 0.1 | 392.00 ± 2.85 | 0.7 | 398.73 ± 3.31 | 0.8 | 400.95 ± 4.79 | 1.2 | |
| epimedin B | 2 | 2.01 ± 0.04 | 2.0 | 2.07 ± 0.09 | 4.3 | 2.18 ± 0.05 | 2.3 | 2.07 ± 0.09 | 4.3 |
| 20 | 21.51 ± 0.97 | 4.5 | 20.27 ± 1.82 | 9.0 | 21.01 ± 0.50 | 2.4 | 21.00 ± 0.78 | 3.7 | |
| 400 | 400.89 ± 3.17 | 0.8 | 400.51 ± 2.96 | 0.7 | 397.07 ± 2.81 | 0.7 | 403.31 ± 2.82 | 0.7 | |
| epimedin C | 2 | 2.10 ± 0.05 | 2.4 | 2.03 ± 0.10 | 4.9 | 2.02 ± 0.14 | 6.9 | 2.14 ± 0.05 | 2.3 |
| 20 | 20.24 ± 0.83 | 4.1 | 20.43 ± 0.90 | 4.4 | 19.73 ± 0.37 | 1.9 | 21.37 ± 0.10 | 0.5 | |
| 400 | 399.97 ± 1.97 | 0.5 | 397.64 ± 8.12 | 2.0 | 396.56 ± 4.69 | 1.2 | 396.46 ± 8.82 | 2.2 | |
| magnoflorine | 4 | 3.99 ± 0.08 | 2.0 | 4.01 ± 0.13 | 3.2 | 4.37 ± 0.19 | 4.3 | 4.02 ± 0.10 | 2.5 |
| 40 | 39.29 ± 2.92 | 7.4 | 41.99 ± 2.30 | 5.5 | 41.70 ± 1.06 | 2.5 | 40.27 ± 1.70 | 4.2 | |
| 800 | 776.84 ± 1.85 | 0.2 | 780.80 ± 15.38 | 2.0 | 809.27 ± 12.34 | 1.5 | 775.71 ± 3.82 | 0.5 | |
| chlorogenic acid | 10 | 9.93 ± 0.03 | 0.3 | 9.52 ± 0.84 | 8.8 | 9.26 ± 0.68 | 7.3 | 8.88 ± 0.39 | 4.4 |
| 100 | 101.51 ± 11.83 | 11.7 | 91.99 ± 6.26 | 6.8 | 98.92 ± 4.58 | 4.6 | 85.73 ± 4.01 | 4.7 | |
| 2000 | 1866.65 ± 25.87 | 1.4 | 1883.55 ± 25.34 | 1.3 | 1924.54 ± 82.95 | 4.3 | 1849.43 ± 30.88 | 1.7 | |
| neochlorogenic acid | 4 | 4.00 ± 0.14 | 3.5 | 3.97 ± 0.05 | 1.3 | 3.85 ± 0.14 | 3.6 | 4.13 ± 0.06 | 1.5 |
| 40 | 39.79 ± 2.13 | 5.4 | 38.73 ± 1.14 | 2.9 | 41.77 ± 1.37 | 3.3 | 39.14 ± 1.82 | 4.6 | |
| 800 | 802.82 ± 7.13 | 0.9 | 791.74 ± 0.87 | 0.1 | 803.36 ± 2.53 | 0.3 | 804.80 ± 4.45 | 0.6 | |
| cryptochlorogenic acid | 4 | 4.00 ± 0.14 | 3.5 | 4.03 ± 0.13 | 3.2 | 4.01 ± 0.22 | 5.5 | 4.01 ± 0.06 | 1.5 |
| 40 | 40.59 ± 1.78 | 4.4 | 39.42 ± 1.80 | 4.6 | 41.58 ± 0.51 | 1.2 | 39.06 ± 1.65 | 4.2 | |
| 800 | 773.95 ± 5.78 | 0.7 | 781.42 ± 2.45 | 0.3 | 768.52 ± 23.65 | 3.1 | 759.75 ± 7.73 | 1.0 | |
| icariin | 4 | 4.07 ± 0.10 | 2.5 | 4.09 ± 0.09 | 2.2 | 4.11 ± 0.10 | 2.4 | 4.00 ± 0.06 | 1.5 |
| 40 | 40.07 ± 0.42 | 1.0 | 40.45 ± 1.98 | 4.9 | 40.34 ± 1.48 | 3.7 | 40.22 ± 0.40 | 1.0 | |
| 800 | 799.61 ± 7.41 | 0.9 | 796.41 ± 5.25 | 0.7 | 808.06 ± 2.49 | 0.3 | 801.34 ± 5.26 | 0.7 | |
| Compounds | Tmax1 (h) | Tmax2 (h) | Cmax1 (ng/mL) | Cmax2 (ng/mL) | t1/2 (h) | AUC(0-tn) (h·ng/mL) | AUC(0-∞) (h·ng/mL) | MRT(0-tn) (h) | MRT(0-∞) (h) |
|---|---|---|---|---|---|---|---|---|---|
| baohuoside II | 0.18 ± 0.03 | 10.67 ± 1.03 | 6.87 ± 4.58 | 29.17 ± 7.70 | 6.93 ± 2.94 | 245.95 ± 133.39 | 354.89 ± 143.76 | 11.47 ± 1.99 | 16.50 ± 3.06 |
| baohuoside I | 0.38 ± 0.14 | 10.00 ± 1.79 | 65.20 ± 33.56 | 170.73 ± 66.97 | 13.25 ± 4.80 | 1448.99 ± 615.56 | 1675.75 ± 598.59 | 10.81 ± 1.21 | 15.68 ± 4.10 |
| sagittatoside A | 0.18 ± 0.03 | 11.67 ± 0.82 | 20.35 ± 10.26 | 203.50 ± 97.03 | 13.81 ± 7.09 | 1614.13 ± 348.72 | 1782.28 ± 351.94 | 12.02 ± 0.71 | 14.26 ± 2.00 |
| sagittatoside B | 0.20 ± 0.04 | 11.00 ± 1.67 | 19.38 ± 9.79 | 112.97 ± 44.50 | 9.38 ± 2.11 | 853.80 ± 171.13 | 1036.71 ± 201.70 | 11.67 ± 1.17 | 14.89 ± 2.09 |
| epimedin A | 0.22 ± 0.04 | 9.33 ± 0.94 | 82.79 ± 7.61 | 59.34 ± 26.24 | 12.50 ± 6.85 | 550.27 ± 199.35 | 600.14 ± 218.86 | 10.82 ± 2.33 | 14.06 ± 3.98 |
| epimedin B | 0.19 ± 0.07 | 7.67 ± 0.75 | 316.73 ± 59.06 | 129.90 ± 77.04 | 3.64 ± 3.68 | 945.89 ± 250.22 | 1066.50 ± 212.44 | 6.98 ± 1.14 | 8.37 ± 2.39 |
| epimedin C | 0.22 ± 0.04 | 7.67 ± 0.75 | 135.22 ± 31.26 | 103.20 ± 33.10 | 17.85 ± 8.23 | 850.40 ± 268.63 | 919.35 ± 214.91 | 9.33 ± 2.34 | 12.54 ± 2.59 |
| magnoflorine | 0.18 ± 0.03 | 10.67 ± 1.63 | 411.40 ± 110.77 | 275.67 ± 89.36 | 17.77 ± 8.25 | 3676.19 ± 874.51 | 4003.32 ± 969.59 | 9.86 ± 0.75 | 12.52 ± 1.72 |
| chlorogenic acid | 0.19 ± 0.05 | 540.28 ± 225.18 | 0.45 ± 0.30 | 879.68 ± 365.08 | 886.48 ± 376.98 | 3.85 ± 1.28 | 3.91 ± 1.32 | ||
| neochlorogenic acid | 0.19 ± 0.05 | 205.96 ± 75.12 | 0.64 ± 0.27 | 263.82 ± 68.24 | 268.58 ± 70.86 | 3.18 ± 1.57 | 3.25 ± 1.97 | ||
| cryptochlorogenic acid | 0.19 ± 0.05 | 269.77 ± 114.07 | 0.53 ± 0.24 | 397.96 ± 170.58 | 404.11 ± 168.92 | 3.75 ± 1.91 | 3.82 ± 2.48 | ||
| icariin | 0.16 ± 0.05 | 350.28 ± 195.96 | 0.41 ± 0.19 | 322.75 ± 204.68 | 324.78 ± 209.27 | 2.71 ± 0.79 | 2.75 ± 0.97 |
| Compounds | Precursor Ion (m/z) | Product Ion (m/z) | Frag. (V) | C.E. (V) |
|---|---|---|---|---|
| baohuoside II | 499.2 | 353.0 | 140 | 20 |
| baohuoside I | 513.2 | 366.0 | 140 | 20 |
| sagittatoside A | 675.2 | 367.0 | 145 | 32 |
| sagittatoside B | 645.2 | 366.2 | 145 | 30 |
| epimedin A | 675.1 | 365.8 | 130 | 32 |
| epimedin B | 645.1 | 365.6 | 145 | 30 |
| epimedin C | 659.2 | 365.7 | 145 | 30 |
| magnoflorine | 340.1 | 310.1 | 145 | 22 |
| chlorogenic acid | 353.0 | 191.0 | 90 | 10 |
| neochlorogenic acid | 352.9 | 191.0 | 115 | 10 |
| cryptochlorogenic acid | 353.1 | 172.9 | 100 | 10 |
| icariin | 721.0 | 513.2 | 145 | 10 |
| liquiritin (IS) | 417.1 | 255.0 | 145 | 13 |
© 2018 by the authors. Licensee MDPI, Basel, Switzerland. This article is an open access article distributed under the terms and conditions of the Creative Commons Attribution (CC BY) license (http://creativecommons.org/licenses/by/4.0/).
Share and Cite
Sun, M.; Yin, Y.; Wei, J.; Chen, X.; Ouyang, H.; Chang, Y.; Gao, X.; He, J. Development and Validation of a HPLC-MS/MS Method for Simultaneous Determination of Twelve Bioactive Compounds in Epimedium: Application to a Pharmacokinetic Study in Rats. Molecules 2018, 23, 1322. https://doi.org/10.3390/molecules23061322
Sun M, Yin Y, Wei J, Chen X, Ouyang H, Chang Y, Gao X, He J. Development and Validation of a HPLC-MS/MS Method for Simultaneous Determination of Twelve Bioactive Compounds in Epimedium: Application to a Pharmacokinetic Study in Rats. Molecules. 2018; 23(6):1322. https://doi.org/10.3390/molecules23061322
Chicago/Turabian StyleSun, Mengjie, Yanwei Yin, Juan Wei, Xiaopeng Chen, Huizi Ouyang, Yanxu Chang, Xiumei Gao, and Jun He. 2018. "Development and Validation of a HPLC-MS/MS Method for Simultaneous Determination of Twelve Bioactive Compounds in Epimedium: Application to a Pharmacokinetic Study in Rats" Molecules 23, no. 6: 1322. https://doi.org/10.3390/molecules23061322