Article

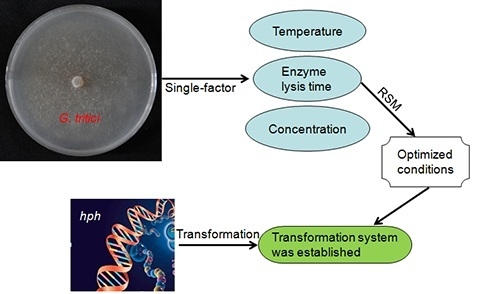
Optimization of Production Conditions for Protoplasts and Polyethylene Glycol-Mediated Transformation of Gaeumannomyces tritici

1
Research and Development Center of Biorational Pesticide, Northwest A&F University, Yangling 712100, China
2
Institute of Tropical Agriculture and Forestry, Hainan University, Haikou 570228, China
3
Engineering and Research Center of Biological Pesticide of Shaanxi Province, Yangling 712100, China
*
Authors to whom correspondence should be addressed.
Molecules 2018, 23(6), 1253; https://doi.org/10.3390/molecules23061253
Submission received: 28 April 2018 / Revised: 20 May 2018 / Accepted: 22 May 2018 / Published: 24 May 2018

Abstract

:
Take-all, caused by Gaeumannomyces tritici, is one of the most important wheat root diseases worldwide, as it results in serious yield losses. In this study, G. tritici was transformed to express the hygromycin B phosphotransferase using a combined protoplast and polyethylene glycol (PEG)-mediated transformation technique. Based on a series of single-factor experimental results, three major factors—temperature, enzyme lysis time, and concentration of the lysing enzyme—were selected as the independent variables, which were optimized using the response surface methodology. A higher protoplast yield of 9.83 × 10⁷ protoplasts/mL was observed, and the protoplast vitality was also high, reaching 96.27% after optimization. Protoplasts were isolated under the optimal conditions, with the highest transformation frequency (46–54 transformants/μg DNA). Polymerase chain reaction and Southern blotting detection indicated that the genes of hygromycin phosphotransferase were successfully inserted into the genome of G. tritici. An optimised PEG-mediated protoplast transformation system for G. tritici was established. The techniques and procedures described will lay the foundation for establishing a good mutation library of G. tritici and could be used to transform other fungi.

Graphical Abstract

1. Introduction

Gaeumannomyces tritici, one of the major soil-borne pathogens, survives saprophytically on crop debris. G. tritici colonizes roots of susceptible cereals, especially wheat, and causes take-all disease in the affected areas [1]. The typical symptom is black necrosis on roots after infection by G. tritici mycelium [2,3]. This devastating disease is widespread throughout wheat producing areas worldwide [4,5], resulting in yield losses of 40–60% [6,7,8]. However, chemical fungicides are not always effective for soil-born fungi, and theses fungicides may have negative effects on the environment and human health [9,10]. The G. tritici genome sequence is available [1] and there is an urgent need for an efficient and rapid transformation system.
The polyethylene glycol (PEG)-mediated protoplast transformation technique is the most common approach for transformation of filamentous fungi [11,12,13]. This technique has advanced our ability to investigate this intractable fungus at the molecular level. The major limiting factor for the PEG-mediated transformation protocol for G. tritici is the production of protoplasts. Transformation of protoplasts has considerable potential for strain improvement and genetic analysis, providing an opportunity to rapidly study a large number of genes. Establishment of protoplast transformation techniques for G. tritici is of crucial importance to biotechnology. Stanway and Buck reported the viral infection of G. tritici protoplasts [14]. Henson and Park used polyethylene glycol (PEG)-CaC12 mediated transformation of protoplasts for G. tritici [15,16]. Bowyer reported the mutagenesis of protoplasts in G. tritici by 4-nitroquinolene oxide [17]. Although protocols for transformation of G. tritici DNA have been reported, we obtained transformants with a low transformation frequency when we used these protocols. Consequently, we developed a new and efficient method for the transformation of G. tritici, and the parameters involved in production of protoplasts were optimized.
Optimization of conditions for protoplast production using the classical method involves changing one independent variable while the other factors remain constant. The conventional methods for multifactor experimental design are time-consuming and inefficient for detecting the true optimum, especially given the interactions between the factors [18,19]. The response surface methodology (RSM) is well-suited for optimizing and studying the interactions among distinct factors using a minimum number of experiments [20,21]. RSM includes factorial design and regression analysis that can be used to construct models to determine interactions, explore optimum conditions of factors under study for desirable responses, and assess the relationship between a set of controllable experimental factors and observed results [22,23].
The objective of the present research was to optimize the conditions to maximise the yield of protoplasts using both one-factor-at-a-time optimization and the response surface methodology. The optimal values of these factors were obtained using response surface methodology. Moreover, the hygromycin phosphotransferase gene (hph) fragment of plasmid pSilent-1 was transformed into the genomic DNA of G. tritici by PEG-mediated transformation of protoplasts, which laid the foundation for establishing a good mutation library of G. tritici.

2. Results

2.1. Effects of Enzyme on Protoplast Yield

The results showed that a mixture of 0.25% snailase (S), 0.25% driselase (D), and 0.25% lysing enzyme (L) produced 2.68 × 10⁷ protoplasts/mL, which was higher than the enzyme of 0.25% L (2.07 × 10⁷ protoplasts/mL). The enzyme of 0.25% L was significantly higher than the enzyme of 0.25% D (0.17 × 10⁷ protoplasts/mL) and 0.25% S (0.03 × 10⁷ protoplasts/mL). There was no significant difference between the enzyme of 0.25% L (2.07 × 10⁷ protoplasts/mL), 0.25% S and 0.25% L (2.10 × 10⁷ protoplasts/mL), and 0.25% L and 0.25% D (2.37 × 10⁷ protoplasts/mL) (Table 1).

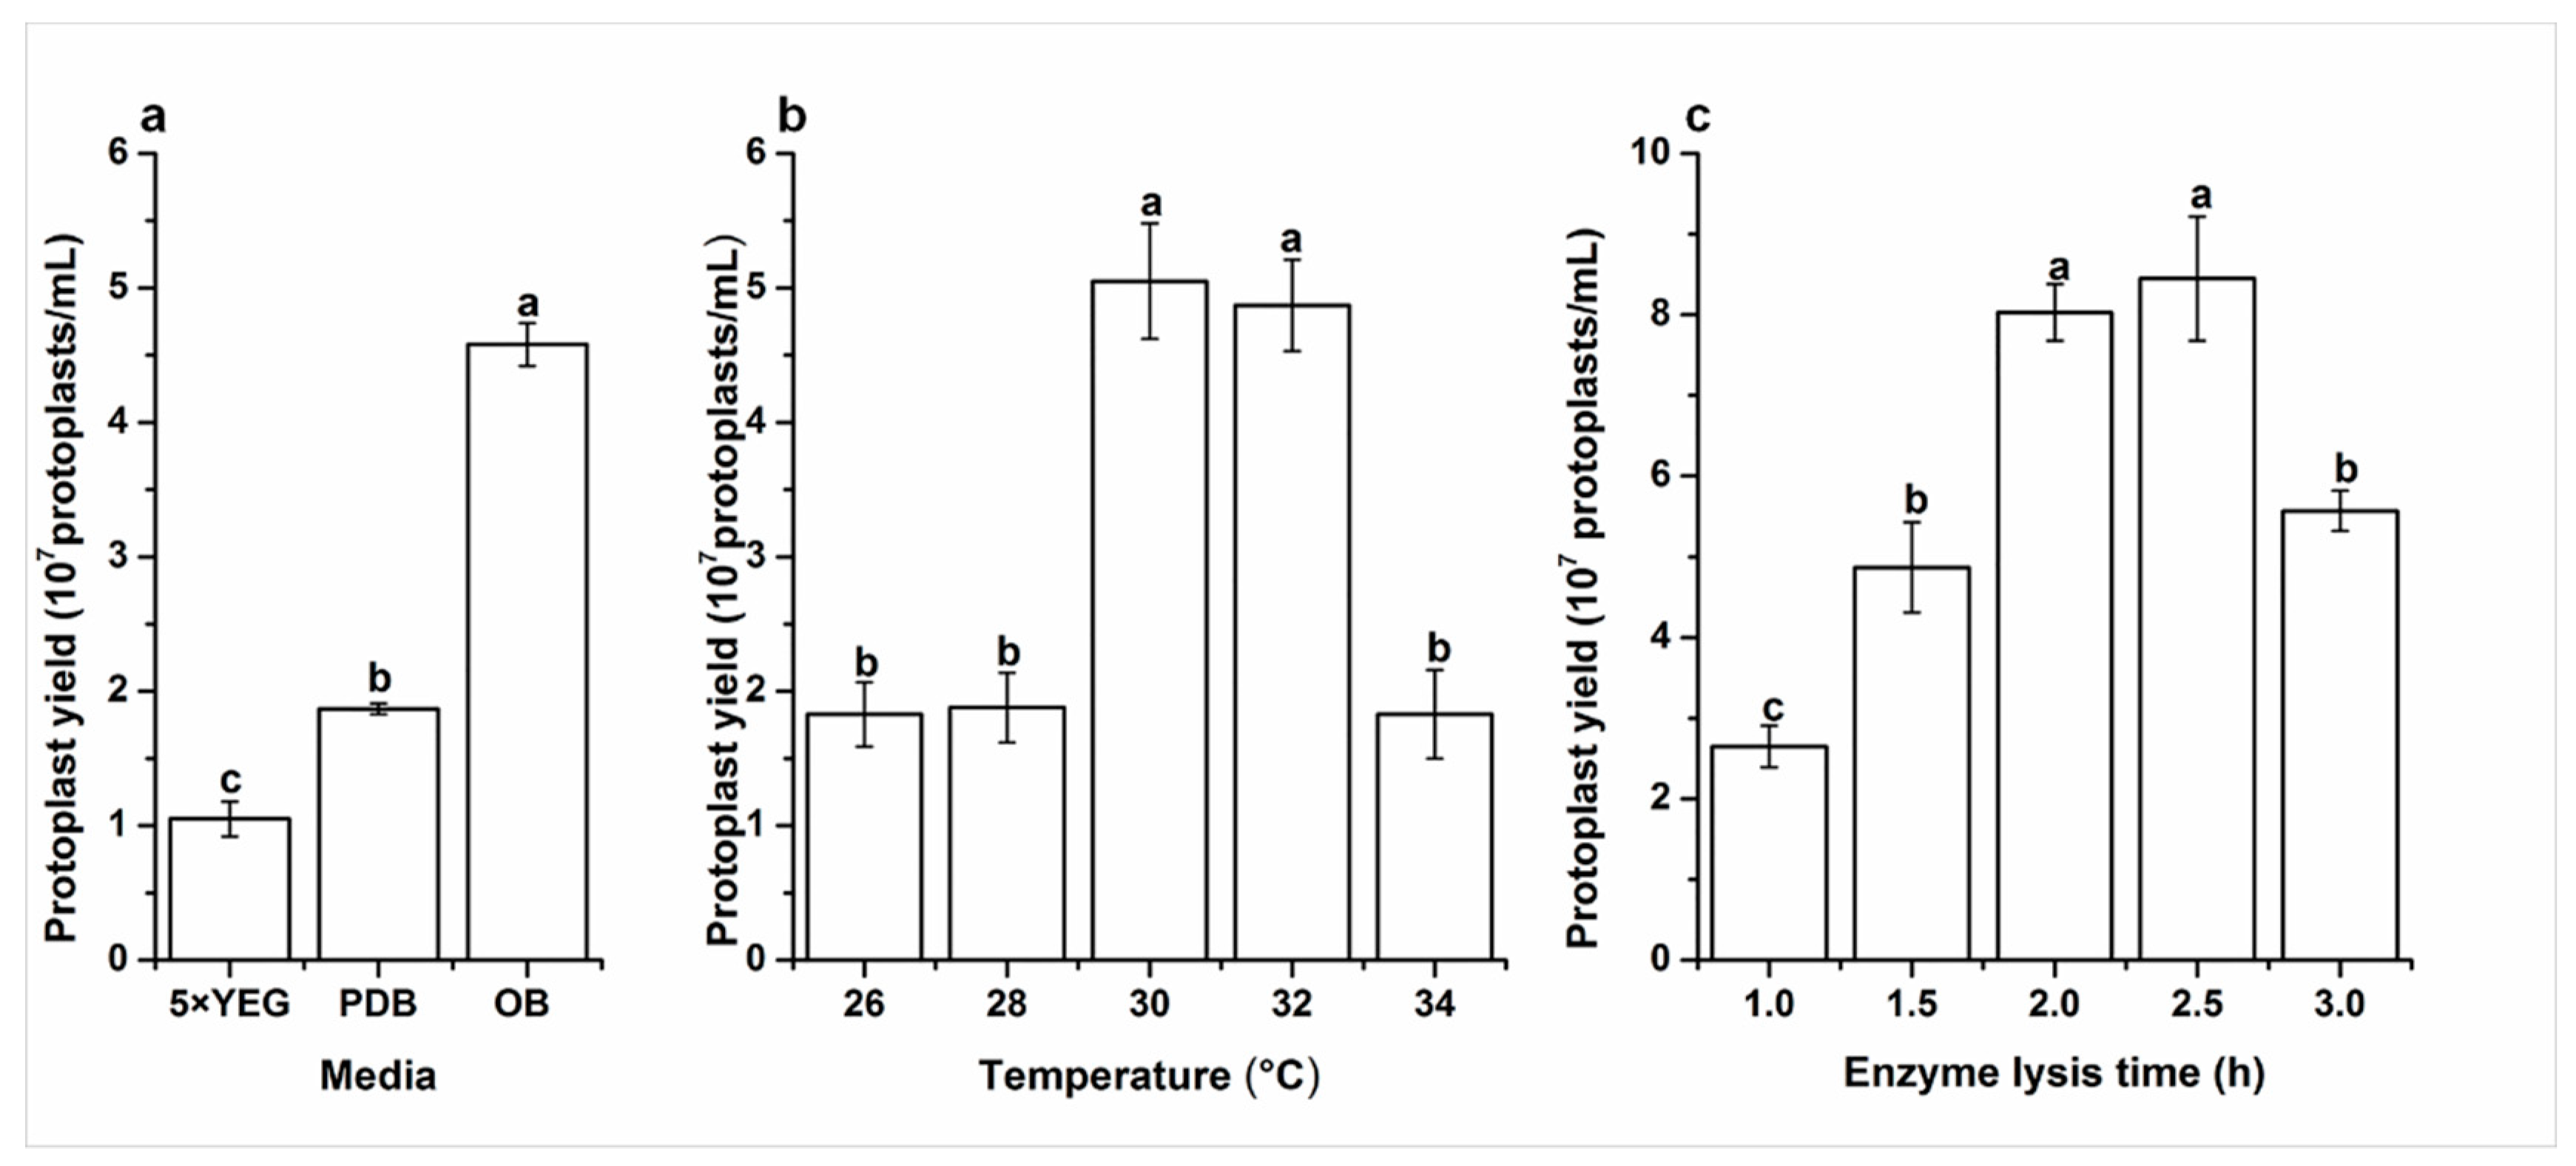
2.2. Effects of Media on Protoplast Yield

The yield of the protoplasts of the mycelia of G. tritici inoculated into media of 5× YEG, PDB, and OB were 1.05 × 10⁷, 1.87 × 10⁷, and 4.58 × 10⁷ protoplasts/mL, respectively (Figure 1a). The results showed that OB was the best medium for preparing the protoplasts of G. tritici.

2.3. Effects of Digesting Temperature on Protoplast Yield

The results showed that temperatures from 30 to 32 °C were the best for enzyme activity to obtain protoplasts. When the temperature was below 30 or above 32 °C, the activity of the lysing enzyme greatly decreased, which significantly affected the protoplast yield (Figure 1b).

2.4. Effects of Enzyme Lysis Time on Protoplast Yield

The mycelia of G. tritici were digested by 0.5% lysing enzyme at 30 °C. Figure 1c shows that the protoplast yield significant increased with the increase in digesting time. However, the number of protoplasts decreased rapidly after an enzymatic digesting time of 2.5 h. There was no significant difference in protoplast production between the digesting time of 2.0 (8.03 × 10⁷ protoplasts/mL) and 2.5 h (8.45 × 10⁷ protoplasts/mL). Therefore, the best digesting time for the 0.5% lysing enzyme is between 2.0 and 2.5 h.

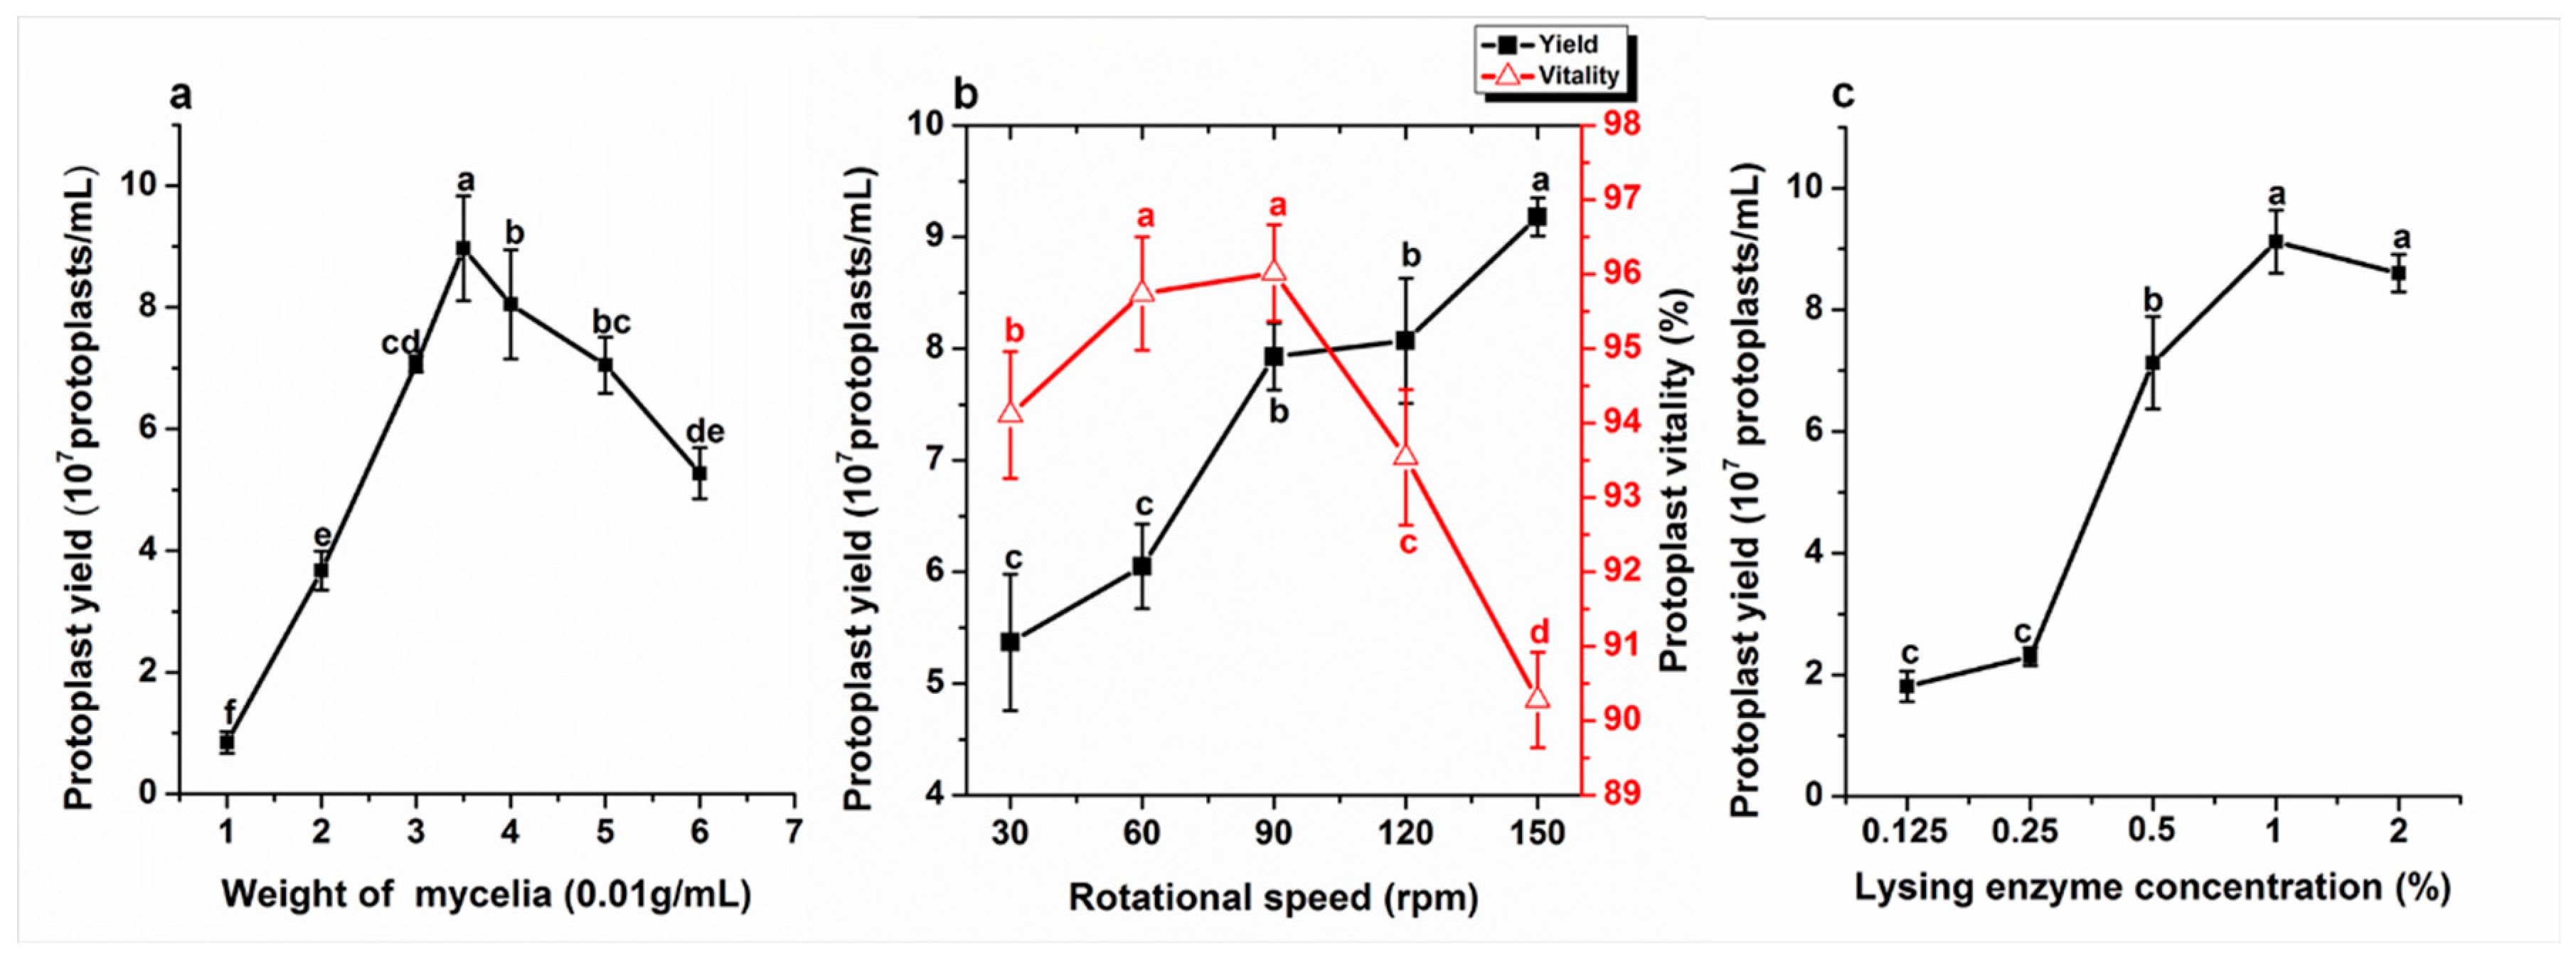
2.5. Effects of Mycelia Weight on Protoplast Yield

The mycelia of G. tritici were digested by 0.5% lysing enzyme at 30 °C for 2 h. The yield of protoplasts reached a maximum when 1 mL 0.5% lysing enzyme was reacted with 0.035 g mycelia (Figure 2a). The protoplast yield significantly decreased when the 1 mL 0.5% lysing enzyme contained less than or higher than 0.035 g mycelium. Therefore, the optimal weight of mycelia was 0.035 g in 1 mL 0.5% lysing enzyme for producing protoplasts.

2.6. Effects of Rotational Speed on Protoplast Isolation

The protoplast yield from mycelia incubated on a rotary shaker at 30, 60, 90, 120, and 150 rpm at 30 °C for 2 h were 5.37, 6.05, 7.93, 8.07, and 9.18 × 10⁷ protoplasts/mL, respectively. The results showed that when the rotational speed was 150 rpm, the yield of protoplasts was significantly higher than for other rotational speeds. There was no significant difference between the rotational speeds of 90 and 120 rpm. Although the yield of protoplasts at 150 rpm was higher than at other rotational speeds, the vitality was 90.28%. When the rotational speed was 90 rpm, the protoplast vitality was highest, reaching over 96%, and the yield was also higher, reaching 7.93 × 10⁷ protoplasts/mL. When the rotational speed was 150 rpm, the yield of protoplast was the highest, but protoplast viability decreased significantly compared with 90 rpm. In summary, considering protoplast yield and protoplast viability, the best rotational speed was 90 rpm (Figure 2b).

2.7. Effects of Concentration of Lysing Enzyme on Protoplast Yield

The results presented in Figure 2c reveal that 0.5% lysing enzyme produced 7.13 × 10⁷ protoplasts/mL, which was significantly higher than the 0.125% lysing enzyme (1.81 × 10⁷ protoplasts/mL) and 0.25% lysing enzyme (2.30 × 10⁷ protoplasts/mL). The protoplast yields with different concentrations of lysing enzyme (1% and 2%) were 9.12 × 10⁷ and 8.60 × 10⁷ protoplasts/mL, respectively. There was no significant difference between 1 and 2% lysing enzymes for producing protoplasts (Figure 2c).

2.8. Optimization of Production Conditions for Protoplasts by RSM
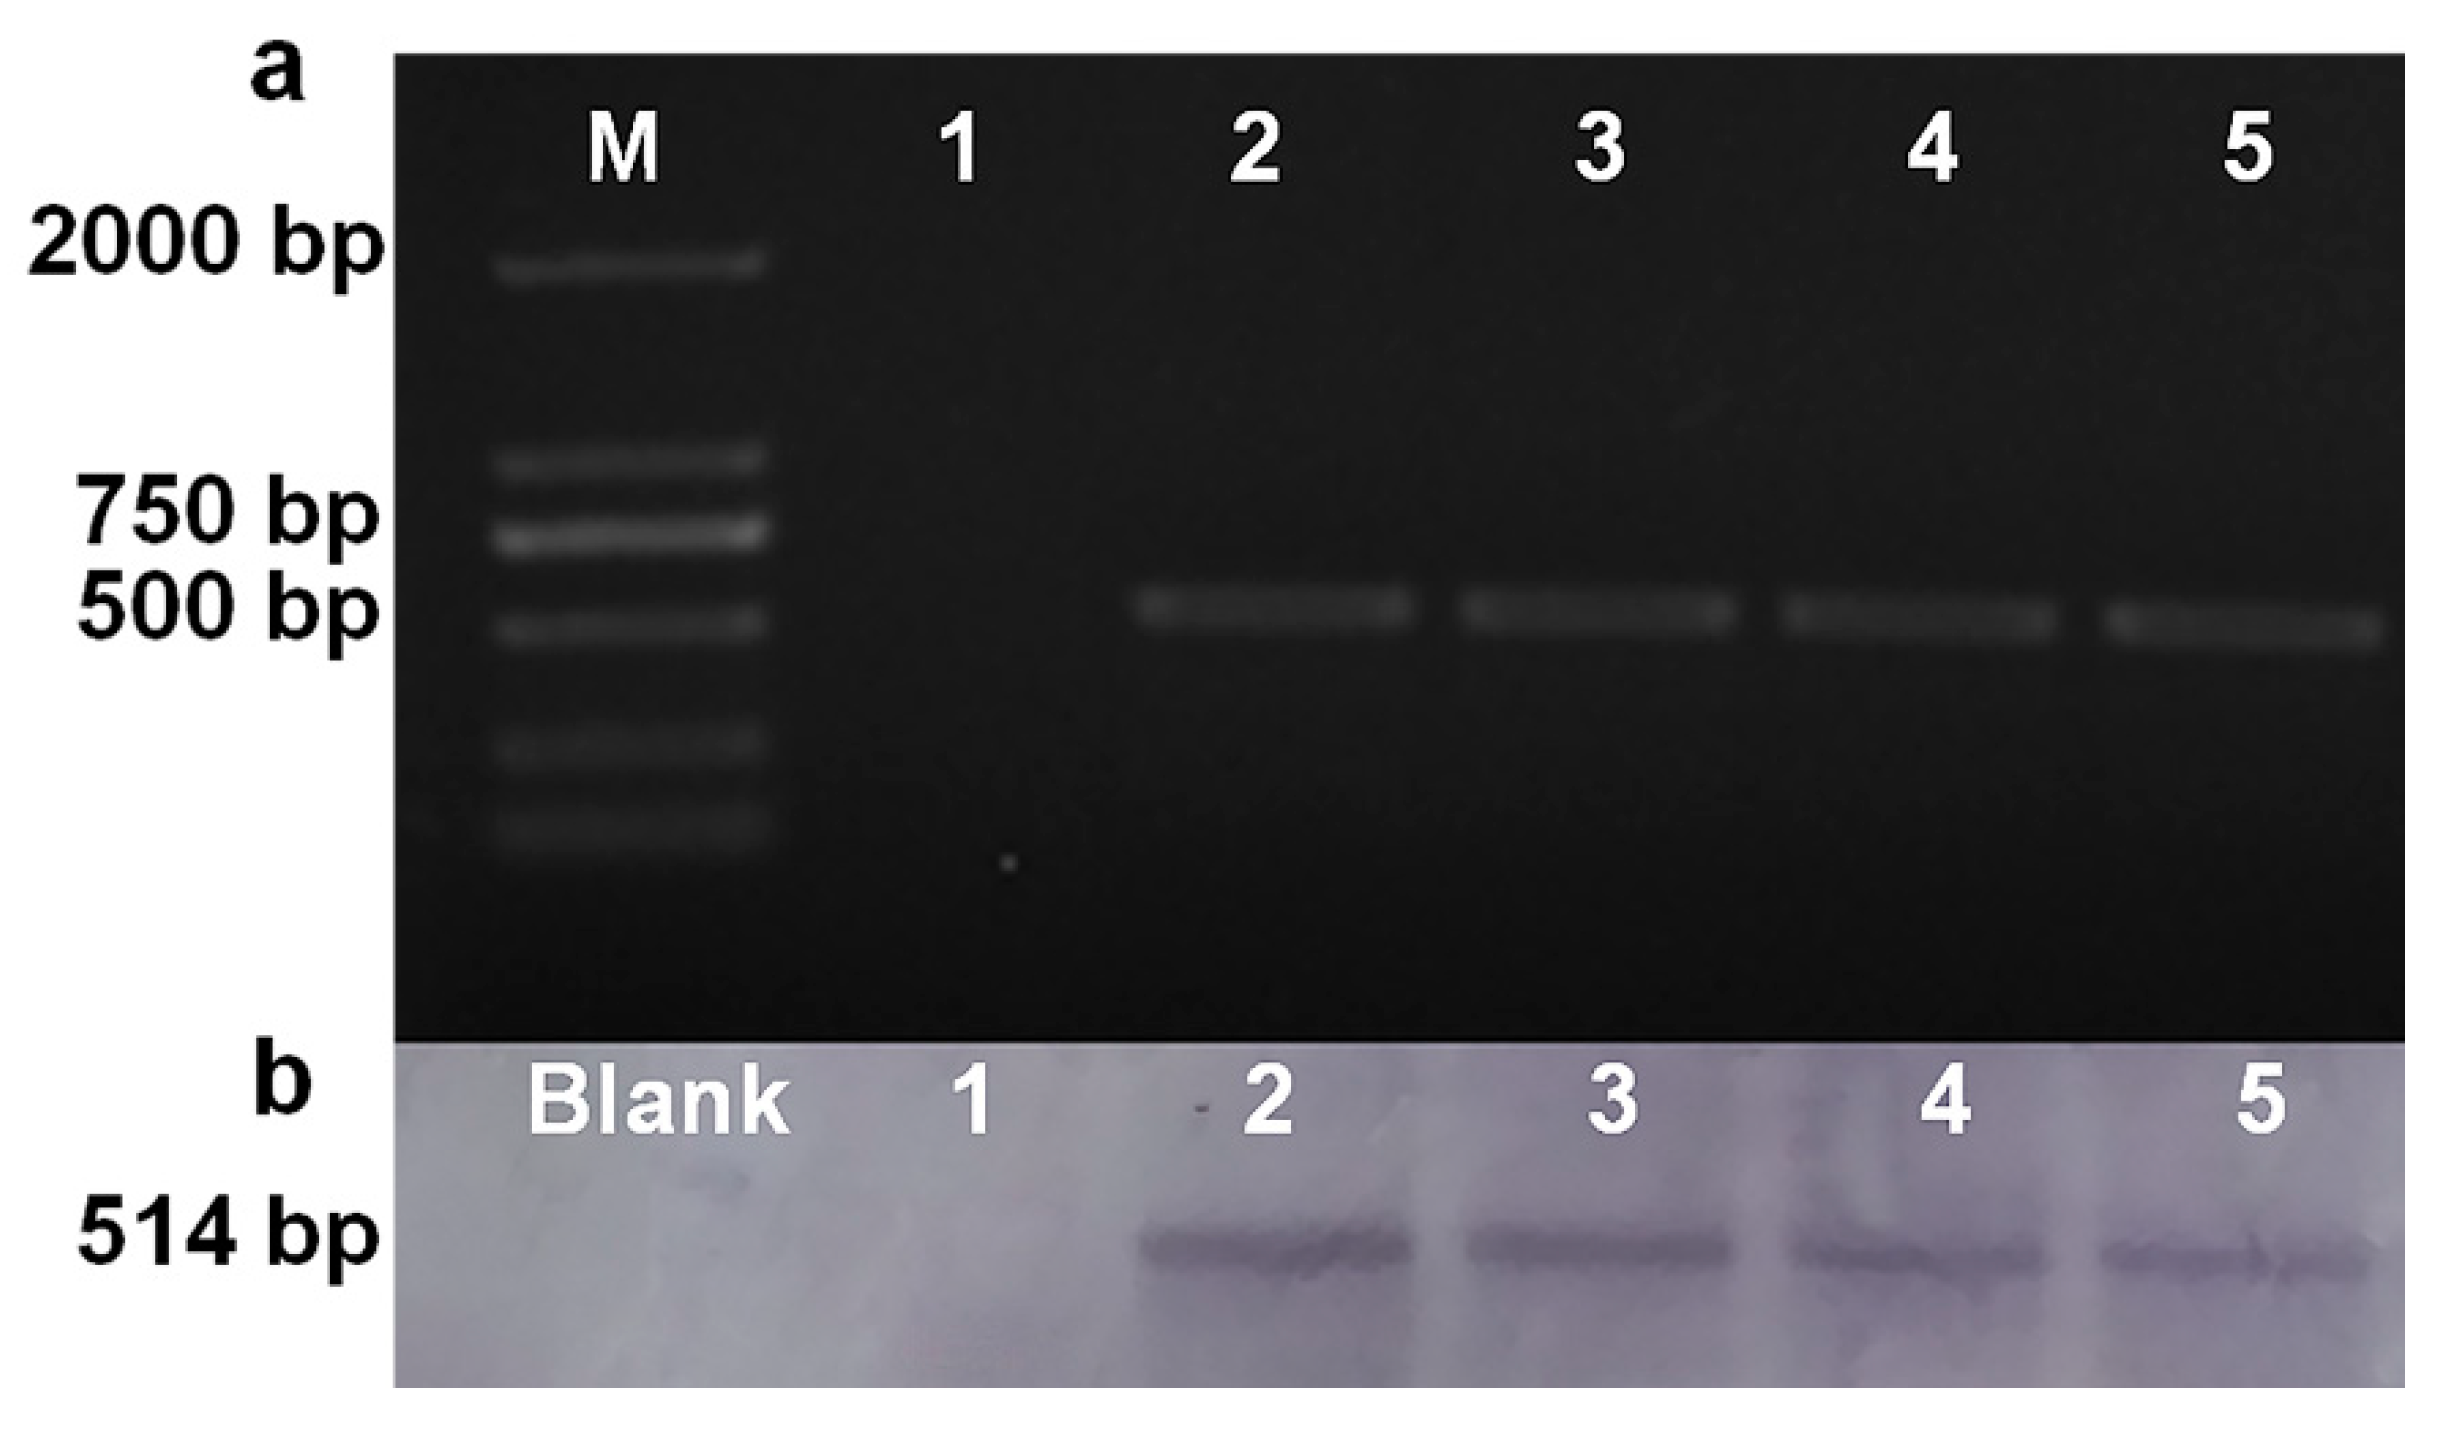
The Box–Behnken design was used to determine the optimal conditions of protoplast production in G. tritici. The levels of the three independent variables, temperature, enzyme lysis time, and concentration of lysing enzyme, are provided in Section 4.5. A total of 15 experiments with different combinations of three independent variables were performed according to the Box–Behnken design (Table 2). The protoplast yields of the experimental and predicted values are provided in Table 2, and the predicted values were calculated from the quadratic polynomial equation mentioned below, which was used to explain the relationship between the protoplast yield and independent variables
Y= 9.37 + 1.26X1 – 0.12X2 + 0.15X3 − 0.52X1X2 + 0.18X1X3 − 0.10X2X3 − 1.53X12 − 0.33X22 − 0.84X32
where Y is the predicted response of protoplast yield; and χ1, χ2, and χ3 are the coded values of temperature, enzyme lysis time, and lysing enzyme concentration, respectively.
The analysis of variance (ANOVA) of the quadratic regression model demonstrated that the model was significant due to the Fisher’s F test (Fmodel = mean square regression/mean square residual = 29.06) with a very low p value, with (Pmodel > F) = 0.0009 (Table 3). The fit of the model was checked using the determination coefficient, R2, which was 0.9812, indicating that 98% of the variability in the response could be explained by the model. The coefficient of variation (CV) was related to the reliability and precision, and the higher the value of CV, the lower the reliability of the experiment [24]. In this model, a lower CV value (3.89%) indicated better reliability and precision of the experiment. The results showed that the linear coefficient χ1 was more significant than the other factors, which implied that the temperature strongly influenced protoplast yield. The interaction coefficients of χ1χ2, χ1χ3, and χ2χ3 seemed to be insignificant, which revealed that the interactions of any two variables insignificantly affected protoplast yield.
The three-dimensional (3D) response surface plots and the two-dimensional (2D) contour plots described by the regression model were designed to expose the optimal values of the independent variables and the interactive effects of each independent variable on the response [24]. From the 3D response surface plots and the corresponding 2D contour plots, the optimal values of the independent variables and the maximum responses were predicted and the interactions between each independent variable were explained (Figure 3). Each contour curve represented a response value estimated by the pairwise combination with another factor maintained at its zero level. From Figure 3, the optimal values of the conditions for producing the maximum yield of protoplasts lay in the following ranges: temperature 30–32 °C (Figure 3a,b), enzyme lysis time 2–2.5 h (Figure 3a,c), and lysing enzyme concentration 0.88–1.63% (Figure 3b,c). By performing analyses with Design Expert Software, the optimal values of the independent variables in actual units were: temperature 31 °C, enzyme lysis time 2.2 h, and lysing enzyme concentration 1.4%. The model predicted that the maximum protoplast yield of 9.76 × 10⁷ protoplasts/mL would be obtained by using the above optimal conditions.
A verification experiment was performed using the optimized conditions. The experiment demonstrated that the value of the experimental response (9.83 × 10⁷ protoplasts/mL) was almost equal to the maximum predicted yield (9.76 × 10⁷ protoplasts/mL), clearly proving the aptness of model under these conditions. Consequently, the model was considered to be accurate and reliable for predicting the protoplast yield. Moreover, the protoplast vitality was high, reaching 96.27% under the optimized conditions.

2.9. Transformation

To regenerate the transformed protoplasts, they were initially plated onto potato dextrose agar (PDA) plates with 120 μg/mL hygromycin B using toothpicks, and continuously transferred five times onto new PDA plates containing 120 μg/mL hygromycin B. More than 98% transformants were able to grow stably, indicating that we had obtained positive transformants. There were 46–54 transformants/μg NDA (Table 4).

2.10. Southern Blotting

The integration of hph into the genome of transformants was verified using PCR and Southern blotting. As showed in Figure 4a, diagnostic PCR with YzbF/R primers, using genomic DNA of hygromycin-resistance transformants as the template, showed that a 514-bp product was amplified, whereas no product was found using untransformed G. tritici genomic DNA. Southern blot analyses were evaluated with the probe. The probe detected a single band with an expected size of 514 bp in the four transformants, and no band was found in the wild type (Figure 4b). The results indicated that the DNA fragment (1790 bp) of the hygromycin-resistant gene was transformed into the genome of the transformants.

3. Discussion

Since the first report of a DNA-mediated transformation for a fungus in 1973 [25], many fungal species, such as Sclerotinia sclerotiorum and Aspergillus oryzae, have been transformed not only for PEG-mediated transformation of protoplast, but also for Agrobacterium-mediated, biolistics, and electroporation transformation [26,27,28]. PEG-mediated protoplast transformation is an important method for studying gene function in filamentous fungi [13]. The preparation of the protoplasts is a pivotal step in PEG-mediated protoplast transformation for filamentous fungi, and the quality and quantity of protoplasts are very important for successful transformation [26]. Many factors and conditions during protoplast preparation affect the quantity and quality of the protoplasts obtained. Notably, the conditions of protoplast formation for different fungi are not identical according to the individual characteristics, such as genetic background, physiological and biochemical characteristics, and cell wall structure. In this study, to obtain a large number of high quality protoplasts of G. tritici, a series of experiments were systematically performed to determine the optimum conditions for preparing protoplasts of G. tritici.
Our results showed that the protoplast generation was poor from PDB or 5× YEG fungal culture medium. However, using the OB medium could improve the generation of protoplasts. Lysing enzymes play an important role in protoplast generation. At present, researchers can select from a diverse variety of commercially available enzymes. Our study also revealed that lysing enzyme had a better effect compared with driselase and snailase, and no significant difference was observed between the enzyme of 0.25% L, the mix of 0.25% S and 0.25% L, and 0.25% L and 0.25% D. The mix of 0.25% S 0.25% D, and 0.25% L produced 2.68 × 10⁷ protoplasts/mL, which was higher than the enzyme of 0.25% L (2.07 × 10⁷ protoplasts/mL) (Table 1). Taking into account economic efficiency, we recommend using lysing enzyme in protoplast generation, and the best digesting time was between 2.0 and 2.5 h. After one-factor-at-a-time analysis, the initial optimum conditions were as follows: 1 mL of 1–2% lysing enzyme reacting with 0.035 g of hyphae at 30–32 °C for 2.0–2.5 h at 90 rpm. The optimal conditions of temperature, enzyme lysis time, and lysing enzyme concentration were further optimized by RSM based on the Box–Behnken design. RSM proved to be an effective statistical tool for optimizing protoplast yield in G. tritici. The RSM model equation revealed that temperature, enzyme lysis time, and lysing enzyme concentration were positively significant factors for protoplast production. From the equation, the interactions between two factors were also determined. A positive interaction was calculated between temperature and lysing enzyme concentration, whereas both temperature and lysing enzyme concentration interacted negatively with enzyme lysis time. The final optimized conditions were determined to be: temperature 31 °C, enzyme lysis time 2.2 h, and lysing enzyme concentration 1.4%. Theoretically, the predicted value of protoplast production could reach 9.76 × 10⁷ protoplasts/mL under these conditions. In practice, the maximum protoplast yield was found to be 9.83 × 10⁷ protoplasts/mL in the verification test, which proved that the model was accurately able to predict protoplast yield.
In this study, we demonstrated the expression of the hph gene from plasmid pSilent-1 using the PEG-mediated protoplast transformation system described above. The present study examined the susceptibility of protoplasts to hygromycin B. The results showed that G. tritici was sensitive to high concentrations of hygromycin B (120 µg/mL for 100% death; Table S1). Thus, hygromycin B was used as a selection system to develop a PEG-based transformation system for G. tritici.
We demonstrated that the concentration of protoplast in the transformation process should be appropriate, and that the efficiency of transformation was very low when protoplast concentration was lower than 106 protoplasts/mL or higher than 108 protoplasts/mL. The most suitable protoplast concentration for filamentous fungal transformation was 107 protoplasts/mL [29]. PEG-mediated transformation of the protoplast system increases the binding of cells and DNA, being more sensitive and easier to obtain positive transformants. PEG-mediated transformation provides insights into the usefulness of the system for future studies of gene expression in fungal cells [30]. Comparisons between species are hampered by the fact that different fragment lengths are used for transformation experiments [31,32]. We described the parameters for transformation of G. tritici that resulted in a high number of transformants and up to 46–54 transformants/μg DNA. However, S. sclerotiorum produced 60–85 transformants/μg DNA [26], and the efficiency of transformation was 40–50 transformants/μg DNA in Fusarium graminearum [29].

4. Materials and Methods

4.1. Fungal Strain, Media, and Reagents

Gaeumannomyces tritici (number ACCC30310) was provided by the Agricultural Culture Collection of China (ACCC, Beijing, China). The fungus was grown on potato dextrose agar (PDA) at 25 °C for 5–7 days before being used. The strain was stored at −80 °C by cryopreservation in 30% glycerol solution [33].
The following media were used in this study: PDA (200 g potato, 17 g agar, 20 g dextrose, and 1000 mL distilled water), potato dextrose broth (PDB) (200 g potato, 20 g dextrose, and 1000 mL distilled water), oatmeal broth (OB) (50 g oatmeal and 1000 mL distilled water), 5× yeast extract glucose (5× YEG) (5 g yeast extract, 5 g tryptone, 10 g glucose, and 1000 mL distilled water), CM (10 g dextrose, 2 g peptone, 1 g yeast extract, 1 g acid hydrolyzed casein, 6 g NaNO3, 0.5 g KCl, 1 g MgSO4·7H2O, 1.5 g KH2PO4, and 1000 mL distilled water), STC (200 g sucrose, 100 mL 0.5 M Tris-Cl pH 8.0, 5.55 g CaCl2, and 1000 mL distilled water), 40% PTC (40 g PEG8000 and 100 mL STC), TB3 (3 g yeast extract, 3 g acid hydrolyzed casein, 200 g sucrose, and 1000 mL distilled water), bottom agar (3 g yeast extract, 3 g acid hydrolyzed casein, 200 g sucrose, 10 g agar, and 1000 mL distilled water), and top agar (3 g yeast extract, 3 g acid hydrolyzed casein, 200 g sucrose, 15 g agar, and 1000 mL distilled water). All the above media were autoclaved at 120 °C for 20 min. Mycelia lysate (0.5%) was sterilized by filtration (200 mg lysing enzyme and 40 mL 1 mol/L sorbitol).
Hygromycin B was purchased from Sangon Biotech (Shanghai, China). Lysing enzyme (L), driselase (D), and fluorescein diacetate were purchased from Sigma-Aldrich (Guangzhou, China). Snailase (S) and ampicillin (amp) were purchased from Solarbio (Beijing, China).

4.2. Hygromycin Phosphotransferase Gene (hph) Fragment

A 1790 bp PtrpC-hph fragment containing hph under the control of trpC gene promoter was amplified from plasmid pSilent-1 [34,35,36]. The hph fragment was polymerase chain reaction (PCR)-amplified from pSilent-1 using the primers HygbF (5′-TAACCGTATTACCGCCTTTG-3′) and HygbR (5′-TCGGCATCTACTCTATTCCTTT-3′) in a total reaction volume of 25 μL containing 0.75 μL PCR forward primer (10 μM), 0.75 μL PCR reverse primer (10 μM), 1 μL DNA sample of plasmid pSilent-1, 10 μL RNase free dH2O, and 12.5 μL PrimeSTAR Max (Takara, Dalian, China). The reaction mixtures were amplified for 32 cycles (98 °C for 10 s, 55 °C for 5 s, and 72 °C for 2 min) in a C1000TM thermal cycler (BIO-RAD, Shanghai, China). The PCR products were purified by TIANquick Midi Purification kit (Tiangen, Beijing, China).

4.3. Preparation of Protoplasts

Mycelia of G. tritici were harvested from a seven-day-old PDA culture and inoculated into 50 mL of OB and incubated on a rotary shaker (175 rpm) at 25 °C for 2 days. Then 50 mL CM was added and incubation continued on a rotary shaker (175 rpm) at 25 °C for 2 days. The mycelia were filtered and washed twice with 1 mol/L sorbitol, and mixed with mycelia lysate (40 mL), then incubated on a rotary shaker (90 rpm) at 30 °C for 2 h. Protoplasts were filtered with a layer of cloth and two layers of lens cleaning tissue (Hangzhou Special Paper Industry Co., Ltd., Hangzhou, Zhejiang, China), and centrifuged for 5 min at 3000× g. The supernatant was removed, the protoplasts were suspended with 20 mL STC, and centrifuged for 5 min at 3000× g. The protoplasts were resuspended with 2 mL STC and stored on ice until transformation.

4.4. Protoplast Yield Optimization

4.4.1. Effects of Enzyme on Protoplast Yield

Various enzymes and enzyme combinations were used, including 0.25% lysing enzyme (L), 0.25% driselase (D), 0.25% snailase (S), 0.25% L+ 0.25% D, 0.25% L+ 0.25% S, 0.25% D+ 0.25% S, and 0.25% L+ 0.25% D+ 0.25% S. The other operations were the same as in Section 4.3.

4.4.2. Effects of Media on Protoplast Yield

Mycelia of G. tritici were harvested from a seven-day-old PDA culture and inoculated into 50 mL of PDB, OB, and 5× YEG, and incubated on a rotary shaker (175 rpm) at 25 °C for two days. Then, 50 mL CM was added and incubation continued on a rotary shaker (175 rpm) at 25 °C for two days, and the other operations were the same as outlined in Section 4.3.

4.4.3. Effects of Digesting Temperature on Protoplast Yield

Mycelia of G. tritici were tested at digesting temperatures of 26, 28, 30, 32, and 34 °C. The other operations were the same as in Section 4.3.

4.4.4. Effects of Enzyme Lysis Time on Protoplast Yield

The mycelia of G. tritici were digested for 1, 1.5, 2, 2.5, and 3 h. The other operations were the same as in Section 4.3.

4.4.5. Effects of Mycelia Weight on Protoplast Yield

G. tritici mycelial weights of 0.01, 0.02, 0.03, 0.035, 0.04, 0.05, and 0.06 g were digested in 1 mL 0.5% lysing enzyme. The other operations were the same as in Section 4.3.

4.4.6. Effects of Rotational Speed on Protoplast Isolation

On a rotary shaker, mycelia of G. tritici were digested at rotational speeds of 30, 60, 90, 120, and 150 rpm. The other operations were the same as in Section 4.3. Protoplasts viability was simultaneously assessed according to the method described by Jia et al. [37].

4.4.7. Effects of Concentration of Lysing Enzyme on Protoplast Yield

Use of a proper enzyme system is usually a crucial for preparing highly efficient protoplasts. A series of concentrations of lysing enzyme (0.125%, 0.25%, 0.5%, 1%, and 2%) were tested. The other operations were the same as in Section 4.3.

4.5. Response Surface Optimization Designs

The main purpose of the Box–Behnken design of the experiment was to investigate the relationship between the multiple process variables and protoplast yield in order to determine the optimum conditions for the protoplast production. According to a series of single factor experimental results, three major factors—temperature (X1), enzyme lysis time (X2), and concentration of lysing enzyme (X3)—were selected as the independent variables. Table 5 shows the three experiment levels of the variables. The software Design Expert version 8.05 including a built-in analysis of variance was employed for the experimental design, data analysis, and modeling. A total of 15 experiments were performed, including three center points (Table 2).

4.6. Transformation

To 200 µL of protoplast in 50 mL tubes were added 4, 6, 8 µg DNA, respectively, mixed gently and incubated at room temperature for 20 min. Then 1.25 mL 40% PTC (filtration sterilization) was added, mixed gently, and incubated at room temperature for 20 min. Added 10 mL of TB3 (50 µg/mL of amp), incubated on a rotary shaker (100 rpm) at 25 °C for 12 h, and centrifuged for 5 min at 3000× g. Discarded supernatant and suspended 200 µL of STC. Then added 10 mL bottom agar (60 µg/mL hygromycin B), mixed gently and poured into a Petri dish. Cultured 12 h at 25 °C and added 10 mL top agar (120 µg/mL hygromycin B) to the Petri dish. After 4–5 days, the plates were screened for transformants, which were transferred to PDA media.

4.7. Southern Blotting

The wild strain and four transformants of G. tritici were grown on petri dishes containing PDA at 25 °C for seven days before they were harvested in sterile distilled water. The mycelia were then transferred to a triangular flask containing 100 mL PDB and incubated on a rotary shaker (175 rpm) at 25 °C for five days. The mycelia were collected by vacuum filtration, and genomic DNA was extracted by Plant Genomic DNA Kit (CWBIO, Beijing, China). The primers YzbF (5′-GATCGTTATGTTTATCGGCACT-3′) and YzbR (5′-TGGCGACCTCGTATTGG-3′) were used for testing and verifying PCR amplification of the hph gene fragment.
Southern blot analyses of transformants were performed with a DIG-High Prime DNA Labeling and Detection Starter Kit I (Roche, Shanghai, China) [38]. For Southern blotting of transformants, 15 μg DNA from the wild type and four transformants were digested overnight with HindIII (Takara, Dalian, China), and the digested DNA was electrophoresed on 0.8% agarose gel. DNA fragments were transferred onto a nylon membrane (Solarbio, Beijing, China) and hybridized with a labelled probe (514 bp) obtained by PCR amplification with primers Yzb-F/R from plasmid pSilent-1.

4.8. Data Analysis

Statistical analyses were performed with SPSS 19.0. Statistical differences between treatments were evaluated by Fisher’s least significant difference test at a 5% significance level.

Supplementary Materials

The following are available online at https://www.mdpi.com/1420-3049/23/6/1253/s1, Table S1: The effect of hygromycin B on the mycelial growth of G. tritici.

Author Contributions

Conceptualization, M.W., J.Z., and L.W.; Methodology, M.W. and J.Z.; Validation, M.W., L.W., and L.H.; Formal Analysis, M.W.; Resources, X.Z. and J.F.; Data Curation, M.W.; Writing–Original Draft Preparation, M.W.; Writing–Review & Editing, M.W. and X.Z.; Supervision, X.Z. and J.F.; Project Administration, X.Z. and J.F.; Funding Acquisition, J.F.

Funding

This research was funded by the National Natural Science Foundation of China (no. 31272074).

Acknowledgments

We are thankful to the reviewers for their helpful comments. We greatly appreciate the funding provided by National Natural Science Foundation of China (no. 31272074).

Conflicts of Interest

The authors declare no conflict of interest.

References

  1. Hernández-Restrepo, M.; Groenewald, J.Z.; Elliott, M.L.; Canning, G.; McMillan, V.E.; Crous, P.W. Take-all or nothing. Stud. Mycol. 2016, 83, 19–48. [Google Scholar] [CrossRef] [PubMed]
  2. Monsálvez, M.; Zapata, N.; Vargas, M.; Berti, M.; Bittner, M.; Hernández, V. Antifungal effects of n-hexane extract and essential oil of Drimys winteri bark against Take-All disease. Ind. Crops Prod. 2010, 31, 239–244. [Google Scholar] [CrossRef]
  3. Keenan, S.; Cromey, M.G.; Harrow, S.A.; Bithell, S.L.; Butler, R.C.; Beard, S.S.; Pitman, A.R. Quantitative PCR to detect Gaeumannomyces graminis var. tritici in symptomatic and non-symptomatic wheat roots. Australas. Plant Pathol. 2015, 44, 1–7. [Google Scholar] [CrossRef]
  4. Schesser, K.; Luder, A.; Henson, J.M. Use of polymerase chain reaction to detect the take-all fungus, Gaeumannomyces graminis, in infected wheat plants. Appl. Environ. Microbiol. 1991, 57, 553–556. [Google Scholar] [PubMed]
  5. Mcmillan, V.E.; Hammond-Kosack, K.E.; Gutteridge, R.J. Evidence that wheat cultivars differ in their ability to build up inoculum of the take-all fungus, Gaeumannomyces graminis var. tritici, under a first wheat crop. Plant Pathol. 2015, 60, 200–206. [Google Scholar] [CrossRef]
  6. Gutteridge, R.J.; Bateman, G.L.; Todd, A.D. Variation in the effects of take-all disease on grain yield and quality of winter cereals in field experiments. Pest Manag. Sci. 2003, 59, 215–224. [Google Scholar] [CrossRef] [PubMed]
  7. Mcmillan, V.E.; Gutteridge, R.J.; Hammond-Kosack, K.E. Identifying variation in resistance to the take-all fungus, Gaeumannomyces graminis var. tritici, between different ancestral and modern wheat species. BMC Plant Biol. 2014, 14, 212. [Google Scholar] [CrossRef] [PubMed]
  8. Yang, L.; Xie, L.; Xue, B.; Goodwin, P.H.; Quan, X.; Zheng, C.; Liu, T.; Lei, Z.; Yang, X.; Chao, Y.; et al. Comparative Transcriptome Profiling of the Early Infection of Wheat Roots by Gaeumannomyces graminis var. tritici. PLoS ONE 2015, 10, e0120691. [Google Scholar] [CrossRef] [PubMed]
  9. Travisi, C.M.; Nijkamp, P. Valuing environmental and health risk in agriculture: A choice experiment approach to pesticides in Italy. Ecol. Econ. 2008, 67, 598–607. [Google Scholar] [CrossRef]
  10. Vijver, M.G.; Hunting, E.R.; Nederstigt, T.A.; Tamis, W.L.; van den Brink, P.J.; van Bodegom, P.M. Postregistration monitoring of pesticides is urgently required to protect ecosystems. Environ. Toxicol. Chem. 2017, 36, 860–865. [Google Scholar] [CrossRef] [PubMed]
  11. Fincham, J.R. Transformation in fungi. Microbiol. Rev. 1989, 53, 148–170. [Google Scholar] [PubMed]
  12. Robinson, M.; Sharon, A. Transformation of the bioherbicide Colletotrichum gloeosporioides f. sp. aeschynomene by electroporation of germinated conidia. Curr. Genet. 1999, 36, 98–104. [Google Scholar] [CrossRef] [PubMed]
  13. Irie, T.; Honda, Y.; Watanabe, T.; Kuwahara, M. Efficient transformation of filamentous fungus Pleurotus ostreatus using single-stranded carrier DNA. Appl. Microbiol. Biotechnol. 2001, 55, 563–565. [Google Scholar] [CrossRef] [PubMed]
  14. Stanway, C.; Buck, K.W. Infection of Protoplasts of the Wheat Take-all Fungus, Gaeumannomyces graminis var. tritici, with Double-stranded RNA Viruses. J. Gen. Virol. 1984, 65, 2061–2065. [Google Scholar] [CrossRef]
  15. Henson, J.M.; Blake, N.K.; Pilgeram, A.L. Transformation of Gaeumannomyces graminis to benomyl resistance. Curr. Genet. 1988, 14, 113–117. [Google Scholar] [CrossRef]
  16. Park, J.; Radwan, O.; Martin, B.; Wilkinson, H.T.; Fouly, H.M. Transformation of Gaeumannomyces graminis with beta-Glucuronidase Reporter and Hygromycin Resistance Genes. J. Phytopathol. 2011, 159, 317–320. [Google Scholar] [CrossRef]
  17. Bowyer, P.; Musker, R.; Osbourn, A.E.; Clarke, B.; Caten, C.; Daniels, M.J. Production of mutants of Gaeumannomyces graminis var. tritici and var. avenae by 4-nitroquinolene-oxide treatment of protoplasts. Fungal Genet. Rep. 1992, 39, 13–14. [Google Scholar] [CrossRef]
  18. Zhou, W.W.; He, Y.L.; Niu, T.G.; Zhong, J.J. Optimization of fermentation conditions for production of anti-TMV extracellular ribonuclease by Bacillus cereus using response surface methodology. Bioprocess Biosyst. Eng. 2010, 33, 657–663. [Google Scholar] [CrossRef] [PubMed]
  19. Yin, X.; You, Q.; Jiang, Z. Optimization of enzyme assisted extraction of polysaccharides from Tricholoma matsutake by response surface methodology. Carbohydr. Polym. 2011, 86, 1358–1364. [Google Scholar] [CrossRef]
  20. Hu, G.P.; Zhao, Y.; Song, F.Q.; Liu, B.; Vasseur, L.; Douglas, C.; You, M.S. Isolation, identification and cyfluthrin-degrading potential of a novel Lysinibacillus sphaericus strain, FLQ-11-1. Res. Microbiol. 2014, 165, 110–118. [Google Scholar] [CrossRef] [PubMed]
  21. Khairudin, N.; Basri, M.; Fard, H.M.; Samson, S.; Ashari, S.E. Enhancing the bioconversion of azelaic acid to its derivatives by response surface methodology. Molecules 2018, 23, 397. [Google Scholar] [CrossRef] [PubMed]
  22. Altemimi, A.; Lightfoot, D.A.; Kinsel, M.; Watson, D.G. Employing response surface methodology for the optimization of ultrasound assisted extraction of lutein and β-carotene from spinach. Molecules 2015, 20, 6611–6625. [Google Scholar] [CrossRef] [PubMed]
  23. Muntari, B.; Amid, A.; Mel, M.; Jami, M.S.; Salleh, H.M. Recombinant bromelain production in Escherichia coli: Process optimization in shake flask culture by response surface methodology. AMB Express 2012, 2, 12. [Google Scholar] [CrossRef] [PubMed]
  24. Zhou, Y.; Sun, Y.B.; He, H.W.; Feng, J.T.; Zhang, X.; Han, L.R. Optimization of medium compositions to improve a novel glycoprotein production by Streptomyces kanasenisi ZX01. AMB Express 2017, 7, 6. [Google Scholar] [CrossRef] [PubMed]
  25. Mishra, N.C.; Tatum, E.L. Non-Mendelian inheritance of DNA-induced inositol independence in Neurospora. Proc. Natl. Acad. Sci. USA 1973, 70, 3875–3879. [Google Scholar] [CrossRef] [PubMed]
  26. Ge, C.Y.; Duan, Y.B.; Zhou, M.G.; Chen, C.J. A protoplast transformation system for gene deletion and complementation in Sclerotinia sclerotiorum. J. Phytopathol. 2013, 161, 800–806. [Google Scholar] [CrossRef]
  27. Zhang, Y.J.; Xie, M.; Zhang, X.L.; Peng, D.L.; Yu, W.B.; Li, Q.; Li, Q.; Zhao, J.J.; Zhang, Z.R. Establishment of polyethylene-glycol-mediated protoplast transformation for Lecanicillium lecanii and development of virulence-enhanced strains against Aphis gossypii. Pest Manag. Sci. 2016, 72, 1951–1958. [Google Scholar] [CrossRef] [PubMed]
  28. Nguyen, K.T.; Ho, Q.N.; Do, L.T.B.X.; Mai, L.T.D.; Pham, D.N.; Tran, H.T.T.; Le, D.H.; Nguyen, H.Q.; Tran, V.T. A new and efficient approach for construction of uridine/uracil auxotrophic mutants in the filamentous fungus Aspergillus oryzae using Agrobacterium tumefaciens-mediated transformation. World J. Microbiol. Biotechnol. 2017, 33, 107. [Google Scholar] [CrossRef] [PubMed]
  29. Hou, Y.P.; Gao, T.; Zheng, Z.T.; Chen, C.J.; Zhou, M.G. An economic and highly efficient system of protoplast transformation for Fusarium graminearum. Mycosystema 2013, 32, 891–898. [Google Scholar]
  30. Zhang, C.; Zong, H.; Zhuge, B.; Lu, X.; Fang, H.; Zhu, J.; Zhuge, J. Protoplast preparation and polyethylene glycol (PEG)-mediated transformation of Candida glycerinogenes. Biotechnol. Bioprocess Eng. 2016, 21, 95–102. [Google Scholar] [CrossRef]
  31. Maier, F.J.; Malz, S.; Lösch, A.P.; Lacour, T.; Schäfer, W. Development of a highly efficient gene targeting system for Fusarium graminearum using the disruption of a polyketide synthase gene as a visible marker. FEMS Yeast Res. 2005, 5, 653–662. [Google Scholar] [CrossRef] [PubMed]
  32. Schaefer, D.G. Gene targeting in Physcomitrella patens. Curr. Opin. Plant Biol. 2001, 4, 143–150. [Google Scholar] [CrossRef]
  33. Wang, M.; Wang, L.; Han, L.; Zhang, X.; Feng, J. The effect of carabrone on mitochondrial respiratory chain complexes in Gaeumannomyces graminis. J. Appl. Microbiol. 2017, 123, 1100–1110. [Google Scholar] [CrossRef] [PubMed]
  34. Nakayashiki, H.; Hanada, S.; Quoc, N.B.; Kadotani, N.; Tosa, Y.; Mayama, S. RNA silencing as a tool for exploring gene function in ascomycete fungi. Fungal Genet. Biol. 2005, 42, 275–283. [Google Scholar] [CrossRef] [PubMed]
  35. Chen, Y.; Gao, Q.; Huang, M.; Liu, Y.; Liu, Z.; Liu, X.; Ma, Z. Characterization of RNA silencing components in the plant pathogenic fungus Fusarium graminearum. Sci. Rep. 2015, 5, 12500. [Google Scholar] [CrossRef] [PubMed]
  36. Tetorya, M.; Rajam, M.V. RNA silencing of PEX6 gene causes decrease in pigmentation, sporulation and pathogenicity of Fusarium oxysporum. Plant Pathol. 2017, 67. [Google Scholar] [CrossRef]
  37. Jia, X.; Zhang, X.; Qu, J.; Han, R. Optimization conditions of wheat mesophyll protoplast isolation. Agric. Sci. 2016, 7, 850–858. [Google Scholar] [CrossRef]
  38. Cheng, W.; Song, X.S.; Li, H.P.; Cao, L.H.; Sun, K.; Qiu, X.L.; Xu, Y.B.; Yang, P.; Huang, T.; Zhang, J.B.; et al. Host-induced gene silencing of an essential chitin synthase gene confers durable resistance to Fusarium head blight and seedling blight in wheat. Plant Biotechnol. J. 2015, 13, 1335–1345. [Google Scholar] [CrossRef] [PubMed]
Sample Availability: Samples of the compounds Gaeumannomyces tritici (number ACCC30310) are available from the authors.
Figure 1. (a) Effects of media on protoplast yield; (b) effects of digesting temperature on protoplast yield; and (c) effects of enzyme lysis time on protoplast yield. Data represent the mean ± standard errors (SE) of three independent experiments. Different lower-case letters indicate a significant difference (p < 0.05).
Molecules 23 01253 g001
Figure 2. (a) Effects of mycelia weight on protoplast yield; (b) effects of rotational speed on protoplast isolation; and (c) effects of concentration of lysing enzyme on protoplast yield. Data represent the mean ± standard errors (SE) of three independent experiments. Different lower-case letters indicate significant difference (p < 0.05).
Molecules 23 01253 g002
Figure 3. Response surfaces and contour plots showing: (a) the combined effect of temperature and enzyme lysis time on the protoplast yield; (b) the combined effect of temperature and lysing enzyme concentration on the protoplast yield; and (c) the combined effect of enzyme lysis time and lysing enzyme concentration on the protoplast yield.
Molecules 23 01253 g003
Figure 4. Southern blot hybridization analysis of strains using the region of hygromycin phosphotransferase gene as a probe. (a) Strains were identified by polymerase chain reaction (PCR) with primers of Yzb-F/R using genomic DNA as the template; (b) Southern blot hybridization analysis of strains using the region of hygromycin phosphotransferase gene as a probe, which was amplified with primers of Yzb-F/R. Lane M: DNA Marker 2000; Lane 1: G. tritici; Lanes 2–5: hph transformants.
Molecules 23 01253 g004
Table 1. Effects of enzyme on protoplast yield.
Treatment 1Protoplast Yield (107 Protoplasts/mL)
0.25% L2.07 ± 0.02b
0.25% D0.17 ± 0.02d
0.25% S0.03 ± 0.02d
0.25% S + 0.25% L2.10 ± 0.28ab
0.25% S + 0.25% D1.38 ± 0.17c
0.25% L + 0.25% D2.37 ± 0.27ab
0.25% S + 0.25% D + 0.25% L2.68 ± 0.24a
1 Mycelia lysate: 1 mol/L sorbitol. Data represent the mean ± standard errors (SE) of three independent experiments. Different lowercase letters indicate significant differences (p < 0.05).
Table 2. Experimental design using Box–Behnken design, experimental value, and predicted value.
RunX1X2X3Experimental Value (107 Protoplasts/mL) aPredicted Value (107 Protoplasts/mL)Residual
10−1−18.058.07−0.02
2−10−15.695.77−0.08
31−109.149.41−0.27
40009.339.37−0.04
510−18.217.930.28
61018.698.590.10
7−1−105.975.850.12
8−1015.435.71−0.28
90−118.768.570.19
101108.028.13−0.11
110009.239.37−0.14
120009.569.370.19
1301−17.848.03−0.19
140118.158.130.02
15−1106.926.650.27
a Data in the table are the average of three replicates. The other conditions were different concentrations of lysing enzyme to digest 0.035 g mycelia in 90 rpm; the mycelia of G. tritici were cultured in OB medium.
Table 3. Analysis of variance (ANOVA) of the quadratic model.
SourceSum of SquaresDF aMean SquareF Valuep-Value Prob > F
Model24.8592.7629.060.0009
X112.63112.63132.87<0.0001
X20.1210.121.290.3076
X30.1910.192.020.2142
X1X21.0711.0711.270.0202
X1X30.1410.141.440.2838
X2X30.0410.040.420.5451
X128.6218.6290.720.0002
X220.4110.414.310.0926
X322.6112.6127.450.0034
Residual0.4850.095
Lack of Fit0.4230.144.860.1752
Pure Error0.05720.029
Total25.3214
a DF: Degree of Freedom, R2 = 0.9812, adjusted R2 = 0.9475, and CV = 3.89%.
Table 4. Transformation efficiency of G. tritici.
Amount of Transform DNA (µg)Amount of TransformantsTransformation Efficiency (Transformants/µg DNA)
4185.00 ± 5.5146.25 ± 1.38b
6324.00 ± 3.6154.00 ± 0.60a
8391.33 ± 4.3348.92 ± 0.54b
Data represent the mean ± standard errors (SE) of three independent experiments. Different lowercase letters indicate a significant difference (p < 0.05).
Table 5. Independent variables, symbols, and levels used in this Box–Behnken design.
SymbolsIndependent Variables−101
X1Temperature (°C)283032
X2Enzyme lysis time (h)22.53
X3Lysing enzyme concentration (%)0.512

