Calculation of the Surface Tension of Ordinary Organic and Ionic Liquids by Means of a Generally Applicable Computer Algorithm Based on the Group-Additivity Method


Abstract
:1. Introduction
2. General Procedure
3. Results
4. Conclusions
Supplementary Materials
Author Contributions
Acknowledgments
Conflicts of Interest
References
- Fowkes, F.M. Attractive Forces at Interfaces. Ind. Eng. Chem. 1964, 12, 40–52. [Google Scholar] [CrossRef]
- Van Oss, C.J.; Good, R.J.; Chaudhury, M.K. Additive and Nonadditive Surface Tension Components and the Interpretation of Contact Angles. Langmuir 1988, 4, 884–891. [Google Scholar] [CrossRef]
- Freitas, A.A.; Quina, F.H.; Carroll, F.A. A Linear Free Energy Analysis of the Surface Tension of Organic Liquids. Langmuir 2000, 16, 6689–6692. [Google Scholar] [CrossRef]
- Fowkes, F.M. Surface Effects of Anisotropic London Dispersion Forces in n-Alkanes. J. Phys. Chem. 1980, 84, 510–512. [Google Scholar] [CrossRef]
- Almeida, H.F.D.; Freire, M.G.; Fernandes, A.M.; Lopes-da-Silva, J.A.; Morgado, P.; Shimizu, K.; Filipe, E.J.M.; Lopes, J.N.C.; Santos, L.M.N.B.F.; Coutinho, J.A.P. Cation Alkyl Side Chain Length and Symmetry Effects on the Surface Tension of Ionic Liquids. Langmuir 2014, 30, 6408–6418. [Google Scholar] [CrossRef] [PubMed]
- MacLeod, D.B. On A Relation between Surface Tension and Density. Trans. Faraday Soc. 1923, 19, 38–42. [Google Scholar] [CrossRef]
- Sugden, S. A Relation between Surface Tension, Density and Chemical Composition. J. Chem. Soc. 1924, 125, 32–41. [Google Scholar] [CrossRef]
- Sastri, S.R.S.; Rao, K.K. A simple method to predict surface tension of organic liquids. Chem. Eng. J. 1995, 59, 181–186. [Google Scholar] [CrossRef]
- Caleman, C.; van Maaren, P.J.; Hong, M.; Hub, J.S.; Costa, L.T.; van der Spoel, D. Force Field Benchmark of Organic Liquids: Density, Enthalpy of Vaporization, Heat Capacities, Surface Tension, Isothermal Compressibility, Volumetric Expansion Coefficient, and Dielectric Constant. J. Chem. Theory Comput. 2012, 8, 61–74. [Google Scholar] [CrossRef] [PubMed]
- Gharagheizi, F.; Eslamimanesh, A.; Mohammadi, A.H.; Richon, D. Use of Artificial Neural Network-Group Contribution Method to Determine Surface Tension of Pure Compounds. J. Chem. Eng. Data 2011, 56, 2587–2601. [Google Scholar] [CrossRef]
- Stanton, D.T.; Jurs, P.C. Computer-Assisted Study of the Relationship between Molecular Structure and Surface Tension of Organic Compounds. J. Chem. Inf. Comput. Sci. 1992, 32, 109–115. [Google Scholar] [CrossRef]
- Egemen, E.; Nirmalakhandan, N.; Trevizo, C. Predicting Surface Tension of Liquid Organic Solvents. Environ. Sci. Technol. 2000, 34, 2596–2600. [Google Scholar] [CrossRef]
- Naef, R. A Generally Applicable Computer Algorithm Based on the Group Additivity Method for the Calculation of Seven Molecular Descriptors: Heat of Combustion, LogPO/W, LogS, Refractivity, Polarizability, Toxicity and LogBB of Organic Compounds; Scope and Limits of Applicability. Molecules 2015, 20, 18279–18351. [Google Scholar] [PubMed]
- Naef, R.; Acree, W.E. Calculation of Five Thermodynamic Molecular Descriptors by Means of a General Computer Algorithm Based on the Group-Additivity Method: Standard Enthalpies of Vaporization, Sublimation and Solvation, and Entropy of Fusion of OrdinaryOrganic Molecules and Total Phase-Change Entropy of Liquid Crystals. Molecules 2017, 22, 1059. [Google Scholar] [CrossRef]
- Naef, R.; Acree, W.E. Application of a General Computer Algorithm Based on the Group-Additivity Method for the Calculation of two Molecular Descriptors at both Ends of Dilution: Liquid Viscosity and Activity Coefficient in Water at infinite Dilution. Molecules 2018, 23, 5. [Google Scholar] [CrossRef] [PubMed]
- Jasper, J.J. The Surface Tension of Pure Liquid Compounds. J. Phys. Chem. Ref. Data 1972, 1, 841–1009. [Google Scholar] [CrossRef]
- Körösi, G.; Kovats, E.S. Density and Surface Tension of 83 Organic Liquids. J. Chem. Eng. Data 1981, 26, 323–332. [Google Scholar] [CrossRef]
- Zubillaga, R.A.; Labastida, A.; Cruz, B.; Martinez, J.C.; Sanchez, E.; Alejandre, J. Surface Tension of Organic Liquids Using the OPLS/AA Force Field. J. Chem. Theory Comput. 2013, 9, 1611–1615. [Google Scholar] [CrossRef] [PubMed]
- Luning Prak, D.J.; Cowart, J.S.; Trulove, P.C. Density and Viscosity from 293.15 to 373.15 K, Speed of Sound and Bulk Modulus from 293.15 to 343.15 K, Surface Tension, and Flash Point of Binary Mixtures of Bicyclohexyl and 1,2,3,4-Tetrahydronaphthalene or Trans-decahydronaphthalene at 0.1 Mpa. J. Chem. Eng. Data 2016, 61, 650–661. [Google Scholar] [CrossRef]
- Luning Prak, D.J. Density, Viscosity, Speed of Sound, Bulk Modulus, Surface Tension, and Flash Point of Binary Mixtures of Butylcyclohexane with Toluene or n-Hexadecane. J. Chem. Eng. Data 2016, 61, 3595–3606. [Google Scholar] [CrossRef]
- Luning Prak, D.J.; Lee, B.G. Density, Viscosity, Speed of Sound, Bulk Modulus, Surface Tension, and Flash Point of Binary Mixtures of 1,2,3,4-Tetrahydronaphthalene and Trans-decahydronaphthalene. J. Chem. Eng. Data 2016, 61, 2371–2379. [Google Scholar] [CrossRef]
- Zhang, C.; Li, G.; Yue, L.; Guo, Y.; Fang, W. Densities, Viscosities, Refractive Indices, and Surface Tensions of Binary Mixtures of 2,2,4-Trimethylpentane with Several Alkylated Cyclohexanes from (293.15 to 343.15) K. J. Chem. Eng. Data 2015, 60, 2541–2548. [Google Scholar] [CrossRef]
- Luning Prak, D.J.; Lee, B.G.; Cowart, J.S.; Trulove, P.C. Density, Viscosity, Speed of Sound, Bulk Modulus, Surface Tension, and Flash Point of Binary Mixtures of Butylbenzene + Linear Alkanes (n-Decane, n-Dodecane, n-Tetradecane, n-Hexadecane, or n-Heptadecane) at 0.1 Mpa. J. Chem. Eng. Data 2017, 62, 169–187. [Google Scholar] [CrossRef]
- Luning Prak, D.J.; Jones, M.H.; Cowart, J.S.; Trulove, P.C. Density, Viscosity, Speed of Sound, Bulk Modulus, Surface Tension, and Flash Point of Binary Mixtures of 2,2,4,6,6-Pentamethylheptane and 2,2,4,4,6,8,8-Heptamethylnonane at (293.15 to 373.15) K and 0.1 MPa and Comparisons with Alcohol-to-Jet Fuel. J. Chem. Eng. Data 2015, 60, 1157–1165. [Google Scholar] [CrossRef]
- Luning Prak, D.J.; Luning Prak, P.J.; Cowart, J.S.; Trulove, P.C. Densities and Viscosities at 293.15−373.15 K, Speeds of Sound and Bulk Moduli at 293.15−333.15 K, Surface Tensions, and Flash Points of Binary Mixtures of n-Hexadecane and Alkylbenzenes at 0.1 Mpa. J. Chem. Eng. Data 2017, 62, 1673–1688. [Google Scholar] [CrossRef]
- Tahery, R. Surface Tension Measurements for Binary Mixtures of Chlorobenzene or Chlorocyclohexane + Tetrahydrofuran at 298.15 K. J. Solut. Chem. 2017, 46, 1152–1164. [Google Scholar] [CrossRef]
- Heide, R. The surface tension of HFC refrigerants and mixtures. Int. J. Refrig. 1997, 20, 496–503. [Google Scholar] [CrossRef]
- Faurote, P.D.; Henderson, C.M.; Murphy, C.M.; O’Rear, J.G.; Ravner, H. Partiallv Fluorinated Esters and Ethers as Temperature-Stable Liquids. Ind. Eng. Chem. 1956, 48, 445–454. [Google Scholar] [CrossRef]
- Markarian, S.A.; Terzyan, A.M. Surface and bulk behavior of (dialkylsulfoxides + carbon tetrachloride) mixtures. J. Chem. Thermodyn. 2009, 41, 1413–1418. [Google Scholar] [CrossRef]
- Romagosa, E.E.; Gaines, G.L., Jr. The Surface Tension of Hexamethyldisiloxane-Toluene Mixtures. J. Phys. Chem. 1969, 3150–3152. [Google Scholar] [CrossRef]
- Myers, R.S.; Clever, H.L. Surface Tension of Octamethylcyclotetrasiloxane and Hexamethyldisilazane and Their Solutions with Carbon Tetrachloride and n-Hexadecane. J. Chem. Eng. Data 1969, 14, 161–164. [Google Scholar] [CrossRef]
- Koller, T.M.; Steininger, C.; Rausch, M.H.; Fröba, A.P. A Simple Prediction Method for the Surface Tension of Ionic Liquids as a Function of Temperature. Int. J. Thermophys. 2017, 38, 167. [Google Scholar] [CrossRef]
- Kolbeck, C.; Lehmann, J.; Lovelock, K.R.J.; Cremer, T.; Paape, N.; Wasserscheid, P.; Fröba, A.P.; Maier, F.; Steinrück, H.-P. Density and Surface Tension of Ionic Liquids. J. Phys. Chem. B 2010, 114, 17025–17036. [Google Scholar] [CrossRef] [PubMed]
- Carvalho, P.J.; Freire, M.G.; Marrucho, I.M.; Queimada, A.J.; Coutinho, J.A.P. Surface Tensions for the 1-Alkyl-3-methylimidazolium Bis(trifluoromethylsulfonyl)imide Ionic Liquids. J. Chem. Eng. Data 2008, 53, 1346–1350. [Google Scholar] [CrossRef]
- Vogel, A.I. Physical Properties and Chemical Constitution. Part XIII. Aliphatic Carboxylic Esters. J. Chem. Soc. 1948, 624–644. [Google Scholar] [CrossRef]
- Vogel, A.I. Physical Properties and Chemical Constitution. Part XX. Aliphatic Alcohols and Acids. J. Chem. Soc. 1948, 1814–1819. [Google Scholar] [CrossRef]
- Vogel, A.I. Physical Properties and Chemical Constitution. Part XXI. Aliphatic Thiols, Sulphides, and Disulphides. J. Chem. Soc. 1948, 1820–1825. [Google Scholar] [CrossRef]
- Jasper, J.J.; Kring, E.V. The Isobaric Surface Tension and Thermodynamic Properties of the Surfaces of a Series of n-Alkanes, C5 to C18, 1-Alkenes, C6 to C16, and of n-Decylcyclopentane, n-Decylcyclohexane and n-Decylbenzene. J. Phys. Chem. 1955, 59, 1019–1021. [Google Scholar] [CrossRef]
- Vogel, A.I. Physical Properties and Chemical Constitution. Part VIII. Alkyl Chlorides, Bromides, and Iodides. J. Chem. Soc. 1943, 636–647. [Google Scholar] [CrossRef]
- Zimmer, M.F.; Dix, S.; Lawrence, A.R. Thermodynamics of liquid Surfaces. Surface Tension of a Homologous Series of α,ι- Alkane Dinitrate Esters. J. Chem. Eng. Data 1965, 10, 288–290. [Google Scholar] [CrossRef]
- Grzeskowiak, R.; Jeffrey, G.H.; Vogel, A.I. Physical Properties and Chemical Constitution. Part XXXI. Polymethylene Dichlorides, Dibromides, Di-iodides, and Dicyanides. J. Chem. Soc 1960, 4728–4731. [Google Scholar] [CrossRef]
- Grzeskowiak, R.; Jeffrey, G.H.; Vogel, A.I. Physical Properties and Chemical Constitution. Part XXIX. Acetylenic Compounds. J. Chem. Soc. 1960, 4719–4722. [Google Scholar] [CrossRef]
Sample Availability: Samples of the compounds are not available from the authors. |


| No | Atom Type | Neighbours | Meaning | Example |
|---|---|---|---|---|
| 1 | B(−) | C4 | B− in tetracyanoborate | |
| 2 | B(−) | CF3 | CBF3− | alkyltrifluoroborate |
| 3 | B(−) | F4 | BF4− | tetrafluoroborate |
| 4 | C sp3 | H3B(−) | H3CB− | C in methyltrifluoroborate |
| 5 | C(−) sp3 | C3 | central C− in tricyanocarbeniate | |
| 6 | C aromatic | H:C:N(+) | C:CH:N+ | C2 in pyridinium |
| 7 | C(+) aromatic | C:N2 | N:C(C):N | C2 in 2-alkylimidazolium |
| 8 | C sp | C#N(−) | C−(C#N) | cyano-C in tricyanocarbeniate |
| 9 | C sp | N#N(−) | N−(C#N) | C in dicyanoamide |
| 10 | C sp | B#N(−) | B−(C#N) | C in tetracyanoborate |
| 11 | C sp | =N=S(−) | N=C=S− | thiocyanate |
| 12 | N(+) sp3 | C4 | N+C4 | tetraalkylammonium |
| 13 | N(+) sp2 | O2=O(−) | NO3− | nitrate |
| 14 | N aromatic | C2:C(+) | C-N(C):C+ | N1 in 1-alkylimidazolium |
| 15 | N(+) aromatic | C:C2 | C:N+(C):C | N in 1-alkylpyridinium |
| 16 | N(−) | C2 | C-N−-C | N− in dicyanoamide |
| 17 | N(−) | S2 | S-N−-S | bis(trifluoromethanesulfonyl)amide |
| 18 | P4 | CO2=O(−) | CPO3− | alkylphosphonate |
| 19 | P4 | O3=O(−) | O=PO3− | dialkylphosphate |
| 20 | P(+) | C4 | PC4+ | tetraalkylphosphonium |
| 21 | P(−) | C3F3 | F3P−C3 | tris(pentafluoroethyl)trifluorophosphate |
| 22 | P(−) | F6 | PF6− | hexafluorophosphate |
| 23 | S4 | CO=O2(−) | CSO3− | alkylsulfonate |
| 24 | S4 | O2=O2(−) | SO4− | alkylsulfate |
| Entry | Atom Type | Neighbours | Contribution | Occurrences | Molecules |
|---|---|---|---|---|---|
| 1 | Const | 24.34 | 1893 | 1893 | |
| 2 | B | C3 | −4.5 | 1 | 1 |
| 3 | B | O3 | 0.6 | 6 | 6 |
| 4 | B(−) | C4 | 17.49 | 5 | 5 |
| 5 | B(−) | CF3 | 1.11 | 5 | 5 |
| 6 | B(−) | F4 | 1.67 | 10 | 10 |
| 7 | C sp3 | H3B(−) | 1.21 | 1 | 1 |
| 8 | C sp3 | H3C | −2.28 | 3048 | 1529 |
| 9 | C sp3 | H3C(+) | 29.45 | 3 | 3 |
| 10 | C sp3 | H3N | 7.1 | 111 | 104 |
| 11 | C sp3 | H3N(+) | 8.27 | 34 | 23 |
| 12 | C sp3 | H3O | 3.14 | 194 | 155 |
| 13 | C sp3 | H3S | 4.71 | 13 | 11 |
| 14 | C sp3 | H3S(+) | 4.66 | 1 | 1 |
| 15 | C sp3 | H3P | 5.46 | 2 | 2 |
| 16 | C sp3 | H3Si | −0.65 | 113 | 18 |
| 17 | C sp3 | H2BC | 2.28 | 3 | 1 |
| 18 | C sp3 | H2BC(−) | −6.78 | 3 | 3 |
| 19 | C sp3 | H2C2 | 0.2 | 6359 | 1366 |
| 20 | C sp3 | H2C2(+) | 2.04 | 7 | 7 |
| 21 | C sp3 | H2CN | 6.38 | 271 | 175 |
| 22 | C sp3 | H2CN(+) | 6.13 | 74 | 46 |
| 23 | C sp3 | H2CO | 2.92 | 1277 | 673 |
| 24 | C sp3 | H2CP | 7.04 | 16 | 15 |
| 25 | C sp3 | H2CP(+) | 2.87 | 24 | 6 |
| 26 | C sp3 | H2CS | 4.57 | 76 | 55 |
| 27 | C sp3 | H2CS(+) | 6.64 | 5 | 2 |
| 28 | C sp3 | H2CSi | 3.91 | 12 | 5 |
| 29 | C sp3 | H2CF | −1.65 | 5 | 5 |
| 30 | C sp3 | H2CCl | 4.93 | 51 | 39 |
| 31 | C sp3 | H2CBr | 6.41 | 41 | 33 |
| 32 | C sp3 | H2CJ | 9.03 | 28 | 21 |
| 33 | C sp3 | H2O2 | 6.18 | 7 | 7 |
| 34 | C sp3 | HC3 | 1.56 | 428 | 304 |
| 35 | C sp3 | HC2N | 7.61 | 15 | 12 |
| 36 | C sp3 | HC2N(+) | 8.4 | 6 | 6 |
| 37 | C sp3 | HC2O | 5.08 | 150 | 116 |
| 38 | C sp3 | HC2S | 5.65 | 8 | 5 |
| 39 | C sp3 | HC2Cl | 4.68 | 12 | 12 |
| 40 | C sp3 | HC2Br | 6.37 | 10 | 10 |
| 41 | C sp3 | HC2J | 9.46 | 4 | 4 |
| 42 | C sp3 | HCO2 | 7.1 | 15 | 13 |
| 43 | C sp3 | HCF2 | −1.62 | 29 | 17 |
| 44 | C sp3 | HCCl2 | 5.35 | 12 | 11 |
| 45 | C sp3 | HCBr2 | 12.05 | 3 | 2 |
| 46 | C sp3 | HO3 | 9.87 | 3 | 3 |
| 47 | C sp3 | C4 | 3.1 | 111 | 104 |
| 48 | C sp3 | C3N | 4.53 | 2 | 2 |
| 49 | C sp3 | C3O | 6.42 | 36 | 36 |
| 50 | C sp3 | C3S | 4.75 | 3 | 3 |
| 51 | C sp3 | C3F | 2.23 | 21 | 11 |
| 52 | C sp3 | C3Cl | 7.32 | 42 | 33 |
| 53 | C sp3 | C3Br | 3.73 | 1 | 1 |
| 54 | C sp3 | C2F2 | −0.4 | 333 | 57 |
| 55 | C sp3 | C2Cl2 | −0.14 | 2 | 2 |
| 56 | C sp3 | CNF2 | 8.26 | 9 | 3 |
| 57 | C sp3 | COF2 | 2.99 | 34 | 18 |
| 58 | C sp3 | CF3 | −4.98 | 111 | 49 |
| 59 | C sp3 | CSF2 | 0.05 | 2 | 1 |
| 60 | C sp3 | CF2Cl | −0.7 | 2 | 1 |
| 61 | C sp3 | CPF2(−) | 2.75 | 33 | 11 |
| 62 | C sp3 | CFCl2 | −0.74 | 1 | 1 |
| 63 | C sp3 | CCl3 | 4.6 | 10 | 9 |
| 64 | C sp3 | N3F(+) | −4.3 | 1 | 1 |
| 65 | C sp3 | SF3 | −2.31 | 110 | 57 |
| 66 | C(−) sp3 | C3 | 9.33 | 3 | 3 |
| 67 | C sp2 | H2=C | −2.43 | 78 | 77 |
| 68 | C sp2 | HB=C(−) | 2.74 | 1 | 1 |
| 69 | C sp2 | HC=C | 1 | 266 | 174 |
| 70 | C sp2 | HC=O | 2.74 | 13 | 13 |
| 71 | C sp2 | H=CN | 2.75 | 216 | 108 |
| 72 | C sp2 | H=CO | 0.25 | 9 | 9 |
| 73 | C sp2 | H=CS | 4.09 | 32 | 30 |
| 74 | C sp2 | H=CCl | 0.8 | 5 | 3 |
| 75 | C sp2 | H=CBr | −1.85 | 1 | 1 |
| 76 | C sp2 | HN=O | 10.39 | 2 | 2 |
| 77 | C sp2 | HO=O | 1.28 | 13 | 13 |
| 78 | C sp2 | C2=C | 3.15 | 67 | 56 |
| 79 | C sp2 | C2=N | 5.54 | 35 | 29 |
| 80 | C sp2 | C2=O | 6.2 | 73 | 72 |
| 81 | C sp2 | C=CO | 1.71 | 3 | 3 |
| 82 | C sp2 | C=CS | 5.29 | 25 | 24 |
| 83 | C sp2 | C=CCl | 3.33 | 9 | 5 |
| 84 | C sp2 | C=CBr | 7.47 | 3 | 3 |
| 85 | C sp2 | CN=O | 7.25 | 2 | 2 |
| 86 | C sp2 | CO=O | 2.25 | 737 | 528 |
| 87 | C sp2 | CO=O(−) | −2.99 | 23 | 23 |
| 88 | C sp2 | =COS | 7.31 | 2 | 2 |
| 89 | C sp2 | C=OCl | 7.53 | 1 | 1 |
| 90 | C sp2 | C=OBr | 11.42 | 1 | 1 |
| 91 | C sp2 | =CSCl | 7.43 | 3 | 2 |
| 92 | C sp2 | =CSBr | 10.37 | 3 | 2 |
| 93 | C sp2 | =CSJ | 15.69 | 1 | 1 |
| 94 | C sp2 | =CCl2 | 2.74 | 6 | 4 |
| 95 | C sp2 | NO=O | 6.06 | 7 | 4 |
| 96 | C sp2 | O2=O | 2.64 | 12 | 12 |
| 97 | C sp2 | OS=S | 9.18 | 5 | 5 |
| 98 | C aromatic | H:C2 | 1.01 | 1614 | 344 |
| 99 | C aromatic | H:C:N | 4.01 | 106 | 63 |
| 100 | C aromatic | H:C:N(+) | 8.32 | 33 | 18 |
| 101 | C aromatic | H:N2 | 2.23 | 1 | 1 |
| 102 | C aromatic | :C3 | 1.65 | 119 | 60 |
| 103 | C aromatic | C:C2 | 2.25 | 313 | 254 |
| 104 | C aromatic | C:C:N | 5.49 | 21 | 20 |
| 105 | C aromatic | C:C:N(+) | 13.44 | 3 | 3 |
| 106 | C aromatic | :C2N | 6.23 | 19 | 19 |
| 107 | C aromatic | :C2N(+) | 10.03 | 10 | 10 |
| 108 | C aromatic | :C2:N | 9.45 | 1 | 1 |
| 109 | C aromatic | :C2O | 3.7 | 32 | 29 |
| 110 | C aromatic | :C2S | 6.74 | 9 | 9 |
| 111 | C aromatic | :C2Si | 3.98 | 4 | 3 |
| 112 | C aromatic | :C2F | −0.4 | 9 | 8 |
| 113 | C aromatic | :C2Cl | 3.95 | 21 | 17 |
| 114 | C aromatic | :C2Br | 7.09 | 4 | 4 |
| 115 | C aromatic | :C2J | 9.69 | 3 | 3 |
| 116 | C(+) aromatic | H:N2 | 0.96 | 104 | 104 |
| 117 | C(+) aromatic | C:N2 | −22.73 | 10 | 10 |
| 118 | C sp | H#C | 1.5 | 24 | 24 |
| 119 | C sp | B#N(−) | −4.57 | 20 | 5 |
| 120 | C sp | C#C | 1.74 | 56 | 40 |
| 121 | C sp | C#N | 5.9 | 63 | 62 |
| 122 | C sp | C#N(−) | −2.15 | 9 | 3 |
| 123 | C sp | N#N(−) | 0.69 | 16 | 8 |
| 124 | C sp | #NS | 9.65 | 4 | 4 |
| 125 | C sp | =N=S | 4.87 | 4 | 4 |
| 126 | C sp | =N=S(−) | 4.68 | 7 | 7 |
| 127 | N sp3 | H2C | −3.52 | 28 | 28 |
| 128 | N sp3 | H2C(pi) | 4.36 | 6 | 6 |
| 129 | N sp3 | H2N | 0.56 | 5 | 5 |
| 130 | N sp3 | HC2 | −9.48 | 20 | 20 |
| 131 | N sp3 | HC2(pi) | −4.7 | 7 | 7 |
| 132 | N sp3 | HC2(2pi) | 5.79 | 1 | 1 |
| 133 | N sp3 | HCN(pi) | 9.39 | 2 | 2 |
| 134 | N sp3 | HSi2 | −2.29 | 1 | 1 |
| 135 | N sp3 | C3 | −14.79 | 18 | 18 |
| 136 | N sp3 | C3(pi) | −11.8 | 7 | 7 |
| 137 | N sp3 | C2N | −7.92 | 4 | 4 |
| 138 | N sp3 | C2N(pi) | 0.56 | 6 | 6 |
| 139 | N sp3 | C2N(2pi) | 4.42 | 2 | 2 |
| 140 | N(+) sp3 | HC3 | −5.95 | 1 | 1 |
| 141 | N(+) sp3 | C4 | −5.84 | 21 | 21 |
| 142 | N aromatic | HC:C(+) | 9.3 | 3 | 3 |
| 143 | N aromatic | :C2 | −2.38 | 64 | 63 |
| 144 | N aromatic | C2:C(+) | 0.45 | 225 | 114 |
| 145 | N aromatic | :C:N | 7.05 | 2 | 1 |
| 146 | N(+) aromatic | C:C2 | −2.46 | 18 | 18 |
| 147 | N sp2 | C=C | 0 | 4 | 4 |
| 148 | N sp2 | =CN | −0.22 | 12 | 6 |
| 149 | N sp2 | C=N | −1.94 | 6 | 3 |
| 150 | N sp2 | =CO | 0.08 | 23 | 23 |
| 151 | N sp2 | N=O | −2.47 | 9 | 9 |
| 152 | N sp2 | O=O | 3.03 | 3 | 3 |
| 153 | N(+) sp2 | CO=O(−) | 1.7 | 22 | 20 |
| 154 | N(+) sp2 | O2=O(−) | 5.7 | 23 | 13 |
| 155 | N(−) | C2 | −0.36 | 8 | 8 |
| 156 | N(−) | S2 | −6.68 | 54 | 54 |
| 157 | O | HC | 0.58 | 161 | 150 |
| 158 | O | HC(pi) | 1.07 | 90 | 90 |
| 159 | O | HN(pi) | 3.2 | 6 | 6 |
| 160 | O | HO | 25.77 | 2 | 1 |
| 161 | O | HP | 0.31 | 13 | 7 |
| 162 | O | HS | 9 | 3 | 3 |
| 163 | O | BC | −1.36 | 18 | 6 |
| 164 | O | C2 | −4.02 | 288 | 181 |
| 165 | O | C2(pi) | −1 | 725 | 561 |
| 166 | O | C2(2pi) | 4.81 | 5 | 5 |
| 167 | O | CN(pi) | −2.67 | 16 | 16 |
| 168 | O | CN(+)(pi) | −0.78 | 22 | 12 |
| 169 | O | CN(2pi) | 5.88 | 4 | 4 |
| 170 | O | CP | −0.41 | 168 | 75 |
| 171 | O | CP(pi) | −3.25 | 3 | 1 |
| 172 | O | CS | 1.66 | 35 | 23 |
| 173 | O | CSi | −3.09 | 23 | 5 |
| 174 | O | Si2 | 1.66 | 30 | 9 |
| 175 | P3 | O3 | −1.63 | 20 | 20 |
| 176 | P4 | HO2=O | 2.98 | 16 | 16 |
| 177 | P4 | C2O=O(−) | −9.24 | 1 | 1 |
| 178 | P4 | CO2=O | −2.1 | 15 | 15 |
| 179 | P4 | CO2=O(−) | 0.34 | 1 | 1 |
| 180 | P4 | O3=O | 3.17 | 13 | 13 |
| 181 | P4 | O3=O(−) | −6.46 | 6 | 6 |
| 182 | P4 | O2=OF | 0.52 | 2 | 2 |
| 183 | P4 | O2=OCl | 5.47 | 2 | 2 |
| 184 | P4 | O=OCl2 | 8.03 | 2 | 2 |
| 185 | P(−) | C3F3 | −4.02 | 11 | 11 |
| 186 | P(−) | F6 | −4.92 | 6 | 6 |
| 187 | P(+) | C4 | 0.32 | 6 | 6 |
| 188 | S2 | HC | −1.34 | 11 | 11 |
| 189 | S2 | HC(pi) | 2.89 | 1 | 1 |
| 190 | S2 | C2 | −2.44 | 20 | 20 |
| 191 | S2 | C2(pi) | −3.02 | 15 | 15 |
| 192 | S2 | C2(2pi) | −3.49 | 33 | 33 |
| 193 | S2 | CS | 0.42 | 20 | 12 |
| 194 | S4 | C2=O | 5.9 | 3 | 3 |
| 195 | S4 | CN=O2(−) | 0.07 | 108 | 54 |
| 196 | S4 | CO=O2 | 9.34 | 3 | 3 |
| 197 | S4 | CO=O2(−) | −5.01 | 5 | 5 |
| 198 | S4 | C=O2F | 1.52 | 1 | 1 |
| 199 | S4 | C=O2Cl | 7.24 | 5 | 5 |
| 200 | S4 | O2=O | −0.65 | 8 | 8 |
| 201 | S4 | O2=O2 | 3.42 | 4 | 4 |
| 202 | S4 | O2=O2(−) | −6.44 | 7 | 7 |
| 203 | S4 | O=O2S | −0.4 | 4 | 4 |
| 204 | S(+) | C3 | 8.96 | 2 | 2 |
| 205 | Si | HC3 | −8.53 | 1 | 1 |
| 206 | Si | HC2Cl | −5.31 | 1 | 1 |
| 207 | Si | HCCl2 | −4.27 | 1 | 1 |
| 208 | Si | HO3 | 4.24 | 1 | 1 |
| 209 | Si | C4 | −7.91 | 4 | 4 |
| 210 | Si | C3N | 0 | 2 | 1 |
| 211 | Si | C3O | −3.02 | 14 | 7 |
| 212 | Si | C3Cl | −4.63 | 1 | 1 |
| 213 | Si | C3Br | −2.81 | 3 | 3 |
| 214 | Si | C2O2 | −0.04 | 21 | 6 |
| 215 | Si | C2Cl2 | −2.94 | 1 | 1 |
| 216 | Si | C2Br2 | 1.98 | 1 | 1 |
| 217 | Si | CCl3 | −3.39 | 1 | 1 |
| 218 | Si | O4 | 7.84 | 6 | 4 |
| 219 | (COH)n | COH groups: n > 1 | 3.26 | 11 | 10 |
| 220 | Alkane | No of C atoms | 0.22 | 1263 | 125 |
| 221 | Unsaturated HC | No of C atoms | 0.02 | 1314 | 125 |
| A | Based on | Valid groups | 165 | 1893 | |
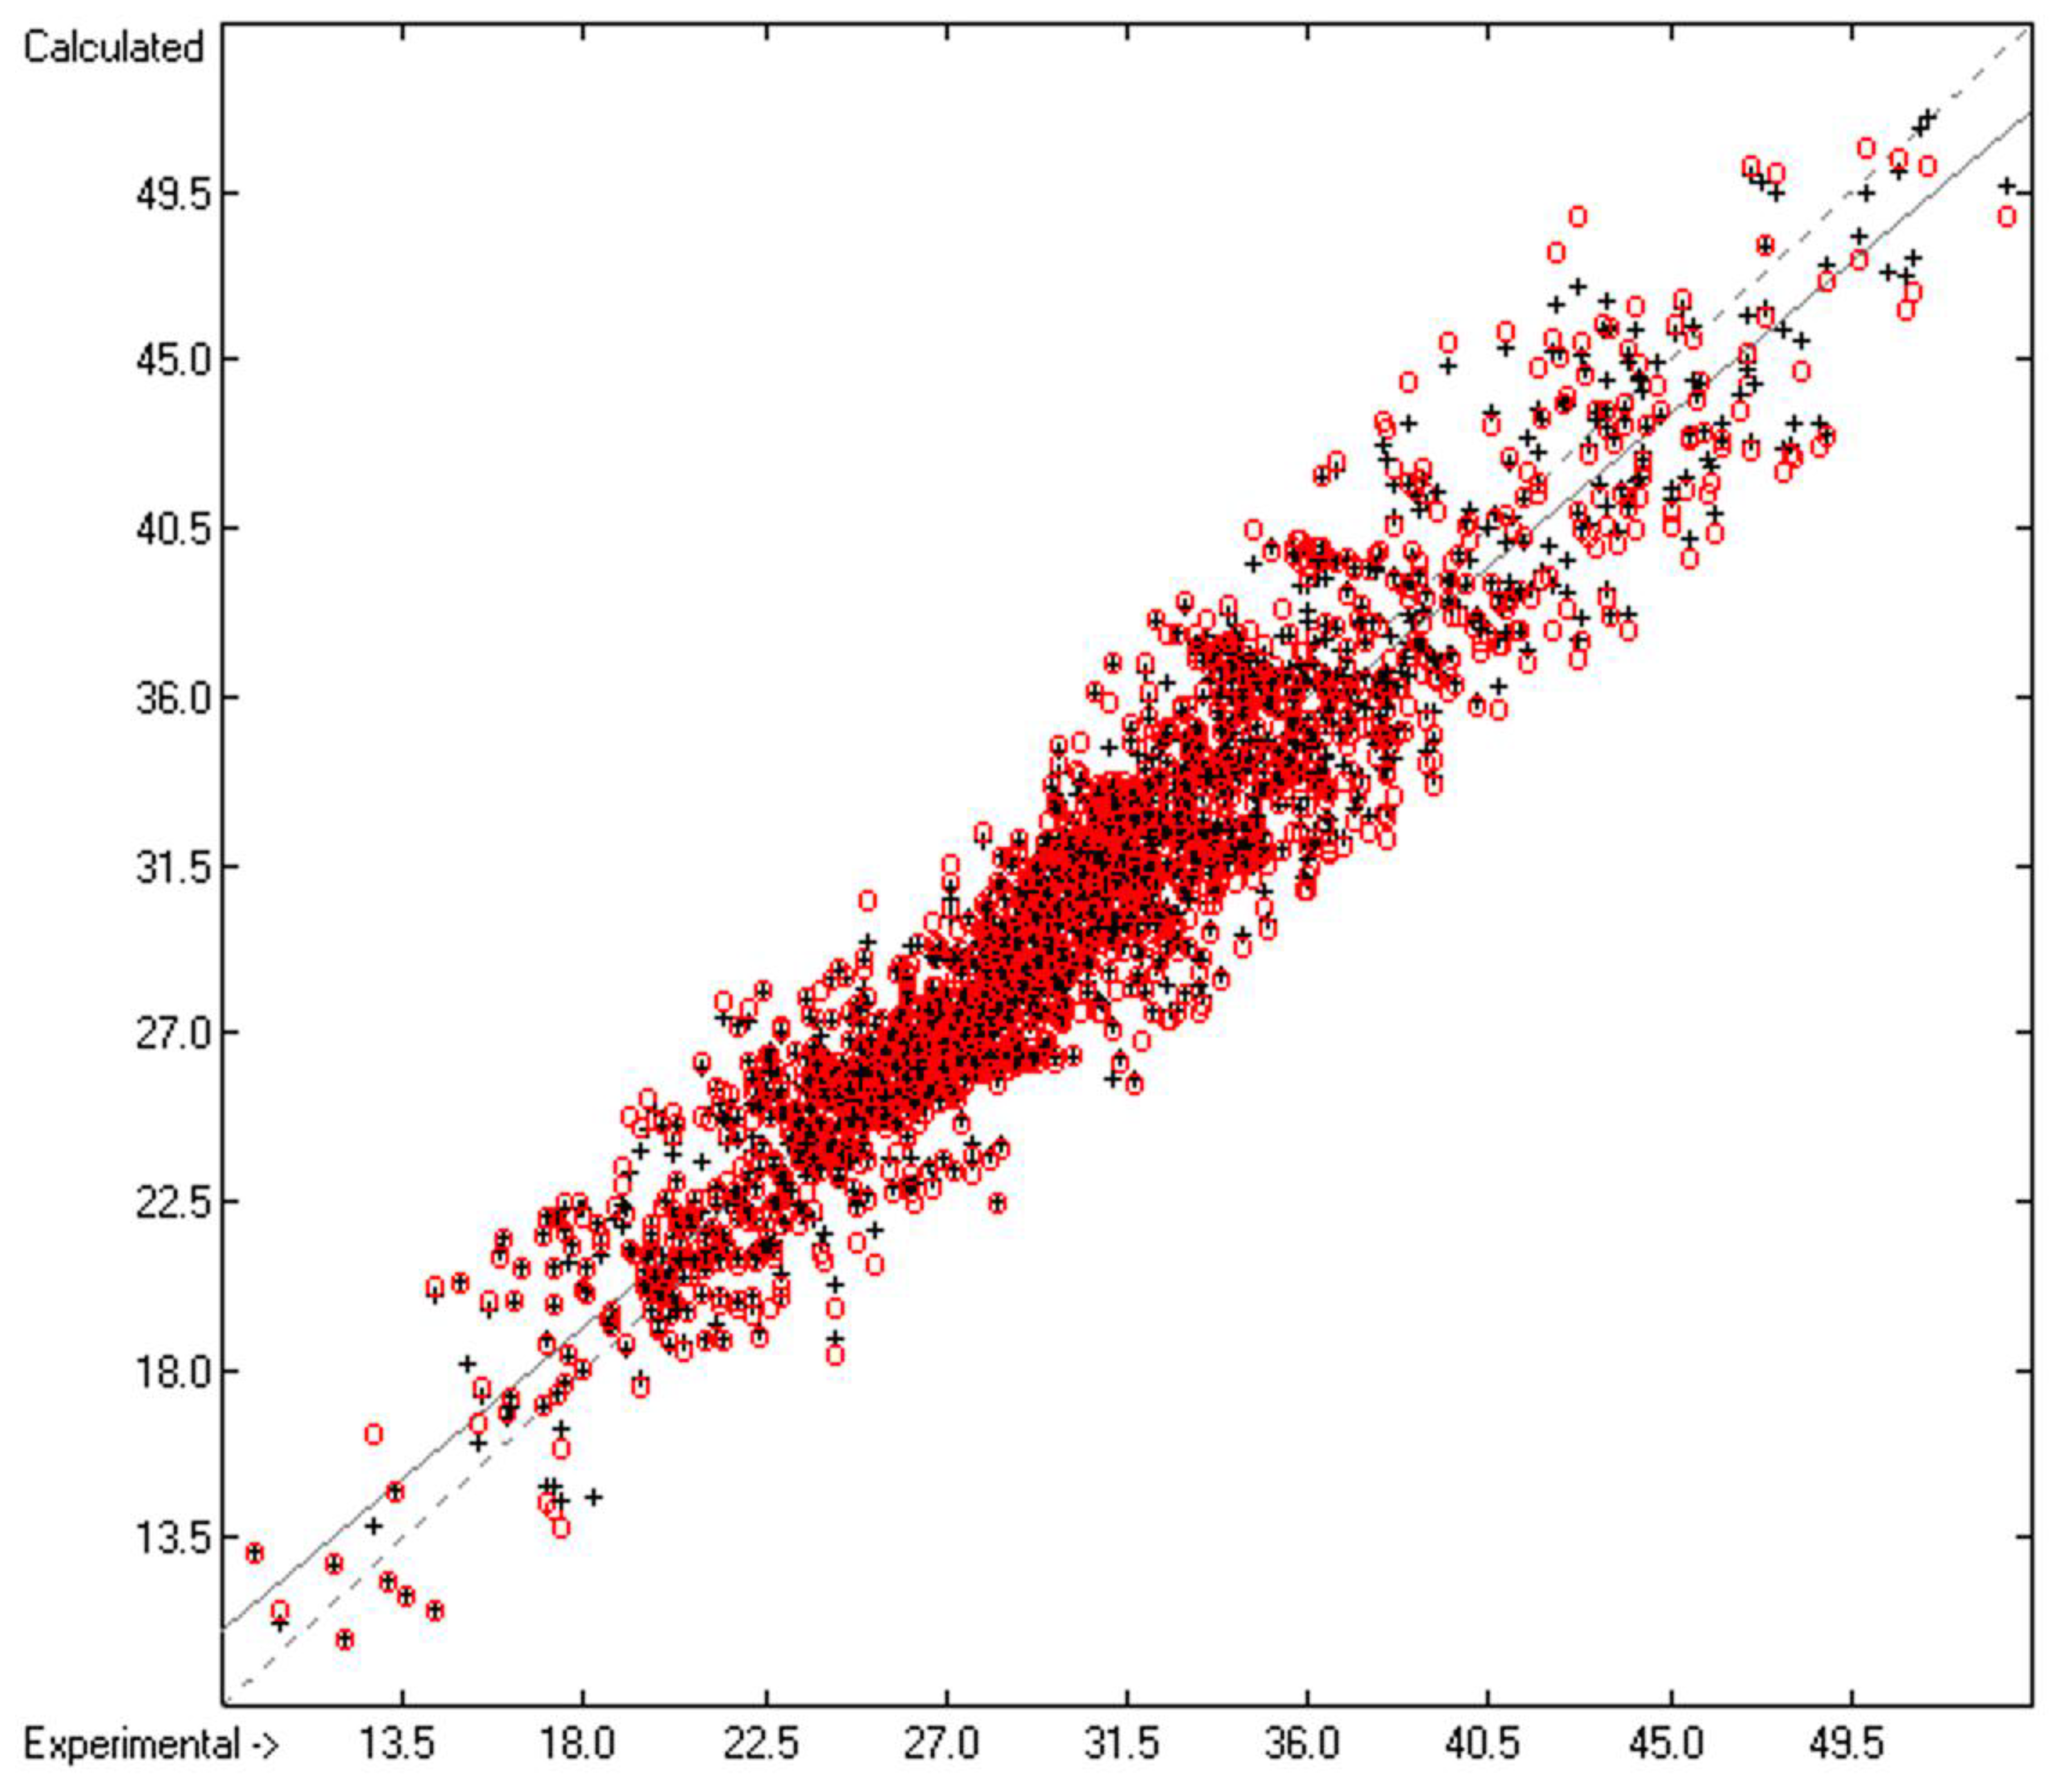
| B | Goodness of fit | R2 | 0.9039 | 1833 | |
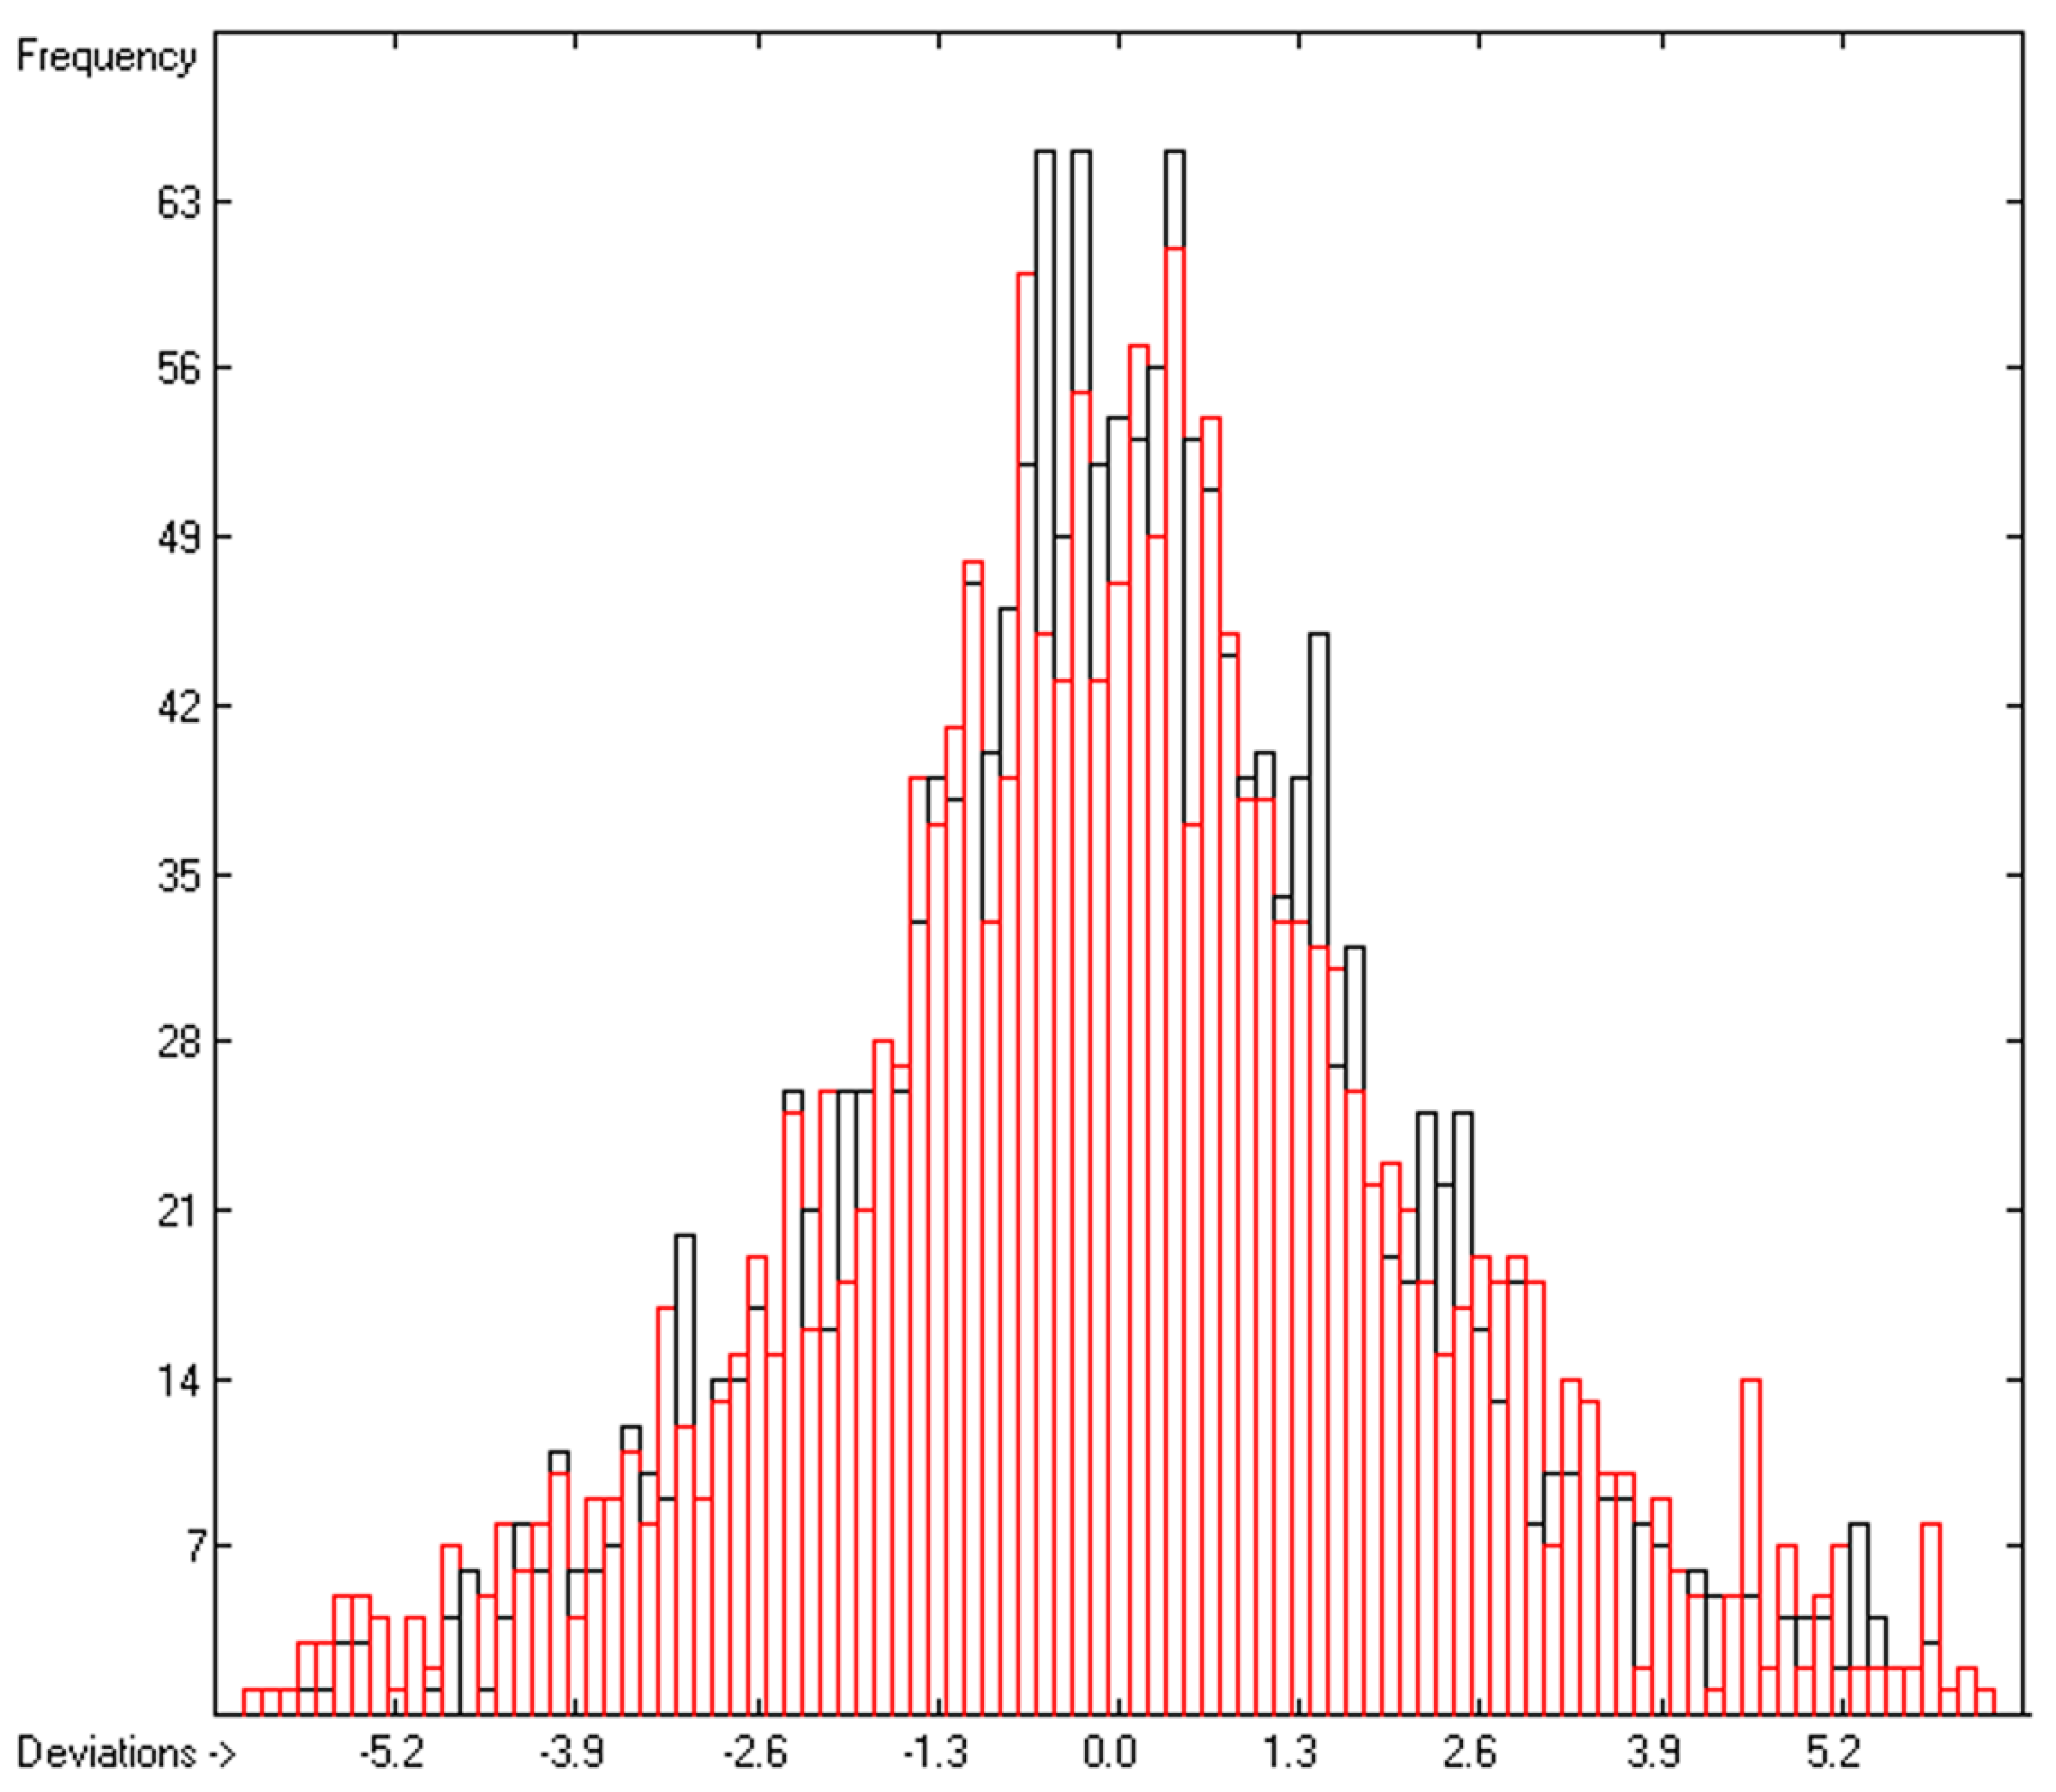
| C | Deviation | Average | 1.53 | 1833 | |
| D | Deviation | Standard | 1.99 | 1833 | |
| E | K-fold cv | K | 10 | 1769 | |
| F | Goodness of fit | Q2 | 0.8823 | 1769 | |
| G | Deviation | Average (cv) | 1.66 | 1769 | |
| H | Deviation | Standard (cv) | 2.16 | 1769 |
© 2018 by the authors. Licensee MDPI, Basel, Switzerland. This article is an open access article distributed under the terms and conditions of the Creative Commons Attribution (CC BY) license (http://creativecommons.org/licenses/by/4.0/).
Share and Cite
Naef, R.; Acree, W.E. Calculation of the Surface Tension of Ordinary Organic and Ionic Liquids by Means of a Generally Applicable Computer Algorithm Based on the Group-Additivity Method. Molecules 2018, 23, 1224. https://doi.org/10.3390/molecules23051224
Naef R, Acree WE. Calculation of the Surface Tension of Ordinary Organic and Ionic Liquids by Means of a Generally Applicable Computer Algorithm Based on the Group-Additivity Method. Molecules. 2018; 23(5):1224. https://doi.org/10.3390/molecules23051224
Chicago/Turabian StyleNaef, Rudolf, and William E. Acree. 2018. "Calculation of the Surface Tension of Ordinary Organic and Ionic Liquids by Means of a Generally Applicable Computer Algorithm Based on the Group-Additivity Method" Molecules 23, no. 5: 1224. https://doi.org/10.3390/molecules23051224