3.1. Total Phenolic, Flavonoid and Proanthocyanidins Contents
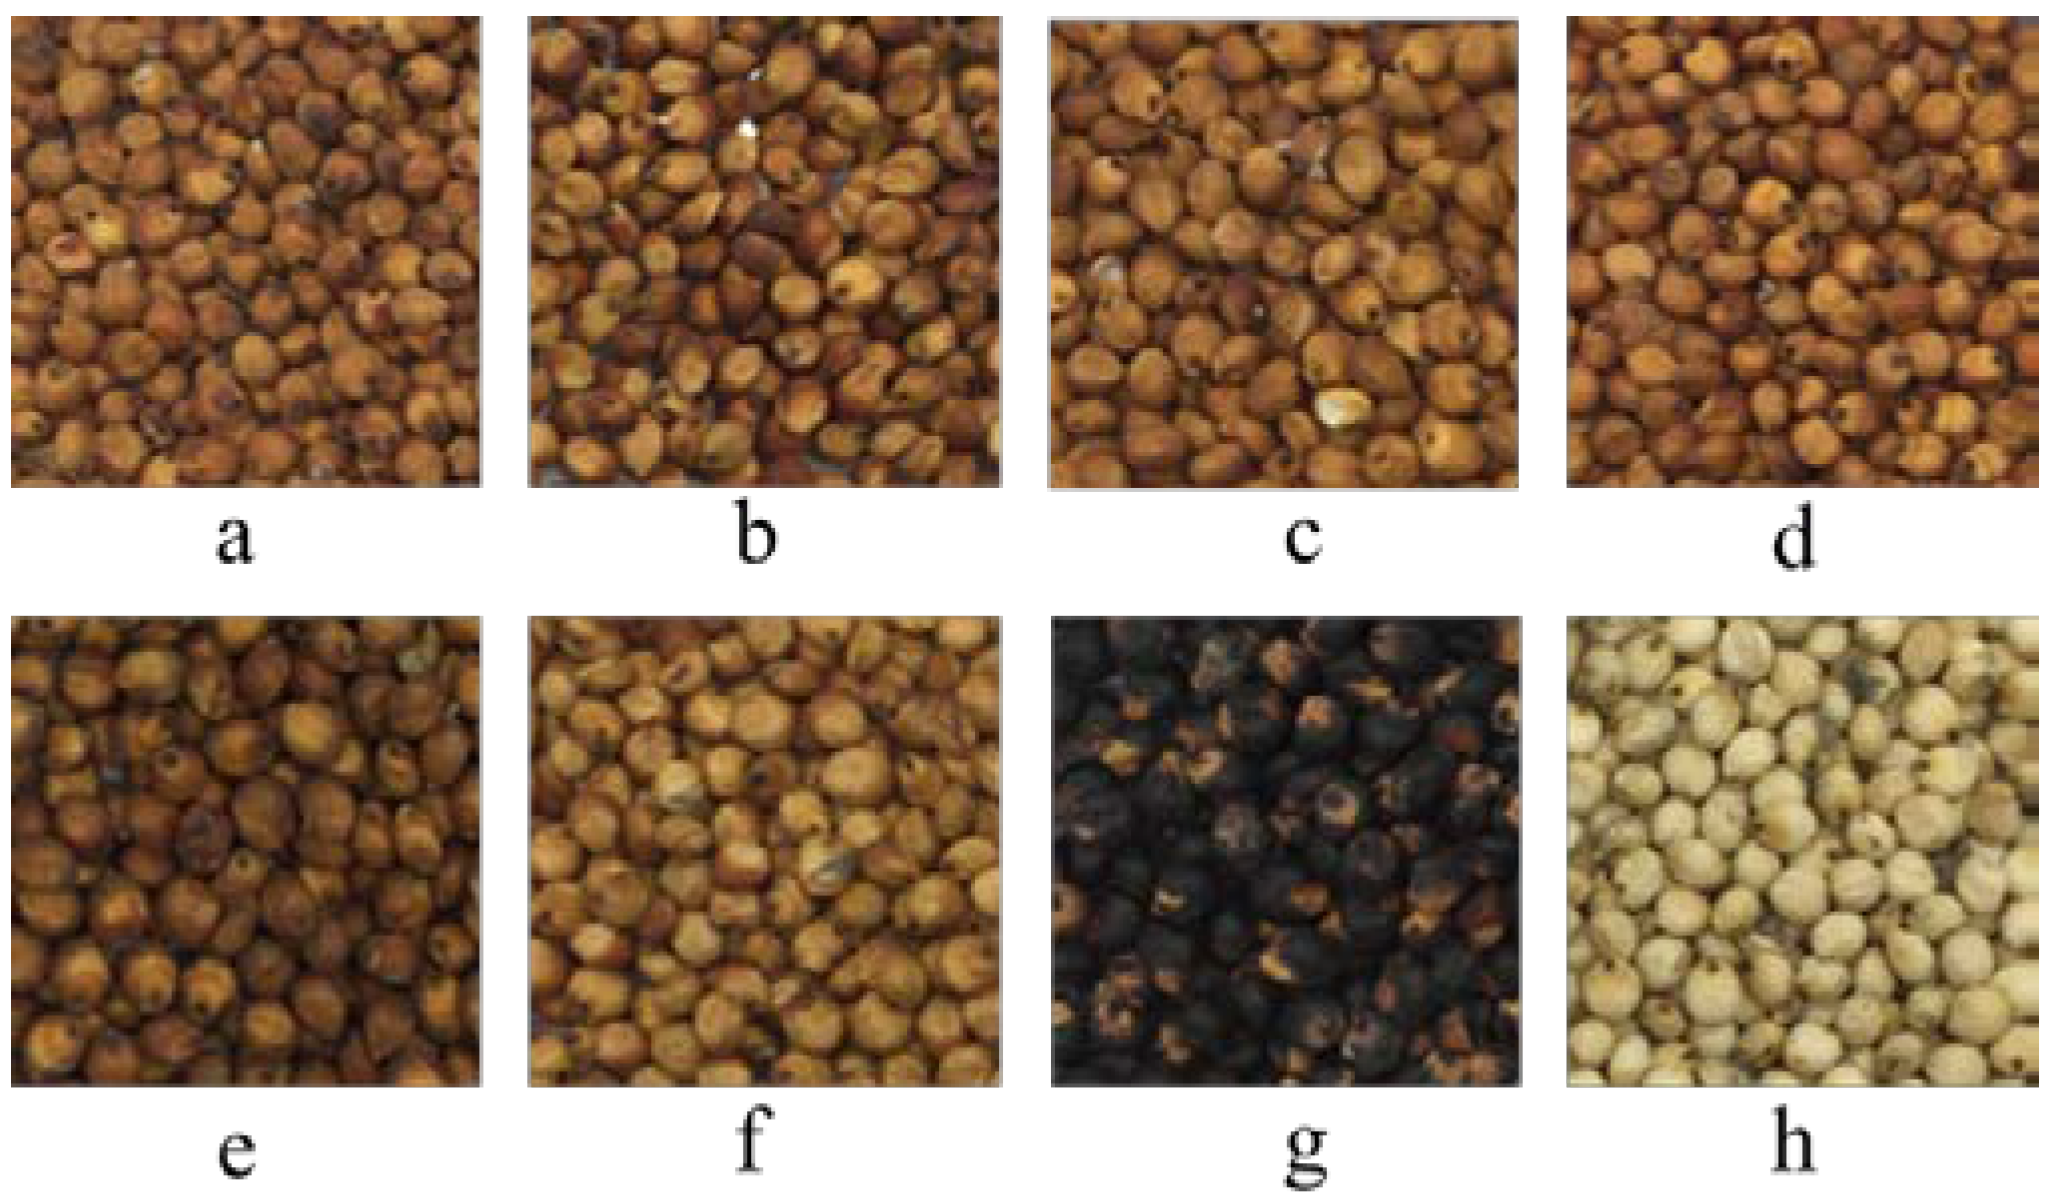
Free, bound and total phenolic, flavonoid and proanthocyanidin contents, as well as their percentage contribution to the total of eight varieties of sorghum grains (S-1 to S-8, specific information of them were shown in
Section 2.1) are summarized in
Table 2. On the whole, brewing sorghum grains except S-4 showed higher phenolic compounds than other varieties, while the white grain sorghum, S-8, showed the lowest contents of all.
The TPC showed obvious variations among different varieties ranging from 174.40 ± 4.09 to 1238.83 ± 31.67 mg GAE/100 g grain (Total, DW). Among all the brewing sorghum varieties, S-1 had the highest TPC, followed by S-3 while S-4 had the lowest. The two seed-reserved sorghums contained moderate TPC (559.50 ± 50.39 and 640.67 ± 54.87 mg GAE/100 g grain, DW) compared with other varieties. The grain color is one of the reason that results in the TPC differences among these varieties, however the variation in brewing sorghum grains may come from other reasons, such as the strain and growing environment [
5]. S-1 and S-2 were close relatives which were grown at the north of Guizhou Province while S-3 was grown at Dongbei and S-4 was grown at Jiangsu Province. So, S-1 may be a high-quality variety that contains high levels of TPC. In addition, we found that the TPC of free fractions were considerably higher than their corresponding bound fractions. Especially in S-8, free phenolic contents contributed to the total phenolics at 98.07%. However, the results conducted by Wu G and co-investigators [
17] showed that there were no significant differences between free and bound total phenolics in three red pericarp sorghum genotypes. It has also been reported that a high proportion of bound phenolics were presented in cereals [
8]. These variations might be mostly due to differences in species and varieties, or growth conditions as Wu G and co-investigators [
17] discovered that total phenolics changed significantly under two irrigation treatments. Evaluation methods may also be a vital impact factor, especially the various solvents for extraction. We used 80% chilled ethanol as solvent to extract phenolics [
8], considering its safety, while methanol was used by others [
17,
18].
TFC of eight sorghum grains ranged from 11.72 ± 1.69 to 61.10 ± 5.46 mg RE/100 g grain (total, DW). S-1 showed the highest TFC, S-4 and S-5 exhibited relatively high TFC while S-8 showed the lowest TFC, and the other four varieties exhibited not significant differences. The present results were less than the reported levels in sorghums [
17] but it was very close to the result conducted by HPLC in this study (
Table 3). This might mainly be due to the differences of varieties and analytical methods. Many assays used the NaNO
2-Al
3+-NaOH method to determine the TFC [
17,
19]. However, after adding NaOH, blood red flocculent precipitate was found, which might be due to the formation of complex precipitates by proanthocyanidins with aluminum ions under alkaline environment [
20,
21]. Thus, the aluminum chloride method was chosen over the NaNO
2-Al
3+-NaOH method.
In this study, the levels of TPC in free fractions is considerably higher than its corresponding TFC. We determined the total proanthocyanidins contents (TPAC) in free fraction and found extremely high correlation between TPC and TPAC (
r = 0.991,
p < 0.01,
Figure 2). Therefore, proanthocyanidins may be the big fraction contributed to TPC.
3.2. HPLC and UPLC-QTOF/MS Analysis of Phenolic Compounds
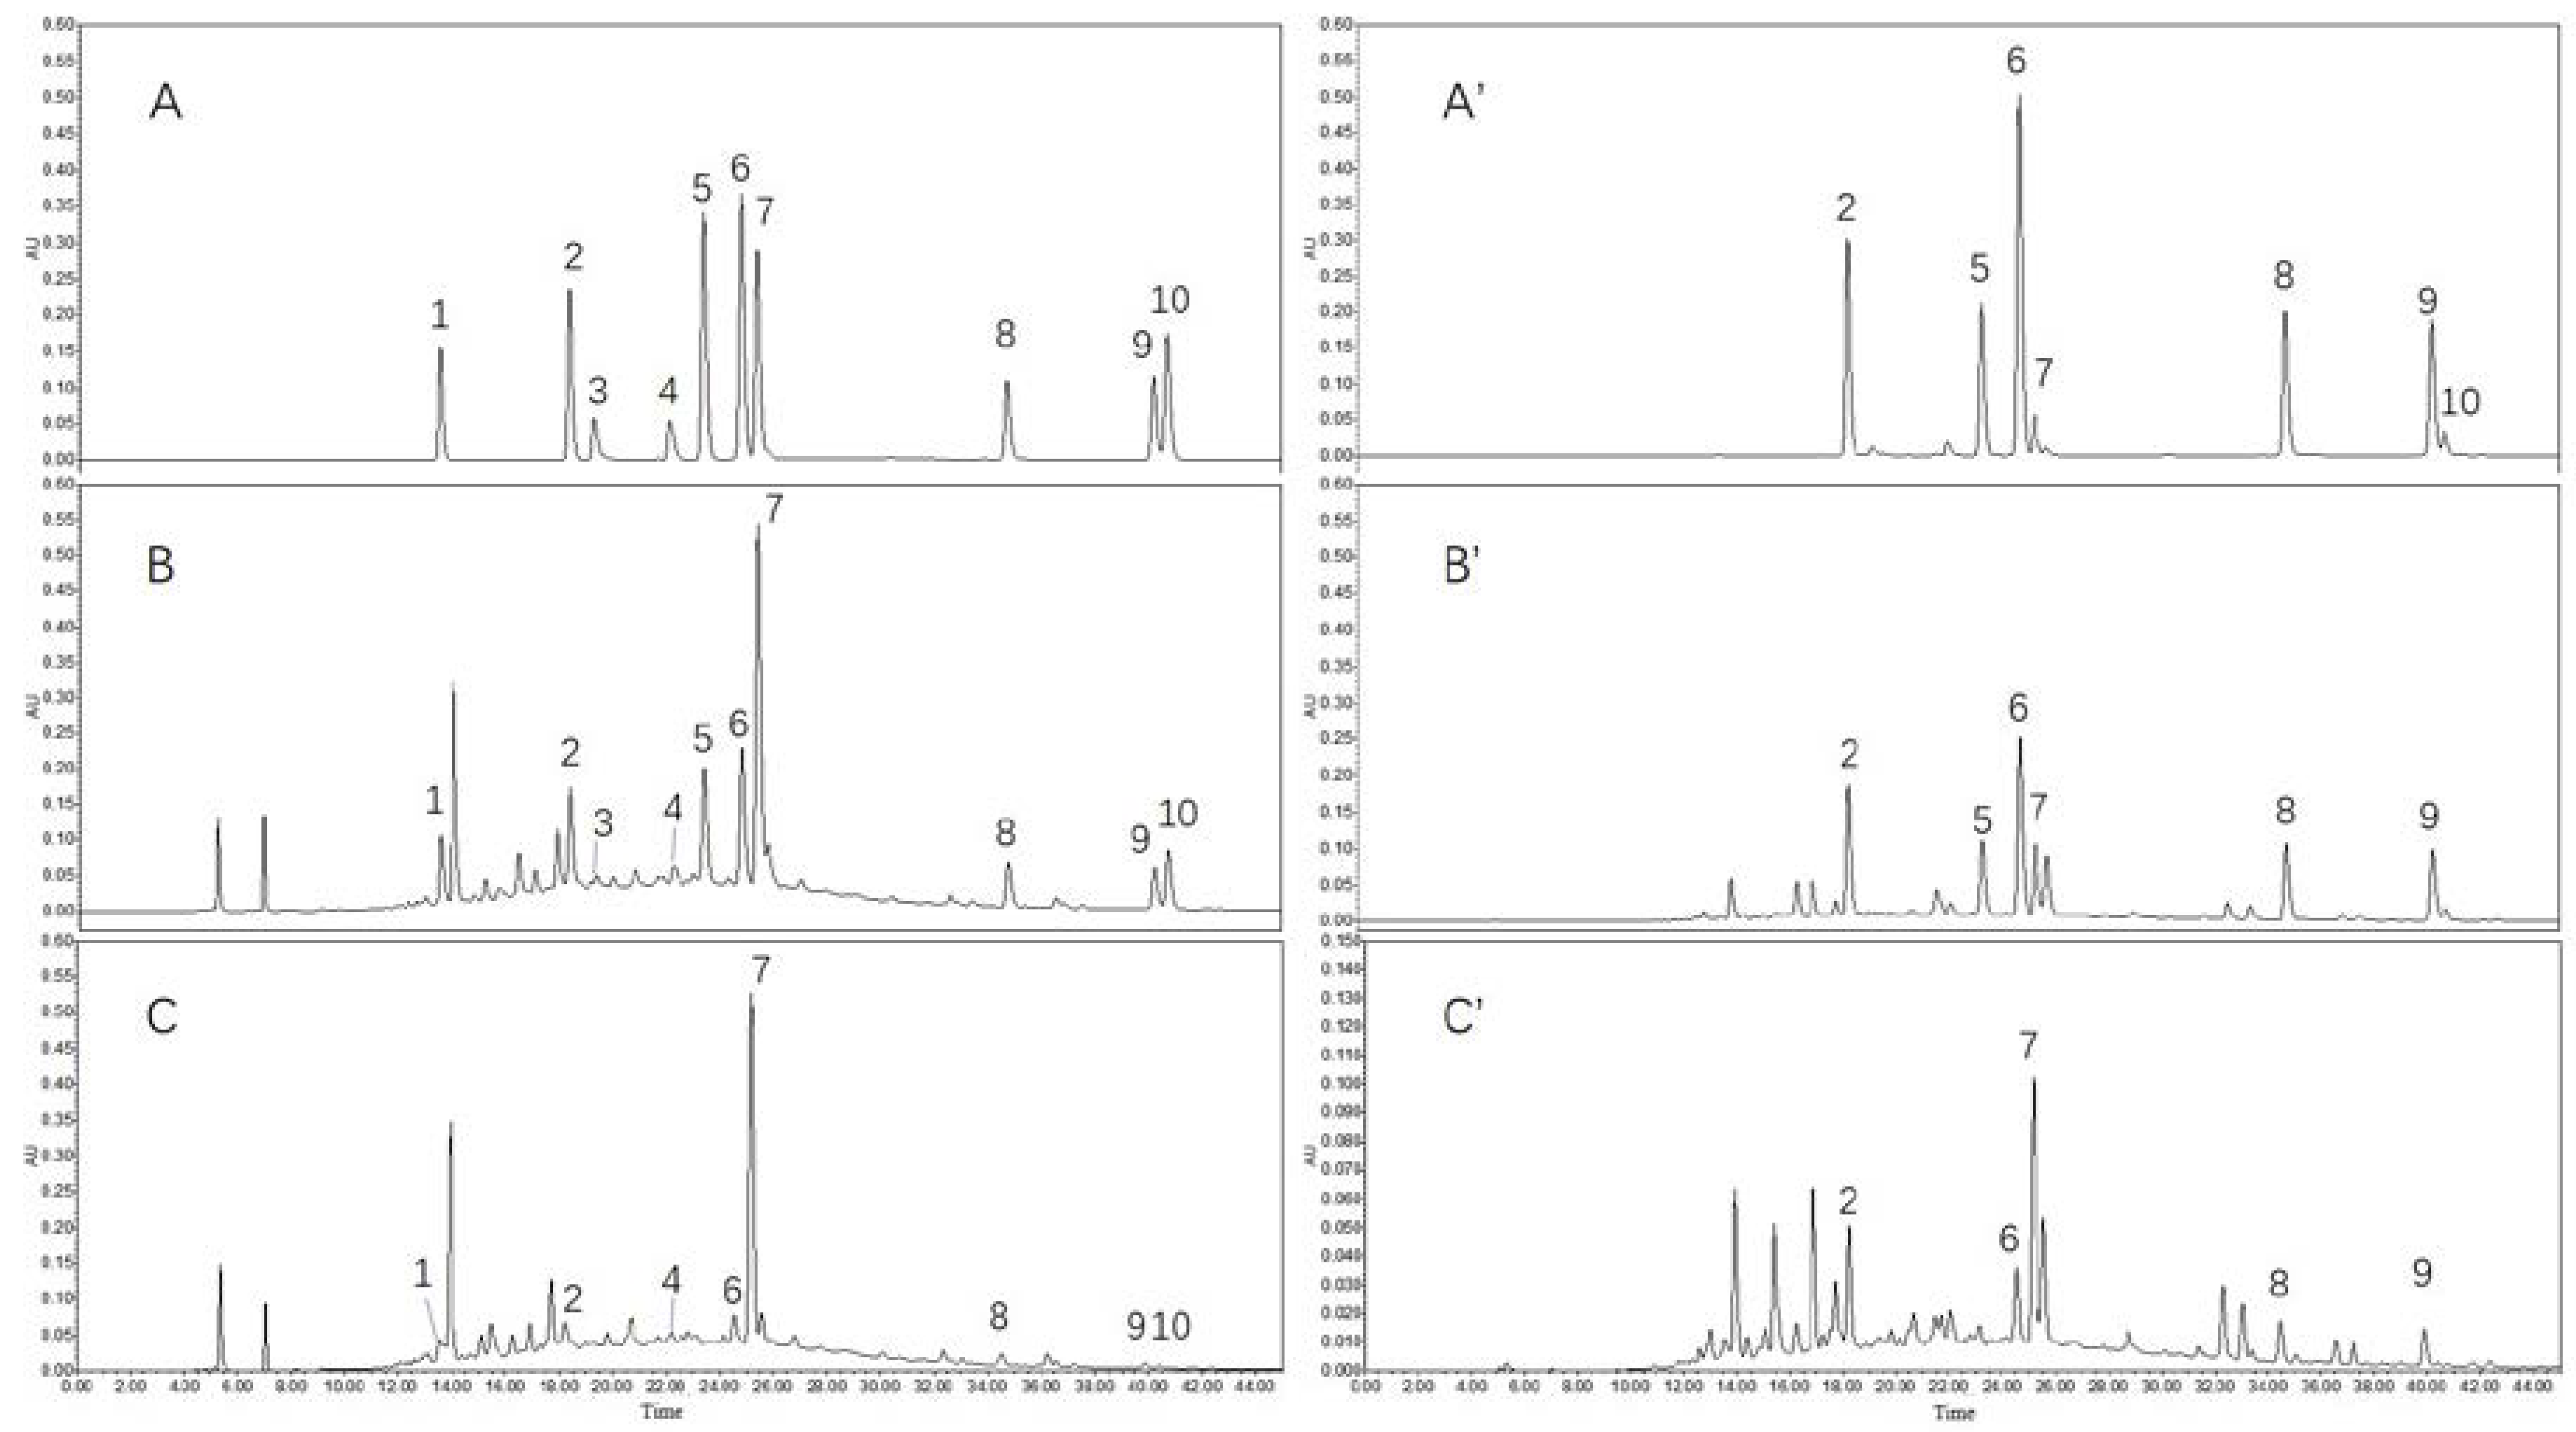
Ten phenolic compounds were separated via HPLC separation elution and MS ionization was operated in negative mode. The identification of compounds was based on accurate MS and MS/MS spectra and comparison with literature [
15]. The list of tentative identified compounds by RP-UHPLC-QTOF/MS is reported in
Table 4 in order of class. The MS/MS information of all the detected phenolic compounds were showed in the
Supplementary Materials. The UV absorption chromatograms were shown in
Figure 3 and the contents of the evaluated phenolic compounds were listed in
Table 3. All the standard phenolic compounds were individually tested through HPLC-DAD system at first by scanning between 200–400 nm. Therefore, protocatechuic acid,
p-coumaric acid, luteolinidin, apigeninidin, taxifolin and naringenin were detected and quantified in 288 nm; Caffeic acid, ferulic acid, luteolin and apigenin were detected and quantified in 360 nm.
All sorghums contain phenolic acids, which are located in the pericarp, testa, aleurone layer and endosperm [
5]. Phenolic acids consist of two classes: hydrobenzoic and hydrocinnamic acids. In the present study, four phenolic acids, namely caffeic acid,
p-coumaric acid, ferulic acid and protocatechuic acid were quantified in the free and bound extracts of the samples investigated.
Among four brewing sorghum grains and two seed-reserved sorghum grains, the contents of bound form phenolic acids were higher than the contents of their corresponding extractable fractions. However, in S-7, caffeic acid appeared relatively higher content in the free fraction of the phenolics. In S-8, there were no bound form caffeic acid or protocatechuic acid detected. Meanwhile, the contents of free form p-coumaric were higher than its bound form.
Ferulic acid has been reported as the most abundant bound phenolic compound in sorghum [
22] and other cereals [
8]. The contents of ferulic acid in bound fractions in the investigated sorghum grains also showed the highest level compared to other phenolic acids, accounted for over 60% of the total identified phenolic acids and ranged from 1.55 ± 0.11 to 85.98 ± 2.72 mg/100 g grain (DW). In the present study, the concentration of ferulic acid in S-7 was higher than the reported levels in sorghum grains, oat, rice, wheat and barley [
8,
17,
23].
Total concentration of caffeic acid varied from 3.49 ± 0.13 to 8.17 ± 0.20 mg/100 g grain (DW), lowest in S-8 and highest in S-1. In S-8, caffeic acid was only detected in free fraction of phenolics. Similar levels were reported before in other varieties of sorghums [
15,
17,
22].
The contents of
p-coumaric acid and protocatechuic acid ranged from 1.51 ± 0.05 to 8.17 ± 0.28 mg/100 g grain (DW) and 0.57 ± 0.06 to 11.87 ± 0.03 mg/100 g grain (DW) in each total concentration, respectively. Protocatechuic acid was the only benzoic acid derivative in the studied sorghum varieties and S-1 showed the highest concentration in both free and bound fraction of phenolics. These two phenolic acids were not distinct in some sorghum varieties [
17,
22,
24], but they showed abundant concentration in the samples investigated.
Sorghum contained a wide range of flavonoid compounds, and in this study, a total of six flavonoids were quantified, including two 3-deoxyanthocyanidins, two flavones, one dihydroflavonol and one flavanone.
The most common anthocyanins in sorghum are the 3-deoxyanthocyanidins, which include luteolinidin and apigeninidin. These anthocyanins have a small distribution in nature and are special for their lacking of a hydroxyl group at the C-3 position and exist in nature substantially as aglycones [
25]. The contents of apigeninidin among all detected sorghum grains were higher than the content of luteolinidin. Brewing sorghum grains and seed-reserved sorghum grains both had high levels of apigeninidin, with the total content ranging from 2.89 ± 0.12 to 4.77 ± 0.29 mg/100g grain (DW). It is reported that sorghums with a black pericarp have the highest levels of 3-deoxyanthocyanidins, which are concentrated in the bran [
26]. However, in the investigated black grain sorghum (S-7), the total contents of 3-deoxyanthocyanidins were less than other six red/brown grain sorghums except S-8, which was white grain sorghum. Therefore, the contents of 3-deoxyanthocyanidins in sorghum grains differ from the rule in bran.
Luteolin and apigenin were the two flavones identified in this study. The flavones content in free and bound fractions varied. Only in S-8, free form flavones showed high contents than their bound form. Among all varieties, S-7 had the highest contents of total luteolin with 4.98 ± 0.07 mg/100 g grain (DW) while S-8 had the highest contents of total apigenin with 3.97 ± 0.31 mg/100 g grain (DW). Among four brewing sorghum grains, S-1 showed the relatively high contents of flavones.
Taxifolin was the unique dihydroflavonol detected in the investigated sorghums, which was also the main flavonoid existed in brewing sorghum and seed-reserved sorghum grains. The contents of total taxifolin of above sorghum varieties ranged from 1.37 ± 0.01 to 44.62 ± 2.37 mg/100 g grain (DW), highest in S-1 and lowest in S-4, which accounted for 88% and 26% of the total content of the flavonoids investigated, respectively. And the contents in free fractions were much higher than contents in corresponding bound fractions except S-4. In addition, the content of free forms of taxifolin was extremely high in S-1, which may be a reason causing its specialty from other brewing sorghums.
The flavanone naringenin was analyzed in this study. Naringenin was mainly detected in free forms, the concentration of which ranged from ND to 1.18 mg/100 g grain (DW). There was no free form naringenin detected in S-2, S-3, S-5, S-7 and S-8. And in S-7, no bound form naringenin was detected, either.
3.3. Antioxidant Capacities and Their Correlation with Phenolic Compounds
Antioxidants are widely acknowledged for their inhibition or delay to the oxidation of an oxidizable substrate in a chain reaction, which would be very important in the prevention of various physiological and pathological abnormalities, such as inflammation, cardiovascular diseases and ageing [
27]. Therefore, antioxidant capacity of sorghum grains with different applications was determined and two methods were used with different principles, including the DPPH assay and the FRAP assay. DPPH is a stable free radical and will accept an electron or a hydrogen atom when free radical scavenger exists, which will result a color change [
28]. FRAP assay assesses the antioxidant power by a reduction from ferric to ferrous ion at low pH and causes a colored ferrous-tripyridyltriazine complex to form [
29]. All values of free, bound and total phenolic fractions were expressed as milligrams of vitamin C equivalent per gram of grains and were shown in
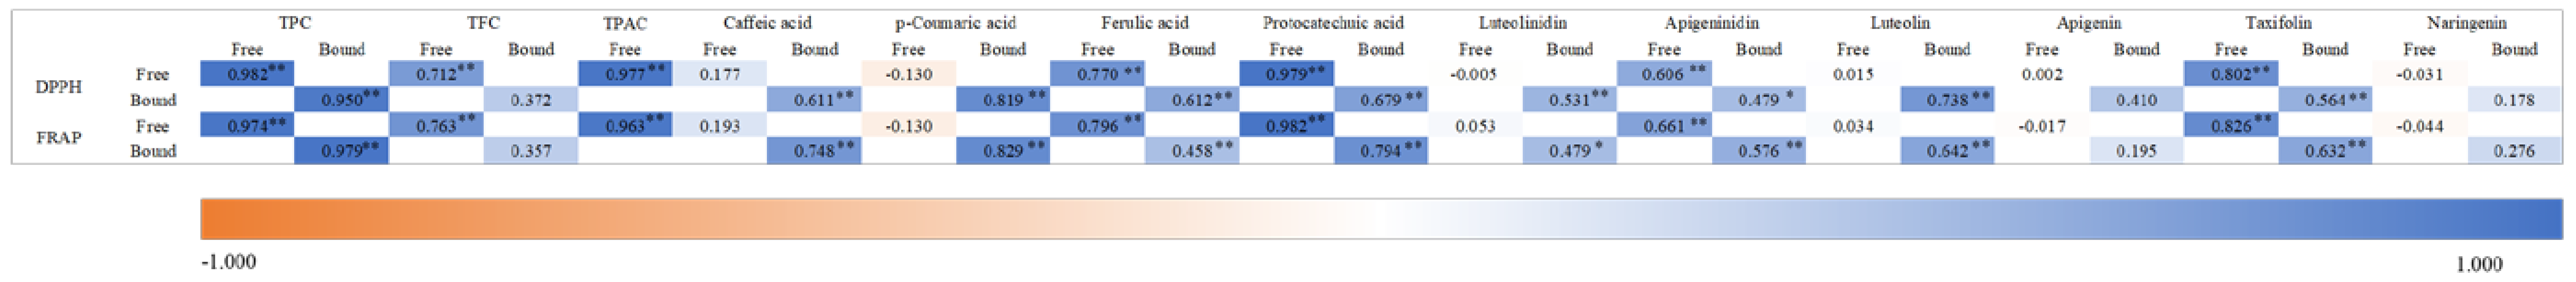
Table 5. The correlations between antioxidant capacities and phenolic compounds were shown in
Figure 2. The antioxidant capacity of free fractions among all varieties showed significant differences (
p < 0.05), ranged from 0.90 ± 0.01 to 18.43 ± 0.88 mg/g VcE (DW) and 2.02 ± 0.05 to 11.66 ± 0.39 mg/g VcE (DW) by the DPPH and FRAP assay, respectively. On the whole, S-1 showed the strongest antioxidant activity, followed by S-3 and weakest in S-8.
The values of in vitro antioxidant properties had strong correlation with the total phenolics of free and bound fractions (
r > 0.95,
p < 0.01), which may be caused by the condensed tannins detected in the investigated sorghums (
r > 0.96,
p < 0.01) [
30]. However, the correlation between TFC and antioxidant capacity was not so strong, which may be caused by the flavonoids in sorghum grains, especially apigenin and naringenin (
r < 0.5) with one hydroxyl group in the B ring [
31,
32].
Among all the individual phenolic compounds detected, free fractions of protocatechuic acid and taxifolin had considerably strong correlation with in vitro antioxidant properties, which may explain the highest antioxidant capacity in S-1. It was reported that taxifolin played a special role in maintaining normal functions of circulatory system because of its unique antioxidant activity [
33]. And protocatechuic acid was reported to exhibited dose-dependently antioxidant ability which may be closely correlated with various pharmacological effects [
34].


