Identifying Cancer Specific Driver Modules Using a Network-Based Method


School of Computer Science and Technology, Xidian University, Xi’an 710071, China
*
Author to whom correspondence should be addressed.
Molecules 2018, 23(5), 1114; https://doi.org/10.3390/molecules23051114
Submission received: 12 March 2018
/
Revised: 26 April 2018
/
Accepted: 7 May 2018
/
Published: 8 May 2018
Abstract
:Detecting driver modules is a key challenge for understanding the mechanisms of carcinogenesis at the pathway level. Identifying cancer specific driver modules is helpful for interpreting the different principles of different cancer types. However, most methods are proposed to identify driver modules in one cancer, but few methods are introduced to detect cancer specific driver modules. We propose a network-based method to detect cancer specific driver modules (CSDM) in a certain cancer type to other cancer types. We construct the specific network of a cancer by combining specific coverage and mutual exclusivity in all cancer types, to catch the specificity of the cancer at the pathway level. To illustrate the performance of the method, we apply CSDM on 12 TCGA cancer types. When we compare CSDM with SpeMDP and HotNet2 with regard to specific coverage and the enrichment of GO terms and KEGG pathways, CSDM is more accurate. We find that the specific driver modules of two different cancers have little overlap, which indicates that the driver modules detected by CSDM are specific. Finally, we also analyze three specific driver modules of BRCA, BLCA, and LAML intersecting with well-known pathways. The source code of CSDM is freely accessible at https://github.com/fengli28/CSDM.git.
1. Introduction
Cancer is considered as a complex disease driven by genome alterations that include gene mutations, copy number alterations, and so on [1,2]. A key challenge is to detect driver mutations, which contribute to the development of cancer, from passenger mutations, which are functionally neutral [3]. There are many frequency-based methods that have been proposed to detect significantly mutated genes or predict driver genes by estimating the background mutation rate, such as MuSiC [4], MutSigCV [5,6], ActiveDriver [7], OncodriveClust [8], OncodriveFM [9], OncodriveFML [10], TUSON [11], 20/20+ [12], and CompositeDriver [13]. Tokheim et al. [12] propose a machine learning-based method for driver gene prediction, and also establish an evaluation framework to compare the performance of eight prediction methods. They show that driver genes predicted by each of the eight methods vary widely, and most current methods do not fully consider the mutational heterogeneity [12]. Some other methods prioritize driver genes based on mutation data and functional networks [14,15] or matrix factorization framework [16,17,18,19,20]. However, these methods also do not consider the complicated mutational heterogeneity among patients [3,21,22,23]. Since the genes with driver mutations always work together in cellular signaling and regulatory pathways [21,24], detecting driver pathways, driver modules or driver gene sets, with genes possessing driver mutations, can consider this complicated mutational heterogeneity and provide an understanding of carcinogenesis at the pathway level.
There are mainly two classes of approaches which are proposed to detect driver pathways, driver modules, or driver gene sets: de novo identification approaches and prior knowledge-based methods [25,26]. De novo methods identify combinatorial patterns of cancer mutations without any prior knowledge but utilize two properties of a driver gene set: high coverage and high mutual exclusivity [27,28,29,30,31,32,33,34]. High coverage means that a driver gene set should cover a large number of samples. High mutual exclusivity means that a gene with a driver mutation involved in a pathway is enough to disturb this pathway [22,23]. For example, Dendrix [27] detects combinations of genes that have high coverage and high mutual exclusivity by solving a maximum coverage exclusive submatrix problem. MDPFinder [28], Multi-Dendrix [29], ComMDP, and SpeMDP [34] use integer linear program to solve the maximum coverage exclusive submatrix problem for identifying mutually exclusive sets of genes. Prior knowledge-based methods use the known interaction networks to identify significantly mutated subnetworks or driver modules with mutually exclusive mutated genes [35,36,37,38]. For example, MEMo [36] detects network cliques of mutated genes with mutually exclusive patterns across multiple patients. MEMCover [37] combines tissue type exclusivity with interaction data to detect mutually exclusive groups of mutated genes in the same or across different tissues. HotNet2 [38] utilizes insulated network diffusion to identify significantly mutated subnetworks, which captures the directionality of interactions.
However, different cancer types may have different principles at the pathway level, which is critical for personalized therapy and precision medicine in cancer treatment. Furthermore, several studies suggest there are differences between different cancer types. Bailey et al. [13] give a comprehensive analysis of oncogenic driver genes and mutations across 33 cancer types, and identify 299 cancer driver genes. They find that 142 genes are associated with a single cancer type, which is likely to be the specific genes, while 87 genes are associated with two or more cancer types. For example, TP53 is a tumor suppressor gene, and is associated with 27 cancer types, which is likely to be a common gene. Thus, different cancer types may have common driver genes and specific driver genes, while different genes may play different roles in different cancer types. Sanchez-Vega et al. [39] present an integrated analysis of genetic alterations in ten signaling pathways across 33 cancer types, which denotes that different cancer types have similarities and differences in frequencies of alteration of individual pathways. Thus, different cancer types may have different principles at the pathway level, which is critical for personalized therapy and precision medicine in cancer treatment [40,41]. Therefore, detecting the cancer specific driver modules, including specific genes, is important to understand the different mechanisms of different cancers at the pathway level. However, few methods are introduced to detect specific driver modules for a certain cancer to other cancer types. The specific driver modules for a certain cancer type to other cancer types are different from the driver modules detected in a single cancer type. The driver modules detected in a single cancer type always contain both specific and common parts. There are several methods for identifying specific modules or patterns in multiple cancers [42,43,44,45], but few methods are proposed to detect specific driver modules for a certain cancer type to other cancer types. SpeMDP is an optimization model to discover specific driver gene sets, de novo, of one certain or multiple cancer types, to other cancers with a fixed module size [34].
In this work, we propose a network-based method to detect cancer specific driver modules (CSDM), which can catch the specificity of a certain cancer type to other cancer types at the pathway level. A cancer specific driver module must have high coverage and high exclusivity in a certain cancer, and a higher percentage of samples in this cancer than other cancer types. We first construct the specific network for a certain cancer type by integrating specific coverage and mutual exclusivity in all cancer types. Then, we use a greedy algorithm to detect all of the specific driver modules in the specific network. We apply CSDM on 12 TCGA cancer types, and compare it with HotNet2 and SpeMDP on specific coverage and F-measure of GO and KEGG pathway enrichment. We also investigate the overlaps between the specific driver modules of every two different cancer types. Then, we also analyze three different cancer specific driver modules of three cancers, BRCA, BLCA, and LAML.
2. Results
In this section, we first compare CSDM with other two methods, HotNet2 and SpeMDP, based on 12 TCGA cancer types. These three methods are compared on their specific coverage and F-measure of pathway enrichment. Then, we analyze three specific driver modules of BLCA, BRCA, and LAML detected by our method based on 12 TCGA cancer types, respectively.
2.1. Comparison Study
We first compare CSDM with HotNet2 [38] and SpeMDP [34], based on 12 TCGA cancer types. HotNet2 is a famous method to identify significantly mutated subnetworks, and SpeMDP is an algorithm for identifying a certain or multiple cancer specific driver gene sets. CSDM detects the specific driver modules for a certain cancer type to other cancer types. We compare the results of these three methods with regard to their specific coverage and F-measure of pathway enrichment. First, we use the specific coverage to evaluate whether the driver modules are specific in a particular cancer. Then, we utilize the F-measure of Gene Ontology (GO) terms [46] and Kyoto Encyclopedia of Genes and Genomes (KEGG) [47] pathway enrichment, which are downloaded from Molecular Signatures Databases (MSigDB) [48,49], to evaluate the performance of methods.
2.1.1. Comparison of Specific Coverage
We compare CSDM, SpeMDP, and HotNet2 in their specific coverage, in Figure 1. Specific coverage is used to measure the specificity of the modules for a cancer type to other cancer types. Obviously, CSDM has significantly higher specific coverage than SpeMDP in seven cancer types, while it has similar specific coverage in other four cancers. Overall, CSDM has significantly higher specific coverage than HotNet2 in all cancer types. HotNet2 has the minimum specific coverage when compared with SpeMDP and CSDM in all cancer types. The main reason is that HotNet2 is a method for identifying significantly mutated subnetworks in a single cancer type, which may mix some specific and common modules. Therefore, it also explains the differences between the specific driver modules of a certain cancer to other cancer types, and the driver modules detected in a single cancer. In general, CSDM can detect cancer specific driver modules with higher specificity than HotNet2 and SpeMDP.
2.1.2. Comparison on Pathway Enrichment
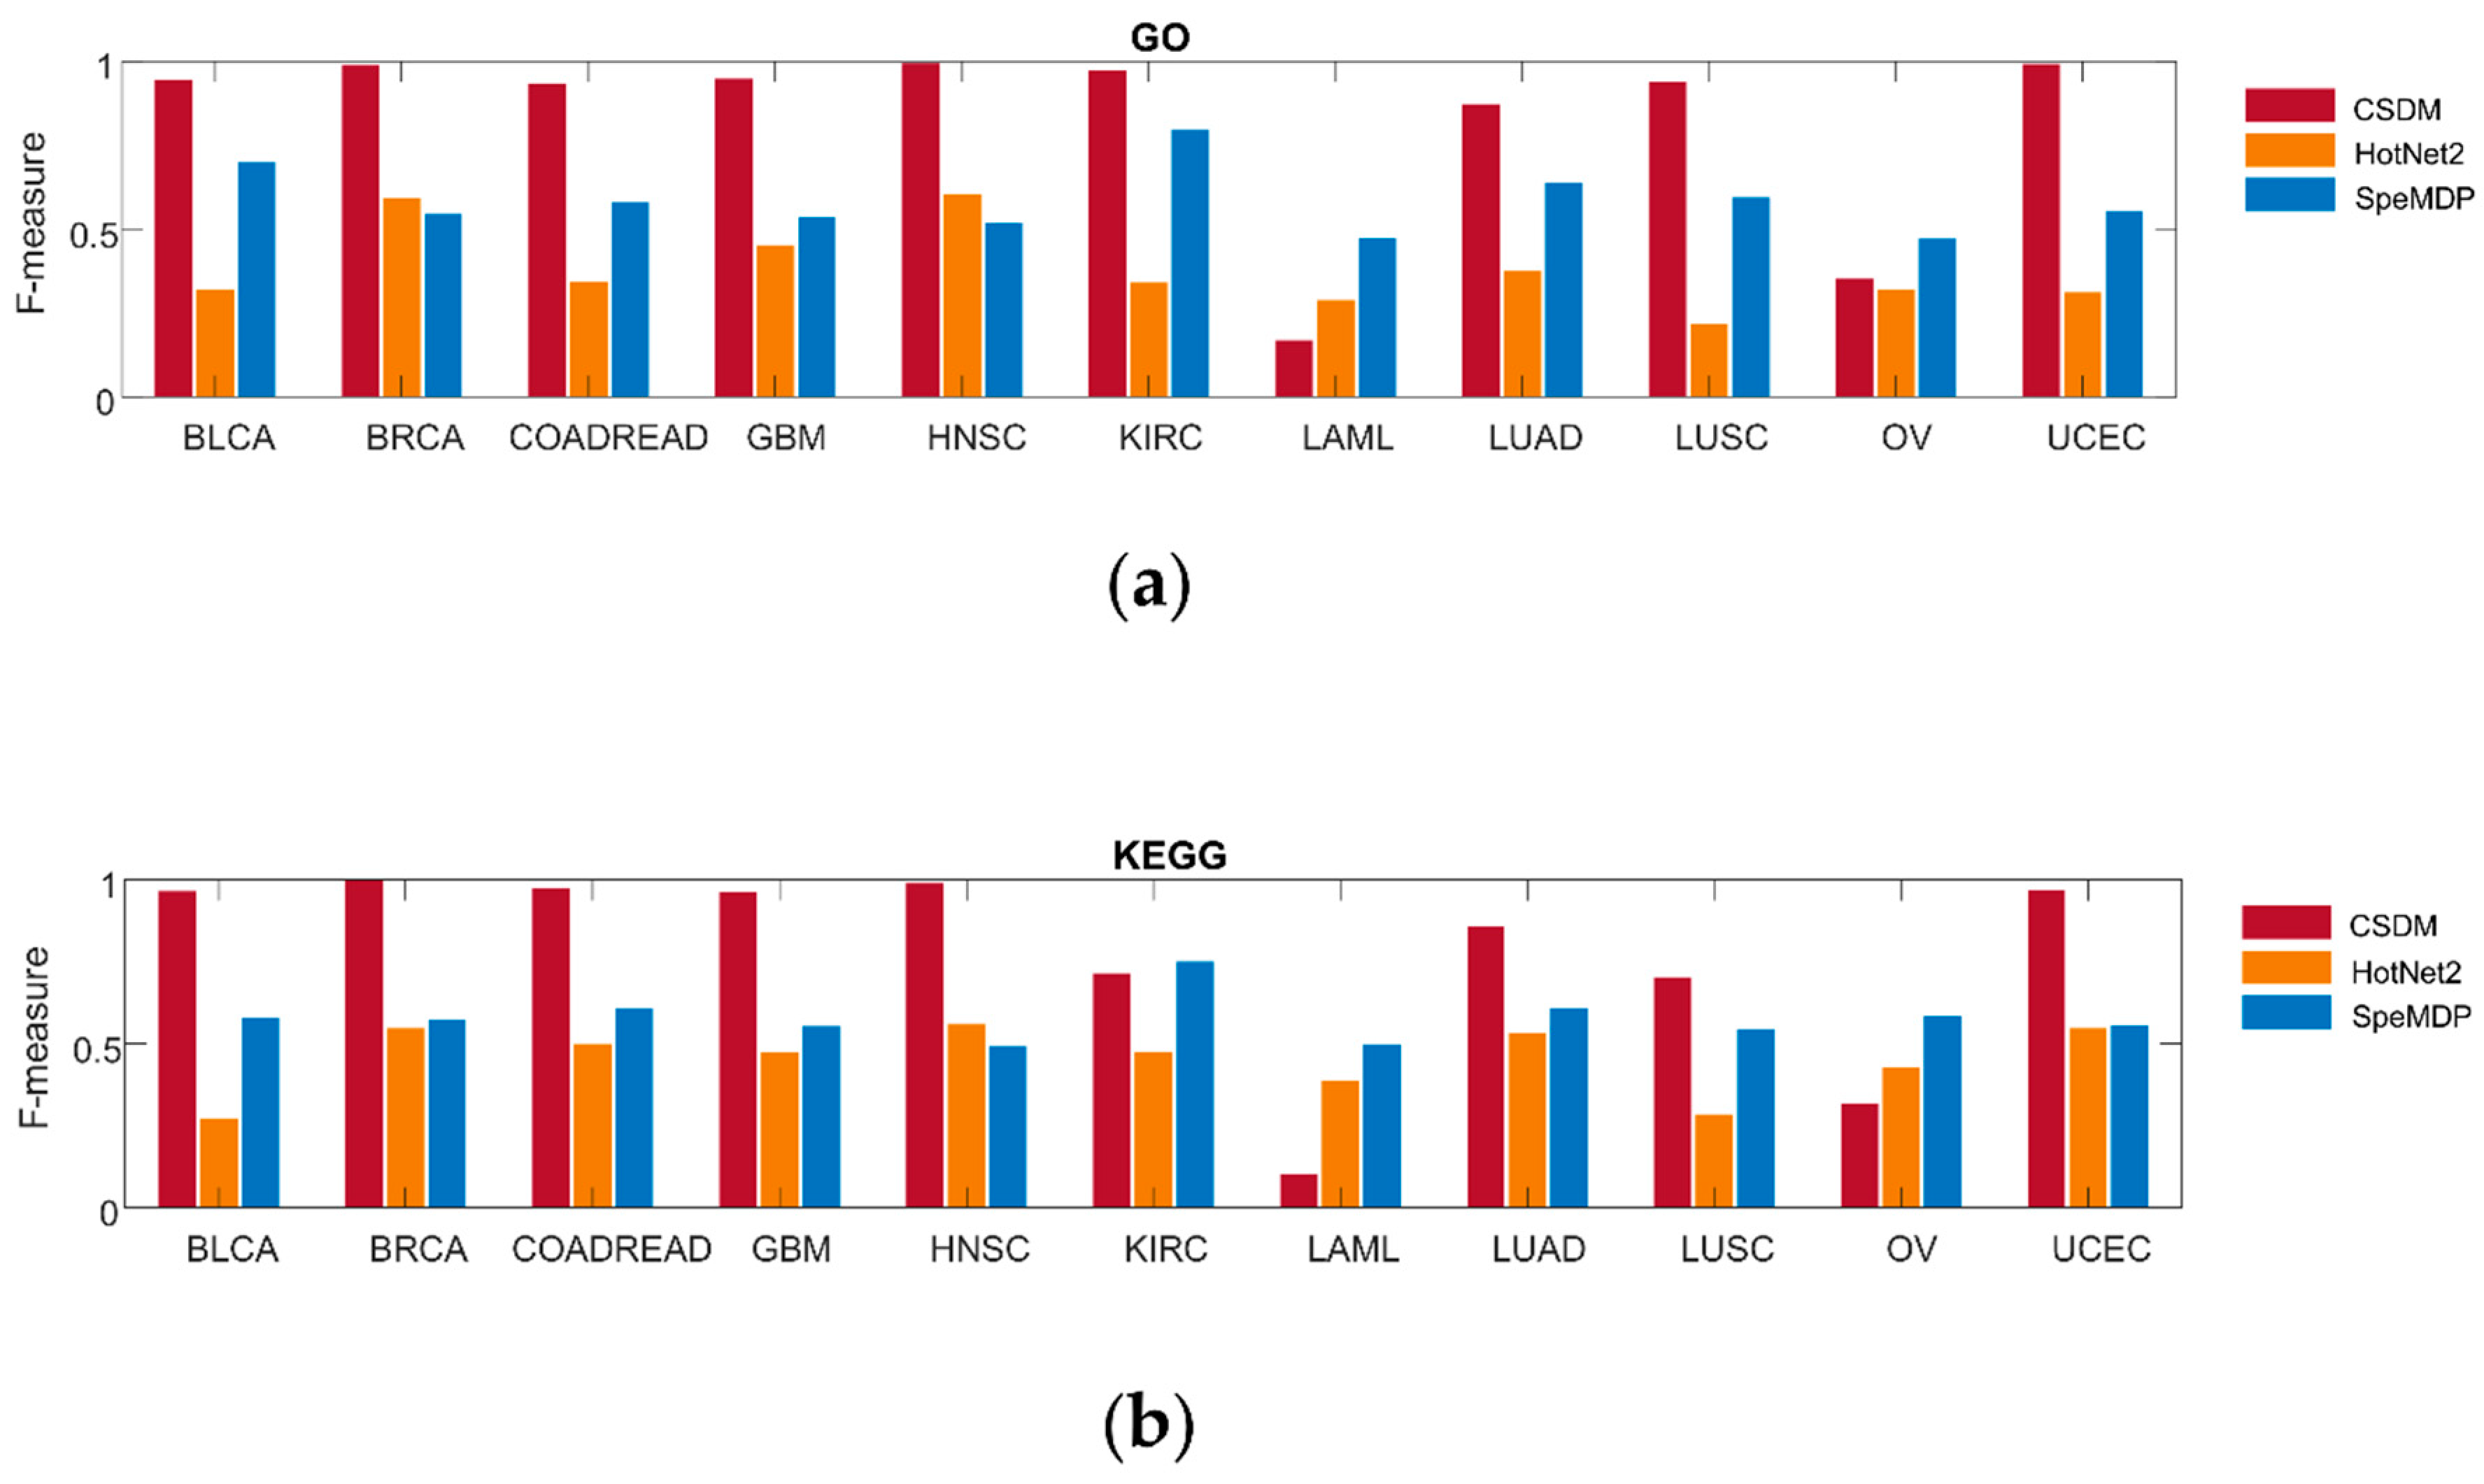
We also compare CSDM, SpeMDP, and HotNet2 on enrichment of GO terms and KEGG pathways in Figure 2. For the pathway enrichment, we use the Gene Set Enrichment Analysis (GSEA) [48] to obtain the significance p-value of a driver module based on the well-known pathway. If p-value < 0.05, this driver module is considered to be significant based on pathway enrichment. We use F-measure to represent the accuracy of the driver modules. F-measure is the harmonic mean of precision and recall. The higher the F-measure, the more the driver modules can be enriched to the known pathways. CSDM has a higher F-measure than SpeMDP and HotNet2 in nine cancer types when comparing enrichment of GO terms, while it has the higher F-measure than SpeMDP and HotNet2 in eight cancer types, when comparing enrichment of KEGG pathways. In general, CSDM has higher accuracy than HotNet2 and SpeMDP, based on pathway enrichment.
2.2. Overlaps between Different Cancer Types
We analyze the overlaps between the specific driver modules detected by CSDM in 12 different cancer types. In this work, we consider that two specific driver modules from two different cancers have overlaps if these two specific driver modules have at least one overlapping gene. Then, we use the Jaccard index to count the percentages of the combination of driver modules with overlaps from all possible combinations of two cancer types. Obviously, the driver modules of each combination of two different cancers have very little overlap (Supplemental Table S1), which indicates that the driver modules detected by CSDM are specific for a certain cancer type. We also use the Jaccard index to count the percentages of overlapped genes involved in driver modules between each combination of two cancer types. Obviously, the percentages of overlapped genes between different cancer types are always small (Supplemental Table S2), which indicates that the genes involved in driver modules detected by CSDM often present in a certain cancer type.
2.3. Specific Driver Modules in BRCA, BLCA, and LAML
We analyze three cancer specific driver modules detected by CSDM in BRCA, BLCA, and LAML among 12 TCGA cancer types, respectively. The reasons for choosing these three cancers are that BRCA has the maximum number of samples, BLCA has the minimum number of samples, and LAML is the only liquid cancer in all 12 cancer types.
2.3.1. Specific Driver Modules in BRCA
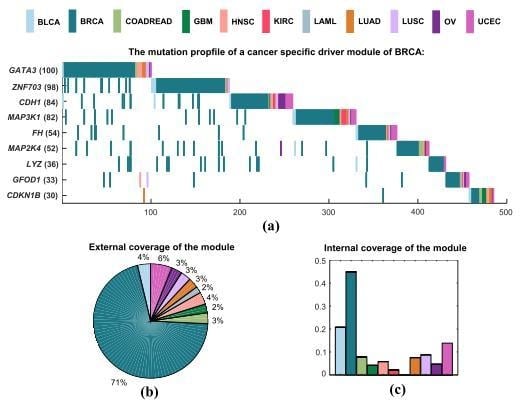
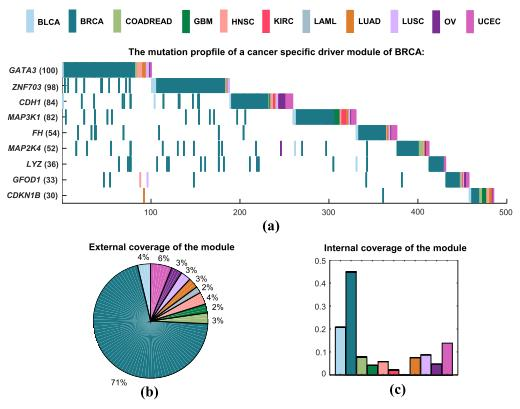
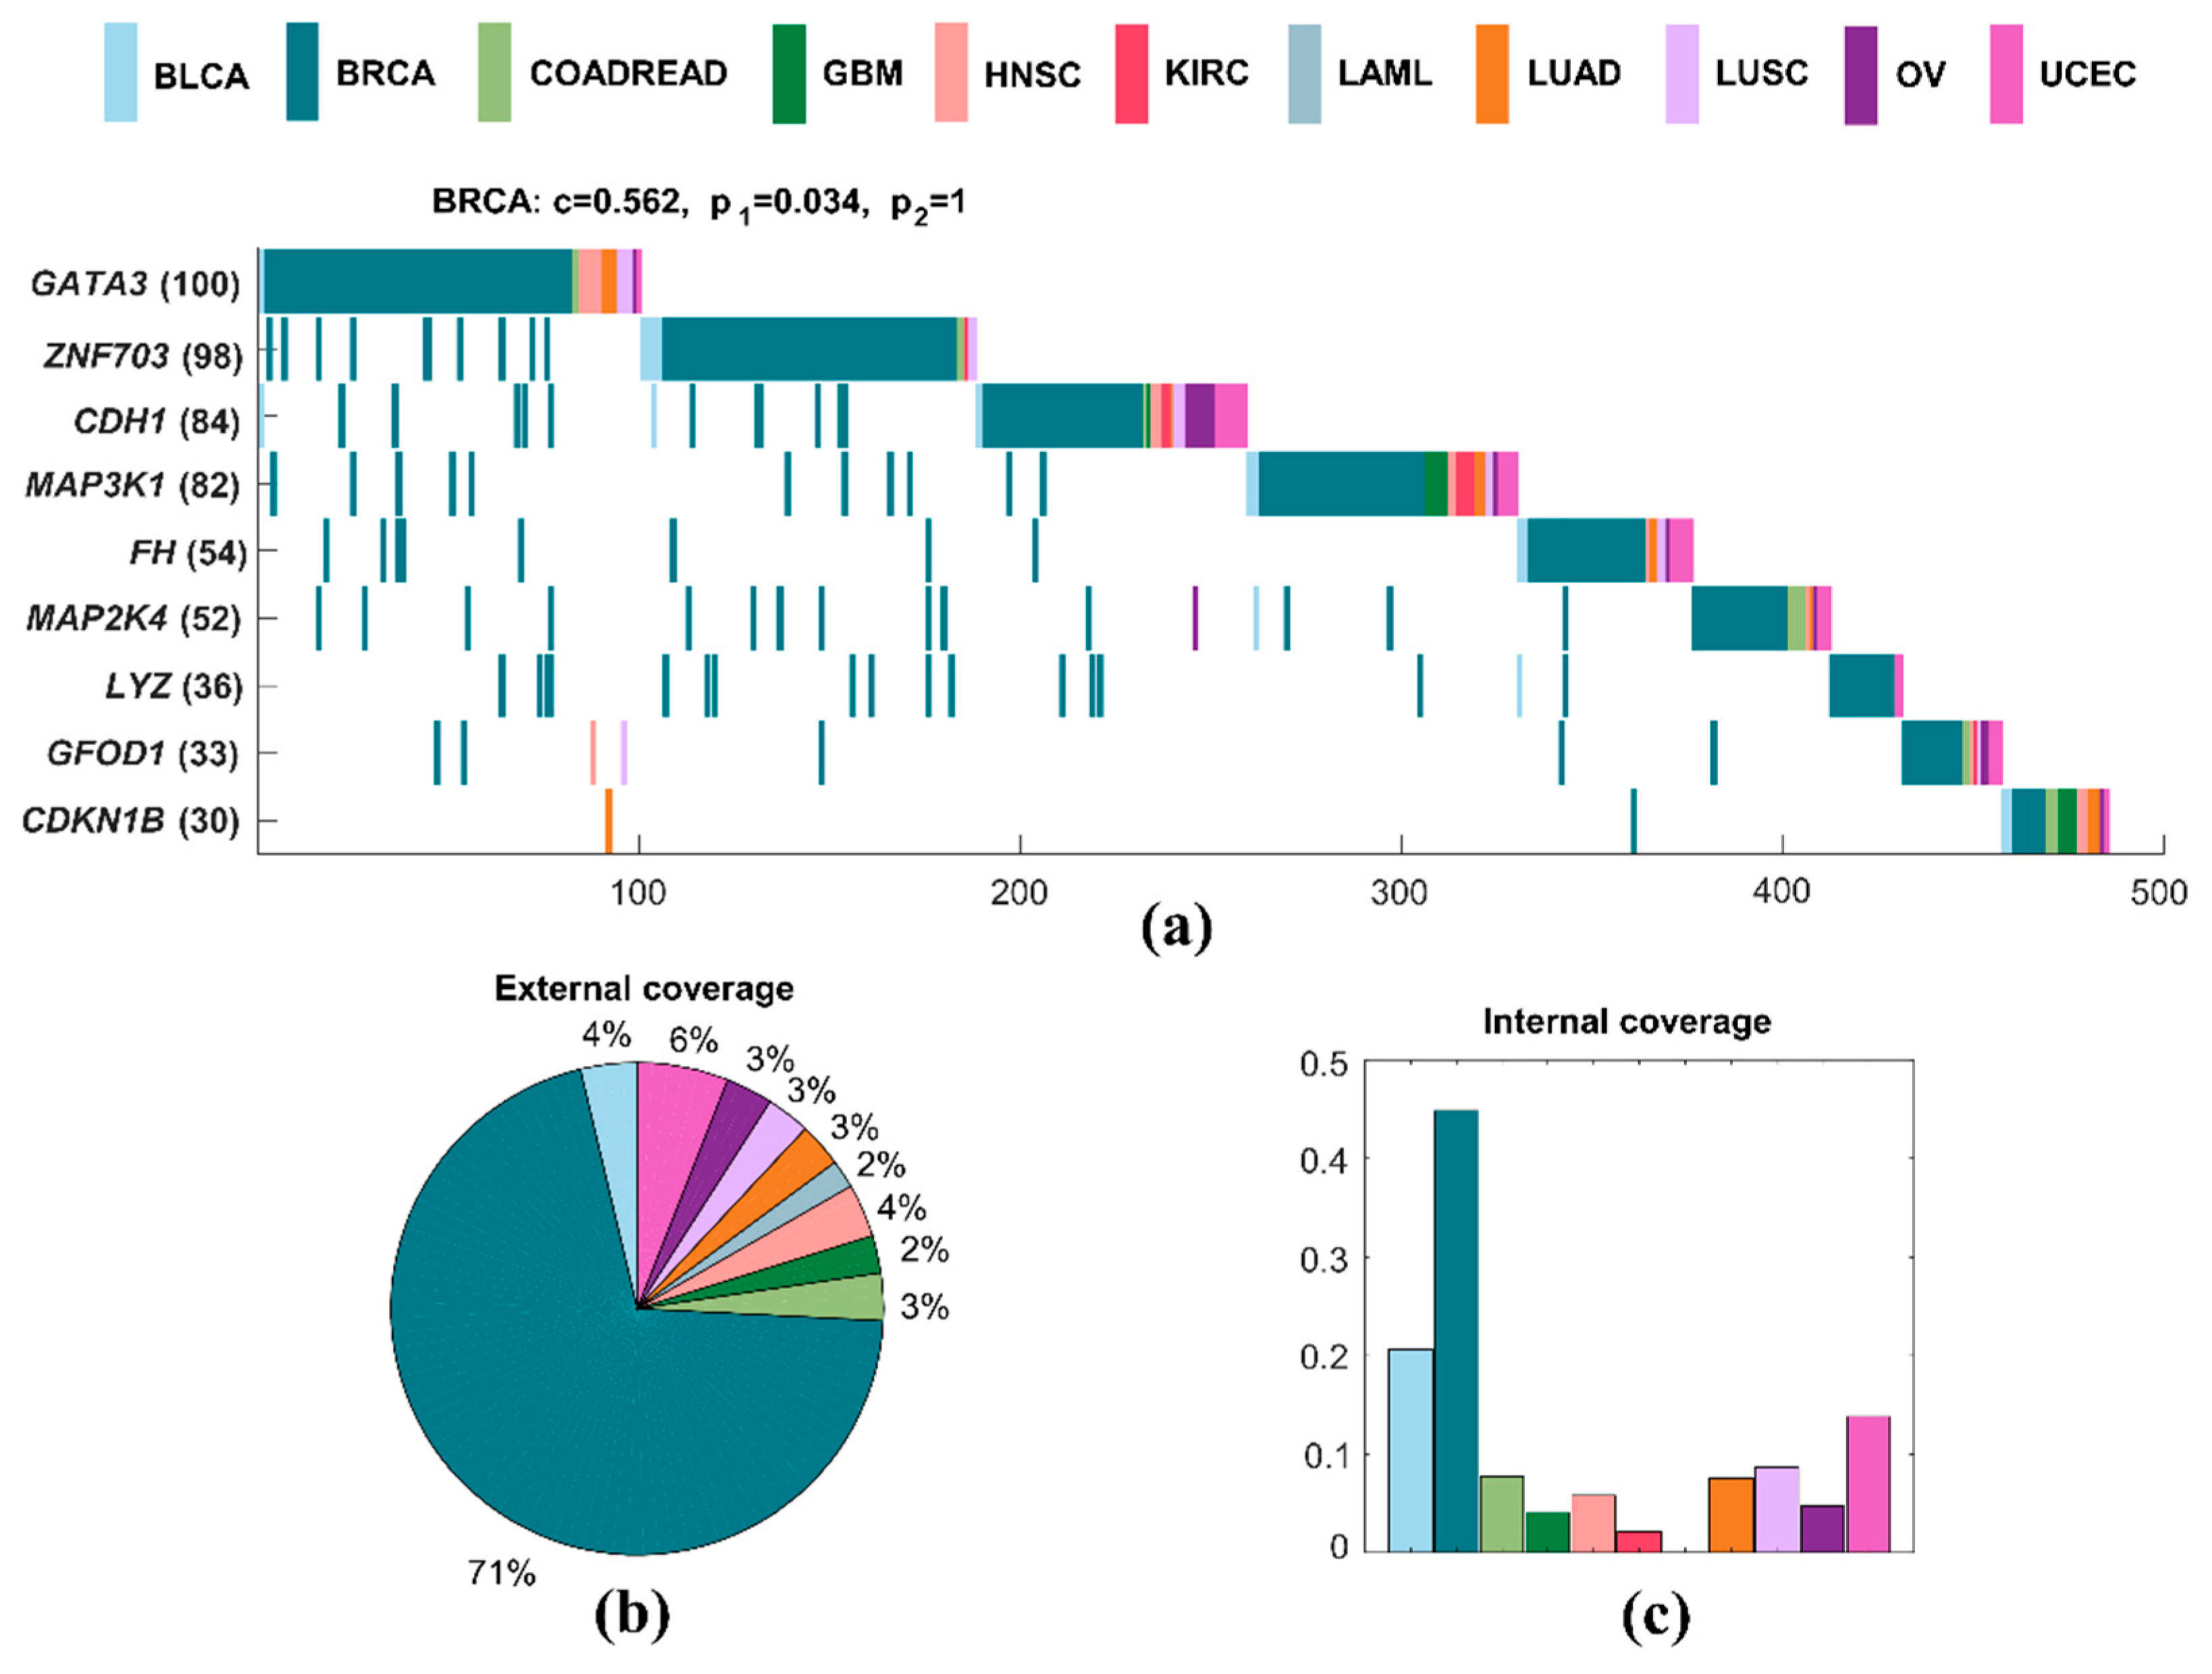
A specific driver module for BRCA contains nine mutated genes, including GATA3, ZNF703, CDH1, MAP3K1, FH, MAP2K4, LYZ, GFOD1, and CDKN1B (Figure 3a). We use the following measures to analyze the specific driver module. Specific coverage of a module measures the specificity of this module for a particular cancer to other cancer types. The internal coverage of a module is the percentage of mutated samples of this module for a cancer. The external coverage of a module is the fraction of mutated samples of this module for a cancer to all mutated samples of this module for all cancers. The significance of mutual exclusivity is denoted by an empirical p-value, which is derived from a random permutation test. It is the fraction of random samples with mutations larger than the real number of samples with mutations in a driver module. The specific coverage of this specific driver module for BRCA is 0.562, while the significance of mutual exclusivity of BRCA is 0.034, and that of all cancers is one. The external coverage of this specific driver module in BRCA is maximum in all cancers, which is 0.705, and means that about 71% of all mutated samples are from BRCA (Figure 3b). The internal coverage of this specific driver module also has the largest value in all cancers, which is 0.448, and denotes that the mutated samples of BRCA accounted for 45% of the total sample size of BRCA (Figure 3c). Obviously, it is a specific driver module for BRCA to other cancer types.
At the same time, this specific driver module intersects with some known pathways. For example, CDH1, MAP3K1, and MAP2K4 are members of RAC1 signaling pathway and CDC42 signaling events [50]. GATA3, LYZ, and CDKN1B are members of C-MYB transcription factor network [50]. CDH1, MAP3K1, MAP2K4, and CDKN1B are all involved in immune system [51]. CDH1, FH, and CDKN1B are all involved in pathways in cancer [52]. GATA3, ZNF703, and MAP3K1 are in the group 1 genes associated with acquired endocrine therapy resistance in breast tumors expressing ESR1 and ERBB2 [53]. About a third of the samples in which GFOD1 is mutated are samples of BRCA. There is no clear evidence that this gene is linked to breast cancer. However, GFOD1 is significantly upregulated in clear cell renal cell carcinoma tissues, but gradually decreased during cancer progression [54].
In order to further study the functional enrichment of the driver module, we use a topology-based pathway analysis method, Mirna enrIched pathway Impact anaLysis (MITHrIL) [55], to analyze this driver module. MITHrIL is an extension of Draghici et al. [56] and Tarca et al. [57], which takes, as input, the expression values of genes and/or microRNAs. The method returns a list of pathways sorted according to their degree of deregulation, together with the corresponding statistical significance (p-values). It is capable of clearly improving the reliability of pathway-based analysis of phenotypes. The impact factor reflects the importance of the changes observed in a pathway. The greater the value, the most significant are the changes. Then, we apply MITHrIL on the driver module (GATA3, ZNF703, CDH1, MAP3K1, FH, MAP2K4, LYZ, GFOD1, and CDKN1B) of BRCA using standard KEGG pathways and obtain nine significant pathways (Table 1). Obviously, these nine enriched pathways for BRCA driver module have high impact factor, and are statistically significant (p-value < 0.01).
We also compare CSDM with SPECifIC [58] to study the difference between the cancer specific driver modules using mutation data and the specific subpathways using expression data. All driver genes involved in driver modules detected by CSDM in BRCA are enriched in 107 pathways, with a statistically significant p-value < 0.01, while the results obtained by employing SPECifIC in BRCA are enriched in 73 pathways using KEGG pathway terms with the statistically significant p-value < 0.01. There are 39 common pathways which are enriched by both two methods. That is to say, these two methodologies provide the same insight in some respects, and can also complement each other in some other respects.
2.3.2. Specific Driver Modules in BLCA
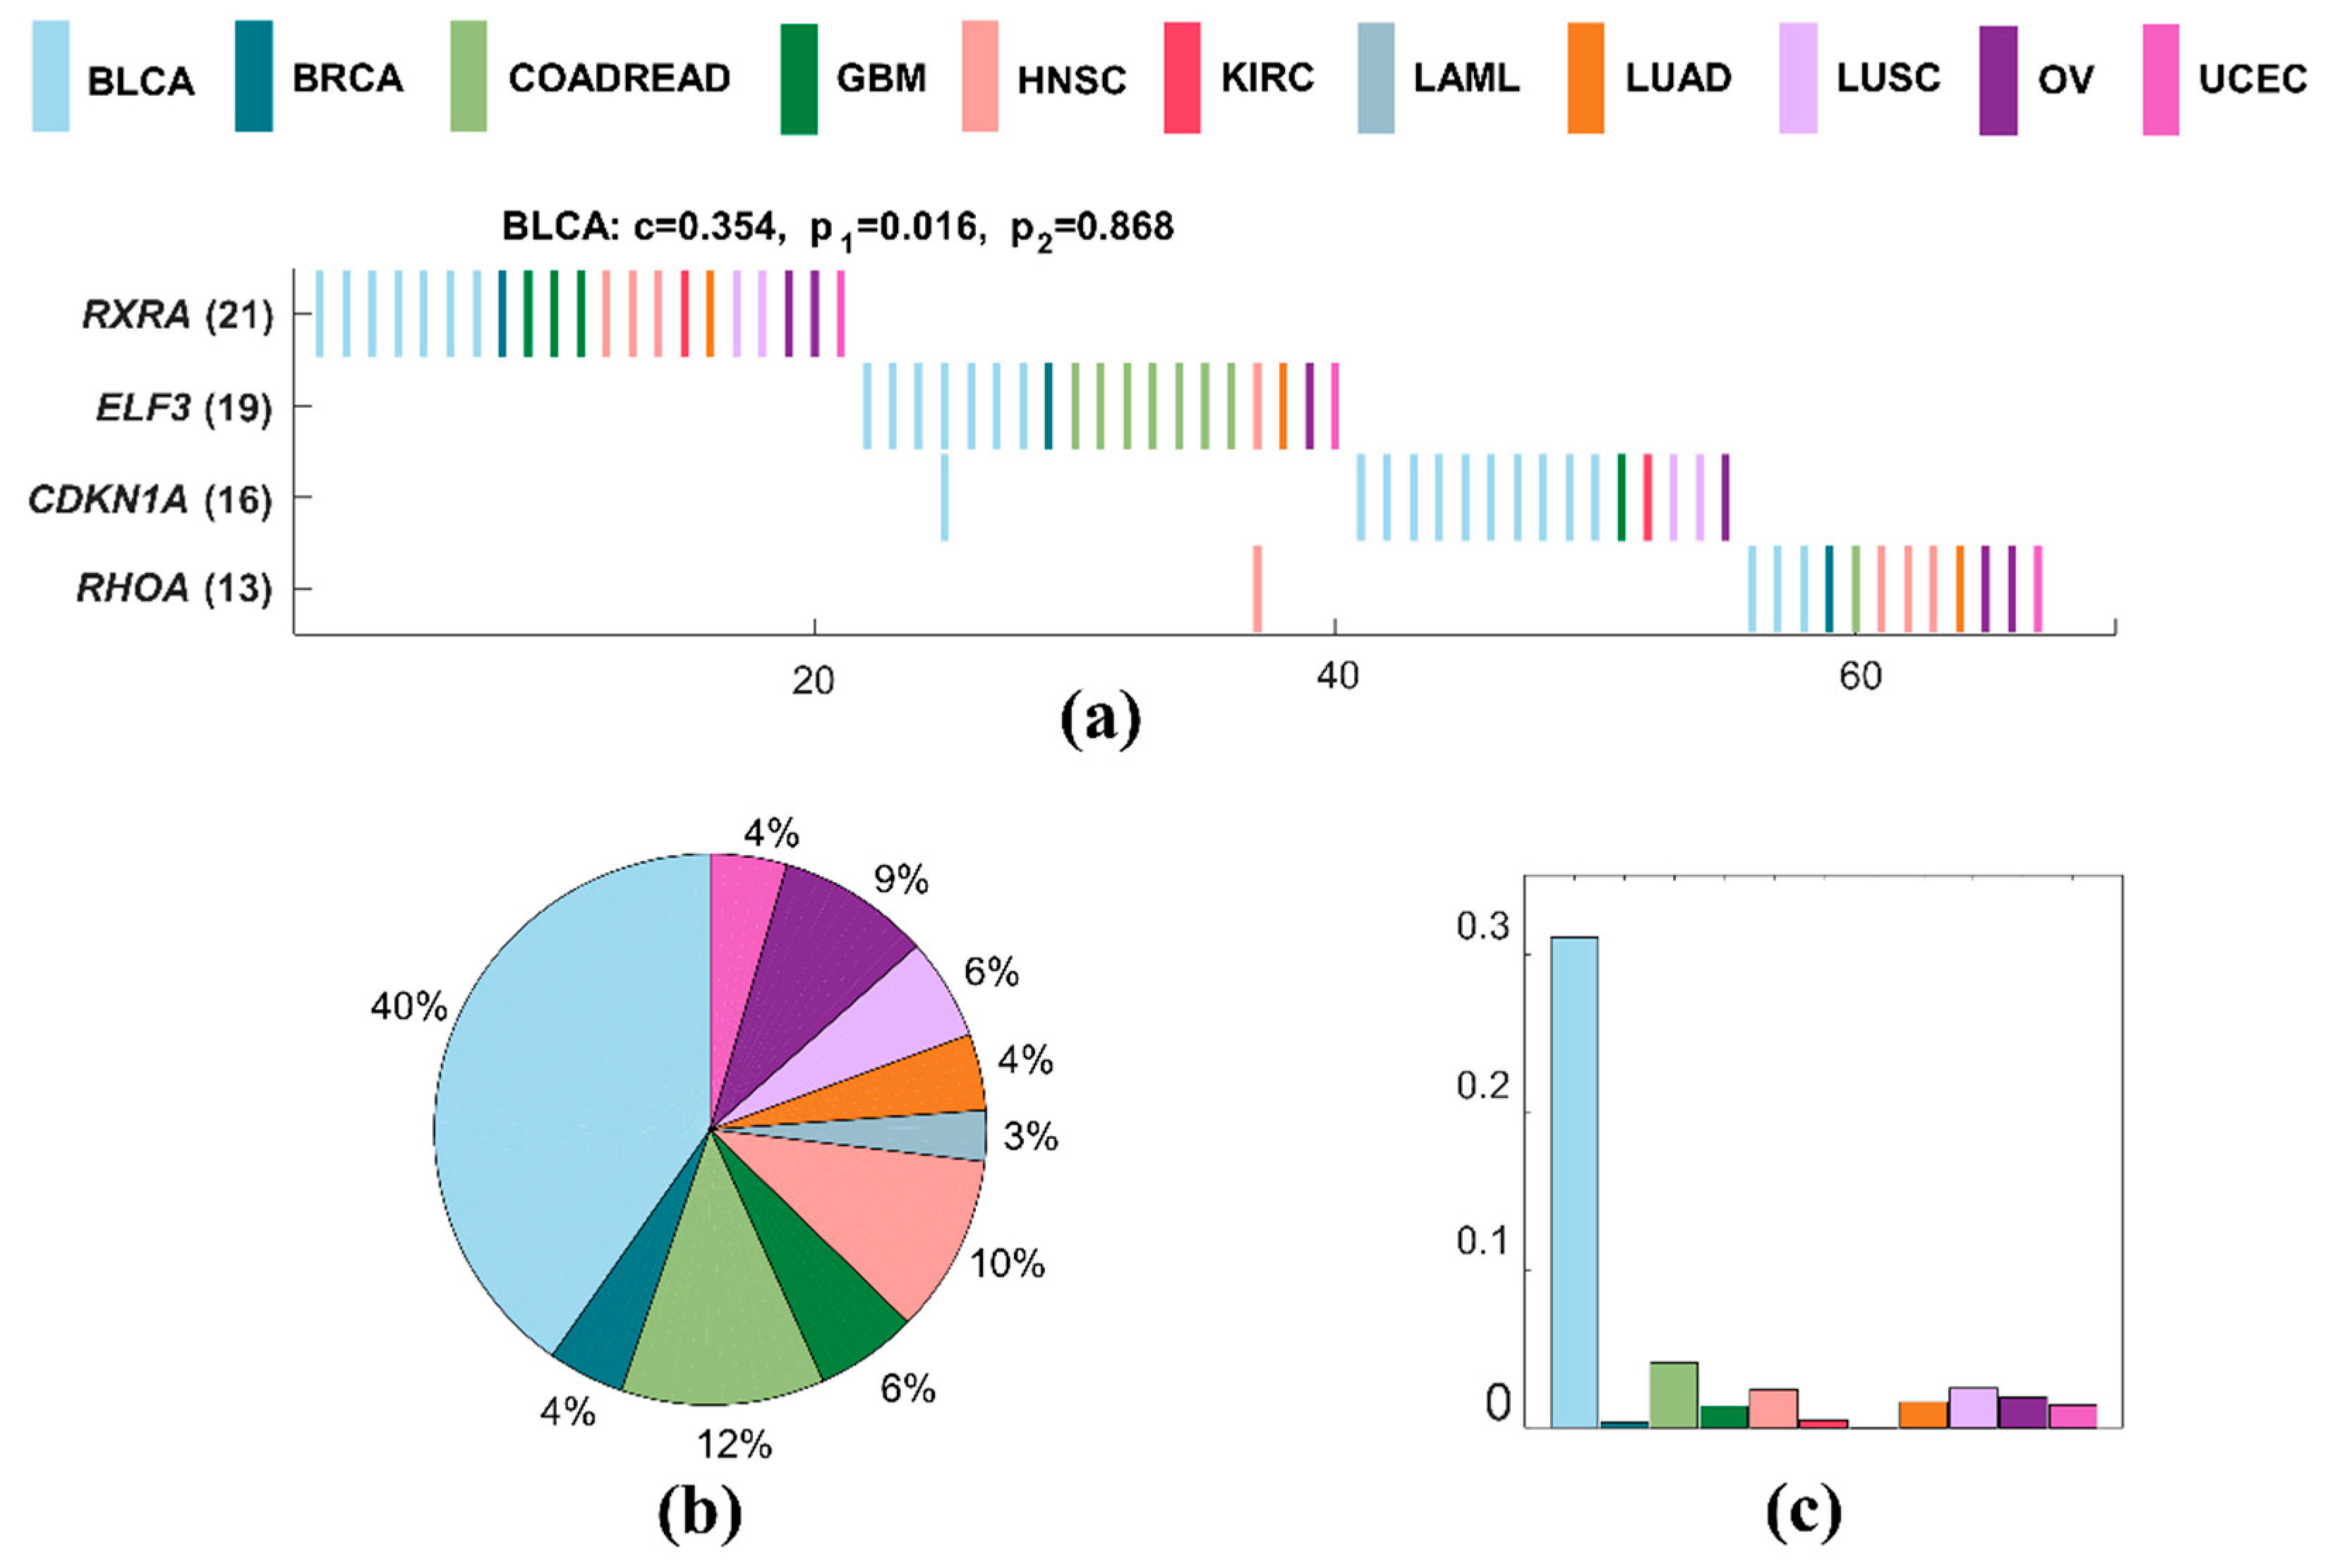
BLCA has the minimum number of samples in all cancers. A specific driver module for BLCA contains four mutated genes, including RXRA, ELF3, CDKN1A, and RHOA (Figure 4a). The specific coverage of this module is 0.562, while the significance of mutual exclusivity of BLCA is 0.034, and that of all cancers is one. This specific driver module has the largest external coverage and internal coverage, with 0.403 (Figure 4b) and 0.310 (Figure 4c) of BLCA, respectively. It means that this module is a specific driver module for BLCA. RXRA, ELF3, CDKN1A, and RHOA are all significantly mutated genes related to BLCA [59]. RXRA, CDKN1A, and RHOA are the members of pathways in cancer [52]. ELF3 and CDKN1A are genes downregulated in HeLa cells after knockdown of MED1 by RNAi [60], and they are both regulated by hypoxia [61].
We also apply MITHrIL on the driver module (RXRA, ELF3, CDKN1A, and RHOA) of BLCA using standard KEGG pathways and obtain ten significant pathways (Table 2). Obviously, these ten enriched pathways for BLCA driver module have high impact factor and are statistically significant (p < 0.01).
2.3.3. Specific Driver Modules in LAML
A specific driver module for LAML contains three mutated genes, including NPM1, RUNX1, and CEBPA (Figure 5a). The specific coverage of this module is 0.517, while the significance of mutual exclusivity of LAML is 0.016, and that of all cancers is one. This specific driver module has the largest external coverage and internal coverage, with 0.629 (Figure 5b) and 0.427 (Figure 5c) in LAML, respectively. Obviously, it is a specific driver module for LAML compared to other cancer types. The mutations of NPM1, RUNX1, and CEBPA are proven to be associated with LAML [62,63]. NPM1 is a nucleolar phosphoprotein which plays an essential role in transcription, cell apoptosis, cell proliferation, and the regulation of the p53 pathway [63,64,65]. RUNX1 mutations predict for resistance to chemotherapy, and they are significantly associated with distinct biological and clinical features [66]. Patients with a biallelic mutation in CEBPA are defined as a clinicopathologic entity that is associated with a favorable prognosis [67]. NPM1, RUNX1, and CEBPA are all genes from common genomic gains observed in a meta-analysis of copy number alterations across a panel of different cancer cell lines and tumor samples [68]. RUNX1 and CEBPA are both target genes for STAT3 in CSF3 signaling during myeloblast differentiation to neutrophils [69].
3. Discussion
We present a network-based method (CSDM) to detect specific driver modules of a certain cancer to other cancer types. This method can extract specific parts of a cancer at pathway level. When we apply CSDM on 12 TCGA cancer datasets, CSDM detects specific driver modules successfully. CSDM has higher accuracy than SpeMDP and HotNet2 when comparing specific coverage and GO and KEGG pathway enrichment. Moreover, there are few overlaps between specific driver modules when comparing two different cancers, which indicates that CSDM can get specific driver modules for each cancer type. Lastly, three specific driver modules detected by CSDM in BRCA, BLCA, and LAML intersect with well-known pathways, also verifying the validity of CSDM. When we apply MITHrIL on the specific driver modules of BRCA and BLCA, the enriched pathways have a high impact factor and are statistically significant (p-value < 0.01). Moreover, CSDM can be also applied on subtype specific driver modules in one cancer type, in theory. Since the sample size distribution of subtypes for an individual cancer is uneven, and the mutation data itself is very sparse, it is not suitable for CSDM to detect the specific driver modules of subtype only with mutation data. There are mainly two opportunities to improve CSDM in future work. On one hand, other multi-omics data, such as gene expression and DNA methylation, might be integrated into this framework to extract more specific information from different aspects. On the other hand, prior knowledge about the pathways, such as well-known pathways and protein interaction networks, can be used to improve this method and obtain more significantly specific driver modules.
4. Datasets and Methods
4.1. Datasets
We use pan-cancer genomic aberration data from 12 cancer types to assess our method for applications, downloaded from The Cancer Genome Atlas (TCGA) (http://cancergenome.nih.gov/), which are also used by HotNet2 [38]. The 12 cancer types are bladder carcinoma (BLCA), breast carcinoma (BRCA), colon adenocarcinoma (COAD), glioblastoma multiformae (GBM), head and neck squamous carcinoma (HNSC), kidney renal clear-cell carcinoma (KIRC), lymphoblastic acute myeloid leukemia (LAML), lung adenocarcinoma (LUAD), lung squamous carcinoma (LUSC), ovarian carcinoma (OV), rectal adenocarcinoma (READ), and uterine cervical and endometrial carcinoma (UCEC). Here, colon adenocarcinoma and rectal adenocarcinoma are combined into one type, denoted as COADREAD. We utilize the same data processing methods introduced by HotNet2 [38].
To represent the mutation data conveniently, we transform the mutation data into a binary mutation matrix. In this paper, we consider cancer types, and let represent the set of samples in the th caner type with elements. Let represent the set of genes in each caner type with elements. We use to represent the mutation matrix of the th cancer type. The entry represents that gene is mutated in sample and otherwise. There are rows (samples) and columns (mutated genes) in , where . Let denote the set of samples in which the gene is mutated in the th cancer type [27]. Meanwhile, let a binary matrix A = (aij) with rows (samples) and columns (mutated genes) to represent the mutation matrix for all cancer types, where . Let denote the set of samples in which the gene is mutated in all cancer type [27].
To assess the functional significance of the driver module, we download the gene sets of Gene Ontology (GO) biological process and [46] and Kyoto Encyclopedia of Genes and Genomes (KEGG) [47] from Molecular Signatures Databases (MSigDB) [48,49]. We utilize Gene Set Enrichment Analysis (GSEA) [48] to determine whether a driver module shows statistical significance with p-value < 0.05. Then, we utilize the F-measure to evaluate the performance of each method.
4.2. Methods
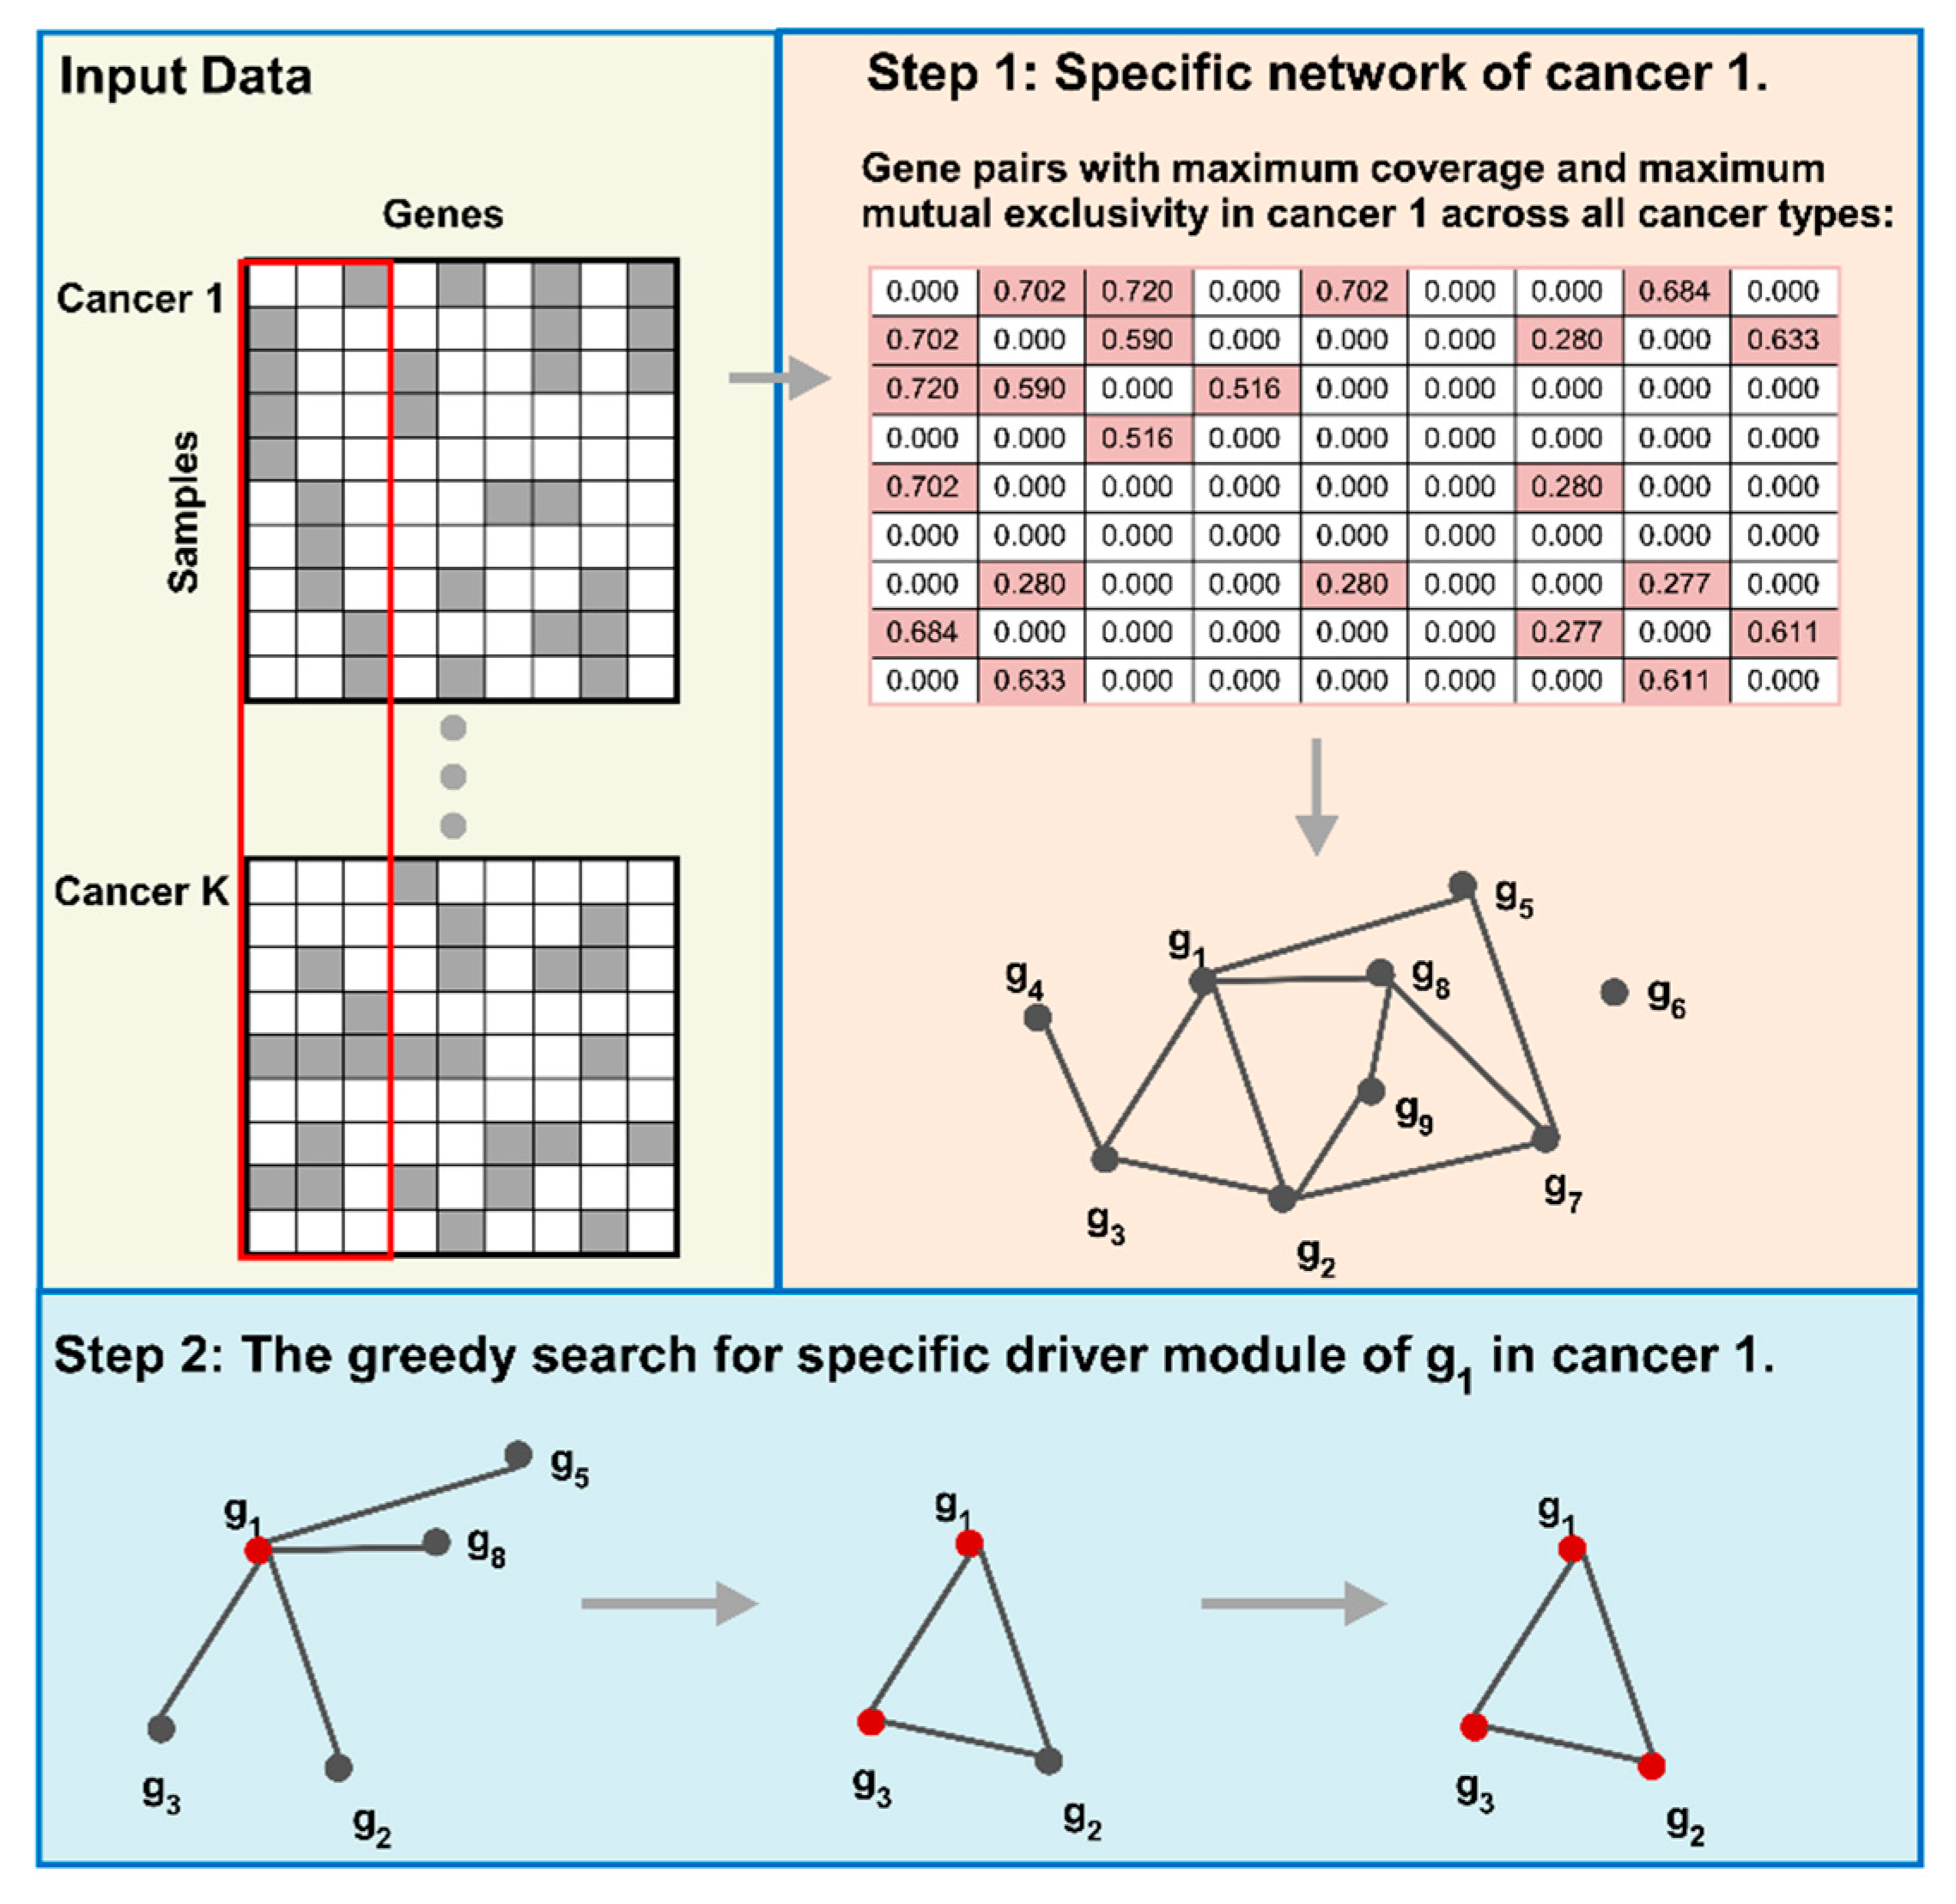
We first construct the specific network for a certain cancer by integrating specific coverage and mutual exclusivity. Then, we use a greedy search to detect the cancer specific driver modules. The overview of our method is shown in Figure 6. Finally, we utilize the specific coverage and the significance of mutual exclusivity to evaluate the cancer specific driver modules.
4.2.1. Cancer Specific Network Construction
The specific coverage for each gene pair in a certain cancer type is proposed to catch the specificity of the cancer specific driver module. Then, the mutual exclusivity is used to quantify the exclusivity of each gene pair in the same driver module. Finally, a cancer specific network is constructed by combining the specific coverage and mutual exclusivity.
Specific coverage. Given a pair of genes , we first define the internal coverage and external coverage of , respectively. The internal coverage of in cancer based on cancer types measures the coverage in cancer , which is the percentage of samples with at least one mutation in or in cancer , defined as follows:
The external coverage of in cancer based on cancer types measures the relationship between cancer and all cancer types. It is the fraction of samples with at least one mutation in gene or in cancer , based on all samples with mutations in or gj in cancer types, defined as follows:
The specific coverage of in cancer to other cancer types is the geometric mean of internal coverage and external coverage, and is denoted by , defined as follows:
The larger the specific coverage, the more specific the gene pair is to a particular cancer. Then, the specific coverage matrix for cancer is constructed. We normalize it by min-max normalization.
Mutual exclusivity. We utilize a mutual exclusivity index [33] based on an uncertainty coefficient [70] proposed by our another work to quantify mutual exclusivity between each gene pair for each cancer type. This mutual exclusivity index measures the level of mutual exclusivity between two genes, and tends to select gene pairs without a dominating gene, which has a high coverage dominating the total coverage of gene pair. Given a pair of genes , the mutual exclusivity of in cancer is denoted by , defined as follows [33]:
and is the uncertainty coefficient [70] of in cancer , and defined as Equation (5), where is the entropy.
is the support degree of in cancer and defined as Equation (6).
is the profile of gene in cancer , which is the th column in , And is the complementary profile of in cancer .
Then, the mutual exclusivity matrix is constructed. We also normalize E(k) using min-max normalization.
Network construction. We construct the specific network of cancer by combining the specific coverage and mutual exclusivity for each gene pair to other cancer types.
First, we select the gene pairs that have largest specific coverage and mutual exclusivity simultaneously in cancer to other cancer types. These gene pairs are more likely to be the specific gene pairs of cancer . We use the harmonic mean of the specific coverage and mutual exclusivity to construct the specific network of cancer , and the weight for each gene pair is calculated by Equation (7).
To get more precise specific networks, we do z-transformation on , and select the gene pairs with a z-score larger than 3, which are considered as the edges in the specific network . That is to say, the nodes in the specific network are all the mutated genes. There is an edge between two genes if this gene pair has a z-score larger than 3, which means that this gene pair has a significantly specific weight in cancer . Then, we obtain an unweighted specific network for detecting cancer specific driver modules.
4.2.2. Cancer Specific Driver Module Detection
We first define the internal coverage, external coverage, and specific coverage of the specific driver module in cancer . The large specific coverage denotes that the driver module has high internal coverage in a certain cancer and a high percentage of samples in this cancer, compared to other cancer types. Given a driver module , the internal coverage of in cancer is defined as Equation (8),
The external coverage of in cancer is defined as Equation (9),
and the specific coverage of in cancer is defined as Equation (10),
We use the greedy algorithm to detect the specific driver modules from the specific network of cancer . This greedy method protects the gene modules that have large external coverage in cancer . The details of implementation of our greedy algorithm for detecting the specific driver module of each gene in cancer k are shown as Algorithm 1.
We apply this greedy algorithm on each gene in specific network and consider the modules that have at least three genes as the specific driver modules. This greedy algorithm protects the gene pairs with high external coverage in cancer , which guarantees high specific coverage of driver modules in a certain cancer to other cancer types.
| Algorithm 1 Cancer specific driver modules detection |
| Input: : mutation matrix of the th caner type; : mutation matrix for all cancer types; : specific network for cancer ; : a gene in network ; Output: : specific driver module of gene . Step 1: Initialize . Step 2: Compute objective function . (a) Compute the according to Equation (9). is the objective function. Step 3: Update and . (a) Compute the . is a set of neighbours of in , and is the number of neighbours. (b) Compute the according to Equation (9). is the external coverage of D and its neighbour gi. (c) Select the gene with and . (d) If exists, update and . Then go to Step 2. If does not exist, return . |
4.2.3. Evaluation Measures
Specific coverage. We use the specific coverage to evaluate the specificity of specific driver modules, which is computed according to Equation (10). The large specific coverage denotes that the driver module has high internal coverage in a certain cancer and a high percentage of samples in this cancer compared to other cancer types.
Significance of mutual exclusivity. We also use the permutation test to assess the significance of mutual exclusivity in a certain cancer type. We permute the mutations of each gene among samples in a certain cancer type independently to hold the mutation frequency of each gene. Given a driver module for cancer detected by CSDM, we calculate the real number of samples in which is mutated. Then, we permute samples with mutations for each gene in cancer independently for 1000 times. Then, the significance of mutual exclusivity, an empirical p-value, is the fraction of random samples with mutations in larger than the real number of samples with mutations. The smaller the p-value is, the better. In this work, we consider the driver modules with the significance of mutual exclusivity p-value < 0.05 is significant. This p-value has 95% bootstrap confidence intervals. All p-values are corrected for multiple testing using the Benjamin–Hochberg method [71].
Pathway Enrichment. We use the Gene Set Enrichment Analysis (GSEA) [48] to obtain the significance of a driver module based on the well-known pathway, which uses hypergeometric calculation to measure overlapping genes over all genes in the gene universe by the following formula,
where is the total number of genes, is the number of genes in a well-known pathway, is the number of genes in a driver module, and is the number of overlapped genes both in the well-known pathway and the driver module. In our analysis, the reference gene set is 45,956, which is used by GSEA [48]. After pathway enrichment, we consider the driver modules with statistical significance p-value < 0.05 as the true positive elements. All p-values are corrected for multiple testing using the Benjamin–Hochberg method [71].
F-measure. For evaluating the performance of each method, we use F-measure to measure the accuracy of the driver modules based on well-known pathways, which are the gene sets of GO terms and KEGG pathways in this work. F-measure is the harmonic mean of precision and recall. The higher the F-measure, the more the driver modules can be enriched to the known pathways. The formulas of precision, recall, and F-measure are shown in the following:
Supplementary Materials
The following are available online. Table S1: Percentages of overlaps between specific driver modules of different cancer types. Table S2. Percentages of overlapped genes between different cancer types.
Author Contributions
L.G. conceived of the study, supervised the project and revised the manuscript. F.L. implemented the framework, performed the experiments, and drafted the manuscript. P.W. and Y.H. participated in the data analysis. All authors read and approved the final manuscript.
Acknowledgments
This work was supported by the National NSFC (Grant No.61532014 & No.61432010).
Conflicts of Interest
The authors declare no conflict of interest.
References
- Hanahan, D.; Weinberg, R.A. The hallmarks of cancer. Cell 2000, 100, 57–70. [Google Scholar] [CrossRef]
- Hanahan, D.; Weinberg, R.A. Hallmarks of cancer: The next generation. Cell 2011, 144, 646–674. [Google Scholar] [CrossRef] [PubMed]
- Vogelstein, B.; Papadopoulos, N.; Velculescu, V.E.; Zhou, S.; Diaz, L.A., Jr.; Kinzler, K.W. Cancer genome landscapes. Science 2013, 339, 1546–1558. [Google Scholar] [CrossRef] [PubMed]
- Dees, N.D.; Zhang, Q.; Kandoth, C.; Wendl, M.C.; Schierding, W.; Koboldt, D.C.; Mooney, T.B.; Callaway, M.B.; Dooling, D.; Mardis, E.R.; et al. Music: Identifying mutational significance in cancer genomes. Genome Res. 2012, 22, 1589–1598. [Google Scholar] [CrossRef] [PubMed]
- Lawrence, M.S.; Stojanov, P.; Polak, P.; Kryukov, G.V.; Cibulskis, K.; Sivachenko, A.; Carter, S.L.; Stewart, C.; Mermel, C.H.; Roberts, S.A. Mutational heterogeneity in cancer and the search for new cancer-associated genes. Nature 2013, 499, 214–218. [Google Scholar] [CrossRef] [PubMed]
- Lawrence, M.S.; Stojanov, P.; Mermel, C.H.; Robinson, J.T.; Garraway, L.A.; Golub, T.R.; Meyerson, M.; Gabriel, S.B.; Lander, E.S.; Getz, G. Discovery and saturation analysis of cancer genes across 21 tumour types. Nature 2014, 505, 495–501. [Google Scholar] [CrossRef] [PubMed] [Green Version]
- Reimand, J.; Bader, G.D. Systematic analysis of somatic mutations in phosphorylation signaling predicts novel cancer drivers. Mol. Syst. Biol. 2013, 9, 637. [Google Scholar] [CrossRef] [PubMed]
- Tamborero, D.; Gonzalez-Perez, A.; Lopez-Bigas, N. Oncodriveclust: Exploiting the positional clustering of somatic mutations to identify cancer genes. Bioinformatics 2013, 29, 2238–2244. [Google Scholar] [CrossRef] [PubMed]
- Gonzalez-Perez, A.; Lopez-Bigas, N. Functional impact bias reveals cancer drivers. Nucleic Acids Res. 2012, 40, e169. [Google Scholar] [CrossRef] [PubMed]
- Mularoni, L.; Sabarinathan, R.; Deu-Pons, J.; Gonzalez-Perez, A.; López-Bigas, N. Oncodrivefml: A general framework to identify coding and non-coding regions with cancer driver mutations. Genome Biol. 2016, 17, 128. [Google Scholar] [CrossRef] [PubMed]
- Davoli, T.; Xu, A.W.; Mengwasser, K.E.; Sack, L.M.; Yoon, J.C.; Park, P.J.; Elledge, S.J. Cumulative haploinsufficiency and triplosensitivity drive aneuploidy patterns and shape the cancer genome. Cell 2013, 155, 948–962. [Google Scholar] [CrossRef] [PubMed]
- Tokheim, C.J.; Papadopoulos, N.; Kinzler, K.W.; Vogelstein, B.; Karchin, R. Evaluating the evaluation of cancer driver genes. Proc. Natl. Acad. Sci. USA 2016, 113, 14330–14335. [Google Scholar] [CrossRef] [PubMed]
- Bailey, M.H.; Tokheim, C.; Porta-Pardo, E.; Sengupta, S.; Bertrand, D.; Weerasinghe, A.; Colaprico, A.; Wendl, M.C.; Kim, J.; Reardon, B.; et al. Comprehensive characterization of cancer driver genes and mutations. Cell 2018, 173, 371–385.e318. [Google Scholar] [CrossRef] [PubMed]
- Cho, A.; Shim, J.E.; Kim, E.; Supek, F.; Lehner, B.; Lee, I. Muffinn: Cancer gene discovery via network analysis of somatic mutation data. Genome Biol. 2016, 17, 1–16. [Google Scholar] [CrossRef] [PubMed]
- Shi, K.; Gao, L.; Wang, B. Discovering potential cancer driver genes by an integrated network-based approach. Mol. BioSyst. 2016, 12, 2921–2931. [Google Scholar] [CrossRef] [PubMed]
- Xi, J.; Li, A.; Wang, M. A novel network regularized matrix decomposition method to detect mutated cancer genes in tumour samples with inter-patient heterogeneity. Sci. Rep. 2017, 7, 2855. [Google Scholar] [CrossRef] [PubMed]
- Xi, J.; Wang, M.; Li, A. Discovering potential driver genes through an integrated model of somatic mutation profiles and gene functional information. Mol. BioSyst. 2017, 13, 2135–2144. [Google Scholar] [CrossRef] [PubMed]
- Xi, J.; Wang, M.; Li, A. Dgpathinter: A novel model for identifying driver genes via knowledge-driven matrix factorization with prior knowledge from interactome and pathways. PeerJ Comput. Sci. 2017, 3, e133. [Google Scholar] [CrossRef]
- Wang, Y.-X.; Liu, J.-X.; Gao, Y.-L.; Zheng, C.-H.; Shang, J.-L. Differentially expressed genes selection via laplacian regularized low-rank representation method. Comput. Biol. Chem. 2016, 65, 185–192. [Google Scholar] [CrossRef] [PubMed]
- Dai, L.Y.; Liu, J.X.; Zheng, C.H.; Shang, J.; Feng, C.M.; Wang, Y.X. Robust graph regularized sparse orthogonal nonnegative matrix factorization for identifying differentially expressed genes. In Proceedings of the 2017 IEEE International Conference on Bioinformatics and Biomedicine (BIBM), Kansas City, MO, USA, 13–16 November 2017; pp. 1900–1905. [Google Scholar]
- Ding, L.; Getz, G.; Wheeler, D.A.; Mardis, E.R.; McLellan, M.D.; Cibulskis, K.; Sougnez, C.; Greulich, H.; Muzny, D.M.; Morgan, M.B. Somatic mutations affect key pathways in lung adenocarcinoma. Nature 2008, 455, 1069–1075. [Google Scholar] [CrossRef] [PubMed]
- Network, C.G.A.R. Comprehensive genomic characterization defines human glioblastoma genes and core pathways. Nature 2008, 455, 1061–1068. [Google Scholar]
- Yeang, C.-H.; McCormick, F.; Levine, A. Combinatorial patterns of somatic gene mutations in cancer. FASEB J. 2008, 22, 2605–2622. [Google Scholar] [CrossRef] [PubMed]
- Vogelstein, B.; Kinzler, K.W. Cancer genes and the pathways they control. Nat. Med. 2004, 10, 789–799. [Google Scholar] [CrossRef] [PubMed]
- Dimitrakopoulos, C.M.; Beerenwinkel, N. Computational approaches for the identification of cancer genes and pathways. Wiley Interdiscip. Rev. Syst. Biol. Med. 2017, 9, e1364. [Google Scholar] [CrossRef] [PubMed]
- Zhang, J.; Zhang, S. The discovery of mutated driver pathways in cancer: Models and algorithms. IEEE/ACM Trans. Comput. Biol. Bioinform. 2017, 1. [Google Scholar] [CrossRef] [PubMed]
- Vandin, F.; Upfal, E.; Raphael, B.J. De novo discovery of mutated driver pathways in cancer. Genome Res. 2012, 22, 375–385. [Google Scholar] [CrossRef] [PubMed]
- Zhao, J.; Zhang, S.; Wu, L.-Y.; Zhang, X.-S. Efficient methods for identifying mutated driver pathways in cancer. Bioinformatics 2012, 28, 2940–2947. [Google Scholar] [CrossRef] [PubMed]
- Leiserson, M.D.M.; Blokh, D.; Sharan, R.; Raphael, B.J. Simultaneous identification of multiple driver pathways in cancer. PLoS Comput. Biol. 2013, 9, e1003054. [Google Scholar] [CrossRef] [PubMed]
- Zhang, J.; Zhang, S.; Wang, Y.; Zhang, X.S. Identification of mutated core cancer modules by integrating somatic mutation, copy number variation, and gene expression data. BMC Syst. Biol. 2013, 7 (Suppl. S2), S4. [Google Scholar] [CrossRef] [PubMed]
- Constantinescu, S.; Szczurek, E.; Mohammadi, P.; Rahnenführer, J.; Beerenwinkel, N. Timex: A waiting time model for mutually exclusive cancer alterations. Bioinformatics 2015, 32, 968–975. [Google Scholar] [CrossRef] [PubMed]
- Kim, Y.-A.; Madan, S.; Przytycka, T.M. Wesme: Uncovering mutual exclusivity of cancer drivers and beyond. Bioinformatics 2016, 33, 814–821. [Google Scholar] [CrossRef] [PubMed]
- Li, F.; Gao, L.; Ma, X.; Yang, X. Detection of driver pathways using mutated gene network in cancer. Mol. BioSyst. 2016, 12, 2135–2141. [Google Scholar] [CrossRef] [PubMed]
- Zhang, J.; Zhang, S. Discovery of cancer common and specific driver gene sets. Nucleic Acids Res. 2017, 45, e86. [Google Scholar] [CrossRef] [PubMed]
- Vandin, F.; Upfal, E.; Raphael, B.J. Algorithms for detecting significantly mutated pathways in cancer. J. Comput. Biol. 2011, 18, 507–522. [Google Scholar] [CrossRef] [PubMed]
- Ciriello, G.; Cerami, E.; Sander, C.; Schultz, N. Mutual exclusivity analysis identifies oncogenic network modules. Genome Res. 2012, 22, 398–406. [Google Scholar] [CrossRef] [PubMed]
- Kim, Y.-A.; Cho, D.-Y.; Dao, P.; Przytycka, T.M. Memcover: Integrated analysis of mutual exclusivity and functional network reveals dysregulated pathways across multiple cancer types. Bioinformatics 2015, 31, i284–i292. [Google Scholar] [CrossRef] [PubMed]
- Leiserson, M.D.M.; Vandin, F.; Wu, H.-T.; Dobson, J.R.; Eldridge, J.V.; Thomas, J.L.; Papoutsaki, A.; Kim, Y.; Niu, B.; McLellan, M.; et al. Pan-cancer network analysis identifies combinations of rare somatic mutations across pathways and protein complexes. Nat. Genet. 2015, 47, 106–114. [Google Scholar] [CrossRef] [PubMed]
- Sanchez-Vega, F.; Mina, M.; Armenia, J.; Chatila, W.K.; Luna, A.; La, K.C.; Dimitriadoy, S.; Liu, D.L.; Kantheti, H.S.; Saghafinia, S.; et al. Oncogenic signaling pathways in the cancer genome atlas. Cell 2018, 173, 321–337. [Google Scholar] [CrossRef] [PubMed]
- Ge, Z.; Leighton, J.S.; Wang, Y.; Peng, X.; Chen, Z.; Chen, H.; Sun, Y.; Yao, F.; Li, J.; Zhang, H.; et al. Integrated genomic analysis of the ubiquitin pathway across cancer types. Cell Rep. 2018, 23, 213–226.e213. [Google Scholar] [CrossRef] [PubMed]
- Schaub, F.X.; Dhankani, V.; Berger, A.C.; Trivedi, M.; Richardson, A.B.; Shaw, R.; Zhao, W.; Zhang, X.; Ventura, A.; Liu, Y.; et al. Pan-cancer alterations of the myc oncogene and its proximal network across the cancer genome atlas. Cell Syst. 2018, 6, 282–300.e282. [Google Scholar] [CrossRef] [PubMed]
- Ma, X.; Tang, W.; Wang, P.; Guo, X.; Gao, L. Extracting stage-specific and dynamic modules through analyzing multiple networks associated with cancer progression. IEEE/ACM Trans. Comput. Biol. Bioinform. 2016, 647–658. [Google Scholar] [CrossRef] [PubMed]
- Yang, X.; Shao, X.; Gao, L.; Zhang, S. Comparative DNA methylation analysis to decipher common and cell type-specific patterns among multiple cell types. Brief. Funct. Genom. 2016, 15, 399–407. [Google Scholar] [CrossRef] [PubMed]
- Ma, X.; Sun, P.; Qin, G. Identifying condition-specific modules by clustering multiple networks. IEEE/ACM Trans. Comput. Biol. Bioinform. 2017, 1. [Google Scholar] [CrossRef] [PubMed]
- Yang, X.; Gao, L.; Zhang, S. Comparative pan-cancer DNA methylation analysis reveals cancer common and specific patterns. Brief. Bioinform. 2017, 18, 761–773. [Google Scholar] [CrossRef] [PubMed]
- Ashburner, M.; Ball, C.A.; Blake, J.A.; Botstein, D.; Butler, H.; Cherry, J.M.; Davis, A.P.; Dolinski, K.; Dwight, S.S.; Eppig, J.T.; et al. Gene ontology: Tool for the unification of biology. Nat. Genet. 2000, 25, 25–29. [Google Scholar] [CrossRef] [PubMed]
- Kanehisa, M.; Goto, S.; Sato, Y.; Furumichi, M.; Tanabe, M. Kegg for integration and interpretation of large-scale molecular data sets. Nucleic Acids Res. 2012, 40, D109–D114. [Google Scholar] [CrossRef] [PubMed]
- Subramanian, A.; Tamayo, P.; Mootha, V.K.; Mukherjee, S.; Ebert, B.L.; Gillette, M.A.; Paulovich, A.; Pomeroy, S.L.; Golub, T.R.; Lander, E.S.; et al. Gene set enrichment analysis: A knowledge-based approach for interpreting genome-wide expression profiles. Proc. Natl. Acad. Sci. USA 2005, 102, 15545–15550. [Google Scholar] [CrossRef] [PubMed]
- Liberzon, A.; Birger, C.; Thorvaldsdóttir, H.; Ghandi, M.; Mesirov, J.P.; Tamayo, P. The molecular signatures database hallmark gene set collection. Cell Syst. 2015, 1, 417–425. [Google Scholar] [CrossRef] [PubMed]
- Schaefer, C.F.; Anthony, K.; Krupa, S.; Buchoff, J.; Day, M.; Hannay, T.; Buetow, K.H. Pid: The pathway interaction database. Nucleic Acids Res. 2009, 37, D674–D679. [Google Scholar] [CrossRef] [PubMed]
- Fabregat, A.; Sidiropoulos, K.; Garapati, P.; Gillespie, M.; Hausmann, K.; Haw, R.; Jassal, B.; Jupe, S.; Korninger, F.; McKay, S.; et al. The reactome pathway knowledgebase. Nucleic Acids Res. 2016, 44, D481–D487. [Google Scholar] [CrossRef] [PubMed]
- Kanehisa, M.; Goto, S. Kegg: Kyoto encyclopedia of genes and genomes. Nucleic Acids Res. 2000, 28, 27–30. [Google Scholar] [CrossRef] [PubMed]
- Creighton, C.J.; Massarweh, S.; Huang, S.; Tsimelzon, A.; Hilsenbeck, S.G.; Osborne, C.K.; Shou, J.; Malorni, L.; Schiff, R. Development of resistance to targeted therapies transforms the clinically associated molecular profile subtype of breast tumor xenografts. Cancer Res. 2008, 68, 7493. [Google Scholar] [CrossRef] [PubMed]
- Wu, X.-R.; Chen, Y.-H.; Chen, W.; Kong, W.; Huang, J.-W.; Zhang, J.; Xue, W.; Liu, D.-M.; Huang, Y.-R. GFOD1 and peejar are promising markers for clear-cell renal cell carcinoma disease progression. Oncotarget 2016, 7, 38004–38009. [Google Scholar] [CrossRef] [PubMed]
- Alaimo, S.; Giugno, R.; Acunzo, M.; Veneziano, D.; Ferro, A.; Pulvirenti, A. Post-transcriptional knowledge in pathway analysis increases the accuracy of phenotypes classification. Oncotarget 2016, 7, 54572–54582. [Google Scholar] [CrossRef] [PubMed]
- Draghici, S.; Khatri, P.; Tarca, A.L.; Amin, K.; Done, A.; Voichita, C.; Georgescu, C.; Romero, R. A systems biology approach for pathway level analysis. Genome Res. 2007, 17, 1537–1545. [Google Scholar] [CrossRef] [PubMed]
- Tarca, A.L.; Draghici, S.; Khatri, P.; Hassan, S.S.; Mittal, P.; Kim, J.-S.; Kim, C.J.; Kusanovic, J.P.; Romero, R. A novel signaling pathway impact analysis. Bioinformatics 2009, 25, 75–82. [Google Scholar] [CrossRef] [PubMed]
- Alaimo, S.; Marceca, P.G.; Ferro, A.; Pulvirenti, A. Detecting disease specific pathway substructures through an integrated systems biology approach. Non-Coding RNA 2017, 3, 20. [Google Scholar] [CrossRef] [PubMed]
- The Cancer Genome Atlas Research Network. Comprehensive molecular characterization of urothelial bladder carcinoma. Nature 2014, 507, 315–322. [Google Scholar]
- Udayakumar, T.S.; Belakavadi, M.; Choi, K.-H.; Pandey, P.K.; Fondell, J.D. Regulation of aurora-a kinase gene expression via GABP recruitment of TRAP220/MED1. J. Biol. Chem. 2006, 281, 14691–14699. [Google Scholar] [CrossRef] [PubMed]
- Winter, S.C.; Buffa, F.M.; Silva, P.; Miller, C.; Valentine, H.R.; Turley, H.; Shah, K.A.; Cox, G.J.; Corbridge, R.J.; Homer, J.J.; et al. Relation of a hypoxia metagene derived from head and neck cancer to prognosis of multiple cancers. Cancer Res. 2007, 67, 3441–3449. [Google Scholar] [CrossRef] [PubMed]
- Döhner, H.; Weisdorf, D.J.; Bloomfield, C.D. Acute myeloid leukemia. N. Engl. J. Med. 2015, 373, 1136–1152. [Google Scholar] [CrossRef] [PubMed]
- Gill, H.; Leung, A.Y.H.; Kwong, Y.-L. Molecularly targeted therapy in acute myeloid leukemia. Future Oncol. 2016, 12, 827–838. [Google Scholar] [CrossRef] [PubMed]
- Chiu, Y.C.; Tsai, M.H.; Chou, W.C.; Liu, Y.C.; Kuo, Y.Y.; Hou, H.A.; Lu, T.P.; Lai, L.C.; Chen, Y.; Tien, H.F.; et al. Prognostic significance of NPM1 mutation-modulated microrna−mrna regulation in acute myeloid leukemia. Leukemia 2015, 30, 274–284. [Google Scholar] [CrossRef] [PubMed]
- Alpermann, T.; Schnittger, S.; Eder, C.; Dicker, F.; Meggendorfer, M.; Kern, W.; Schmid, C.; Aul, C.; Staib, P.; Wendtner, C.-M.; et al. Molecular subtypes of NPM1 mutations have different clinical profiles, specific patterns of accompanying molecular mutations and varying outcomes in intermediate risk acute myeloid leukemia. Haematologica 2016, 101, e55. [Google Scholar] [CrossRef] [PubMed]
- Gaidzik, V.I.; Bullinger, L.; Schlenk, R.F.; Zimmermann, A.S.; Röck, J.; Paschka, P.; Corbacioglu, A.; Krauter, J.; Schlegelberger, B.; Ganser, A.; et al. RUNX1 mutations in acute myeloid leukemia: Results from a comprehensive genetic and clinical analysis from the aml study group. J. Clin. Oncol. 2011, 29, 1364–1372. [Google Scholar] [CrossRef] [PubMed]
- Taskesen, E.; Bullinger, L.; Corbacioglu, A.; Sanders, M.A.; Erpelinck, C.A.J.; Wouters, B.J.; van der Poel-van de Luytgaarde, S.C.; Damm, F.; Krauter, J.; Ganser, A.; et al. Prognostic impact, concurrent genetic mutations, and gene expression features of aml with cebpa mutations in a cohort of 1182 cytogenetically normal aml patients: Further evidence for cebpa double mutant aml as a distinctive disease entity. Blood 2011, 117, 2469–2475. [Google Scholar] [CrossRef] [PubMed]
- Greshock, J.; Nathanson, K.; Martin, A.-M.; Zhang, L.; Coukos, G.; Weber, B.L.; Zaks, T.Z. Cancer cell lines as genetic models of their parent histology: Analyses based on array comparative genomic hybridization. Cancer Res. 2007, 67, 3594–3600. [Google Scholar] [CrossRef] [PubMed]
- Numata, A.; Shimoda, K.; Kamezaki, K.; Haro, T.; Kakumitsu, H.; Shide, K.; Kato, K.; Miyamoto, T.; Yamashita, Y.; Oshima, Y.; et al. Signal transducers and activators of transcription 3 augments the transcriptional activity of ccaat/enhancer-binding protein α in granulocyte colony-stimulating factor signaling pathway. J. Biol. Chem. 2005, 280, 12621–12629. [Google Scholar] [CrossRef] [PubMed]
- Bowers, P.M.; Cokus, S.J.; Eisenberg, D.; Yeates, T.O. Use of logic relationships to decipher protein network organization. Science 2004, 306, 2246–2249. [Google Scholar] [CrossRef] [PubMed]
- Benjamini, Y.; Hochberg, Y. Controlling the false discovery rate: A practical and powerful approach to multiple testing. J. R. Stat. Soc. Ser. B 1995, 57, 289–300. [Google Scholar]
Sample Availability: Samples of the compounds are available from the authors. |
Figure 1.
Comparison of CSDM (red), SpeMDP (yellow), and HotNet2 (blue) and their specific coverage in 11 different cancer types. The stars above the blue and red bar represent the differences between CSDM and SpeMDP and HotNet2 in specific coverage, which are computed using Fisher’s exact test (* p < 0.05). The confidence intervals for the boxplots correspond to q1 − 1.5 × (q3 − q1) and q3 + 1.5 × (q3 − q1), where q1 and q3 are the 25th and 75th percentiles, respectively.
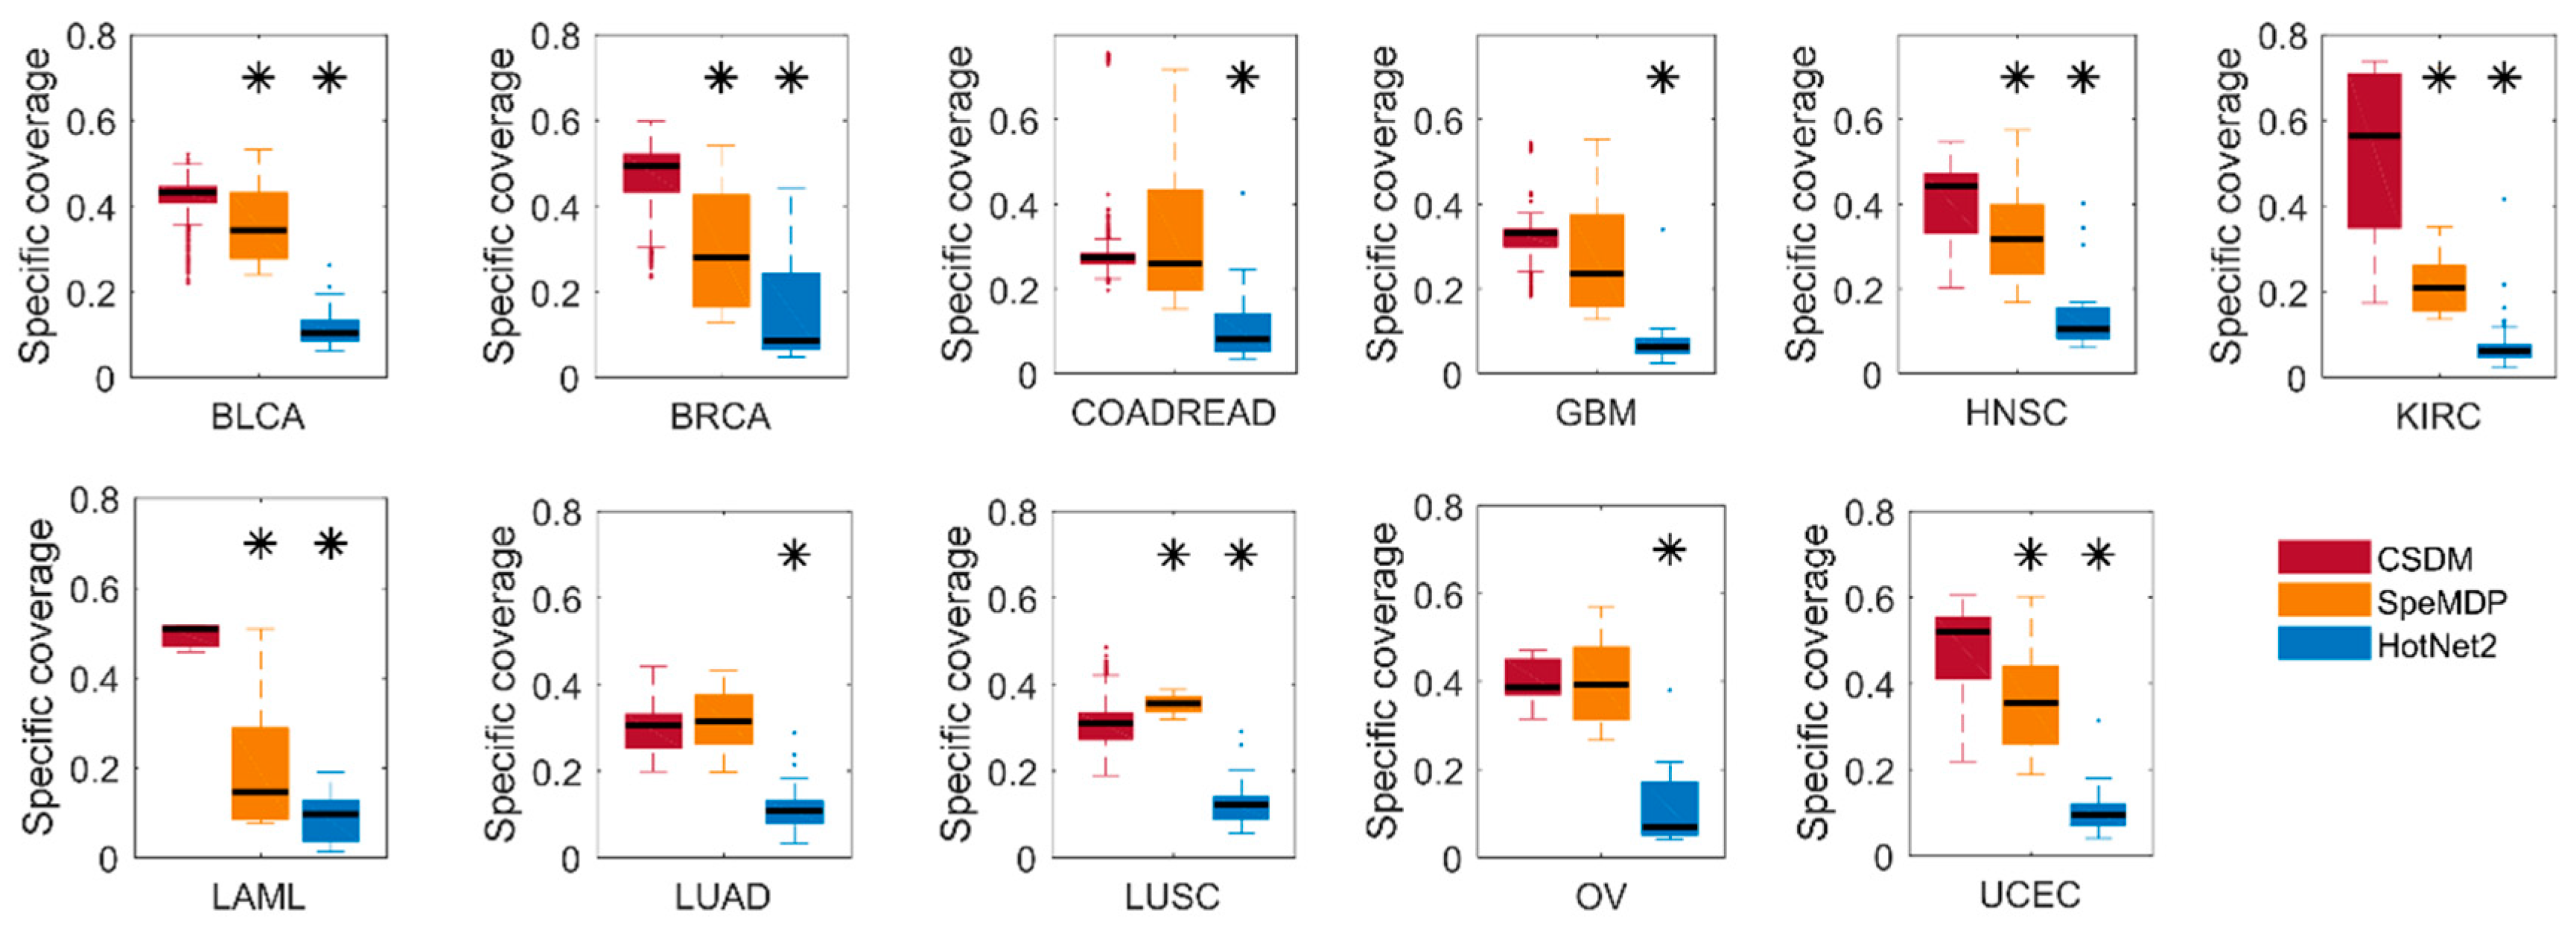
Figure 2.
Comparison of CSDM (red), SpeMDP (yellow), and HotNet2 (blue) in GO (a) and KEGG (b) pathway enrichment in 11 different cancer types. The F-measure is used to represent the accuracy of the driver modules detected by each method.
Figure 2.
Comparison of CSDM (red), SpeMDP (yellow), and HotNet2 (blue) in GO (a) and KEGG (b) pathway enrichment in 11 different cancer types. The F-measure is used to represent the accuracy of the driver modules detected by each method.

Figure 3.
A specific driver module in BRCA. Different colors represent different cancer types. (a) Mutation matrix for the cancer specific driver module of BRCA. The genes on the left are the members in the specific driver module. The number behind the gene is the number of samples in which this gene is mutated. (b) The external coverage of the specific driver module in (a) for each cancer type. (c) The internal coverage of the specific driver module in (a) for each cancer type.

Figure 4.
A specific driver module in BLCA. Different colors represent different cancer types. (a) Mutation matrix for the cancer specific driver module of BLCA. The genes on the left are the members in the specific driver module. The number behind the gene is the number of samples in which this gene is mutated. (b) The external coverage of the specific driver module in (a) for each cancer type. (c) The internal coverage of the specific driver module in (a) for each cancer type.

Figure 5.
A specific driver module in LAML. Different colors represent different cancer types. (a) Mutation matrix for the cancer specific driver module of LAML. The genes on the left are the members in the specific driver module. The number behind the gene is the number of samples in which this gene is mutated. (b) The external coverage of the specific driver module in (a) for each cancer type. (c) The internal coverage of the specific driver module in (a) for each cancer type.
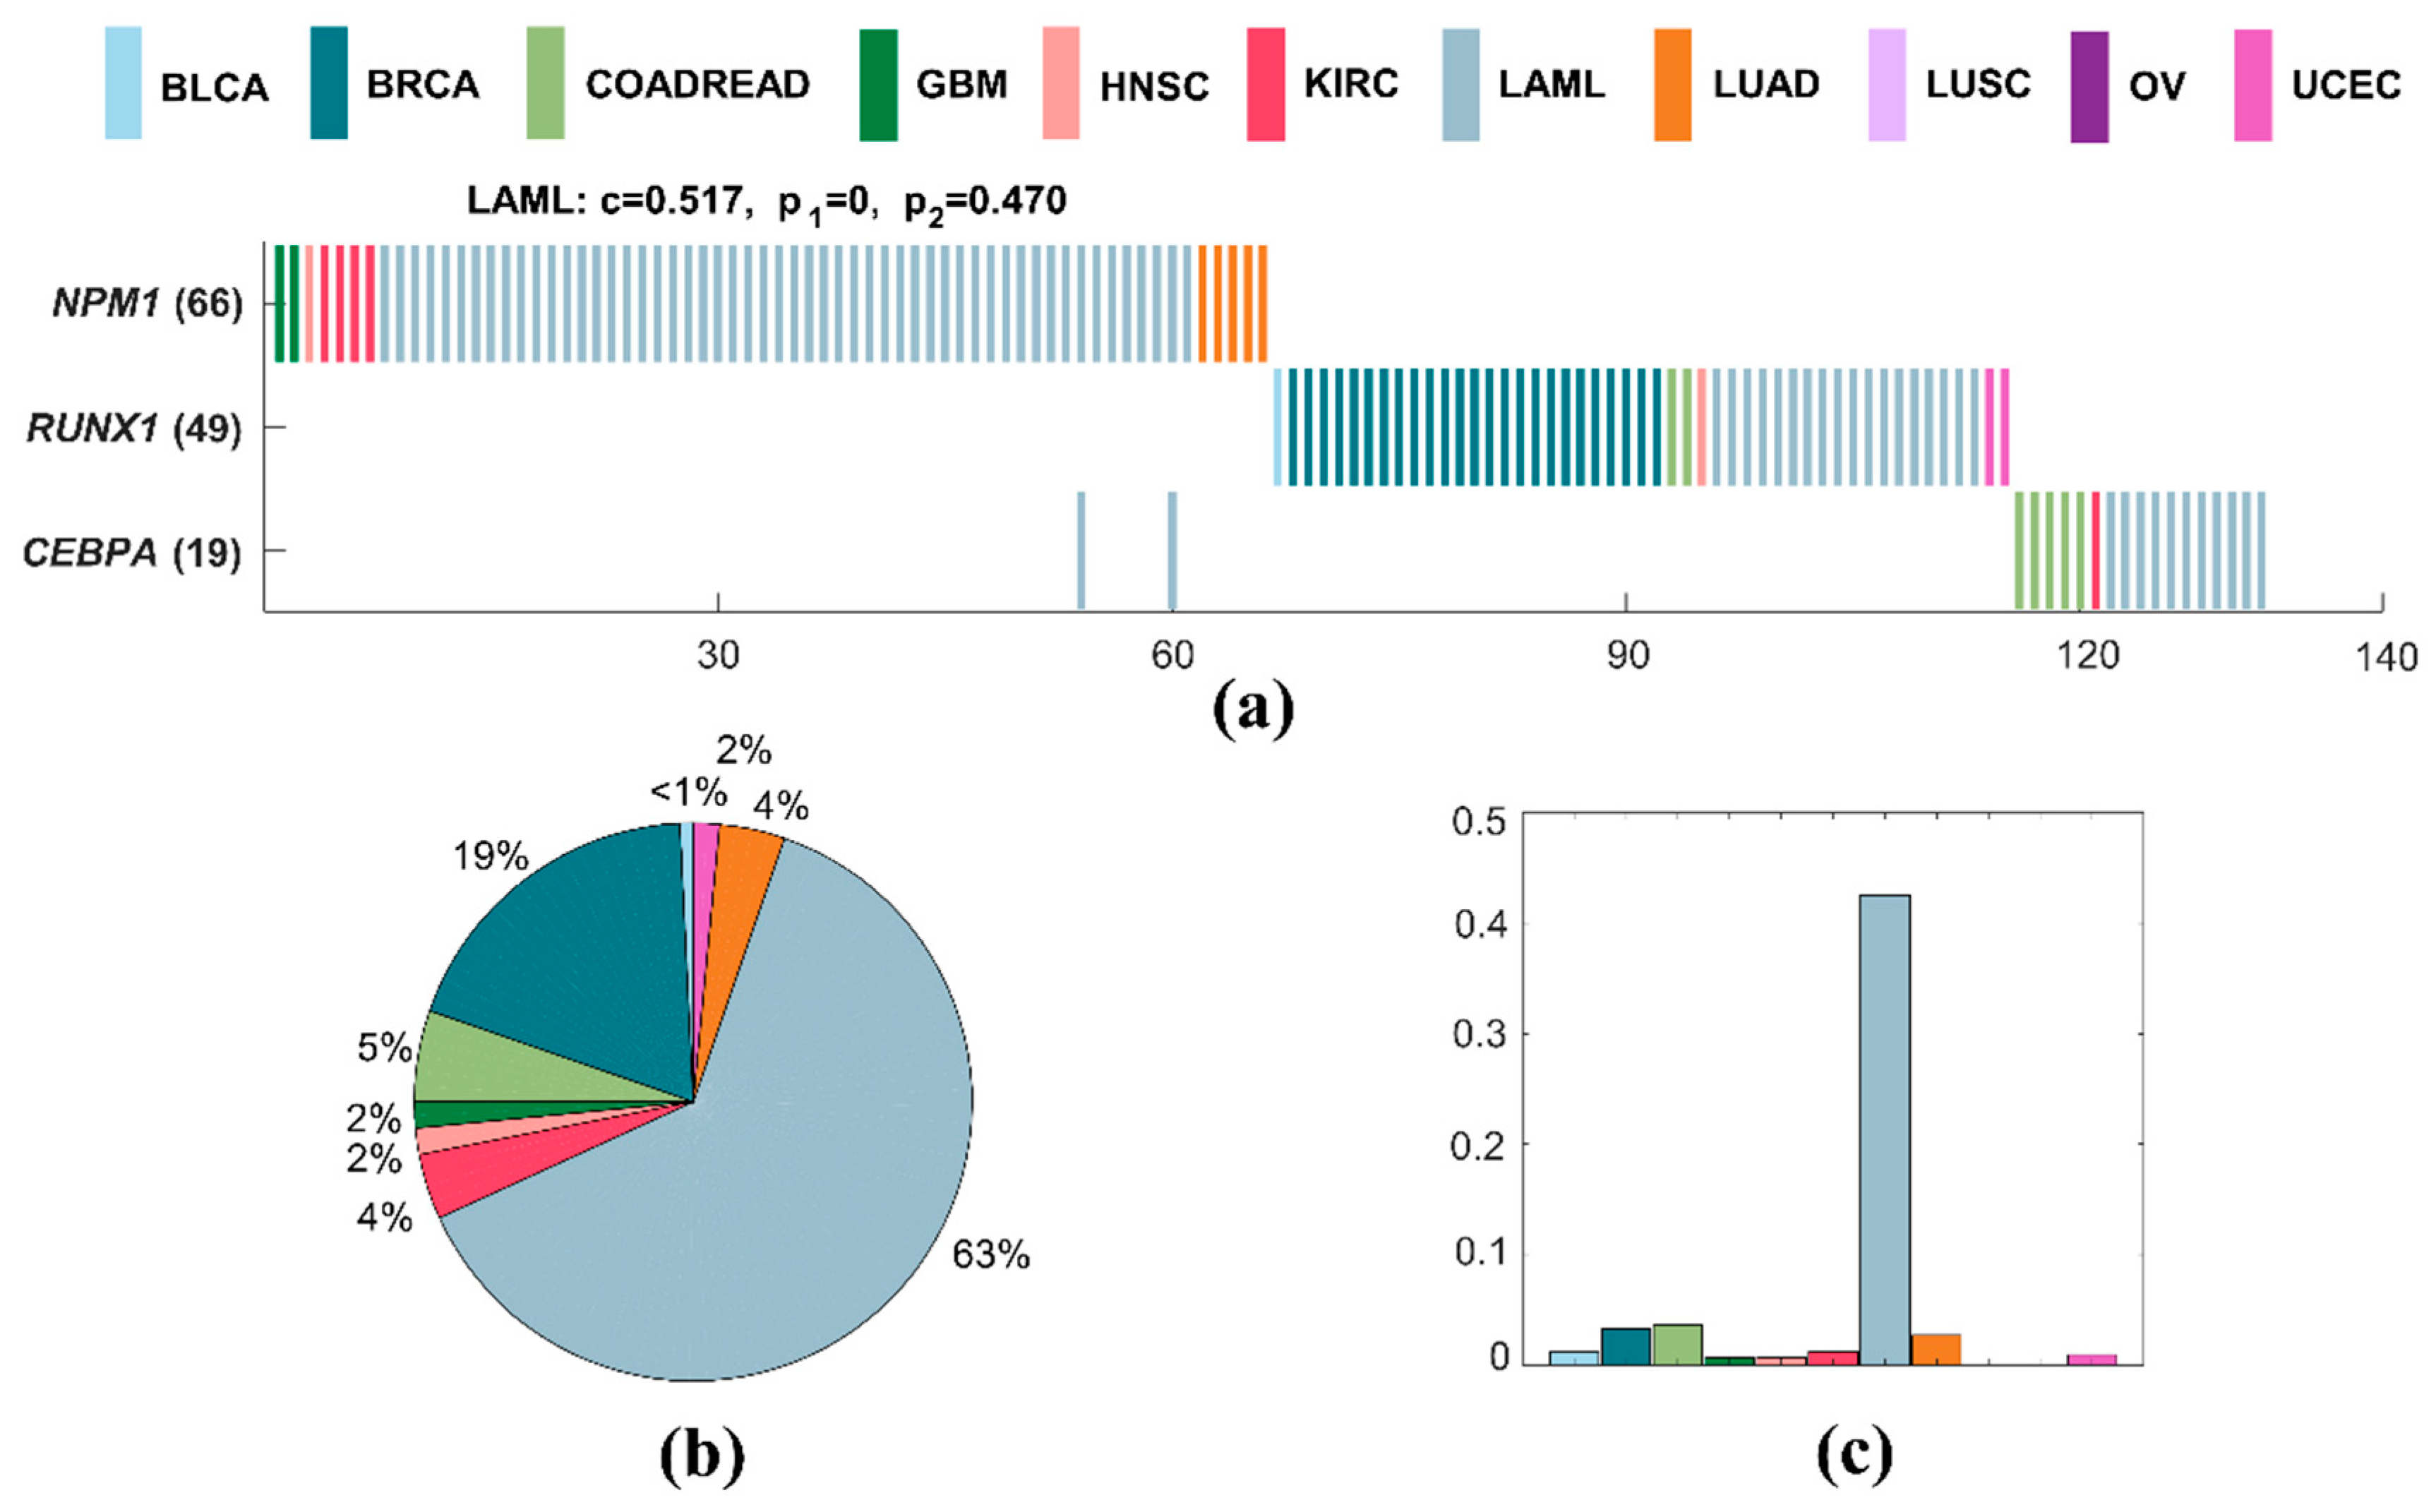
Figure 6.
Overview of CSDM. Firstly, we use the binary matrix to represent the mutation data. Then, we construct the specific network for a certain cancer type to other cancer types. At last, we use a greedy search to detect cancer specific driver modules for a certain cancer type.
Figure 6.
Overview of CSDM. Firstly, we use the binary matrix to represent the mutation data. Then, we construct the specific network for a certain cancer type to other cancer types. At last, we use a greedy search to detect cancer specific driver modules for a certain cancer type.

Table 1.
Enriched pathways for BRCA driver module (GATA3, ZNF703, CDH1, MAP3K1, FH, MAP2K4, LYZ, GFOD1, and CDKN1B) performed by MITHrIL using standard KEGG pathways. The pathways are sorted by p-value, and only the pathways with p-value < 0.01 are selected.
Table 1.
Enriched pathways for BRCA driver module (GATA3, ZNF703, CDH1, MAP3K1, FH, MAP2K4, LYZ, GFOD1, and CDKN1B) performed by MITHrIL using standard KEGG pathways. The pathways are sorted by p-value, and only the pathways with p-value < 0.01 are selected.
| Pathway | Impact Factor | p-Value |
|---|---|---|
| Pathways in cancer | 11.282 | 2.134 × 10⁻⁵ |
| Epithelial cell signaling in Helicobacter pylori infection | 4.468 | 8.044 × 10⁻⁴ |
| Hepatitis B | 13.121 | 8.987 × 10⁻⁴ |
| Epstein–Barr virus infection | 7.806 | 1.101 × 10⁻³ |
| HTLV-I infection | 6.945 | 1.259 × 10⁻³ |
| GnRH signaling pathway | 9.044 | 2.054 × 10⁻³ |
| ErbB signaling pathway | 9.222 | 2.631 × 10⁻³ |
| Small cell lung cancer | 4.925 | 2.803 × 10⁻³ |
| Neurotrophin signaling pathway | 4.139 | 7.703 × 10⁻³ |
Table 2.
Enriched pathways for BLCA driver module (RXRA, ELF3, CDKN1A, and RHOA) performed by MITHrIL using standard KEGG pathways. The pathways are sorted by p-value, and only the pathways with p-value < 0.01 are selected.
Table 2.
Enriched pathways for BLCA driver module (RXRA, ELF3, CDKN1A, and RHOA) performed by MITHrIL using standard KEGG pathways. The pathways are sorted by p-value, and only the pathways with p-value < 0.01 are selected.
| Pathway | Impact Factor | p-Value |
|---|---|---|
| Pathways in cancer | 16.834 | 4.09 × 10⁻⁸ |
| Melanoma | 14.011 | 5.52 × 10⁻⁴ |
| Glioma | 14.099 | 6.58 × 10⁻⁴ |
| Chronic myeloid leukemia | 13.983 | 6.62 × 10⁻⁴ |
| PI3K–Akt signaling pathway | 11.242 | 8.61 × 10⁻⁴ |
| HTLV-I infection | 12.696 | 1.36 × 10⁻³ |
| Proteoglycans in cancer | 10.732 | 3.48 × 10⁻³ |
| Hepatitis B | 10.318 | 4.63 × 10⁻³ |
| p53 signaling pathway | 11.093 | 7.50 × 10⁻³ |
| PPAR signaling pathway | 5.895 | 9.08 × 10⁻³ |
© 2018 by the authors. Licensee MDPI, Basel, Switzerland. This article is an open access article distributed under the terms and conditions of the Creative Commons Attribution (CC BY) license (http://creativecommons.org/licenses/by/4.0/).
Share and Cite
MDPI and ACS Style
Li, F.; Gao, L.; Wang, P.; Hu, Y. Identifying Cancer Specific Driver Modules Using a Network-Based Method. Molecules 2018, 23, 1114. https://doi.org/10.3390/molecules23051114
AMA Style
Li F, Gao L, Wang P, Hu Y. Identifying Cancer Specific Driver Modules Using a Network-Based Method. Molecules. 2018; 23(5):1114. https://doi.org/10.3390/molecules23051114
Chicago/Turabian StyleLi, Feng, Lin Gao, Peizhuo Wang, and Yuxuan Hu. 2018. "Identifying Cancer Specific Driver Modules Using a Network-Based Method" Molecules 23, no. 5: 1114. https://doi.org/10.3390/molecules23051114